430061 May 4, 2026 14:40 ICMarkets Market News
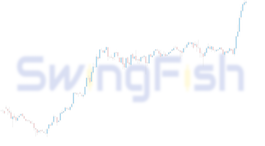
The Reserve Bank of Australia are set to update the market on their latest interest rate decision this week and the market is pricing in a good chance that we see another 25-basis point rate hike from them. Futures markets are pricing in the chance of a hike at around 80% which would take the Cash Rate up to 4.35% from 4.10% as the bank looks to combat sticky inflation – up to 4.6% y/y at the last print – that could get worse if the situation in the Middle East with regard to energy prices does not improve soon. The Australian jobs market is proving resilient in the face of the strong inflation numbers which has reinforced calls for a hike at this meeting.
The Aussie dollar is trading near multi-year highs just above the 72-cent level and a ‘hawkish hike’ from the RBA on Tuesday should see the currency appreciate further and push into fresh topside ranges for the medium term. However, a ‘dovish hike’ with little in the way of an indication of further hikes to follow or even no hike at all – which is still a 20-25% chance – would lead to some good selling of the pair and push it back into recent levels.
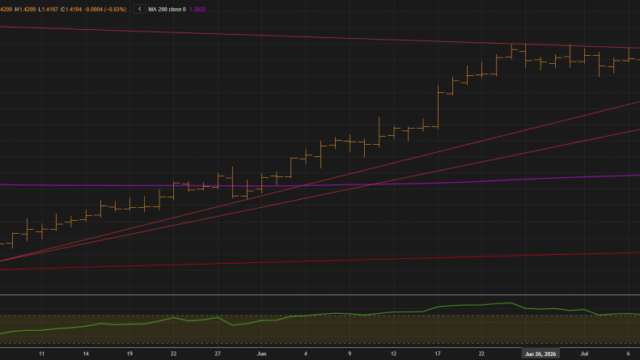
Short term resistance on the Daily Chart now comes in just above current levels while the June 2022 High just under 73-cents will be the next target, while initial downside support will come in around the 0.7100 level with stronger support around 0.6950.
Resistance 2: 0.7282 – June 2022 High
Resistance 1: 0.7227 – 2026 High and Trendline Resistance
Support 1: 0.7096 – Trendline Support
Support 2: 0.6943 – Long-Term Trendline Support

The accuracy, completeness and timeliness of the information contained on this site cannot be guaranteed. IC Markets Global does not warranty, guarantee or make any representations, or assume any liability regarding financial results based on the use of the information in the site.
News, views, opinions, recommendations and other information obtained from sources outside of www.icmarkets.com, used in this site are believed to be reliable, but we cannot guarantee their accuracy or completeness. All such information is subject to change at any time without notice. IC Markets Global assumes no responsibility for the content of any linked site.
The fact that such links may exist does not indicate approval or endorsement of any material contained on any linked site. IC Markets Global is not liable for any harm caused by the transmission, through accessing the services or information on this site, of a computer virus, or other computer code or programming device that might be used to access, delete, damage, disable, disrupt or otherwise impede in any manner, the operation of the site or of any user’s software, hardware, data or property.
The post Trade the AUDUSD on the Reserve Bank of Australia Interest Rate Decision first appeared on IC Your Trading Edge | Official Blog.
430057 May 4, 2026 11:00 ICMarkets Market News

The post Ex-Dividend 04/05/2026 first appeared on IC Your Trading Edge | Official Blog.
430055 May 4, 2026 11:00 ICMarkets Market News

The post Ex-Dividend 01/05/2026 first appeared on IC Your Trading Edge | Official Blog.
430009 April 30, 2026 14:40 ICMarkets Market News
Dear Client,
Please find our updated Trading schedule and general information related to the UK Early May Bank Holiday on Monday, 04 May, 2026.
Liquidity over the holidays is expected to be particularly thin so please take the necessary precaution to ensure that you are not affected by increased volatility, spreads and intermittent pricing.All times mentioned below are Platform time (GMT +3).

Kind Regards,
IC.
The post UK Early May Bank Holiday Trading Schedule 2026 first appeared on IC Your Trading Edge | Official Blog.
430005 April 30, 2026 14:40 ICMarkets Market News
Dear Client,
Please find our updated Trading schedule and general information related to the Labour Day Holiday on Friday, 01 May, 2026.
Liquidity over the holidays is expected to be particularly thin so please take the necessary precaution to ensure that you are not affected by increased volatility, spreads and intermittent pricing.
All times mentioned below are Platform time (GMT +3).
Indices:

Bonds Futures:

Equities:

Kind regards,
IC.
The post Labour Day Holiday Trading Schedule 2026 first appeared on IC Your Trading Edge | Official Blog.
430000 April 30, 2026 14:00 ICMarkets Market News
Dear Client,
Please find our updated Trading schedule and general information related to the Ascension Day on Thursday, 14 May, 2026.
Liquidity over the holidays is expected to be particularly thin so please take the necessary precaution to ensure that you are not affected by increased volatility, spreads and intermittent pricing.
All times mentioned below are Platform time (GMT +3).

Kind regards,
IC.
The post Ascension Day Holiday Trading Schedule – 2026 first appeared on IC Your Trading Edge | Official Blog.
429998 April 30, 2026 14:00 ICMarkets Market News
Dear Client,
Please find our updated Trading schedule and general information related to the Japan Golden Week Holiday starting from Monday, 4 May, 2026.
Liquidity over the holidays is expected to be particularly thin so please take the necessary precaution to ensure that you are not affected by increased volatility, spreads and intermittent pricing.
All times mentioned below are Platform time (GMT +3).

Kind regards,
IC.
The post Japan Golden Week Holiday Trading Schedule 2026 first appeared on IC Your Trading Edge | Official Blog.
429987 April 30, 2026 13:40 ICMarkets Market News
Dear Client,
Please find our updated Trading Schedule and general information related to Buddha’s Birthday, UK Spring Bank Holiday and US Memorial Day on Monday, 25 May 2026.
Liquidity over the holidays is expected to be particularly thin, so please take the necessary precautions to ensure that you are not affected by increased volatility, spreads and intermittent pricing.
All times mentioned below are Platform time (GMT +3).
Forex & Crypto Pairs:

Precious Metals:

Spot Energies:

Indices:


Metal Futures:

Energy Futures:

Soft Commodities:

Indices Futures:

Bonds Futures:

Equities:

Kind regards,
IC.
The post Buddha’s Birthday & UK Spring Bank Holiday & US Memorial Day Trading Schedule – 2026 first appeared on IC Your Trading Edge | Official Blog.
429985 April 30, 2026 13:40 ICMarkets Market News
Dear Client,
Please find our updated Trading schedule and general information related to the Victoria Day on Monday, 18 May, 2026.
Liquidity over the holidays is expected to be particularly thin so please take the necessary precaution to ensure that you are not affected by increased volatility, spreads and intermittent pricing.
All times mentioned below are Platform time (GMT +3).

Kind regards,
IC.
The post Victoria Day Holiday Trading Schedule 2026 first appeared on IC Your Trading Edge | Official Blog.
429962 April 29, 2026 19:40 ICMarkets Market News
FX traders are seeing a focus move over from geopolitical updates to central banks this week with no fewer than five major banks making rate calls and without a doubt the Federal Reserve will take centre stage. Despite the fact that the market has fully priced in a ‘no change’ call, traders are expecting to see some substantial moves on the back of the update when the final Jerome Powell led FOMC delivers its statement and he presides over his last press conference. The market has changed significantly since the conflict in the Middle East began and expectations of rate cuts have pulled back hard, odds of a 25-basis point cut by December now sitting at just 22% when previously the market was looking for cuts by mid-year. All eyes will be on exactly how far rate cut expectations have fallen in the Fed’s eyes’ relative to market pricing and that should see some big moves in the market with anything more hawkish likely to see yields and the dollar take off higher, whilst indications of cuts earlier in the year likely to lead to a sharp fall in the greenback.
USDJPY is trading again near annual highs on the Daily Chart despite a hawkish leaning from the Bank of Japan this week and anything more hawkish from the FOMC at the conclusion of their latest meeting could see the annual high at 160.46 come under threat. Shorter-term resistance at recent highs and the trendline around the 159.86 level will probably give bulls good stop loss entry levels for a move higher, whilst bears would look to leverage them if we do have a more dovish outlook from the committee. Support on the short-term trendline now comes in around the 158.50 level with stronger levels now sitting down just under 156.00.
Resistance 2: 160.46 – 2026 High and Trendline Resistance
Resistance 1: 159.86 – Trendline Resistance
Support 1: 158.49 – Trendline Support
Support 2: 157.57 – April Low

The accuracy, completeness and timeliness of the information contained on this site cannot be guaranteed. IC Markets Global does not warranty, guarantee or make any representations, or assume any liability regarding financial results based on the use of the information in the site.
News, views, opinions, recommendations and other information obtained from sources outside of www.icmarkets.com, used in this site are believed to be reliable, but we cannot guarantee their accuracy or completeness. All such information is subject to change at any time without notice. IC Markets Global assumes no responsibility for the content of any linked site.
The fact that such links may exist does not indicate approval or endorsement of any material contained on any linked site. IC Markets Global is not liable for any harm caused by the transmission, through accessing the services or information on this site, of a computer virus, or other computer code or programming device that might be used to access, delete, damage, disable, disrupt or otherwise impede in any manner, the operation of the site or of any user’s software, hardware, data or property.
The post Trade USDJPY on the FOMC Meeting first appeared on IC Your Trading Edge | Official Blog.
429958 April 29, 2026 16:40 ICMarkets Market News
IC Markets Global – Europe Fundamental Forecast | 29 April 2026
What happened in the Asia session?
Today’s Asia session saw mixed equities and softer oil prices, anchored by the UAE’s announcement to exit OPEC, which undermined OPEC’s perceived cohesion and triggered risk‑hedging in energy and related EM assets. At the same time, investors remained cautious over US–Iran‑linked geopolitics and AI‑sector concerns ahead of the Fed decision, tilting flows toward more defensive positioning and compressing risk‑on sentiment in tech‑heavy indices and commodity‑linked FX.
What does it mean for the Europe & US sessions?
Traders are closely monitoring the Federal Reserve’s policy announcement, which is widely expected to maintain interest rates at their current level of 3.50%–3.75%. This meeting carries additional significance as it is anticipated to be the final one chaired by Jerome Powell before his term concludes in May. Simultaneously, the equity markets are focused on a heavy slate of “Mag 7” earnings, with reports due today from Alphabet, Amazon, Meta Platforms, and Microsoft.
The Dollar Index (DXY)
Key news events today
Federal Funds Rate (6:00 pm GMT)
FOMC Statement (6:00 pm GMT)
FOMC Press Conference (6:30 pm GMT)
What can we expect from DXY today?
The U.S. Dollar Index (DXY) was trading at approximately 98.58, reflecting a slight decline of 0.04% for the session. The dominant market focus for the day has been the conclusion of the two-day Federal Open Market Committee (FOMC) meeting, with markets largely pricing in a 94% probability that the Federal Reserve will hold the federal funds rate at the 3.50%–3.75% range.
Central Bank Notes:
Next 24 Hours Bias
Weak Bearish
Gold (XAU)
Key news events today
Federal Funds Rate (6:00 pm GMT)
FOMC Statement (6:00 pm GMT)
FOMC Press Conference (6:30 pm GMT)
What can we expect from Gold today?
Gold is hovering just below $4,600 per ounce after a small dip from the previous session, with prices down about 0.26% to 4,584 USD/oz while remaining strongly higher versus a year ago. Escalating Middle East tensions and the prolonged closure of the Strait of Hormuz have driven oil‑linked inflation worries and raised expectations that major central banks may keep rates higher for longer, weighing on non‑yielding bullion even as it still attracts some safe‑haven flows.
Next 24 Hours Bias
Medium Bullish
The Euro (EUR)
Key news events today
German Prelim CPI m/m (All Day)
What can we expect from EUR today?
The euro is trading in a narrow band just below 1.18 versus the U.S. dollar, held back by a resilient greenback and safe‑haven demand, while the ECB sticks with a cautious, data‑dependent stance amid elevated energy prices and lukewarm Eurozone growth. Inflation data for March surprised slightly to the upside, reinforcing the ECB’s measured approach.
Central Bank Notes:
The next meeting is on 29 April 2026
Next 24 Hours Bias
Medium Bearish
The Swiss Franc (CHF)
Key news events today
No major news event
What can we expect from CHF today?
The Swiss franc is trading in a tight range, with USD/CHF hovering near 0.79 after a slight pullback from multi‑year lows last week, while the euro remains near record lows versus CHF above 0.92. The franc continues to draw underlying support from its safe‑haven appeal, subdued inflation, and the SNB’s readiness to intervene if appreciation becomes too disruptive, with analysts expecting the pair to gradually ease toward around 0.78 in the near term and 0.76 over the next year.
Central Bank Notes:
The next meeting is on 18 June 2026.
Next 24 Hours Bias
Weak Bearish
The Pound (GBP)
Key news events today
No major news event
What can we expect from GBP today?
The British pound remains range-bound against the US dollar near 1.35, with traders adopting a cautious stance ahead of the Federal Reserve’s interest rate decision expected to hold steady at 3.50-3.75% later today, followed by the BoE’s announcement tomorrow at 3.75%—a pivotal “triple central bank week” also involving the ECB that could trigger 1-2 cent swings in GBP/USD.
Central Bank Notes:
Next 24 Hours Bias
Medium Bearish
The Canadian Dollar (CAD)
Key news events today
BOC Monetary Policy Report (1:45 pm GMT)
BOC Rate Statement (1:45 pm GMT)
Overnight Rate (1:45 pm GMT)
BOC Press Conference (2:30 pm GMT)
What can we expect from CAD today?
The Canadian dollar holds near recent highs around 1.37 USD amid high oil prices from Middle East tensions and a hawkish BoC outlook, though it dipped slightly on April 28 to USD/CAD 1.3684 (+0.42%) as inflation hit 2.4% without prompting rate hike expectations the BoC is set to maintain 2.25% today, balancing energy shocks with softening core inflation and global USD strength, per forecasts eyeing further loonie gains to 1.35 USD in a year.
Central Bank Notes:
Next 24 Hours Bias
Medium Bearish
Oil
Key news events today
EIA Crude Oil Inventories (8:30 pm GMT)
What can we expect from Oil today?
WTI crude closed at $99.85 on April 28, up 3.61% for the seventh straight session, hitting highs not seen since early April despite the UAE move. Brent rose to $111.78 (June futures), up 0.47%, with analysts citing Hormuz constraints outweighing any potential output hikes. US inventories fell for a second week, with crude down 1.79 million barrels.
Next 24 Hours Bias
Medium Bullish
The post IC Markets Global – Europe Fundamental Forecast | 29 April 2026 first appeared on IC Your Trading Edge | Official Blog.
429940 April 29, 2026 16:00 ICMarkets Market News
Potential Direction: Bullish
Overall momentum of the chart: Bearish
The price has already bounced off the pivot and may continue its bullish move toward the 1st resistance
Pivot: 98.27
Supporting reasons: Identified as an overlap support, where renewed buying pressure could emerge to push the price higher.
1st support: 97.82
Supporting reasons: Identified as an overlap support, indicating a potential area where the price could again stabilize.
1st resistance: 99.32
Supporting reasons: Identified as an overlap resistance, indicating a potential area that could halt any further upward movement

Potential Direction: Bearish
Overall momentum of the chart: Bullish
The price has already reacted off the pivot and may continue its bearish move toward the 1st support.
Pivot: 1.1720
Supporting reasons: Identified as a pullback resistance that aligns with the 50% Fibonacci retracement, where selling pressures could intensify and potentially cap any upward retracement.
1st support: 1.1639
Supporting reasons: Identified as an overlap support, indicating a potential level where the price could stabilize once again.
1st resistance: 1.1851
Supporting reasons: Identified as an overlap resistance, indicating a potential level that could cap further upward movement.

Potential Direction: Bearish
Overall momentum of the chart: Bullish
The price has already reacted off the pivot and may continue its bearish move toward the 1st support.
Pivot: 187.10
Supporting reasons: Identified as an overlap resistance, where selling pressures could intensify and potentially cap any upward retracement.
1st support: 186.10
Supporting reasons: Identified as an overlap support that aligns with the 38.2% Fibonacci retracement, indicating a potential area where the price could again stabilize.
1st resistance: 187.88
Supporting reasons: Identified as a swing high resistance, indicating a potential level that could cap further upward movement.

Potential Direction: Bearish
Overall momentum of the chart: Bullish
The price could see a short-term pullback toward the pivot before continuing its bearish move down toward the 1st support.
Pivot: 0.8677
Supporting reasons: Identified as a pullback resistance that aligns with the 50% Fibonacci retracement, where selling pressures could intensify and potentially cap any upward retracement.
1st support: 0.8645
Supporting reasons: Identified as an overlap support, indicating a potential area where the price could stabilize once more.
1st resistance: 0.8721
Supporting reasons: Identified as a swing high resistance, indicating a potential level that could cap further upward movement.

Potential Direction: Bearish
Overall momentum of the chart: Bullish
The price has already reacted off the pivot and may continue its bearish move toward the 1st support.
Pivot:1.3554
Supporting reasons: Identified as a pullback resistance, where selling pressures could intensify and potentially cap any upward retracement.
1st support: 1.3460
Supporting reasons: Identified as a swing low support, indicating a potential area where the price could stabilize once more.
1st resistance: 1.3598
Supporting reasons: Identified as a pullback resistance, indicating a potential level that could halt further upward movement.

Potential Direction: Bullish
Overall momentum of the chart: Bullish
The price has already bounced off the pivot and may continue its bullish move toward the 1st resistance
Pivot: 215.01
Supporting reasons: Identified as an overlap support, where renewed buying pressure could emerge to push the price higher.
1st support: 213.30
Supporting reasons: Identified as a pullback support, indicating a potential level where the price could stabilize once more.
1st resistance: 217.09
Supporting reasons: Identified as a resistance that aligns with the 161.8% Fibonacci extension, indicating a potential level that could halt further upward movement.

Potential Direction: Bearish
Overall momentum of the chart: Bearish
The price has already reacted off the pivot and may continue its bearish move toward the 1st support.
Pivot: 0.7917
Supporting reasons: Identified as an overlap resistance, where selling pressures could intensify and potentially cap any upward retracement.
1st support: 0.7839
Supporting reasons: Identified as an overlap support, indicating a potential level where the price could stabilize once again.
1st resistance: 0.7013
Supporting reasons: Identified as a multi swing high resistance, indicating a potential level that could cap further upward movement.

Potential Direction: Bullish
Overall momentum of the chart: Bullish
The price has already bounced off the pivot and may continue its bullish move toward the 1st resistance
Pivot: 159.11
Supporting reasons: Identified as an overlap support, where renewed buying pressure could emerge to push the price higher.
1st support: 157.66
Supporting reasons: Identified as an overlap support, indicating a strong area where buyers might return, and the price could stabilize once again.
1st resistance: 160.44
Supporting reasons: Identified as a swing high resistance. This level represents the next key area where upward movement could be capped amid increased selling pressure

Potential Direction: Bullish
Overall momentum of the chart: Bullish
The price has already bounced off the pivot and may continue its bullish move toward the 1st resistance
Pivot: 1.3602
Supporting reasons: Identified as an overlap resistance, where selling pressures could intensify and potentially cap any upward retracement.
1st support: 1.3544
Supporting reasons: Identified as a swing low support, indicating a key level where the price could stabilize once more.
1st resistance: 1.3702
Supporting reasons: Identified as an overlap resistance, making it a possible target for bullish advances and a level where some sellers could return to cap gains

Potential Direction: Bullish
Overall momentum of the chart: Bullish
The price could see a short-term pullback toward the pivot before rising again toward the 1st resistance.
Pivot: 0.7089
Supporting reasons: Identified as a pullback support that aligns with the 38.2% Fibonacci retracement, where renewed buying pressure could emerge to push the price higher.
1st support: 0.6999
Supporting reasons: Identified as an overlap support that aligns with the 61.8% Fibonacci retracement,, this area has provided strong support historically and may attract buying interest for a potential short-term bounce
1st resistance: 0.7210
Supporting reasons: Identified as a swing high resistance, indicating a potential area that could halt any further upward movement.

Potential Direction: Bearish
Overall momentum of the chart: Bullish
The price has already reacted off the pivot and may continue its bearish move toward the 1st support.
Pivot: 0.5919
Supporting reasons: Identified as an overlap resistance, where selling pressures could intensify and potentially cap any upward retracement.
1st support: 0.5775
Supporting reasons: Identified as a pullback support, this area has provided strong support historically and may attract buying interest for a potential short-term bounce
1st resistance: 0.5957
Supporting reasons: Identified as an overlap resistance, indicating a potential area that could halt any further upward movement.

Potential Direction: Bullish
Overall momentum of the chart: Bullish
The price has already bounced off the pivot and may continue its bullish move toward the 1st resistance
Pivot: 48,869.55
Supporting reasons: Identified as an overlap support, where renewed buying pressure could emerge to push the price higher.
1st support: 48.222.47
Supporting reasons: Identified as a pullback support, suggesting a potential area where the price could stabilize once again.
1st resistance: 49,777.46
Supporting reasons: Identified as a swing high resistance, indicating a potential area that could halt any further upward movement.

Potential Direction: Bullish
Overall momentum of the chart: Bullish
The price has already bounced off the pivot and may continue its bullish move toward the 1st resistance
Pivot: 23,968.53
Supporting reasons: Identified as an overlap support, where renewed buying pressure could emerge to push the price higher.
1st support: 23,407.60
Supporting reasons: Identified as a pullback support, indicating a key level where the price could stabilize once more.
1st resistance: 24,717.71
Supporting reasons: Identified as an overlap resistance, indicating a potential area that could halt any further upward movement.

Potential Direction: Bullish
Overall momentum of the chart: Bullish
The price has already bounced off the pivot and may continue its bullish move toward the 1st resistance
Pivot: 7,131.75
Supporting reasons: Identified as an overlap support, where renewed buying pressure could emerge to push the price higher.
1st support: 7,039.33
Supporting reasons: Identified as an overlap support, indicating a potential level where the price could stabilize once again.
1st resistance: 7,241.47
Supporting reasons: Identified as a resistance that aligns with the 161.8% Fibonacci extension, indicating a potential area that could halt any further upward movement.

Potential Direction: Bearish
Overall momentum of the chart: Bearish
The price has already reacted off the pivot and may continue its bearish move toward the 1st support.
Pivot: 77,325.60
Supporting reasons: Identified as a pullback support, where renewed buying pressure could emerge to push the price higher.
1st support: 74,748.41
Supporting reasons: Identified as an overlap support, indicating a potential level where the price could stabilize once more.
1st resistance: 79,412.15
Supporting reasons: Identified as a swing high resistance, indicating a potential area that could halt any further upward movement.

Potential Direction: Bullish
Overall momentum of the chart: Bullish
The price has already bounced off the pivot and may continue its bullish move toward the 1st resistance
Pivot: 2,2257.95
Supporting reasons: Identified as an overlap support, where renewed buying pressure could emerge to push the price higher.
1st support: 2,169.68
Supporting reasons: Identified as an overlap support, indicating a potential level where the price could stabilize once more.
1st resistance: 2,423.81
Supporting reasons: Identified as a swing high resistance, indicating a potential area that could halt any further upward movement.

Potential Direction: Bullish
Overall momentum of the chart: Bullish
The price has already bounced off the pivot and may continue its bullish move toward the 1st resistance
Pivot: 94.78
Supporting reasons: Identified as a pullback support, where renewed buying pressure could emerge to push the price higher.
1st support: 84.86
Supporting reasons: Identified as an overlap support, indicating a key level where the price could stabilize once more.
1st resistance: 105.53
Supporting reasons: Identified as an overlap resistance, indicating a potential area that could halt any further upward movement.

Potential Direction: Bearish
Overall momentum of the chart: Bullish
The price could see a short-term pullback toward the pivot before continuing its bearish move down toward the 1st support.
Pivot: 4,622.65
Supporting reasons: Identified as a pullback resistance, where selling pressures could intensify and potentially cap any upward retracement.
1st support: 4,473.37
Supporting reasons: Identified as a pullback support, indicating a key level where the price could stabilize once more.
1st resistance: 4,696.75
Supporting reasons: Identified as an overlap resistance, indicating a potential area that could halt any further upward movement.

The accuracy, completeness and timeliness of the information contained on this site cannot be guaranteed. IC Markets Global does not warranty, guarantee or make any representations, or assume any liability regarding financial results based on the use of the information in the site.
News, views, opinions, recommendations and other information obtained from sources outside of www.icmarkets.com, used in this site are believed to be reliable, but we cannot guarantee their accuracy or completeness. All such information is subject to change at any time without notice. IC Markets Global assumes no responsibility for the content of any linked site.
The fact that such links may exist does not indicate approval or endorsement of any material contained on any linked site. IC Markets Global is not liable for any harm caused by the transmission, through accessing the services or information on this site, of a computer virus, or other computer code or programming device that might be used to access, delete, damage, disable, disrupt or otherwise impede in any manner, the operation of the site or of any user’s software, hardware, data or property.
The post Wednesday 29th April 2026: Technical Outlook and Review first appeared on IC Your Trading Edge | Official Blog.