430145 May 5, 2026 14:41 ICMarkets Market News
IC Markets Global – Europe Fundamental Forecast | 05 May 2026
What happened in the Asia session?
Heightening geopolitical tensions following reports of a US-Iran military confrontation, which significantly impacted market sentiment and key financial instruments. Investors reacted to the instability with a flight to safety, putting pressure on risk assets while bolstering safe-haven commodities and the US dollar. Major equity markets showed sensitivity to these developments as traders assessed the potential for further energy shocks and inflationary pressures emanating from the Middle East.
What does it mean for the Europe & US sessions?
traders should be alert to Middle‑East‑driven oil‑price volatility above 110 USD on Brent, which is reinforcing a risk‑off tilt into European and US open, while the main trading catalysts will be the final US ISM services and composite PMIs plus JOLTS figures; these data points will shape odds on the Fed’s path and, in turn, volatility in equities, the dollar, and inflation‑sensitive sectors across both sessions.
The Dollar Index (DXY)
Key news events today
ISM Services PMI (2:00 pm GMT)
JOLTS Job Openings (2:00 pm GMT)
New Home Sales (2:00 pm GMT)
New Home Sales (Feb Data)
What can we expect from DXY today?
The US dollar is consolidating with a slight uptick today, trading around 98.3–98.4 on the Dollar Index as safe‑haven demand and elevated oil prices support its value, even as month‑on‑month and year‑on‑year momentum remains mildly negative amid a cautious Fed and elevated geopolitical risk in the Strait of Hormuz.
Central Bank Notes:
Next 24 Hours Bias
Medium Bearish
Gold (XAU)
Key news events today
ISM Services PMI (2:00 pm GMT)
JOLTS Job Openings (2:00 pm GMT)
New Home Sales (2:00 pm GMT)
New Home Sales (Feb Data)
What can we expect from Gold today?
Gold traded lower, hovering around the mid‑$4,500s per ounce after a roughly 2% drop from Monday’s close, as markets price in continued “higher‑for‑longer” U.S. rates and elevated energy‑driven inflation. Despite this near‑term pullback, prices remain sharply higher year‑on‑year and are still supported by strong central‑bank demand and geopolitical risk, with several major banks maintaining multi‑thousand‑dollar price targets into late 2026.
Next 24 Hours Bias
Medium earish
The Euro (EUR)
Key news events today
ECB President Lagarde Speaks (12:30 pm GMT)
What can we expect from EUR today?
The Euro maintains mild gains near 1.1730 against the dollar, buoyed by the ECB’s recent decision to hold rates steady while signaling possible June hikes amid surging 3% inflation and oil-driven pressures from Middle East conflicts. Key data releases today on trade, retail sales, and PPI are poised to influence sentiment, as analysts forecast EUR/USD climbing to 1.18 quarterly on hawkish ECB expectations despite US trade tensions.
Central Bank Notes:
The next meeting is on 10 to 11 June 2026
Next 24 Hours Bias
Weak Bullish
The Swiss Franc (CHF)
Key news events today
CPI m/m (6:30 am GMT)
What can we expect from CHF today?
The Swiss Franc shows modest strength against the USD today, with the USD/CHF pair trading around 0.7840, up slightly by 0.21% amid ongoing safe-haven flows driven by US-Iran tensions in the Strait of Hormuz. No major Swiss economic data releases are scheduled for May 5, 2026, though the April Unemployment Rate (expected around the previous 3.0%) is due early at 03:00 AM US Eastern Time, potentially influencing sentiment if it deviates.
Central Bank Notes:
The next meeting is on 18 June 2026.
Next 24 Hours Bias
Strong Bullish
The Pound (GBP)
Key news events today
No major news event
What can we expect from GBP today?
The British Pound is trading around $1.3527 against the U.S. Dollar and approximately 1.1574 against the Euro. Following recent Bank of England (BoE) policy announcements, the currency has maintained a firm position, having successfully cleared the 1.35 resistance level on the back of favorable central bank differentials. Market sentiment currently reflects optimism regarding the Pound’s relative strength.
Central Bank Notes:
Next 24 Hours Bias
Medium Bullish
The Canadian Dollar (CAD)
Key news events today
No major news event
What can we expect from CAD today?
The Canadian dollar is edging slightly lower on Tuesday, as the US dollar regains some ground on geopolitical concerns and safe‑haven flows, even though strong oil prices continue to support the loonie. The currency is trading in a narrow band around mid‑1.35 on USD/CAD after four consecutive weekly gains, with markets awaiting Canadian labour data and Bank of Canada guidance to clarify whether the CAD can extend its recovery or remain range‑bound amid elevated Middle East risks and stable‑to‑hawkish US rate expectations.
Central Bank Notes:
Next 24 Hours Bias
Weak Bullish
Oil
Key news events today
API Crude Oil Stock ( 8:30 pm GMT)
What can we expect from Oil today?
Global oil markets are experiencing significant upward pressure today as regional security threats in the Middle East escalate, specifically concerning the safety of energy infrastructure and shipping routes. While production quotas have been increased by OPEC+, the market remains reactive to news of military strikes and trade disputes between major world powers. Investors are closely monitoring the potential for supply disruptions as the Strait of Hormuz continues to be a focal point of global energy security concerns.
Next 24 Hours Bias
Strong Bullish
The post IC Markets Global – Europe Fundamental Forecast | 05 May 2026 first appeared on IC Your Trading Edge | Official Blog.
430126 May 5, 2026 14:00 ICMarkets Market News
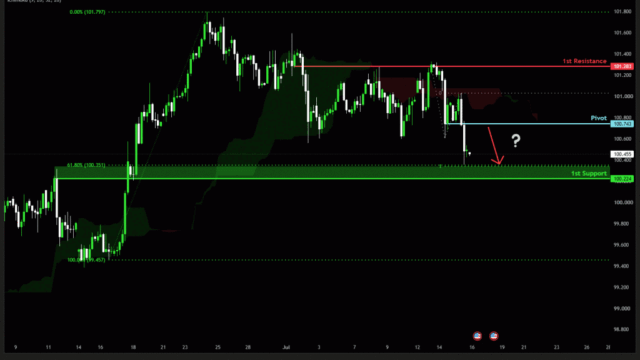
Potential Direction: Bullish
Overall momentum of the chart: Bearish
The price could see a short-term pullback toward the pivot before rising again toward the 1st resistance.
Pivot: 98.27
Supporting reasons: Identified as an overlap support, where renewed buying pressure could emerge to push the price higher.
1st support: 97.63
Supporting reasons: Identified as a swing low support, indicating a potential area where the price could again stabilize.
1st resistance: 99.32
Supporting reasons: Identified as an overlap resistance, indicating a potential area that could halt any further upward movement

Potential Direction: Bearish
Overall momentum of the chart: Bullish
The price could see a short-term pullback toward the pivot before continuing its bearish move down toward the 1st support
Pivot: 1.1718
Supporting reasons: Identified as a pullback resistance, where selling pressures could intensify and potentially cap any upward retracement.
1st support: 1.1628
Supporting reasons: Identified as a pullback support that aligns with the 61.8% Fibonacci retracement, indicating a potential level where the price could stabilize once again.
1st resistance: 1.1771
Supporting reasons: Identified as an overlap resistance, indicating a potential level that could cap further upward movement.

Potential Direction: Bearish
Overall momentum of the chart: Bullish
The price could see a short-term pullback toward the pivot before continuing its bearish move down toward the 1st support
Pivot: 184.76
Supporting reasons: Identified as an overlap resistance that aligns with the 50% Fibonacci retracement, where selling pressures could intensify and potentially cap any upward retracement.
1st support: 182.74
Supporting reasons: Identified as an overlap support, indicating a potential area where the price could again stabilize.
1st resistance: 186.23
Supporting reasons: Identified as a swing high resistance that aligns with the 78.6% Fibonacci retracement, indicating a potential level that could cap further upward movement.

Potential Direction: Bearish
Overall momentum of the chart: Bullish
The price could see a short-term pullback toward the pivot before continuing its bearish move down toward the 1st support.
Pivot: 0.8653
Supporting reasons: Identified as a pullback resistance that aligns with the 61.8% Fibonacci retracement, where selling pressures could intensify and potentially cap any upward retracement.
1st support: 0.8617
Supporting reasons: Identified as an overlap support, indicating a potential area where the price could stabilize once more.
1st resistance: 0.8676
Supporting reasons: Identified as an overlap resistance, indicating a potential level that could cap further upward movement.

Potential Direction: Bearish
Overall momentum of the chart: Bullish
The price could see a short-term pullback toward the pivot before continuing its bearish move down toward the 1st support.
Pivot:1.3555
Supporting reasons: Identified as a pullback resistance, where selling pressures could intensify and potentially cap any upward retracement.
1st support: 1.3390
Supporting reasons: Identified as a swing low support that aligns with the 127.2% Fibonacci projection, indicating a potential area where the price could stabilize once more.
1st resistance: 1.3657
Supporting reasons: Identified as a swing high resistance, indicating a potential level that could halt further upward movement.

Potential Direction: Bearish
Overall momentum of the chart: Bullish
The price could see a short-term pullback toward the pivot before continuing its bearish move down toward the 1st support.
Pivot: 214.04
Supporting reasons: Identified as an overlap resistance, where selling pressures could intensify and potentially cap any upward retracement.
1st support: 211.43
Supporting reasons: Identified as an overlap support, indicating a potential level where the price could stabilize once more.
1st resistance: 214.90
Supporting reasons: Identified as a pullback resistance, indicating a potential level that could halt further upward movement.

Potential Direction: Bearish
Overall momentum of the chart: Bearish
The price could see a short-term pullback toward the pivot before continuing its bearish move down toward the 1st support.
Pivot: 0.7869
Supporting reasons: Identified as a pullback resistance that aligns with the 61.8% Fibonacci retracement, where selling pressures could intensify and potentially cap any upward retracement.
1st support: 0.7775
Supporting reasons: Identified as a swing low support, indicating a potential level where the price could stabilize once again.
1st resistance: 0.7917
Supporting reasons: Identified as an overlap resistance, indicating a potential level that could cap further upward movement.

Potential Direction: Bearish
Overall momentum of the chart: Bullish
The price could see a short-term pullback toward the pivot before continuing its bearish move down toward the 1st support.
Pivot: 157.73
Supporting reasons: Identified as a pullback resistance that aligns with the 38.2% Fibonacci retracement, where selling pressures could intensify and potentially cap any upward retracement.
1st support: 155.63
Supporting reasons: Identified as a swing low support, indicating a strong area where buyers might return, and the price could stabilize once again.
1st resistance: 159.04
Supporting reasons: Identified as a resistance that aligns with the 61.8% Fibonacci retracement. This level represents the next key area where upward movement could be capped amid increased selling pressure

Potential Direction: Bearish
Overall momentum of the chart: Bullish
The price could see a short-term pullback toward the pivot before continuing its bearish move down toward the 1st support
Pivot: 1.3641
Supporting reasons: Identified as a pullback resistance, where selling pressures could intensify and potentially cap any upward retracement.
1st support: 1.3550
Supporting reasons: Identified as a swing low support, indicating a key level where the price could stabilize once more.
1st resistance: 1.3704
Supporting reasons: Identified as a pullback resistance, making it a possible target for bullish advances and a level where some sellers could return to cap gains

Potential Direction: Bearish
Overall momentum of the chart: Bullish
The price could see a short-term bearish breakout at the pivot and continue its bearish move down toward the 1st support
Pivot: 0.7150
Supporting reasons: Identified as a pullback resistance, where selling pressures could intensify and potentially cap any upward retracement.
1st support: 07090
Supporting reasons: Identified as a pullback support that aligns with the 38.2% Fibonacci retracement, this area has provided strong support historically and may attract buying interest for a potential short-term bounce
1st resistance: 0.7210
Supporting reasons: Identified as a swing high resistance, indicating a potential area that could halt any further upward movement.

Potential Direction: Bearish
Overall momentum of the chart: Bullish
The price could see a short-term pullback toward the pivot before continuing its bearish move down toward the 1st support
Pivot: 0.5888
Supporting reasons: Identified as a pullback resistance, where selling pressures could intensify and potentially cap any upward retracement.
1st support: 0.5829
Supporting reasons: Identified as a swing low support, this area has provided strong support historically and may attract buying interest for a potential short-term bounce
1st resistance: 0.5920
Supporting reasons: Identified as a multi-swing high resistance, indicating a potential area that could halt any further upward movement.

Potential Direction: Bearish
Overall momentum of the chart: Bullish
The price could see a short-term pullback toward the pivot before continuing its bearish move down toward the 1st support
Pivot: 49,115.00
Supporting reasons: Identified as a pullback resistance, where selling pressures could intensify and potentially cap any upward retracement.
1st support: 48,326.60
Supporting reasons: Identified as an overlap support, suggesting a potential area where the price could stabilize once again.
1st resistance: 49,846.10
Supporting reasons: Identified as a swing high resistance, indicating a potential area that could halt any further upward movement.

Potential Direction: Bearish
Overall momentum of the chart: Bullish
The price could see a short-term pullback toward the pivot before continuing its bearish move down toward the 1st support
Pivot: 23,884.20
Supporting reasons: Identified as a pullback resistance, where selling pressures could intensify and potentially cap any upward retracement.
1st support: 23,407.60
Supporting reasons: Identified as a pullback support, indicating a key level where the price could stabilize once more.
1st resistance: 24,652.98
Supporting reasons: Identified as an overlap resistance, indicating a potential area that could halt any further upward movement.

Potential Direction: Bullish
Overall momentum of the chart: Bullish
The price has already bounced off the pivot and may continue its bullish move toward the 1st resistance
Pivot: 7,179.02
Supporting reasons: Identified as an overlap support, where renewed buying pressure could emerge to push the price higher.
1st support: 7,134.48
Supporting reasons: Identified as an overlap support, indicating a potential level where the price could stabilize once again.
1st resistance: 7,265.54
Supporting reasons: Identified as a swing high resistance, indicating a potential area that could halt any further upward movement.

Potential Direction: Bearish
Overall momentum of the chart: Bearish
The price has already reacted off the pivot and may continue its bearish move toward the 1st support.
Pivot: 78,373.36
Supporting reasons: Identified as an overlap support, where renewed buying pressure could emerge to push the price higher.
1st support: 76,441.70
Supporting reasons: Identified as a pullback support, indicating a potential level where the price could stabilize once more.
1st resistance: 81,027.829
Supporting reasons: Identified as an overlap resistance that aligns with the 127.2% Fibonacci extension, indicating a potential area that could halt any further upward movement.

Potential Direction: Bullish
Overall momentum of the chart: Bullish
The price has already bounced off the pivot and may continue its bullish move toward the 1st resistance
Pivot: 2,325.37
Supporting reasons: Identified as an overlap support, where renewed buying pressure could emerge to push the price higher.
1st support: 2,266.96
Supporting reasons: Identified as an overlap support, indicating a potential level where the price could stabilize once more.
1st resistance: 2,449.22
Supporting reasons: Identified as a swing high resistance, indicating a potential area that could halt any further upward movement.

Potential Direction: Bullish
Overall momentum of the chart: Bullish
The price could see a short-term pullback toward the pivot before rising again toward the 1st resistance.
Pivot: 104.68
Supporting reasons: Identified as a pullback support, where renewed buying pressure could emerge to push the price higher.
1st support: 99.95
Supporting reasons: Identified as an overlap support, indicating a key level where the price could stabilize once more.
1st resistance: 116.36
Supporting reasons: Identified as a swing high resistance, indicating a potential area that could halt any further upward movement.

Potential Direction: Bearish
Overall momentum of the chart: Bullish
The price could see a short-term pullback toward the pivot before continuing its bearish move down toward the 1st support.
Pivot: 4,573.55
Supporting reasons: Identified as a pullback resistance, where selling pressures could intensify and potentially cap any upward retracement.
1st support: 4,473.37
Supporting reasons: Identified as a pullback support, indicating a key level where the price could stabilize once more.
1st resistance: 4,624.58
Supporting reasons: Identified as an overlap resistance, indicating a potential area that could halt any further upward movement.

The accuracy, completeness and timeliness of the information contained on this site cannot be guaranteed. IC Markets Global does not warranty, guarantee or make any representations, or assume any liability regarding financial results based on the use of the information in the site.
News, views, opinions, recommendations and other information obtained from sources outside of www.icmarkets.com, used in this site are believed to be reliable, but we cannot guarantee their accuracy or completeness. All such information is subject to change at any time without notice. IC Markets Global assumes no responsibility for the content of any linked site.
The fact that such links may exist does not indicate approval or endorsement of any material contained on any linked site. IC Markets Global is not liable for any harm caused by the transmission, through accessing the services or information on this site, of a computer virus, or other computer code or programming device that might be used to access, delete, damage, disable, disrupt or otherwise impede in any manner, the operation of the site or of any user’s software, hardware, data or property.
The post Tuesday 5th May 2026: Technical Outlook and Review first appeared on IC Your Trading Edge | Official Blog.
430125 May 5, 2026 14:00 ICMarkets Market News
Asian stocks declined Tuesday as oil prices eased slightly but remained above $100 a barrel, with markets unsettled by ongoing tensions between the United States and Iran over the Strait of Hormuz. Investors cautiously monitored developments as both nations pursued diplomatic signals while continuing military actions in the region.
MSCI’s Asia-Pacific index excluding Japan slipped 0.3%, while Australian shares fell 0.4% in thin trading. Markets in Japan and South Korea were closed for holidays. U.S. futures also edged lower, with Nasdaq and S&P 500 futures down 0.1%, while European futures followed a similar softer trend.
Renewed conflict in the Gulf heightened concerns about supply disruptions, even as efforts to escort stranded vessels through the strategic waterway continued. Shipping firm Maersk confirmed one of its vessels safely exited the Gulf under military protection. However, analysts noted that the broader geopolitical stalemate remains unresolved, keeping markets volatile.
Oil prices pulled back after earlier gains, with Brent crude at $113.85 and U.S. crude at $105.03. Meanwhile, investors turned attention to upcoming earnings, with strong results so far supporting sentiment. A majority of S&P 500 companies have exceeded expectations, driven largely by continued AI-related spending.
Currency markets remained cautious, with the yen steady after recent volatility and intervention concerns. The U.S. dollar strengthened on safe-haven demand, while gold edged slightly higher.
The post Tuesday 5th May 2026: Asia Stocks Slip as Oil Holds Above $100 Amid U.S.-Iran Tensions first appeared on IC Your Trading Edge | Official Blog.
430121 May 5, 2026 13:40 ICMarkets Market News
Global Risk Sentiment Falls as Middle East Tensions Escalate – Dow down 1.13%
US markets traded lower in the latest session as rising geopolitical tensions in the Middle East weighed heavily on investor sentiment. Reports of renewed hostilities, including Iranian claims of a missile strike on a US warship in the Strait of Hormuz and a drone attack on a UAE terminal, drove a clear risk-off tone across asset classes. Equities finished in negative territory, with the Dow Jones leading the declines, falling 1.13% to 48,941. The S&P 500 also moved lower, easing 0.41% to 7,200, while the Nasdaq showed relative resilience, slipping just 0.19% to close at 25,067. In fixed income markets, US Treasury yields spiked higher as investors adjusted to the heightened uncertainty and inflation risks tied to surging energy prices. The 2-year yield rose 7.5 basis points to 3.952%, while the benchmark 10-year yield climbed 6.8 basis points to 4.438%. Currency markets saw the US dollar strengthen, with the dollar index gaining 0.31% to 98.46. However, the Japanese yen remained a key focus, with traders again flagging suspected intervention activity amid heightened volatility. Commodities reacted sharply to the geopolitical developments, with oil prices surging on fears of supply disruptions through key shipping routes. Brent crude jumped 5.30% to $113.90, while WTI crude rose 3.11% to $105.11. In contrast, gold moved lower despite the risk-off backdrop, falling 2.02% to $4,520.39 as the stronger dollar and rising yields weighed on the precious metal.
Middle East Finely Balanced for Markets
Updates during yesterday’s trading sessions from the Middle East have investors on tenterhooks as the possibility of a return to full-out war looms. Oil prices pushed higher and stocks came under pressure; however, we have not yet seen the huge moves that could come if full hostilities are resumed in the Middle East. Traders will again be watching newswires closely in the coming sessions, and if we see further strikes from Iran against its neighbours, followed by the inevitable retaliation from US troops, then oil prices could rally strongly through recent highs, taking risk sentiment and inflationary concerns with them. Some investors are hoping that negotiations are taking place in the background that could see a reopening of the Strait of Hormuz, hostilities end, and recent risk rallies resume. However, if yesterday’s actions – and claims – are anything to go by, that doesn’t look likely in the short term, so prepare for more volatile markets ahead.
Volatile Day Ahead with Macro and Geopolitics Set to Hit Markets
Looking ahead, markets are bracing for another volatile session, with geopolitical headlines expected to remain the primary driver of sentiment. The Asian session will see attention turn to the Reserve Bank of Australia, which is widely expected to deliver another rate hike during the Asian session, alongside its subsequent press conference, which could add further fuel to the flames if it comes in with a ‘hawkish’ hike in the face of inflationary pressures. There is little of note on the calendar in the European session; however, later in the day we have several key US data releases scheduled. The jobs numbers for the week kick off with the JOLTS Job Openings (exp 6.87mio) data, but also released at the same time we have the ISM Services PMI (exp 53.8) and New Home Sales (exp 668k) figures, which will provide further insight into the strength of the US economy. However, given the sensitive nature of the situation in the Middle East, expect updates there to dominate sentiment in the short term.
The post General Market Analysis – 05/05/26 first appeared on IC Your Trading Edge | Official Blog.
430120 May 5, 2026 13:40 ICMarkets Market News
IC Markets Global – Asia Fundamental Forecast | 05 May 2026
What happened in the U.S. session?
U.S. markets grappled with Middle East tensions driving oil prices higher (WTI ~$94-105/bbl) and Treasury yields up (10-year at 4.40%), alongside data like stronger-than-expected March Factory Orders and the Fed’s SLOOS signaling potential credit conditions; Barclays’ no-Fed-cuts 2026 call amid Iran war inflation risks bolstered the USD against majors, while stocks wavered with S&P/Nasdaq near records but Dow sagging on geopolitical oil shocks and yield pressure.
What does it mean for the Asia Session?
Asian traders should concentrate on oil‑driven volatility linked to US–Iran developments around the Strait of Hormuz, renewed yen‑intervention risk around USD/JPY near 160, and AI‑led equity strength in Japan, South Korea, and Taiwan; any fresh headlines on Middle‑East truces, coordinated FX defence, or megacap tech earnings will likely magnify intraday swings in energy, FX, and regional tech‑heavy indices.
The Dollar Index (DXY)
Key news events today
ISM Services PMI (2:00 pm GMT)
JOLTS Job Openings (2:00 pm GMT)
New Home Sales (2:00 pm GMT)
New Home Sales (Feb Data)
What can we expect from DXY today?
The US dollar is trading modestly lower today in thin markets due to the Golden Week holiday, hovering near 98.1–98.3 on the DXY after recovering from April’s weakness. The main focus is the Reserve Bank of Australia’s rate decision (expected to hike 25bps to 4.35%), which could strengthen the Australian dollar near its four-year high against the greenback.
Central Bank Notes:
Next 24 Hours Bias
Medium Bearish
Gold (XAU)
Key news events today
No major news event
What can we expect from Gold today?
Gold is edging lower in early‑May 2026 trading, with spot prices hovering in the low‑4,600s USD per ounce and intraday moves confined to a narrow band around 4,580–4,630 USD, reflecting mild dollar strength and cautious positioning rather than a fundamental reversal. Despite this short‑term softness, the broader macro backdrop, ongoing geopolitical tensions, elevated fiscal deficits, and expectations of eventually looser monetary policy.
Next 24 Hours Bias
Medium Bearish
The Australian Dollar (AUD)
Key news events today
Cash Rate (4:30 am GMT)
RBA Monetary Policy Statement (4:30 am GMT)
RBA Rate Statement (4:30 am GMT)
RBA Press Conference (5:30 am GMT)
What can we expect from AUD today?
The Australian dollar is trading near multi‑year highs versus the US dollar on Tuesday, 5th May 2026, as markets brace for a widely expected 25 bps RBA rate hike that would lift the cash rate to around 4.35% and extend the cycle of tightening amid persistent inflation and robust domestic conditions.
Central Bank Notes:
Next 24 Hours Bias
Medium Bullish
The Kiwi Dollar (NZD)
Key news events today
Employment Change q/q (10:45 pm GMT)
Unemployment Rate (10:45 pm GMT)
What can we expect from NZD today?
The New Zealand Dollar on 5 May 2026 is consolidating after a recent rally, supported by tightening‑bias RBNZ expectations and a weaker US dollar, but capped by still‑modest domestic rate‑hike odds and persistent global risk swings, leaving the Kiwi in a narrow, range‑bound mode around the 0.583–0.5900 zone.
Central Bank Notes:
Next 24 Hours Bias
Medium Bearish
The Japanese Yen (JPY)
Key news events today
No major news event
What can we expect from JPY today?
The Japanese Yen showed limited activity amid Japan’s Golden Week holiday, with thin liquidity leading to volatile but contained movements in Asian trading sessions. The USD/JPY pair briefly strengthened as much as 0.8% to ¥155.72 before retracing, following last week’s suspected intervention where authorities reportedly spent around ¥5.4 trillion ($34.5 billion) to support the yen after it weakened past ¥160.
Central Bank Notes:
Next 24 Hours Bias
Medium Bearish
Oil
Key news events today
API Crude Oil Stock ( 8:30 pm GMT)
What can we expect from Oil today?
Oil markets remain volatile with WTI around $102-105/bbl and Brent at $113+, driven by US-Iran clashes in the Strait of Hormuz, including denied missile strikes on US vessels, Iranian shipping rules, and UAE port attacks disrupting nearly 20% of global supply while Trump launches ship escorts and OPEC+ modestly boosts output amid the UAE’s cartel exit.
Next 24 Hours Bias
Strong Bullish
The post IC Markets Global – Asia Fundamental Forecast | 05 May 2026 first appeared on IC Your Trading Edge | Official Blog.
430100 May 4, 2026 17:00 ICMarkets Market News

The post Ex-Dividend 05/05/2026 first appeared on IC Your Trading Edge | Official Blog.
430098 May 4, 2026 16:40 ICMarkets Market News
South Korean stocks climbed to a fresh record on Monday, extending April’s strong gains, as investors assessed ongoing tensions between Iran and the United States alongside Washington’s plan to reopen shipping routes in the Strait of Hormuz.
U.S. President Donald Trump announced that efforts would begin to “free” ships stranded since the escalation of the Iran conflict. The initiative, named “Project Freedom,” is scheduled to start Monday (Middle East time) and will primarily focus on enabling civilian vessels from non-aligned countries to safely exit the contested waterway and resume normal operations.
According to U.S. Central Command, the mission will involve significant military support, including guided-missile destroyers, more than 100 aircraft across land and sea, advanced unmanned systems, and approximately 15,000 service personnel.
Oil prices edged lower following the announcement. West Texas Intermediate crude for July delivery slipped 0.26% to $101.68 per barrel, while Brent crude futures declined 0.13% to $108.03.
In equity markets, South Korea’s Kospi surged 4.26%, while Hong Kong’s Hang Seng index rose 1.8%. Australia’s S&P/ASX 200, however, fell 0.28%. Markets in Japan and China remained closed due to public holidays.
Meanwhile, U.S. stock futures were largely unchanged Sunday night. On Friday, the S&P 500 and Nasdaq Composite both reached record highs, while the Dow Jones Industrial Average posted a modest decline.
The post Monday 4th May 2026: Asian Markets Rally as South Korea Hits Record High Amid U.S. “Project Freedom” Initiative first appeared on IC Your Trading Edge | Official Blog.
430097 May 4, 2026 16:40 ICMarkets Market News
IC Markets Global – Europe Fundamental Forecast | 04 May 2026
What happened in the Asia session?
Asian markets saw mild gains with stocks edging higher, oil prices holding steady, and the yen stabilizing amid ongoing Middle East tensions and anticipation for upcoming data like the RBA policy and China services PMI. No major macroeconomic releases occurred precisely on May 4, but focus lingered on recent China manufacturing PMI expansion to 52.2 in April and scheduled indicators such as Hong Kong GDP, Indonesia GDP, and Korea CPI later in the week.
What does it mean for the Europe & US sessions?
Financial markets are reacting to ongoing tensions in the Middle East and concerns over their impact on global trade and commodity prices. Oil prices are experiencing choppy trading as investors monitor plans for securing vessels caught in the regional conflict. Additionally, market participants are processing corporate developments, including earnings reports and concerns surrounding potential “psychological contagion” in private credit markets as flagged by Federal Reserve officials.
The Dollar Index (DXY)
Key news events today
No major news event
What can we expect from DXY today?
The US Dollar exhibited stability with the DXY unchanged at 98.16, navigating a light economic calendar featuring consumer credit data, Fed currency valuations, and Treasury auctions amid ongoing Middle East tensions and post-FOMC Fed speak; recent yen interventions and Q1 GDP rebound at 2% provided context for range-bound trading near 98, with forecasts eyeing a dip to 97.83 by quarter-end as rate cut bets build.
Central Bank Notes:
Next 24 Hours Bias
Medium Bearish
Gold (XAU)
Key news events today
No major news event
What can we expect from Gold today?
Gold is softer to start Monday, May 4, 2026, with the main theme being inflation worries and a cautious market waiting on U.S.-Iran peace-talk developments. Reuters said gold nudged lower as inflation concerns clouded the U.S. policy outlook, while spot-price coverage showed gold struggling around the $4,600 area, with short-term support near $4,605 and resistance around $4,625 to $4,642.
Next 24 Hours Bias
Medium earish
The Euro (EUR)
Key news events today
No major news event
What can we expect from EUR today?
The ECB held its main refinancing rate at 2.15% at its April meeting, but policymakers signaled that they are “moving away” from the baseline scenario and left room for rate hikes from June onward, lifting the euro on expectations of up to three quarter‑point hikes by year‑end. Inflation data show euro‑area CPI at 3% year‑on‑year in April, the highest since September 2023 and well above the 2% target.
Central Bank Notes:
The next meeting is on 10 to 11 June 2026
Next 24 Hours Bias
Weak Bullish
The Swiss Franc (CHF)
Key news events today
No major news event
What can we expect from CHF today?
Today the Swiss franc is trading on a firm footing as a safe‑haven asset, benefiting from a softer US dollar and ongoing global risk‑off sentiment, with USD/CHF near 0.78 and the franc broadly strong versus the euro and other majors; recent data show the franc up roughly 1.3% over the past month and around 4% over the last year, while the Swiss National Bank continues to monitor the situation for possible intervention to prevent an excessively strong currency.
Central Bank Notes:
The next meeting is on 18 June 2026.
Next 24 Hours Bias
Strong Bullish
The Pound (GBP)
Key news events today
No major news event
What can we expect from GBP today?
The British pound begins the week of May 4, 2026, exhibiting signs of caution as markets digest recent central bank policy decisions and navigate ongoing geopolitical and domestic economic pressures. While the currency held firm near multi-month highs toward the end of April following the Bank of England’s decision to keep interest rates unchanged at 3.75%, analysts are increasingly concerned that the “peak pound” narrative may be fading as risks mount.
Central Bank Notes:
Next 24 Hours Bias
Medium Bullish
The Canadian Dollar (CAD)
Key news events today
BOC Gov Macklem Speaks (7:30 pm GMT)
What can we expect from CAD today?
The Canadian dollar (CAD) is holding a modestly stronger tone today, trading around 1.358 per U.S. dollar (or roughly 0.735 USD per CAD), after extending recent gains driven by a resilient domestic manufacturing sector and supportive oil prices. Markets are still digesting last week’s jump in Canada’s manufacturing PMI to 53.3 in April, which signaled the fastest factory‑sector expansion in nearly four years and helped the loonie notch its fourth weekly gain in a row.
Central Bank Notes:
Next 24 Hours Bias
Weak Bullish
Oil
Key news events today
No major news event
What can we expect from Oil today?
Today’s oil news is dominated by a tug-of-war between geopolitical supply risk and signs of price stabilization. The market had spiked sharply on fears of deeper disruption in the Middle East, but more recent trading shows a pullback as ceasefire hopes and diplomacy cooled the rally. Even so, the outlook stays highly sensitive to any new developments in US-Iran talks, Strait of Hormuz shipping, and OPEC+ supply policy.
Next 24 Hours Bias
Strong Bullish
The post IC Markets Global – Europe Fundamental Forecast | 04 May 2026 first appeared on IC Your Trading Edge | Official Blog.
430095 May 4, 2026 16:00 ICMarkets Market News
IC Markets Global – Asia Fundamental Forecast | 04 May 2026
What happened in the U.S. session?
Headlines on Middle East conflicts disrupting oil flows, such as the Strait of Hormuz closure, dominated, driving sharp oil price gains and heightened market volatility without major data releases. Energy commodities and related equities bore the brunt, while the USD gained on safe-haven flows, and indices like the Dow futures weakened amid recession fears; upcoming Treasury auctions and factory orders loom for Monday.
What does it mean for the Asia Session?
Monday’s Asian session looks like a low-liquidity, headline-driven market, with China and Japan holidays reducing participation just as oil and geopolitical tensions remain the main macro forces. That combination usually means sharper-than-normal moves in USD/JPY, AUD/USD, energy-linked assets, and Asia equity futures if any fresh Middle East or OPEC-related headlines hit overnight.
The Dollar Index (DXY)
Key news events today
No major news event
What can we expect from DXY today?
The dollar is beginning the week on firmer footing, but it is still vulnerable to fresh moves in U.S. data, Fed commentary, and risk sentiment. If today’s numbers and Fed remarks reinforce the view that rates will stay elevated for longer, the dollar could extend its recovery; if they disappoint, the broader downtrend may reassert itself.
Central Bank Notes:
Next 24 Hours Bias
Medium Bearish
Gold (XAU)
Key news events today
No major news event
What can we expect from Gold today?
Gold is starting the week with a mildly constructive tone after a volatile Friday, as lower oil prices and a softer U.S. dollar helped bullion recover from early losses tied to easing Iran-war inflation fears. The most important near-term driver today is whether risk appetite continues to improve and whether traders keep rotating away from the dollar, while gold remains sensitive to the next round of U.S. macro data and any fresh Middle East headlines.
Next 24 Hours Bias
Medium Bearish
The Australian Dollar (AUD)
Key news events today
No major news event
What can we expect from AUD today?
The Australian dollar enters Monday in a strong but cautious position, trading near 0.72 and supported by sticky inflation, a firm labor market, and expectations of another RBA rate hike this week. The key issue for today is not a fresh domestic release, but whether markets keep bidding up AUD ahead of Tuesday’s policy decision, or pause to wait for the RBA statement and guidance
Central Bank Notes:
Next 24 Hours Bias
Medium Bullish
The Kiwi Dollar (NZD)
Key news events today
No major news event
What can we expect from NZD today?
The New Zealand dollar is in a fragile, consolidation phase after briefly pushing back above the 0.5900 level against the US dollar, as moderating risk‑off flows and a softer greenback have provided temporary support even though the underlying macro backdrop remains weak; the kiwi is still weighed down by lingering concerns over Middle‑East‑driven energy‑price spikes.
Central Bank Notes:
Next 24 Hours Bias
Medium Bearish
The Japanese Yen (JPY)
Key news events today
No major news event
What can we expect from JPY today?
The Japanese Yen (JPY) continues to trade in a climate of heightened sensitivity following suspected government intervention to support the currency late last week. The yen recently experienced significant volatility, surging by up to 3% on April 30th, its largest daily gain in over three years, after officials issued “final” warnings and were widely reported to have engaged in currency market operations to curb rapid depreciation.
Central Bank Notes:
Next 24 Hours Bias
Medium Bearish
Oil
Key news events today
No major news event
What can we expect from Oil today?
Global oil prices are trading in the high‑100s USD/bbl range early on Monday, after a partial pullback from April’s four‑year highs above $120; the market remains tightly wound by the US–Iran conflict, a largely blocked Strait of Hormuz, and expectations of a large second‑quarter supply shock that could cut global output by several million barrels per day, even as the US and other governments signal continued use of strategic reserves and policy tools to cushion the impact on importers.
Next 24 Hours Bias
Strong Bullish
The post IC Markets Global – Asia Fundamental Forecast | 04 May 2026 first appeared on IC Your Trading Edge | Official Blog.
430078 May 4, 2026 16:00 ICMarkets Market News
Potential Direction: Bullish
Overall momentum of the chart: Bearish
The price has already bounced off the pivot and may continue its bullish move toward the 1st resistance
Pivot: 97.94
Supporting reasons: Identified as an overlap support that aligns with the 50% Fiboancci retracement, where renewed buying pressure could emerge to push the price higher.
1st support: 95.80
Supporting reasons: Identified as a swing low support, indicating a potential area where the price could again stabilize.
1st resistance: 99.44
Supporting reasons: Identified as a pullback resistance, indicating a potential area that could halt any further upward movement

Potential Direction: Bearish
Overall momentum of the chart: Bullish
The price could see a short-term pullback toward the pivot before continuing its bearish move down toward the 1st support.
Pivot: 1.1808
Supporting reasons: Identified as an overlap resistance that aligns with the 61.8% Fibonacci retracement, where selling pressures could intensify and potentially cap any upward retracement.
1st support: 1.1631
Supporting reasons: Identified as a pullback support, indicating a potential level where the price could stabilize once again
1st resistance: 1.2044
Supporting reasons: Identified as a swing high resistance, indicating a potential level that could cap further upward movement.

Potential Direction: Bearish
Overall momentum of the chart: Bearish
The price could see a short-term pullback toward the pivot before continuing its bearish move down toward the 1st support.
Pivot: 186.13
Supporting reasons: Identified as a pullback resistance, where selling pressures could intensify and potentially cap any upward retracement.
1st support: 181.98
Supporting reasons: Identified as an overlap support, indicating a potential area where the price could again stabilize.
1st resistance: 187.92
Supporting reasons: Identified as a swing high resistance, indicating a potential level that could cap further upward movement.

Potential Direction: Bearish
Overall momentum of the chart: Bullish
The price could see a short-term pullback toward the pivot before continuing its bearish move down toward the 1st support.
Pivot: 0.8654
Supporting reasons: Identified as a pullback resistance, where selling pressures could intensify and potentially cap any upward retracement.
1st support: 0.8574
Supporting reasons: Identified as an overlap support that aligns with the 127.2% Fibonacci extension, indicating a potential area where the price could stabilize once more.
1st resistance: 0.8687
Supporting reasons: Identified as a pullback resistance, indicating a potential level that could cap further upward movement.

Potential Direction: Bullish
Overall momentum of the chart: Bullish
The price has already bounced off the pivot and may continue its bullish move toward the 1st resistance
Pivot: 1.3461
Supporting reasons: Identified as an overlap support, where renewed buying pressure could emerge to push the price higher.
1st support: 1.3195
Supporting reasons: Identified as an overlap support that aligns with the 78.6% Fibonacci retracement, indicating a potential area where the price could stabilize once more.
1st resistance: 1.3860
Supporting reasons: Identified as a swing high resistance, indicating a potential level that could halt further upward movement.

Potential Direction: Bearish
Overall momentum of the chart: Bullish
The price could see a short-term pullback toward the pivot before continuing its bearish move down toward the 1st support.
Pivot: 213.96
Supporting reasons: Identified as a pullback resistance, where selling pressures could intensify and potentially cap any upward retracement.
1st support: 209.64
Supporting reasons: Identified as an overlap support, indicating a potential level where the price could stabilize once more.
1st resistance: 216.63
Supporting reasons: Identified as a swing high resistance, indicating a potential level that could halt further upward movement.

Potential Direction: Bearish
Overall momentum of the chart: Bearish
The price could see a short-term pullback toward the pivot before continuing its bearish move down toward the 1st support.
Pivot: 0.7843
Supporting reasons: Identified as a pullback resistance, where selling pressures could intensify and potentially cap any upward retracement.
1st support: 0.7752
Supporting reasons: Identified as an overlap support, indicating a potential level where the price could stabilize once again.
1st resistance: 0.7935
Supporting reasons: Identified as an overlap resistance that aligns with the 61.8% Fibonacci retracement, indicating a potential level that could cap further upward movement.

Potential Direction: Bearish
Overall momentum of the chart: Bullish
The price could see a short-term pullback toward the pivot before continuing its bearish move down toward the 1st support.
Pivot: 158.55
Supporting reasons: Identified as a pullback resistance, where selling pressures could intensify and potentially cap any upward retracement.
1st support: 154.24
Supporting reasons: Identified as an overlap support, indicating a strong area where buyers might return, and the price could stabilize once again.
1st resistance: 160.49
Supporting reasons: Identified as a swing high resistance. This level represents the next key area where upward movement could be capped amid increased selling pressure

Potential Direction: Bearish
Overall momentum of the chart: Bearish
The price could see a short-term pullback toward the pivot before continuing its bearish move down toward the 1st support.
Pivot: 1.3641
Supporting reasons: Identified as a pullback resistance t, where selling pressures could intensify and potentially cap any upward retracement.
1st support: 1.3489
Supporting reasons: Identified as a swing low support, indicating a key level where the price could stabilize once more.
1st resistance: 1.3732
Supporting reasons: Identified as a pullback resistance, making it a possible target for bullish advances and a level where some sellers could return to cap gains

Potential Direction: Bullish
Overall momentum of the chart: Bullish
The price could make a short-term pullback toward the pivot before rising again toward the 1st resistance
Pivot: 07151
Supporting reasons: Identified as a pullback support, where renewed buying pressure could emerge to push the price higher.
1st support: 0.6980
Supporting reasons: Identified as an overlap support, this area has provided strong support historically and may attract buying interest for a potential short-term bounce
1st resistance: 0.7284
Supporting reasons: Identified as a resistance that aligns with the 127.2% Fibonacci extension, indicating a potential area that could halt any further upward movement.

Potential Direction: Bearish
Overall momentum of the chart: Bearish
The price has already reacted off the pivot and may continue its bearish move toward the 1st support.
Pivot: 0.5926
Supporting reasons: Identified as an overlap resistance that aligns with the 61.8% Fibonacci retracement, where selling pressures could intensify and potentially cap any upward retracement.
1st support: 0.5774
Supporting reasons: Identified as a pullback support, this area has provided strong support historically and may attract buying interest for a potential short-term bounce
1st resistance: 0.6079
Supporting reasons: Identified a swing high resistance, indicating a potential area that could halt any further upward movement.
Potential Direction: Bearish
Overall momentum of the chart: Bullish
The price could see a short-term pullback toward the pivot before continuing its bearish move down toward the 1st support.
Pivot: 49,687.50
Supporting reasons: Identified as an overlap resistance, where selling pressures could intensify and potentially cap any upward retracement.
1st support: 47,747.57
Supporting reasons: Identified as a pullback support, suggesting a potential area where the price could stabilize once again.
1st resistance: 50,477.23
Supporting reasons: Identified as a swing high resistance, indicating a potential area that could halt any further upward movement.

Potential Direction: Bearish
Overall momentum of the chart: Bullish
The price could see a short-term pullback toward the pivot before continuing its bearish move down toward the 1st support.
Pivot: 24,805.50
Supporting reasons: Identified as a pullback resistance, where selling pressures could intensify and potentially cap any upward retracement.
1st support: 23,332.36
Supporting reasons: Identified as a pullback support, indicating a key level where the price could stabilize once more.
1st resistance: 25,451.76
Supporting reasons: Identified as a swing high resistance, indicating a potential area that could halt any further upward movement.

Potential Direction: Bullish
Overall momentum of the chart: Bullish
The price could make a short-term pullback toward the pivot before rising again toward the 1st resistance
Pivot: 6,992.26
Supporting reasons: Identified as a pullback support, where renewed buying pressure could emerge to push the price higher.
1st support: 6,762.64
Supporting reasons: Identified as a pullback support, indicating a potential level where the price could stabilize once again.
1st resistance: 7,451.23
Supporting reasons: Identified as a resistance that aligns with the 161.8% Fibonacci extension, indicating a potential area that could halt any further upward movement.

Potential Direction: Bearish
Overall momentum of the chart: Bullish
The price could see a short-term pullback toward the pivot before continuing its bearish move down toward the 1st support.
Pivot: 80,504.51
Supporting reasons: Identified as a pullback resistance that aligns with the 50% Fibonacci retracement, where selling pressures could intensify and potentially cap any upward retracement.
1st support: 74,641.06
Supporting reasons: Identified as an overlap support, indicating a potential level where the price could stabilize once more.
1st resistance: 85,026.77
Supporting reasons: Identified as a pullback resistance that aligns with the 61.8% Fibonacci retracement, indicating a potential area that could halt any further upward movement.

Potential Direction: Bearish
Overall momentum of the chart: Bullish
The price could see a short-term pullback toward the pivot before continuing its bearish move down toward the 1st support.
Pivot: 2,618.80
Supporting reasons: Identified as a pullback resistance that aligns with the 50% Fibonacci retracement, where selling pressures could intensify and potentially cap any upward retracement.
1st support: 2,201.51
Supporting reasons: Identified as an overlap support, indicating a potential level where the price could stabilize once more.
1st resistance: 2,785.06
Supporting reasons: Identified as a pullback resistance, indicating a potential area that could halt any further upward movement.

Potential Direction: Bullish
Overall momentum of the chart: Bullish
The price has already bounced off the pivot and may continue its bullish move toward the 1st resistance
Pivot: 87.53
Supporting reasons: Identified as an overlap support, where renewed buying pressure could emerge to push the price higher.
1st support: 73.75
Supporting reasons: Identified as a pullback support, indicating a key level where the price could stabilize once more.
1st resistance: 119.24
Supporting reasons: Identified as a pullback resistance, indicating a potential area that could halt any further upward movement.

Potential Direction: Bearish
Overall momentum of the chart: Bullish
The price has already reacted off the pivot and may continue its bearish move toward the 1st support.
Pivot: 4,661.23
Supporting reasons: Identified as a pullback resistance, where selling pressures could intensify and potentially cap any upward retracement.
1st support: 4,367.70
Supporting reasons: Identified as an overlap support, indicating a key level where the price could stabilize once more.
1st resistance: 48,62.42
Supporting reasons: Identified as an overlap resistance, indicating a potential area that could halt any further upward movement.

The accuracy, completeness and timeliness of the information contained on this site cannot be guaranteed. IC Markets Global does not warranty, guarantee or make any representations, or assume any liability regarding financial results based on the use of the information in the site.
News, views, opinions, recommendations and other information obtained from sources outside of www.icmarkets.com, used in this site are believed to be reliable, but we cannot guarantee their accuracy or completeness. All such information is subject to change at any time without notice. IC Markets Global assumes no responsibility for the content of any linked site.
The fact that such links may exist does not indicate approval or endorsement of any material contained on any linked site. IC Markets Global is not liable for any harm caused by the transmission, through accessing the services or information on this site, of a computer virus, or other computer code or programming device that might be used to access, delete, damage, disable, disrupt or otherwise impede in any manner, the operation of the site or of any user’s software, hardware, data or property.
The post Monday 4th May 2026: Technical Outlook and Review first appeared on IC Your Trading Edge | Official Blog.
430069 May 4, 2026 15:40 ICMarkets Market News
It was a busy week again for financial markets, as geopolitical updates on the Gulf competed with a plethora of interest rate updates from key central banks, tier 1 data, and major corporate earnings updates to keep markets volatile.
It is slightly quieter on the macroeconomic front this week; however, big US employment numbers over the week, building up to the key Non-Farms data on Friday, will be a major focus alongside an anticipated rate hike from the RBA and more expected updates on the constantly changing situation in the Middle East.
Bank holiday markets could also contribute to market moves over the coming days, with several key financial centres having breaks throughout the week, which should see liquidity come at a premium in some key trading sessions.
Here is our usual day-by-day breakdown of the major risk events this week:

It’s a quiet calendar start to the week on Monday, with some of the major centres on holiday again, which could add to exacerbated moves in thinner markets. There are only third-tier data releases scheduled across the three sessions, and we do hear from the Bank of Canada Governor later in the day; however, geopolitical updates are likely again to be the main catalyst for any moves.

Australian markets will be in focus on Tuesday, with the Reserve Bank of Australia set to update the market on its latest rate call, while both Chinese and Japanese markets are closed again. The London session will see an early focus on Swiss markets, with key CPI numbers due out, before we then hear from ECB President Christine Lagarde. US data for the week starts in earnest later in the day, with ISM Services PMI (exp 53.8), JOLTS Job Openings (exp 6.87mio), and New Home Sales (exp 668k) numbers all due out.

It’s an early start for data on Wednesday, with New Zealand Employment Change (exp +0.3% q/q) and Unemployment Rate (exp 5.4%) data due early in the session, before we then hear from RBNZ Governor Anna Breman. It’s a quiet calendar in the London session on Wednesday; however, we have more US employment numbers out soon after the New York open, with the ADP Non-Farm Employment Change (exp +90k), followed by the Canadian Ivey PMI (exp 49.9) data release. Later in the day, we again hear from Bank of Canada Governor Tiff Macklem.

There will be an initial focus on Kiwi markets again on Thursday, with RBNZ Governor Anna Breman testifying on the Monetary Policy Statement in Wellington early in the day. However, it is a much quieter day through the other trading sessions, with just the usual Weekly Unemployment Claims data (exp 203k) due out of the US later in the day, set to trouble the scorers.

It is Non-Farm Payroll Day on Friday, and it is a typical setup for the big US employment data, with very little scheduled in the preceding two trading sessions. Canadian Employment Change (exp 2.1k) and Unemployment Rate (exp 6.7%) numbers are due out alongside the big US data – Non-Farm Employment Change (exp +60k), Average Hourly Earnings (exp +0.3% m/m), and Unemployment Rate (exp 4.3%) – and traders expect to see plenty of volatility around the release. Later in the session, the Preliminary University of Michigan Consumer Sentiment (exp 49.3) and Inflation Expectations (last 4.7%) numbers are also released; however, expect the jobs numbers to dominate sentiment into the weekend.
The post The Week Ahead – Week Commencing 04 May 2026 first appeared on IC Your Trading Edge | Official Blog.
430068 May 4, 2026 15:40 ICMarkets Market News
Mixed Day for Markets to Close out the Week – Nasdaq up 0.9%
US markets delivered a mixed finish to end the week, as investors continued to digest an ongoing stream of macroeconomic, central bank, and geopolitical developments. The tech sector remained a key driver of performance, with the Nasdaq climbing 0.89% to 25,114, while the S&P 500 added 0.29% to close at 7,230. In contrast, the Dow Jones underperformed, slipping 0.31% to 49,499. In FX markets, the US dollar edged modestly higher, with the Dollar Index up 0.16% to 98.21, stabilising after the prior session’s sharp, intervention-led weakness. Treasury markets were relatively subdued, with the 2-year yield ticking up 0.9 basis points to 3.877%, while the 10-year yield was little changed, easing slightly by 0.1 basis points to 4.370%. Commodities saw some retracement, particularly in energy markets. Brent crude fell 2.02% to $108.17, while WTI declined 2.98% to $101.91, as optimism surrounding a potential easing of tensions in the Middle East weighed on prices. Gold was largely unchanged on the session, slipping just 0.08% to $4,614.21.
Big Moves Ahead for Oil Today
It’s not exactly a tough call to make given the moves we have seen in oil over the past few weeks, but the latest update from President Trump over the weekend really could see oil prices move 10%+ in either direction, depending on how the situation in the Strait of Hormuz plays out. The update lacked details, but a commitment to assist countries in moving their ships through the blockaded strait could test the current ceasefire in the Middle East in the coming sessions. If we see the start of traffic increase under US protection, then we should see oil prices fall—and fall hard. However, if the Iranians look to oppose this move and strike at those tankers or the US Navy, then we could see full military operations resume in short order, which would lead to a sharp move north for oil prices and probably a swift challenge of recent highs. Noting that President Trump has received Iran’s latest proposal over the weekend and has advised that he feels it is not acceptable could see some skewing of options towards topside moves.
Geopolitics to Dominate First Trading Day of the Week
Looking ahead, market conditions are expected to be quieter in terms of liquidity, with Japan, China, and the UK all observing public holidays today. Despite a relatively light economic calendar, geopolitical developments remain firmly in focus. Reports that President Trump has indicated the US will begin facilitating traffic through the Strait of Hormuz today are likely to keep markets sensitive to incoming headlines, particularly in oil markets. In terms of scheduled events, the only notable release comes in the US session, with Bank of Canada Governor Tiff Macklem set to speak towards the end of the day when he testifies before the House of Commons Standing Committee on Finance in Ottawa, which could see some moves in the loonie.
The post General Market Analysis – 04/05/26 first appeared on IC Your Trading Edge | Official Blog.