430248 May 7, 2026 15:00 ICMarkets Market News
IC Markets Global – Europe Fundamental Forecast | 07 May 2026
What happened in the Asia session?
Markets traded cautiously with no fresh macro releases, as US-Iran Strait of Hormuz tensions sustained oil above $100 (impacting Brent/WTI most), yen weakened to USDJPY ~158 amid BOJ watch (USDJPY heavily hit), and AUD fluctuated post-RBA hike; Asian stocks dipped (Hang Seng -1%), extending prior slips while AI optimism faded against geo-risks—overall, commodities and JPY pairs bore the brunt.
What does it mean for the Europe & US sessions?
Traders face a mix of steady macroeconomic data and high-impact geopolitics: US initial jobless claims at 8:30 AM ET (exp. 218K) will test labor resilience amid Fed’s steady 3.5-3.75% rates, while US-Iran peace progress has slashed Brent crude below $100 from $120 peaks, weakening USD, lifting yen on intervention risks, and fueling equity records in tech/AI amid RBA hike ripples position for volatility in oil, forex, and risk assets as sessions open.
The Dollar Index (DXY)
Key news events today
Unemployment Claims (12:30 pm GMT)
What can we expect from DXY today?
The US Dollar remained nearly flat against major peers, with the DXY near 99.00, pressured by advancing “Project Freedom” in the Strait of Hormuz that reduced war-related safe-haven flows despite the ongoing US-Iran conflict, alongside softer US PMI revisions and steady Fed policy expectations post-April hold at 3.50-3.75%. Expectations point to range-bound trading in May, supported by resilient US data but capped by global risk sentiment and central bank divergences.
Central Bank Notes:
Next 24 Hours Bias
Weak Bullish
Gold (XAU)
Key news events today
Unemployment Claims (12:30 pm GMT)
What can we expect from Gold today?
Gold continued its strong rebound, rising about 2.2% to approximately $4,695 per ounce after a 2.7% surge the day before. The rally was fueled by a weaker U.S. dollar, which made gold more affordable for non-U.S. investors, and by persistent geopolitical uncertainty in the Middle East, particularly around U.S.–Iran tensions and stalled peace talks, which reinforced gold’s role as a safe-haven asset
Next 24 Hours Bias
Medium Bullish
The Euro (EUR)
Key news events today
No major news event
What can we expect from EUR today?
The Euro remained stable with EUR/USD near 1.1748 following a 0.47% gain the prior day, supported by USD weakness from soft US data and hawkish ECB outlooks, though capped by ongoing US tariff threats from President Trump and sluggish Q1 GDP growth of 0.1% in the Eurozone. No significant economic releases occurred today, keeping focus on technical levels and broader trade risks amid steady ECB rates.
Central Bank Notes:
The next meeting is on 10 to 11 June 2026
Next 24 Hours Bias
Weak Bullish
The Swiss Franc (CHF)
Key news events today
No major news event
What can we expect from CHF today?
The Swiss franc is starting Thursday on a firm footing, with the currency near multi-year highs against the dollar, helped by stronger April inflation and persistent safe-haven flows. The SNB’s zero-rate stance and willingness to lean against rapid appreciation are limiting factors, but for now the market tone remains CHF-positive rather than reversal-led.
Central Bank Notes:
The next meeting is on 18 June 2026.
Next 24 Hours Bias
Medium Bullish
The Pound (GBP)
Key news events today
No major news event
What can we expect from GBP today?
The pound is trading near multi‑month highs versus the dollar, supported by expectations that the Bank of England will keep its Bank Rate on hold at 3.75% and maintain a relatively hawkish‑leaning stance, while geopolitical risk in the Middle East and firmer US‑dollar conditions keep volatility elevated.
Central Bank Notes:
Next 24 Hours Bias
Medium Bullish
The Canadian Dollar (CAD)
Key news events today
No major news event
What can we expect from CAD today?
The Canadian dollar remains range-bound near USD/CAD 1.36-1.37, pressured by strong US growth, Fed hawkishness, and Middle East risks favoring the USD, yet buoyed by stable oil exports and a hawkish Bank of Canada outlook; forecasts from major banks like RBC and TD predict gradual CAD strengthening later in the quarter to around 1.34-1.36.
Central Bank Notes:
Next 24 Hours Bias
Weak Bullish
Oil
Key news events today
No major news event
What can we expect from Oil today?
Oil markets remain on edge following a sharp decline on May 6, where Brent crude fell around 6% to $103 per barrel, and WTI dropped nearly 7% to $95, triggered by reports of advancing U.S.-Iran peace talks that could end the war and ease supply fears from the Strait of Hormuz disruptions. Despite the pullback from recent highs above $114 amid Middle East strikes and restricted shipping, prices stay elevated year-over-year, with US gasoline topping $4.50/gallon
Next 24 Hours Bias
Strong Bullish
The post IC Markets Global – Europe Fundamental Forecast | 07 May 2026 first appeared on IC Your Trading Edge | Official Blog.
430226 May 7, 2026 14:40 ICMarkets Market News
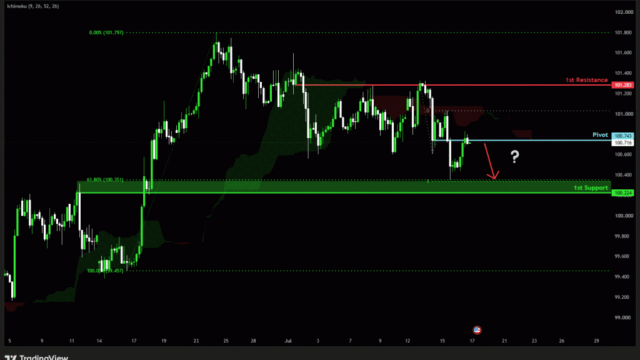
Potential Direction: Bearish
Overall momentum of the chart: Bearish
The price could see a short-term pullback toward the pivot before continuing its bearish move down toward the 1st support
Pivot: 98.27
Supporting reasons: Identified as a pullback resistance, where selling pressures could intensify and potentially cap any upward retracement.
1st support: 97.62
Supporting reasons: Identified as a swing low support, indicating a potential area where the price could again stabilize.
1st resistance: 99.32
Supporting reasons: Identified as an overlap resistance, indicating a potential area that could halt any further upward movement

Potential Direction: Bullish
Overall momentum of the chart: Bullish
The price could see a short-term pullback toward the pivot before rising again toward the 1st resistance.
Pivot: 1.1714
Supporting reasons: Identified as a pullback support, where renewed buying pressure could emerge to push the price higher.
1st support: 1.1661
Supporting reasons: Identified as a pullback support, indicating a potential level where the price could stabilize once again.
1st resistance: 1.1831
Supporting reasons: Identified as a swing high resistance, indicating a potential level that could cap further upward movement.

Potential Direction: Bearish
Overall momentum of the chart: Bullish
The price could see a short-term pullback toward the pivot before continuing its bearish move down toward the 1st support
Pivot: 184.76
Supporting reasons: Identified as an overlap resistance that aligns with the 50% Fibonacci retracement, where selling pressures could intensify and potentially cap any upward retracement.
1st support: 182.74
Supporting reasons: Identified as an overlap support, indicating a potential area where the price could again stabilize.
1st resistance: 186.23
Supporting reasons: Identified as a swing high resistance that aligns with the 78.6% Fibonacci retracement, indicating a potential level that could cap further upward movement.

Potential Direction: Bearish
Overall momentum of the chart: Bullish
The price could see a short-term pullback toward the pivot before continuing its bearish move down toward the 1st support.
Pivot: 0.8653
Supporting reasons: Identified as a pullback resistance that aligns with the 61.8% Fibonacci retracement, where selling pressures could intensify and potentially cap any upward retracement.
1st support: 0.8617
Supporting reasons: Identified as an overlap support, indicating a potential area where the price could stabilize once more.
1st resistance: 0.8676
Supporting reasons: Identified as an overlap resistance, indicating a potential level that could cap further upward movement.

Potential Direction: Bullish
Overall momentum of the chart: Bullish
The price could see a short-term pullback toward the pivot before rising again toward the 1st resistance.
Pivot: 1.3554
Supporting reasons: Identified as a pullback support, where renewed buying pressure could emerge to push the price higher.
1st support: 1.3458
Supporting reasons: Identified as a swing low support that aligns with the 127.2% Fibonacci projection, indicating a potential area where the price could stabilize once more.
1st resistance: 1.3657
Supporting reasons: Identified as a swing high resistance, indicating a potential level that could halt further upward movement.

Potential Direction: Bearish
Overall momentum of the chart: Bullish
The price could see a short-term pullback toward the pivot before continuing its bearish move down toward the 1st support.
Pivot: 214.04
Supporting reasons: Identified as an overlap resistance, where selling pressures could intensify and potentially cap any upward retracement.
1st support: 211.43
Supporting reasons: Identified as an overlap support, indicating a potential level where the price could stabilize once more.
1st resistance: 214.90
Supporting reasons: Identified as a pullback resistance, indicating a potential level that could halt further upward movement.

Potential Direction: Bearish
Overall momentum of the chart: Bearish
The price could see a short-term pullback toward the pivot before continuing its bearish move down toward the 1st support.
Pivot: 0.7836
Supporting reasons: Identified as a pullback resistance that aligns with the 50% Fibonacci retracement, where selling pressures could intensify and potentially cap any upward retracement.
1st support: 0.7760
Supporting reasons: Identified as a swing low support, indicating a potential level where the price could stabilize once again.
1st resistance: 0.7917
Supporting reasons: Identified as an overlap resistance, indicating a potential level that could cap further upward movement.

Potential Direction: Bearish
Overall momentum of the chart: Bullish
The price could see a short-term pullback toward the pivot before continuing its bearish move down toward the 1st support.
Pivot: 157.88
Supporting reasons: Identified as a pullback resistance that aligns with the 50% Fibonacci retracement, where selling pressures could intensify and potentially cap any upward retracement.
1st support: 155.54
Supporting reasons: Identified as a swing low support, indicating a strong area where buyers might return, and the price could stabilize once again.
1st resistance: 159.03
Supporting reasons: Identified as a pullback resistance. This level represents the next key area where upward movement could be capped amid increased selling pressure

Potential Direction: Bearish
Overall momentum of the chart: Bullish
The price could see a short-term pullback toward the pivot before continuing its bearish move down toward the 1st support
Pivot: 1.3641
Supporting reasons: Identified as a pullback resistance that aligns with the 61.8% Fibonacci retracement, where selling pressures could intensify and potentially cap any upward retracement.
1st support: 1.3550
Supporting reasons: Identified as a swing low support, indicating a key level where the price could stabilize once more.
1st resistance: 1.3704
Supporting reasons: Identified as a pullback resistance, making it a possible target for bullish advances and a level where some sellers could return to cap gains

Potential Direction: Bullish
Overall momentum of the chart: Bullish
The price could see a short-term pullback toward the pivot before rising again toward the 1st resistance.
Pivot: 0.7207
Supporting reasons: Identified as a pullback support, where renewed buying pressure could emerge to push the price higher.
1st support: 07150
Supporting reasons: Identified as a pullback support, this area has provided strong support historically and may attract buying interest for a potential short-term bounce
1st resistance: 0.7262
Supporting reasons: Identified as a resistance that aligns with the 100% Fibonacci projection, indicating a potential area that could halt any further upward movement.

Potential Direction: Bullish
Overall momentum of the chart: Bullish
The price could see a short-term pullback toward the pivot before rising again toward the 1st resistance.
Pivot: 0.5920
Supporting reasons: Identified as a pullback support, where renewed buying pressure could emerge to push the price higher.
1st support: 0.5873
Supporting reasons: Identified as a pullback support, this area has provided strong support historically and may attract buying interest for a potential short-term bounce
1st resistance: 0.6036
Supporting reasons: Identified as a resistance that aligns with the 161.8% Fibonacci projection, indicating a potential area that could halt any further upward movement.

Potential Direction: Bullish
Overall momentum of the chart: Bullish
The price could see a short-term pullback toward the pivot before rising again toward the 1st resistance.
Pivot: 49,485.20
Supporting reasons: Identified as a pullback support, where renewed buying pressure could emerge to push the price higher.
1st support: 48,894.00
Supporting reasons: Identified as a swing low support, suggesting a potential area where the price could stabilize once again.
1st resistance: 50,290.94
Supporting reasons: Identified as a resistance that aligns with the 127.2% Fibonacci extension, indicating a potential area that could halt any further upward movement.

Potential Direction: Bullish
Overall momentum of the chart: Bullish
The price could see a short-term pullback toward the pivot before rising again toward the 1st resistance.
Pivot: 24,403.10
Supporting reasons: Identified as a pullback support, where renewed buying pressure could emerge to push the price higher.
1st support: 23,665.10
Supporting reasons: Identified as a swing low support, indicating a key level where the price could stabilize once more.
1st resistance: 25,126.34
Supporting reasons: Identified as a resistance that aligns with the 161.8% Fibonacci projection, indicating a potential area that could halt any further upward movement.

Potential Direction: Bullish
Overall momentum of the chart: Bullish
The price could see a short-term pullback toward the pivot before rising again toward the 1st resistance.
Pivot: 7,270.00
Supporting reasons: Identified as an overlap support, where renewed buying pressure could emerge to push the price higher.
1st support: 7,179.02
Supporting reasons: Identified as an overlap support, indicating a potential level where the price could stabilize once again.
1st resistance: 7,447.34
Supporting reasons: Identified as a resistance that aligns with the 161.8% Fibonacci projection, indicating a potential area that could halt any further upward movement.

Potential Direction: Bullish
Overall momentum of the chart: Bearish
The price could see a short-term pullback toward the pivot before rising again toward the 1st resistance.
Pivot: 79,508.18
Supporting reasons: Identified as a pullback support, where renewed buying pressure could emerge to push the price higher.
1st support: 77,288.07
Supporting reasons: Identified as a pullback support, indicating a potential level where the price could stabilize once more.
1st resistance: 87,549.37
Supporting reasons: Identified as a resistance that aligns with the 161.8% Fibonacci extension, indicating a potential area that could halt any further upward movement.

Potential Direction: Bullish
Overall momentum of the chart: Bullish
The price has already bounced off the pivot and may continue its bullish move toward the 1st resistance
Pivot: 2,325.37
Supporting reasons: Identified as an overlap support, where renewed buying pressure could emerge to push the price higher.
1st support: 2,266.96
Supporting reasons: Identified as an overlap support, indicating a potential level where the price could stabilize once more.
1st resistance: 2,449.22
Supporting reasons: Identified as a swing high resistance, indicating a potential area that could halt any further upward movement.

Potential Direction: Bearish
Overall momentum of the chart: Bullish
The price could see a short-term pullback toward the pivot before continuing its bearish move down toward the 1st support
Pivot: 101.24
Supporting reasons: Identified as a pullback resistance, where selling pressures could intensify and potentially cap any upward retracement.
1st support: 94.89
Supporting reasons: Identified as aa pullback support, indicating a key level where the price could stabilize once more.
1st resistance: 110.90
Supporting reasons: Identified as a swing high resistance, indicating a potential area that could halt any further upward movement.

Potential Direction: Bullish
Overall momentum of the chart: Bullish
The price could see a short-term pullback toward the pivot before rising again toward the 1st resistance.
Pivot: 4631.82
Supporting reasons: Identified as a pullback support, where renewed buying pressure could emerge to push the price higher.
1st support: 4,510.30
Supporting reasons: Identified as a swing low support, indicating a key level where the price could stabilize once more.
1st resistance: 4,767.70
Supporting reasons: Identified as an overlap resistance, indicating a potential area that could halt any further upward movement.

The accuracy, completeness and timeliness of the information contained on this site cannot be guaranteed. IC Markets Global does not warranty, guarantee or make any representations, or assume any liability regarding financial results based on the use of the information in the site.
News, views, opinions, recommendations and other information obtained from sources outside of www.icmarkets.com, used in this site are believed to be reliable, but we cannot guarantee their accuracy or completeness. All such information is subject to change at any time without notice. IC Markets Global assumes no responsibility for the content of any linked site.
The fact that such links may exist does not indicate approval or endorsement of any material contained on any linked site. IC Markets Global is not liable for any harm caused by the transmission, through accessing the services or information on this site, of a computer virus, or other computer code or programming device that might be used to access, delete, damage, disable, disrupt or otherwise impede in any manner, the operation of the site or of any user’s software, hardware, data or property.
The post Thursday 7th May 2026: Technical Outlook and Review first appeared on IC Your Trading Edge | Official Blog.
430225 May 7, 2026 14:40 ICMarkets Market News
Japan’s stock market surged on Thursday, with the benchmark Nikkei 225 soaring more than 5% to cross the 62,000 mark for the first time ever, as Asia-Pacific markets rallied despite renewed tensions in the Middle East. Investor sentiment remained upbeat after U.S. President Donald Trump warned that Iran would face bombing “at a much higher level” if it failed to agree to a peace deal.
The Nikkei rally was driven by strong gains in technology, financial and basic materials stocks. Shares of SoftBank jumped over 13%, while electronics maker Ibiden climbed 17%. Mitsui Kinzoku gained 16%, Renesas Electronics rose 13%, and Tosoh Corporation advanced 12%. Japan’s broader Topix index also gained 2.37%.
Elsewhere in the region, Australia’s S&P/ASX 200 added 0.9%. Hong Kong’s Hang Seng Index rose 1.47%, while China’s CSI 300 edged 0.38% higher. However, South Korea’s Kospi reversed earlier gains to fall 0.68%, while the Kosdaq lost 0.56%.
Trump’s comments came amid reports that Washington and Tehran were close to reaching a deal to end the conflict. He also said the U.S. military campaign, dubbed “Operation Epic Fury,” could end if Iran agrees to the proposed terms, potentially reopening the Strait of Hormuz to all shipping, including Iran.
The post Thursday 7th May 2026: Asia Markets Rally as Nikkei Hits Record 62,000 Despite Middle East Tensions first appeared on IC Your Trading Edge | Official Blog.
430223 May 7, 2026 14:00 ICMarkets Market News
US Markets Rally as Iran Reviews Peace Deal – Nasdaq up 2%
US equities extended their rally in the latest session as risk sentiment strengthened on growing optimism around a potential de-escalation in the Middle East. Reports that Iran is reviewing a fresh US proposal aimed at ending the conflict helped underpin a broad risk-on move across global markets. The major US indices all pushed sharply higher, with the Dow Jones rising 1.24% to 49,910, while the S&P 500 gained 1.46% to close at a fresh record of 7,365. The Nasdaq once again led the advance, climbing 2.02% to 25,838 and marking another record close for the technology-heavy index, helped by strong AMD earnings results. In currency markets, the US dollar softened alongside the improvement in risk appetite, with the USD index falling 0.42% to 98.03. Treasury markets also reflected the shift in sentiment, with yields moving lower across the curve. The US 2-year yield dropped 7.4 basis points to 3.866%, while the 10-year yield declined 7.5 basis points to 4.349%. Commodity markets were particularly active on the geopolitical developments. Oil prices fell sharply as risk premiums were unwound, with Brent crude sliding 7.25% to $101.90 after briefly dipping back below the $100 level during the session. WTI also came under pressure, falling 7.03% to $95.08. In contrast, gold continued to defy its traditional safe-haven role, rallying 2.92% to $4,689.05, supported in part by the weaker US dollar.
Oil Looking Vulnerable on Peace Hopes
Oil prices dropped hard in trading yesterday as peace hopes increased dramatically with news that the US has put a proposal to Iran to end the conflict in the Middle East that will see the Strait of Hormuz reopened and allow 20% of the world’s oil to flow once again. Traders are preparing for more downside moves if a deal is confirmed in the coming sessions, but there are some questions as to how far it will fall, given likely continued concerns on the longevity of the deal and how long it will take for oil flow to return to normal levels once the naval blockades are lifted. At one stage yesterday, WTI traded down as much as 13%, but then closed around 7% from its open, so the initial target for moves lower will be near yesterday’s low at $88.66 a barrel, with trendline support on the daily chart coming in just below at $87.42. Longer-term traders will be looking for prices to return to pre-conflict levels under $70 a barrel, but the path there may not be smooth after the disruptions from the last several weeks. Those wary of a breakdown in negotiations will, however, be looking for sharp moves back to the topside, with the initial target at yesterday’s high of $102.70.
Geopolitics Remain in Focus on Quiet Calendar Day
Looking ahead, the macroeconomic calendar is relatively quiet today, leaving markets highly sensitive to geopolitical headlines. With hopes building around a potential peace agreement, volatility is expected to remain elevated as investors react to any further developments. In the Asian session, attention turns briefly to New Zealand, where RBNZ Governor Anna Breman is scheduled to speak early in the day, with markets watching for any policy signals or commentary on the regional inflation outlook. There is little else on the calendar for the rest of the Asian session and indeed the European session, where mainly lower-tier releases are scheduled. However, the US session does see the release of the Weekly Unemployment Claims (exp. 205k), which will provide a timely read on labour market conditions ahead of tomorrow’s big Non-Farm Payrolls release.
Explore all upcoming market events in the Economic Calendar.
The post General Market Analysis – 07/05/26 first appeared on IC Your Trading Edge | Official Blog.
430222 May 7, 2026 14:00 ICMarkets Market News
IC Markets Global – Asia Fundamental Forecast | 07 May 2026
What happened in the U.S. session?
The U.S. session was dominated by hopes of a U.S.–Iran peace deal, which lifted U.S. equity‑index futures and global stocks while pushing oil prices lower and safe‑haven yields down. Against that backdrop, slightly firmer‑than‑expected JOLTS data kept the labor market looking tight ahead of next week’s non‑farm payrolls, while the Fed remains on hold at 3.50%–3.75%, leaving the dollar and real rates range‑bound.
What does it mean for the Asia Session?
Oil-driven volatility from US-Iran Strait of Hormuz tensions, where recent attacks pushed Brent to $114 before pullbacks, yen intervention risks around USD/JPY 160 post-BOJ spending, and selective equity gains in AI/tech sectors across Japan, Korea, and Taiwan, amid thin liquidity from holidays; light data like Hong Kong/Indonesia GDP and Korea CPI offers limited catalysts, while RBA’s fresh rate hike to 4.35% tempers AUD expectations, demanding vigilance on Middle East headlines and FX defenses.
The Dollar Index (DXY)
Key news events today
Unemployment Claims (12:30 pm GMT)
What can we expect from DXY today?
The US Dollar showed mixed performance, holding near 99.00 on the DXY index amid ongoing geopolitical tensions in the Middle East, boosting safe-haven demand, though it faced pressure from hopes of a US-Iran deal resolution. Recent sessions saw the DXY dip to around 97.70-98.31, reflecting a slight depreciation after modest prior gains, with traders eyeing upcoming US labor data like ADP reports and non-farm payrolls, expected later in the week to dictate further direction.
Central Bank Notes:
Next 24 Hours Bias
Weak Bullish
Gold (XAU)
Key news events today
Unemployment Claims (12:30 pm GMT)
What can we expect from Gold today?
Gold prices have shown resilience amid escalating Middle East tensions, rebounding from recent lows around $4,540 per ounce on May 4 to approximately $4,560-$4,677 by May 6, driven by safe-haven demand despite inflation fears from oil spikes and potential US-Iran clashes over the Strait of Hormuz.
Next 24 Hours Bias
Weak Bearish
The Australian Dollar (AUD)
Key news events today
No major news event
What can we expect from AUD today?
The Australian Dollar (AUD) maintains a strong position, continuing to trade near four-year highs following a period of sustained appreciation. The currency has been bolstered by a combination of resilient domestic economic conditions and market expectations regarding the Reserve Bank of Australia’s (RBA) monetary policy, with the AUD/USD pair recently pushing past the 0.7200 level.
Central Bank Notes:
Next 24 Hours Bias
Medium Bullish
The Kiwi Dollar (NZD)
Key news events today
No major news event
What can we expect from NZD today?
Today’s NZD story is a tug of war between global risk sentiment and domestic rate expectations. The kiwi has been holding near recent highs because markets are still pricing some RBNZ tightening later this year, but the immediate upside is capped by softer May hike expectations and ongoing geopolitical uncertainty.
Central Bank Notes:
Next 24 Hours Bias
Weak Bullish
The Japanese Yen (JPY)
Key news events today
No major news event
What can we expect from JPY today?
The yen remained under pressure near USD/JPY 156-157 levels, with traders on high alert for additional interventions after a May 6 spike to 155.04 sparked speculation of official buying; Japan’s recent $34.5 billion effort and stern warnings have propped up the currency short-term, but persistent USD strength from rate differentials and geopolitics limits lasting gains.
Central Bank Notes:
Next 24 Hours Bias
Strong Bearish
Oil
Key news events today
No major news event
What can we expect from Oil today?
Oil prices are sharply off their recent highs, as markets pivot from Middle East‑war risk to a narrative of de‑escalation and a potential reopening of the Strait of Hormuz. Brent crude has retreated from intraday peaks above 114 dollars toward the low‑100s, while WTI has slid from around 106 dollars down into the low‑90s, driven by signals that the U.S.‑Iran conflict is moving toward a ceasefire‑style agreement and the lifting of naval blockades.
Next 24 Hours Bias
Strong Bullish
The post IC Markets Global – Asia Fundamental Forecast | 07 May 2026 first appeared on IC Your Trading Edge | Official Blog.
430199 May 6, 2026 17:40 ICMarkets Market News

The post Ex-Dividend 07/05/2026 first appeared on IC Your Trading Edge | Official Blog.
430198 May 6, 2026 16:40 ICMarkets Market News
IC Markets Global – Europe Fundamental Forecast | 06 May 2026
What happened in the Asia session?
The intersection of high-growth technology optimism and systemic risks stemming from energy security. While semiconductor-related equities continued to benefit from robust AI demand, the broader market sentiment remained sensitive to the volatility in Brent crude prices, which hit significant highs not seen since mid-2022. The Japanese Yen continued to serve as a focal point for currency traders, with its weakness highlighting the conflict between domestic economic policy and external pressures from a high USD and geopolitical risk.
What does it mean for the Europe & US sessions?
Markets are riding momentum from Tuesday’s record close for the S&P 500 and Nasdaq, fueled by AI chip stocks surging after Intel posted a 12% jump on Apple chipmaking talks and AMD rallied on earnings expectations, while falling oil prices (down 3%) and a holding U.S.-Iran ceasefire reduced geopolitical risk. The day’s critical data includes the JOLTS job openings report, where a weak print below the 6.8M forecast could revive rate-cut arguments as the Fed’s rate-cut window narrows, versus the EIA crude inventory report expected to show a 1.5M barrel draw that would support oil prices amid Strait of Hormuz tensions.
The Dollar Index (DXY)
Key news events today
ADP Non-Farm Employment Change (12:15 pm GMT)
What can we expect from DXY today?
The US Dollar remains range-bound near 98.20 on the DXY amid a slight daily uptick, pressured by yen strength from potential interventions and offset by safe-haven flows from Middle East conflicts like US-Iran tensions, which also fuel oil-driven inflation concerns limiting Fed rate cut bets. US data shows economic rebound with 2% Q1 GDP and low jobless claims, but monthly weakness persists at -1.82%, with forecasts eyeing further softening to 97.83 soon.
Central Bank Notes:
Next 24 Hours Bias
Weak Bullish
Gold (XAU)
Key news events today
ADP Non-Farm Employment Change (12:15 pm GMT)
What can we expect from Gold today?
Gold prices showed resilience, rebounding amid escalating Middle East tensions, particularly US-Iran clashes in the Strait of Hormuz, which have driven energy costs higher and heightened inflation fears. Spot gold traded around $4,560-$4,585 per ounce, up about 0.8-1.4% from recent sessions after hitting a one-month low, supported by safe-haven demand despite high interest rate pressures.
Next 24 Hours Bias
Medium Bullish
The Euro (EUR)
Key news events today
No major news event
What can we expect from EUR today?
The Euro is navigating a complex landscape defined by geopolitical tensions and uncertainty surrounding the European Central Bank (ECB) monetary policy. While the currency has shown resilience, trading above the $1.17 level early this month, it remains sensitive to ongoing volatility in global oil prices and shifting expectations regarding future interest rate adjustments.
Central Bank Notes:
The next meeting is on 10 to 11 June 2026
Next 24 Hours Bias
Weak Bullish
The Swiss Franc (CHF)
Key news events today
No major news event
What can we expect from CHF today?
The Swiss franc maintained its bullish momentum against major currencies like the USD (at ~0.7840) and EUR (~0.9172), fueled by safe-haven flows amid Middle East tensions and elevated oil prices, while the SNB signals readiness for interventions to cap rapid appreciation and support price stability. Forecasts suggest a short-term test of USD/CHF resistance near 0.7855 before potential declines below 0.7665, with the franc up 4.69% over the past year. No major Swiss economic data releases occurred today, keeping focus on global risk sentiment.
Central Bank Notes:
The next meeting is on 18 June 2026.
Next 24 Hours Bias
Medium Bullish
The Pound (GBP)
Key news events today
No major news event
What can we expect from GBP today?
The British Pound traded steadily around 1.35 against the USD with minor declines of 0.19%, pressured by gloomy UK economic revisions such as elevated inflation forecasts to 3.4% and subdued GDP growth at 0.5% coupled with escalating Middle East conflicts driving oil to four-year highs via US-Iran tensions and Strait of Hormuz risks, as the Bank of England maintains a cautious 3.75% rate stance amid 3.3% inflation.
Central Bank Notes:
Next 24 Hours Bias
Medium Bullish
The Canadian Dollar (CAD)
Key news events today
No major news eventIvey PMI (2:00 pm GMT)
BOC Gov Macklem Speaks (8:15 pm GMT)
What can we expect from CAD today?
The Canadian dollar is trading slightly stronger versus the US dollar, around 0.735 USD per CAD (USD/CAD near 1.360), continuing a period of range‑bound action as the loonie balances modest support from firm oil prices and resilient domestic data against headwinds from a safe-haven bid for the US dollar and cautious Bank of Canada policy.
Central Bank Notes:
Next 24 Hours Bias
Weak Bullish
Oil
Key news events today
EIA Crude Oil Inventories ( 2:30 pm GMT)
What can we expect from Oil today?
Global oil markets saw continued downward momentum as positive RSI signals hinted at possible temporary stabilization or sideways trading, but the dominant bearish technicals prevailed amid OPEC+’s earlier May output increase of 206,000 barrels per day. Prices averaged around $114 recently after a 12% drop from April highs, with US producers like Diamondback Energy cutting rigs in response.
Next 24 Hours Bias
Strong Bullish
The post IC Markets Global – Europe Fundamental Forecast | 06 May 2026 first appeared on IC Your Trading Edge | Official Blog.
430178 May 6, 2026 16:00 ICMarkets Market News
Potential Direction: Bullish
Overall momentum of the chart: Bearish
The price could see a short-term pullback toward the pivot before rising again toward the 1st resistance.
Pivot: 98.27
Supporting reasons: Identified as an overlap support, where renewed buying pressure could emerge to push the price higher.
1st support: 97.62
Supporting reasons: Identified as a swing low support, indicating a potential area where the price could again stabilize.
1st resistance: 99.32
Supporting reasons: Identified as an overlap resistance, indicating a potential area that could halt any further upward movement

Potential Direction: Bearish
Overall momentum of the chart: Bullish
The price could see a short-term pullback toward the pivot before continuing its bearish move down toward the 1st support
Pivot: 1.1718
Supporting reasons: Identified as a pullback resistance, where selling pressures could intensify and potentially cap any upward retracement.
1st support: 1.1628
Supporting reasons: Identified as a pullback support that aligns with the 61.8% Fibonacci retracement, indicating a potential level where the price could stabilize once again.
1st resistance: 1.1771
Supporting reasons: Identified as an overlap resistance, indicating a potential level that could cap further upward movement.

Potential Direction: Bearish
Overall momentum of the chart: Bullish
The price could see a short-term pullback toward the pivot before continuing its bearish move down toward the 1st support
Pivot: 184.76
Supporting reasons: Identified as an overlap resistance that aligns with the 50% Fibonacci retracement, where selling pressures could intensify and potentially cap any upward retracement.
1st support: 182.74
Supporting reasons: Identified as an overlap support, indicating a potential area where the price could again stabilize.
1st resistance: 186.23
Supporting reasons: Identified as a swing high resistance that aligns with the 78.6% Fibonacci retracement, indicating a potential level that could cap further upward movement.

Potential Direction: Bearish
Overall momentum of the chart: Bullish
The price could see a short-term pullback toward the pivot before continuing its bearish move down toward the 1st support.
Pivot: 0.8653
Supporting reasons: Identified as a pullback resistance that aligns with the 61.8% Fibonacci retracement, where selling pressures could intensify and potentially cap any upward retracement.
1st support: 0.8617
Supporting reasons: Identified as an overlap support, indicating a potential area where the price could stabilize once more.
1st resistance: 0.8676
Supporting reasons: Identified as an overlap resistance, indicating a potential level that could cap further upward movement.

Potential Direction: Bearish
Overall momentum of the chart: Bullish
The price could see a short-term pullback toward the pivot before continuing its bearish move down toward the 1st support.
Pivot:1.3589
Supporting reasons: Identified as a pullback resistance, where selling pressures could intensify and potentially cap any upward retracement.
1st support: 1.3450
Supporting reasons: Identified as a swing low support that aligns with the 127.2% Fibonacci projection, indicating a potential area where the price could stabilize once more.
1st resistance: 1.3657
Supporting reasons: Identified as a swing high resistance, indicating a potential level that could halt further upward movement.

Potential Direction: Bearish
Overall momentum of the chart: Bullish
The price could see a short-term pullback toward the pivot before continuing its bearish move down toward the 1st support.
Pivot: 214.04
Supporting reasons: Identified as an overlap resistance, where selling pressures could intensify and potentially cap any upward retracement.
1st support: 211.43
Supporting reasons: Identified as an overlap support, indicating a potential level where the price could stabilize once more.
1st resistance: 214.90
Supporting reasons: Identified as a pullback resistance, indicating a potential level that could halt further upward movement.

Potential Direction: Bearish
Overall momentum of the chart: Bearish
The price could see a short-term pullback toward the pivot before continuing its bearish move down toward the 1st support.
Pivot: 0.7869
Supporting reasons: Identified as a pullback resistance that aligns with the 61.8% Fibonacci retracement, where selling pressures could intensify and potentially cap any upward retracement.
1st support: 0.7775
Supporting reasons: Identified as a swing low support, indicating a potential level where the price could stabilize once again.
1st resistance: 0.7917
Supporting reasons: Identified as an overlap resistance, indicating a potential level that could cap further upward movement.

Potential Direction: Bearish
Overall momentum of the chart: Bullish
The price could see a short-term pullback toward the pivot before continuing its bearish move down toward the 1st support.
Pivot: 157.88
Supporting reasons: Identified as a pullback resistance that aligns with the 38.2% Fibonacci retracement, where selling pressures could intensify and potentially cap any upward retracement.
1st support: 155.63
Supporting reasons: Identified as a swing low support, indicating a strong area where buyers might return, and the price could stabilize once again.
1st resistance: 159.04
Supporting reasons: Identified as a resistance that aligns with the 61.8% Fibonacci retracement. This level represents the next key area where upward movement could be capped amid increased selling pressure

Potential Direction: Bearish
Overall momentum of the chart: Bullish
The price could see a short-term pullback toward the pivot before continuing its bearish move down toward the 1st support
Pivot: 1.3641
Supporting reasons: Identified as a pullback resistance, where selling pressures could intensify and potentially cap any upward retracement.
1st support: 1.3550
Supporting reasons: Identified as a swing low support, indicating a key level where the price could stabilize once more.
1st resistance: 1.3704
Supporting reasons: Identified as a pullback resistance, making it a possible target for bullish advances and a level where some sellers could return to cap gains

Potential Direction: Bullish
Overall momentum of the chart: Bullish
The price could see a short-term bullish breakout the pivot toward the 1st resistance.
Pivot: 0.7207
Supporting reasons: Identified as a pullback support, where renewed buying pressure could emerge to push the price higher.
1st support: 07150
Supporting reasons: Identified as a pullback support, this area has provided strong support historically and may attract buying interest for a potential short-term bounce
1st resistance: 0.7262
Supporting reasons: Identified as a resistance that aligns with the 161.8% Fibonacci retracement, indicating a potential area that could halt any further upward movement.

Potential Direction: Neutral
Overall momentum of the chart: Bullish
The price could move sideways, fluctuating between the 1st support and 1st resistance
1st support: 0.5813
Supporting reasons: Identified as a swing low support, this area has provided strong support historically and may attract buying interest for a potential short-term bounce
1st resistance: 0.5920
Supporting reasons: Identified as a multi-swing high resistance, indicating a potential area that could halt any further upward movement.

Potential Direction: Bearish
Overall momentum of the chart: Bullish
The price could see a short-term pullback toward the pivot before continuing its bearish move down toward the 1st support
Pivot: 49,591.30
Supporting reasons: Identified as a pullback resistance that aligns with the 61.8% Fibonacci retracement, where selling pressures could intensify and potentially cap any upward retracement.
1st support: 48,597.10
Supporting reasons: Identified as an overlap support, suggesting a potential area where the price could stabilize once again.
1st resistance: 49,992.10
Supporting reasons: Identified as a swing high resistance, indicating a potential area that could halt any further upward movement.

Potential Direction: Bullish
Overall momentum of the chart: Bullish
The price has already bounced off the pivot and may continue its bullish move toward the 1st resistance
Pivot: 23,884.20
Supporting reasons: Identified as an overlap support, where renewed buying pressure could emerge to push the price higher.
1st support: 23,407.60
Supporting reasons: Identified as a pullback support, indicating a key level where the price could stabilize once more.
1st resistance: 24,649.60
Supporting reasons: Identified as an overlap resistance, indicating a potential area that could halt any further upward movement.

Potential Direction: Bullish
Overall momentum of the chart: Bullish
The price could see a short-term pullback toward the pivot before rising again toward the 1st resistance.
Pivot: 7,270.00
Supporting reasons: Identified as an overlap support, where renewed buying pressure could emerge to push the price higher.
1st support: 7,179.02
Supporting reasons: Identified as an overlap support, indicating a potential level where the price could stabilize once again.
1st resistance: 7,329.28
Supporting reasons: Identified as a resistance that aligns with the 161.8% Fibonacci extension, indicating a potential area that could halt any further upward movement.

Potential Direction: Bullish
Overall momentum of the chart: Bearish
The price could see a short-term pullback toward the pivot before rising again toward the 1st resistance.
Pivot: 79,508.18
Supporting reasons: Identified as a pullback support, where renewed buying pressure could emerge to push the price higher.
1st support: 77,288.07
Supporting reasons: Identified as a pullback support, indicating a potential level where the price could stabilize once more.
1st resistance: 87,549.37
Supporting reasons: Identified as a resistance that aligns with the 161.8% Fibonacci extension, indicating a potential area that could halt any further upward movement.

Potential Direction: Bullish
Overall momentum of the chart: Bullish
The price has already bounced off the pivot and may continue its bullish move toward the 1st resistance
Pivot: 2,325.37
Supporting reasons: Identified as an overlap support, where renewed buying pressure could emerge to push the price higher.
1st support: 2,266.96
Supporting reasons: Identified as an overlap support, indicating a potential level where the price could stabilize once more.
1st resistance: 2,449.22
Supporting reasons: Identified as a swing high resistance, indicating a potential area that could halt any further upward movement.

Potential Direction: Bearish
Overall momentum of the chart: Bullish
The price could see a short-term pullback toward the pivot before continuing its bearish move down toward the 1st support
Pivot: 101.24
Supporting reasons: Identified as a pullback resistance, where selling pressures could intensify and potentially cap any upward retracement.
1st support: 94.89
Supporting reasons: Identified as aa pullback support, indicating a key level where the price could stabilize once more.
1st resistance: 110.90
Supporting reasons: Identified as a swing high resistance, indicating a potential area that could halt any further upward movement.

Potential Direction: Bullish
Overall momentum of the chart: Bullish
The price could see a short-term pullback toward the pivot before rising again toward the 1st resistance.
Pivot: 4560.42
Supporting reasons: Identified as a pullback support, where renewed buying pressure could emerge to push the price higher.
1st support: 4,510.30
Supporting reasons: Identified as a pullback support, indicating a key level where the price could stabilize once more.
1st resistance: 4,672.68
Supporting reasons: Identified as an overlap resistance, indicating a potential area that could halt any further upward movement.

The accuracy, completeness and timeliness of the information contained on this site cannot be guaranteed. IC Markets Global does not warranty, guarantee or make any representations, or assume any liability regarding financial results based on the use of the information in the site.
News, views, opinions, recommendations and other information obtained from sources outside of www.icmarkets.com, used in this site are believed to be reliable, but we cannot guarantee their accuracy or completeness. All such information is subject to change at any time without notice. IC Markets Global assumes no responsibility for the content of any linked site.
The fact that such links may exist does not indicate approval or endorsement of any material contained on any linked site. IC Markets Global is not liable for any harm caused by the transmission, through accessing the services or information on this site, of a computer virus, or other computer code or programming device that might be used to access, delete, damage, disable, disrupt or otherwise impede in any manner, the operation of the site or of any user’s software, hardware, data or property.
The post Wednesday 6th May 2026: Technical Outlook and Review first appeared on IC Your Trading Edge | Official Blog.
430177 May 6, 2026 16:00 ICMarkets Market News
South Korea’s Kospi surged to another record high on Wednesday as Asia-Pacific markets traded mostly higher, following overnight gains on Wall Street driven by easing oil prices and upbeat corporate earnings.
Investor sentiment improved after U.S. President Donald Trump signaled that diplomatic discussions surrounding the Middle East conflict were progressing. Trump announced that “Project Freedom,” the U.S. operation guiding commercial vessels through the Strait of Hormuz, would be temporarily paused while negotiations continue.
The U.S. military had begun escorting ships through the vital waterway earlier this week after disruptions linked to tensions involving Iran. Defense Secretary Pete Hegseth confirmed that two U.S. commercial ships, accompanied by American destroyers, had safely passed through the strait.
Oil prices declined as concerns over supply disruptions eased. West Texas Intermediate crude futures dropped 1.45% to $100.79 per barrel, while Brent crude futures fell 1.40% to $108.33.
South Korea’s Kospi jumped 5.56%, extending gains of more than 70% this year. Technology giants Samsung Electronics and SK Hynix both reached record highs. China’s CSI 300 rose 0.71%, while Australia’s S&P/ASX 200 gained 0.58%. Hong Kong markets were mostly flat, and Japan remained closed for a holiday. Meanwhile, U.S. stock futures also edged higher.
The post Wednesday 6th May 2026: Asia Markets Rise as Kospi Hits Record High, Oil Prices Ease Amid Hormuz Talks first appeared on IC Your Trading Edge | Official Blog.
430173 May 6, 2026 15:40 ICMarkets Market News
US Stocks Rise as Ceasefire Holds – Nasdaq up 1%
US equities rallied in the latest session as markets took confidence from a fragile ceasefire in the Middle East that continues to hold, despite ongoing reports of intermittent missile strikes across the region. The improvement in risk sentiment saw the Dow Jones rise 0.73% to 49,298, the S&P 500 gain 0.81% to 7,259, and the Nasdaq outperform with a 1.03% advance to 25,326. In fixed income markets, US Treasury yields eased modestly, with the 2-year yield falling 1.2 basis points to 3.940% and the 10-year yield declining 1.4 basis points to 4.424%. In currency markets, the US dollar traded in a choppy range but ultimately finished little changed, edging just 0.02% higher to 98.48. Commodities saw some divergence on the session. Oil prices moved lower on hopes that geopolitical tensions may not escalate further, although they remain at elevated levels overall. Brent crude fell 3.56% to $110.37, while WTI declined 3.90% to $102.37. In contrast, gold prices pushed higher, rising 0.79% to $4,556.04, as underlying uncertainty continues to underpin demand for safe-haven assets.
US Jobs Data in Focus for Fundamentals this Week
Geopolitical updates have again been dominating market commentary this week, as markets swing on a daily and sometimes hourly basis depending on sentiment from the latest updates on the Middle East. However, some crucial US data could be slipping by that could have a significant effect on markets further down the track. US jobs numbers are being released throughout the week, culminating in the blue-riband Non-Farms numbers on Friday, and there are some concerns that if they come in strongly, indicating a resilient employment picture in the US, then we may be wiping the prospect of Fed rate cuts off the table. Inflation concerns have been front of mind for many in terms of Fed thinking, with the war with Iran pushing out rate cut expectations. However, if the jobs numbers combine with sticky inflation, we could see some strong moves in markets in the coming months, with yields remaining elevated and the dollar pushing higher.
Geopolitics to Dominate Trading Sessions Again Today
Looking ahead, the economic calendar is relatively quiet, which is likely to keep market focus firmly on geopolitical developments—particularly any updates out of the Gulf region. We have already seen some data out early in the Asian session, with New Zealand employment data coming in close to expectations: the quarterly change coming in lower than expected, but the unemployment rate also dipping by 0.1% to 5.3%, showing a slight improvement. Later in the day, the focus will remain on the Land of the Long White Cloud, with the RBNZ Governor set to speak from Wellington. The London session has very little of note on the calendar today; however, we do have another US jobs update shortly after the New York open. This time, the ADP Non-Farm Employment Change numbers are due out, with the market expecting a 118k rise last month. Ivey PMI data (exp. 49.9) is due out of Canada later in the day, and we are also set to hear from several central bankers, including the Fed’s Alberto Musalem and Austan Goolsbee, as well as Bank of Canada Governor Tiff Macklem, towards the end of the day.
Explore all upcoming market events in the Economic Calendar.
The post General Market Analysis – 06/05/26 first appeared on IC Your Trading Edge | Official Blog.
430172 May 6, 2026 15:40 ICMarkets Market News
IC Markets Global – Asia Fundamental Forecast | 06 May 2026
What happened in the U.S. session?
The March trade balance data release overshadowed by US-Iran clashes in the Hormuz Strait, propelling oil prices to multi-month highs around $113/bbl for Brent and sparking broad risk-off moves U.S. stocks dipped (S&P 500 -0.4%, Dow -1.1%), Treasury yields jumped toward cycle peaks, VIX rose 7.65%, and the USD firmed, with energy the sole equity bright spot amid looming inflation and Fed rate-cut repricing ahead of upcoming ISM Services and JOLTS data.
What does it mean for the Asia Session?
Renewed Middle‑East headlines out of the Strait of Hormuz, which continue to drive oil volatility and risk‑off sentiment; they should also monitor the RBA policy‑cycle narrative in AUD pairs, yen‑intervention risks at the Bank of Japan, and any tweaks in Chinese growth‑support messaging, as these macro drivers will likely dictate intraday swings in FX, energy, and regional equities.
The Dollar Index (DXY)
Key news events today
ADP Non-Farm Employment Change (12:15 pm GMT)
What can we expect from DXY today?
The US Dollar showed modest resilience around the 98 level, amid ongoing Middle East tensions, including the Strait of Hormuz crisis and US-Iran conflict, which continue to influence safe-haven flows and oil prices. Recent data highlighted a rebound in US Q1 GDP growth to 2% annualized, supported by 1.6% consumer spending gains and multi-decade low jobless claims, though the Federal Reserve held rates steady at 3.75% with internal policy divisions noted.
Central Bank Notes:
Next 24 Hours Bias
Weak Bullish
Gold (XAU)
Key news events today
ADP Non-Farm Employment Change (12:15 pm GMT)
What can we expect from Gold today?
Gold today is trading with a cautious bullish bias, supported by geopolitical tension, safe-haven flows, and continued institutional demand, but capped by a firm dollar, higher yields, and technical selling pressure. In plain terms, buyers still have reasons to stay in the market, but they need a stronger breakout above nearby resistance to turn this rebound into a more convincing rally.
Next 24 Hours Bias
Weak Bearish
The Australian Dollar (AUD)
Key news events today
No major news event
What can we expect from AUD today?
The Australian Dollar (AUD) saw mixed movements, following the Reserve Bank of Australia’s (RBA) widely expected 25 basis point rate hike to 4.35% on May 5, which marked the third consecutive increase in 2026 amid persistent inflation pressures at 4.6% headline CPI.
Central Bank Notes:
Next 24 Hours Bias
Medium Bullish
The Kiwi Dollar (NZD)
Key news events today
No major news event
What can we expect from NZD today?
The NZD/USD hovers near 0.588 amid subdued activity, pressured by USD strength from Mideast tensions and surging oil prices that fuel inflation worries, while RBNZ’s accommodative policy outlook, despite sticky 3.1% inflation, delays tightening expectations until late 2026; technicals suggest potential downside below 0.5805 if support breaks.
Central Bank Notes:
Next 24 Hours Bias
Weak Bullish
The Japanese Yen (JPY)
Key news events today
No major news event
What can we expect from JPY today?
Japan’s authorities have warned against speculative selling, the market believes they may have already spent around $35 billion defending the currency, and USD/JPY is now holding in the 157 area while traders wait to see whether Tokyo acts again. The yen has found some short-term support, but the broader backdrop still favors the dollar unless Japanese officials deliver another forceful intervention or the U.S.-Japan rate gap starts narrowing.
Central Bank Notes:
Next 24 Hours Bias
Strong Bearish
Oil
Key news events today
EIA Crude Oil Inventories ( 2:30 pm GMT)
What can we expect from Oil today?
Oil markets remain volatile, driven by ongoing tensions in the Strait of Hormuz amid the US-Iran conflict, with WTI crude holding around $102-$105 per barrel and Brent near $114 after recent gains. Fuel prices are spiking globally, including sharp hikes in South Africa (petrol up R3.27/litre, diesel R6.19/litre effective today) due to sustained high crude costs and currency pressures.
Next 24 Hours Bias
Strong Bullish
The post IC Markets Global – Asia Fundamental Forecast | 06 May 2026 first appeared on IC Your Trading Edge | Official Blog.
430146 May 5, 2026 17:40 ICMarkets Market News

The post Ex-Dividend 06/05/2026 first appeared on IC Your Trading Edge | Official Blog.