429742 April 22, 2026 14:40 ICMarkets Market News
US Stocks Drop as Uncertainty Reigns in the Gulf – Dow down 0.6%
US equity markets came under pressure in the latest session, with all three major indices closing lower as investors continued to digest ongoing developments out of the Middle East. The Dow Jones fell -0.59% to 49,149, while the S&P 500 declined -0.63% to 7,064, and the Nasdaq slipped -0.59% to 24,259. Sentiment remained cautious despite President Trump extending the ceasefire while talks with Iran continue, with the ongoing US naval blockade and lack of progress on returning to formal negotiations keeping uncertainty elevated. In currency markets, the US dollar strengthened, with the DXY index rising 0.30% to 98.39, supported by higher Treasury yields across the curve. The US 2-year yield climbed 5.8 basis points to 3.779%, while the 10-year yield added 4.1 basis points to 4.292%, reflecting a modest repricing of rate expectations alongside safe-haven flows into the greenback. Commodity markets saw continued volatility, particularly in energy. Brent crude rose 3.81% to $99.22, pushing closer to the key $100 level, while WTI gained 2.81% to $92.13, as supply concerns tied to the Gulf region persisted. In contrast, gold prices moved sharply lower, falling 2.08% to $4,720.04, as the stronger dollar and rising yields weighed on the precious metal despite the geopolitical backdrop.
FX Traders Poised for More Volatility
Major FX markets have been relatively well behaved over the last few sessions as traders continue to assess updates on how things are going to shape up in the Middle East in the short term. The pattern is clearly set: anything that looks like a continuation of the conflict and the Strait of Hormuz remaining shut will see the USD appreciate, while signs of peace and a move back to ‘normal’ will see the USD pull back. Reactions to recent updates, however, have been more muted, with a certain amount of news fatigue creeping into the market, and now traders are expecting to see bigger moves once we have certainty surrounding key points. Last night’s updates saw some reaction, with President Trump again reneging on prior advice, but now we are waiting to see if the two sides will actually come back to the negotiating table or whether we hear the sound of war drums again. Either way, traders are expecting to see the majors break out of recent relatively tight ranges and volatility increase again.
Geopolitics to Dominate the Trading Day Again
Looking ahead, the macroeconomic calendar is relatively light today, though attention will turn to a couple of key data drops and some central bank updates, in between traders monitoring the news wires for updates on the Middle East. There is very little on the calendar in the Asian session, and markets are expected to start on the back foot after the drop on Wall Street yesterday, with any signs that negotiations in the Gulf are still delayed likely to lead to further downside moves. The London session sees the major data release of the day, with key CPI (exp +3.3% y/y and +0.6% m/m) data due out alongside the lower-impact PPI (exp +2.9% m/m) numbers. The US session is quiet on the data front, although the Weekly US Crude Oil Inventory data will attract attention, as will a scheduled speech from ECB President Christine Lagarde.
The post General Market Analysis – 22/04/26 first appeared on IC Your Trading Edge | Official Blog.
429741 April 22, 2026 14:40 ICMarkets Market News
IC Markets Global – Asia Fundamental Forecast | 22 April 2026
What happened in the U.S. session?
Continued political monetary‑policy noise around the confirmation of Fed nominee Kevin Warsh and incremental signs of softening U.S. consumer strength, rather than a major fresh data release driving big moves. Markets also absorbed a slightly more cautious tone on the consumer (with higher gas prices and spending fatigue noted by firms like Goldman Sachs) at the same time that some large banks reiterated bullish stances on equities underpinned by AI‑driven earnings.
What does it mean for the Asia Session?
Asian traders should closely monitor the aftermath of the People’s Bank of China (PBOC) interest rate decision from earlier in the week, expected to hold steady at 3.00%, alongside escalating Middle East tensions around the Strait of Hormuz where Iran has reversed reopening plans amid US-Iran disputes and Trump’s refusal to lift blockades, driving oil prices (WTI near $93) higher and boosting volatility in commodities like gold.
The Dollar Index (DXY)
Key news events today
No major news event
What can we expect from DXY today?
The US dollar is consolidating after a recent bounce, with the Dollar Index holding near the high‑90s as traders balance signs of softer US labour data against persistent geopolitical risk and still‑attractive US interest‑rate differentials. Central banks in markets from Ukraine to Uzbekistan are adjusting their official dollar reference rates, underlining ongoing FX volatility.
Central Bank Notes:
Next 24 Hours Bias
Medium Bullish
Gold (XAU)
Key news events today
No major news event
What can we expect from Gold today?
Gold prices have shown consolidation around the $4,760–$4,880 range as of late April 22, 2026, following recent fluctuations driven by a stronger US dollar, inflation concerns from Middle East tensions, and reduced expectations for Federal Reserve rate cuts. Spot gold hovered near $4,807–$4,833 per ounce in the days leading up to today, with modest gains earlier in the week but pullbacks amid higher oil prices and geopolitical risks in the Strait of Hormuz.
Next 24 Hours Bias
Strong Bullish
The Australian Dollar (AUD)
Key news events today
No major news event
What can we expect from AUD today?
The Australian Dollar (AUD) has been trading near four-year highs around 0.71-0.72 against the USD as of late last week, driven by improving global risk sentiment and hopes for de-escalation in Middle East tensions, including US-Iran talks under President Trump. On April 21, 2026, it faced a critical test at key resistance after rallying over 5% from March lows, with AUD/USD hovering near 0.7157 amid ongoing monitoring of the conflict’s impact on energy prices and commodity demand.
Central Bank Notes:
Next 24 Hours Bias
Medium Bullish
The Kiwi Dollar (NZD)
Key news events today
No major news event
What can we expect from NZD today?
The NZD held near recent highs around 0.5916 after a 0.40% uptick driven by strong Q1 CPI prints, but remained pinned below 0.5925 due to clashing forces of Middle East geopolitical risks bolstering USD and dovish RBNZ expectations limiting aggressive hikes. With a quiet economic calendar, traders eyed USD weakness and global risk appetite for near-term direction, projecting NZD/USD toward 0.57-0.59 in the coming quarters.
Central Bank Notes:
Next 24 Hours Bias
Medium Bearish
The Japanese Yen (JPY)
Key news events today
No major news event
What can we expect from JPY today?
The yen is trading in a fragile, consolidation‑prone range after a brief rebound from its weakest levels, underpinned by heightened intervention rhetoric and modest expectations of future BoJ tightening, but still facing structural headwinds from the large U.S.–Japan rate differential and strong dollar positioning in global markets.
Central Bank Notes:
Next 24 Hours Bias
Strong Bearish
Oil
Key news events today
EIA Crude Oil Inventories (2:30 pm GMT)
What can we expect from Oil today?
Oil markets show continued volatility amid geopolitical tensions in the Middle East, particularly around the Strait of Hormuz, with prices stabilizing after recent swings. Brent crude settled around $98 per barrel on April 21, reflecting a modest 2.71% daily gain but down slightly over the prior month amid ceasefire talks between the US and Iran. OPEC+ plans a gradual output hike of 206,000 barrels per day starting this month, responding to tighter supplies and economic recovery signals, with their next review set for early April.
Next 24 Hours Bias
Strong Bullish
The post IC Markets Global – Asia Fundamental Forecast | 22 April 2026 first appeared on IC Your Trading Edge | Official Blog.
429711 April 21, 2026 17:41 ICMarkets Market News

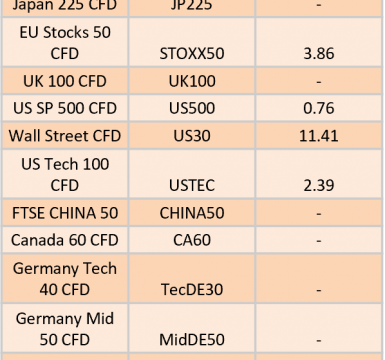
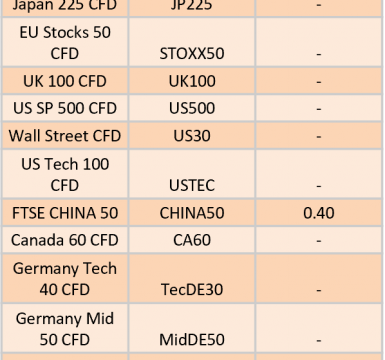
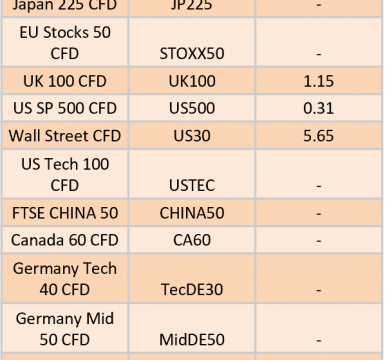
The post Ex-Dividend 22/04/2026 first appeared on IC Your Trading Edge | Official Blog.
429710 April 21, 2026 16:40 ICMarkets Market News
Asia-Pacific markets traded mixed on Tuesday as investors weighed cautious optimism over a possible resolution to the Middle East conflict against continuing tensions between Iran and the United States. Iran’s parliament speaker Mohammad Bagher Ghalibaf accused President Donald Trump of undermining the ceasefire and attempting to pressure Tehran into concessions, saying Iran would not negotiate under threats and had prepared additional strategic responses if needed.
His remarks followed Trump’s warning that “lots of bombs” could be used if a deal is not reached before the fragile ceasefire expires Tuesday evening, raising concerns about renewed military escalation. The warning came even as a U.S. delegation prepared to return to Pakistan for a potential second round of peace talks.
Despite geopolitical uncertainty, investors remained broadly optimistic about equities. Wells Fargo chief equity strategist Ohsung Kwon said the economic outlook for the next three months appeared stable.
Oil prices declined slightly, with West Texas Intermediate falling 1.14% and Brent crude dropping 0.59%. Regional markets were mixed: South Korea’s Kospi rose 2.22%, Japan’s Nikkei 225 gained 1.21%, while Australia’s S&P/ASX 200 slipped 0.28%. Hong Kong’s Hang Seng edged higher, though mainland China’s CSI 300 fell.
U.S. futures rose modestly after Wall Street closed slightly lower overnight, ending the Nasdaq’s 13-day winning streak.
The post Tuesday 21st April 2026: Asia-Pacific Markets Mixed as Iran–U.S. Tensions Persist Despite Ceasefire Hopes first appeared on IC Your Trading Edge | Official Blog.
429708 April 21, 2026 16:00 ICMarkets Market News
IC Markets Global – Europe Fundamental Forecast | 21 April 2026
What happened in the Asia session?
Today’s Asia session was shaped more by the recalibration of Middle‑East premium risk than by a heavy slate of intraday data: fading expectation of a prolonged escalation into a full‑scale oil‑shock environment pulled Brent down and gold into a consolidation range, while the dollar softened slightly and oil‑linked currencies such as NOK and growth‑sensitive EM‑Asia FX found modest support.
What does it mean for the Europe & US sessions?
Traders should monitor escalating U.S.-Iran tensions, including Strait of Hormuz disruptions and ceasefire talks, which are driving oil prices higher (Brent above $95/bbl) while pressuring equities and the dollar. U.S. stocks like the S&P 500 dipped 0.2% yesterday amid these risks, snapping rallies, with Apple CEO Tim Cook’s resignation adding to corporate volatility. European and U.S. sessions today face sticky inflation signals boosting currencies like NZD, potential Fed rate cut speculation (targeting 3.25-3.50% early 2026), and broader market hopes for de-escalation.
The Dollar Index (DXY)
Key news events today
Core Retail Sales m/m (12:30 pm GMT)
Retail Sales m/m (12:30 pm GMT)
Fed Chairman-Designate Warsh Testifies (2:00 pm GMT)
Pending Home Sales m/m (2:00 pm GMT)
What can we expect from DXY today?
The US dollar traded in a volatile range near DXY 100, rebounding modestly from recent lows driven by persistent US-Iran tensions, higher oil prices boosting US terms-of-trade, and steady Fed policy expectations, though peace deal optimism and open Strait of Hormuz reports capped gains against majors like EUR (near $1.18) and GBP ($1.3569).
Central Bank Notes:
Next 24 Hours Bias
Medium Bearish
Gold (XAU)
Key news events today
Core Retail Sales m/m (12:30 pm GMT)
Retail Sales m/m (12:30 pm GMT)
Fed Chairman-Designate Warsh Testifies (2:00 pm GMT)
Pending Home Sales m/m (2:00 pm GMT)
What can we expect from Gold today?
Gold is edging modestly lower, trading near 4,828 USD per ounce as investors balance ongoing West Asian geopolitical tensions against a calmer ceasefire backdrop and firmer US yields, which are capping safe‑haven demand. Spot prices remain well above year‑ago levels but are consolidating after a surge to record highs earlier in 2026, with markets currently focused on volatility and range‑bound action between roughly 4,760 and 4,880 USD/oz rather than a fresh breakout.
Next 24 Hours Bias
Medium Bullish
The Euro (EUR)
Key news events today
No major news event
What can we expect from EUR today?
The euro’s latest story is mainly about the currency market: EUR/USD has been drifting lower or struggling to sustain gains, as investors favor the dollar in a risk-sensitive environment and wait for clearer signals from central banks and macro data. In Europe’s wider news flow, headlines include an EU-Israel agreement call from the European Left Alliance, Spain’s migrant regularisation drive, Turkey’s security arrests, and Eurostat’s upcoming data releases, all of which add to the broader policy backdrop around the euro area.
Central Bank Notes:
The next meeting is on 29 April 2026
Next 24 Hours Bias
Medium Bearish
The Swiss Franc (CHF)
Key news events today
No major news event
What can we expect from CHF today?
The Swiss Franc maintains its safe-haven appeal amid volatile global markets, with minor declines against select currencies like the Iranian Rial but expectations of strengthening versus the Euro based on corporate surveys and prior trends; traders eye broader USD weakness and upcoming inflation data for directional cues.
Central Bank Notes:
The next meeting is on 18 June 2026.
Next 24 Hours Bias
Medium Bearish
The Pound (GBP)
Key news events today
Claimant Count Change (6:00 am GMT)
Average Earnings Index 3m/y (6:00 am GMT)
What can we expect from GBP today?
Today’s pound news is dominated by upcoming UK macro data rather than a single surprise headline. Sterling remains firm against the dollar but less convincing against the euro, with traders focused on today’s employment figures and, more importantly, Wednesday’s inflation report, which will likely set the tone for the pound into the Bank of England meeting.
Central Bank Notes:
Next 24 Hours Bias
Medium Bullish
The Canadian Dollar (CAD)
Key news events today
No major news event
What can we expect from CAD today?
The Canadian dollar (CAD) shows resilience amid broader USD weakness on April 21, 2026. Recent reports indicate it hit a 4-week high near 1.37 against the USD last week, driven by a depreciating DXY index and favorable commodity sentiment, though oil price fluctuations tied to Middle East de-escalation talks remain a key influence.
Central Bank Notes:
Next 24 Hours Bias
Weak Bearish
Oil
Key news events today
API Crude Oil Stock (8:30 pm GMT)
What can we expect from Oil today?
Oil markets are trading softer but remain highly volatile, as geopolitical headlines around the Strait of Hormuz and US–Iran diplomacy continue to dominate price action. Brent crude slipped below 95 dollars per barrel after a strong prior‑week rally, while WTI hovers around the mid‑80s, reflecting profit‑taking and cautious positioning ahead of renewed conflict or ceasefire developments.
Next 24 Hours Bias
Strong Bullish
The post IC Markets Global – Europe Fundamental Forecast | 21 April 2026 first appeared on IC Your Trading Edge | Official Blog.
429689 April 21, 2026 16:00 ICMarkets Market News
Potential Direction: Bearish
Overall momentum of the chart: Bearish
The price could see a short-term pullback toward the pivot before continuing its bearish move down toward the 1st support.
Pivot: 98.57
Supporting reasons: Identified as a pullback resistance, where selling pressures could intensify and potentially cap any upward retracement.
1st support: 97.50
Supporting reasons: Identified as an overlap support, indicating a potential area where the price could again stabilize.
1st resistance: 99.35
Supporting reasons: Identified as a pullback resistance, indicating a potential area that could halt any further upward movement

Potential Direction: Bullish
Overall momentum of the chart: Bullish
The price could see a short-term pullback toward the pivot before rising again toward the 1st resistance.
Pivot: 1.1721
Supporting reasons: Identified as a pullback support, where renewed buying pressure could emerge to push the price higher.
1st support: 1.1655
Supporting reasons: Identified as an overlap support, indicating a potential level where the price could stabilize once again.
1st resistance: 1.1851
Supporting reasons: Identified as an overlap resistance, indicating a potential level that could cap further upward movement.

Potential Direction: Bullish
Overall momentum of the chart: Bullish
The price could see a short-term pullback toward the pivot before rising again toward the 1st resistance.
Pivot: 186.20
Supporting reasons: Identified as a pullback support, where renewed buying pressure could emerge to push the price higher.
1st support: 184.68
Supporting reasons: Identified as an overlap support, indicating a potential area where the price could again stabilize.
1st resistance: 189.75
Supporting reasons: Identified as a s resistance that aligns with the 161.8% Fibonacci extension, indicating a potential level that could cap further upward movement.

Potential Direction: Bullish
Overall momentum of the chart: Bullish
The price could see a short-term pullback toward the pivot before rising again toward the 1st resistance.
Pivot: 0.8679
Supporting reasons: Identified as an overlap support, where renewed buying pressure could emerge to push the price higher.
1st support: 0.8660
Supporting reasons: Identified as an overlap support, indicating a potential area where the price could stabilize once more.
1st resistance: 0.8721
Supporting reasons: Identified as a swing high resistance, indicating a potential level that could cap further upward movement.

Potential Direction: Bullish
Overall momentum of the chart: Bullish
The price could see a short-term pullback toward the pivot before rising again toward the 1st resistance.
Pivot: 1.3478
Supporting reasons: Identified as a pullback support, where renewed buying pressure could emerge to push the price higher.
1st support: 1.3345
Supporting reasons: Identified as a pullback support, indicating a potential area where the price could stabilize once more.
1st resistance: 1.3598
Supporting reasons: Identified as a pullback resistance, indicating a potential level that could halt further upward movement.

Potential Direction: Bullish
Overall momentum of the chart: Bullish
The price could see a short-term pullback toward the pivot before rising again toward the 1st resistance.
Pivot: 213.30
Supporting reasons: Identified as a pullback support, where renewed buying pressure could emerge to push the price higher.
1st support: 211.47
Supporting reasons: Identified as a pullback support, indicating a potential level where the price could stabilize once more.
1st resistance: 215.72
Supporting reasons: Identified as a resistance that aligns with the 161.8% Fibonacci extension, indicating a potential level that could halt further upward movement.

Potential Direction: Bearish
Overall momentum of the chart: Bearish
The price has already reacted off the pivot and may continue its bearish move toward the 1st support.
Pivot: 0.7846
Supporting reasons: Identified as an overlap resistance, where selling pressures could intensify and potentially cap any upward retracement.
1st support: 0.7763
Supporting reasons: Identified as an overlap support, indicating a potential level where the price could stabilize once again.
1st resistance: 0.7918
Supporting reasons: Identified as an overlap resistance, indicating a potential level that could cap further upward movement.

Potential Direction: Bearish
Overall momentum of the chart: Bullish
The price could see a short-term pullback toward the pivot before continuing its bearish move down toward the 1st support.
Pivot: 159.85
Supporting reasons: Identified as an overlap resistance, where selling pressures could intensify and potentially cap any upward retracement.
1st support: 157.66
Supporting reasons: Identified as an overlap support, indicating a strong area where buyers might return, and the price could stabilize once again.
1st resistance: 160.46
Supporting reasons: Identified as an overlap resistance. This level represents the next key area where upward movement could be capped amid increased selling pressure

Potential Direction: Bearish
Overall momentum of the chart: Bullish
The price has already reacted off the pivot and may continue its bearish move toward the 1st support.
Pivot: 1.3740
Supporting reasons: Identified as an overlap resistance, where selling pressures could intensify and potentially cap any upward retracement.
1st support: 1.3594
Supporting reasons: Identified as a pullback support, indicating a key level where the price could stabilize once more.
1st resistance: 1.3806
Supporting reasons: Identified as a pullback resistance, making it a possible target for bullish advances and a level where some sellers could return to cap gains

Potential Direction: Bullish
Overall momentum of the chart: Bullish
The price could see a short-term pullback toward the pivot before rising again toward the 1st resistance.
Pivot: 0.7089
Supporting reasons: Identified as a pullback support, where renewed buying pressure could emerge to push the price higher.
1st support: 0.6999
Supporting reasons: Identified as an overlap support, this area has provided strong support historically and may attract buying interest for a potential short-term bounce
1st resistance: 0.7210
Supporting reasons: Identified as a swing high resistance, indicating a potential area that could halt any further upward movement.

Potential Direction: Bullish
Overall momentum of the chart: Bullish
The price could see a short-term pullback toward the pivot before rising again toward the 1st resistance.
Pivot: 0.5867
Supporting reasons: Identified as an overlap support, where renewed buying pressure could emerge to push the price higher.
1st support: 0.5777
Supporting reasons: Identified as a pullback support, this area has provided strong support historically and may attract buying interest for a potential short-term bounce
1st resistance: 0.5958
Supporting reasons: Identified as an overlap resistance, indicating a potential area that could halt any further upward movement.

Potential Direction: Bullish
Overall momentum of the chart: Bullish
The price could see a short-term pullback toward the pivot before rising again toward the 1st resistance.
Pivot: 48,770
Supporting reasons: Identified as an overlap support, where renewed buying pressure could emerge to push the price higher.
1st support: 46,578.51
Supporting reasons: Identified as a pullback support, suggesting a potential area where the price could stabilize once again.
1st resistance: 49,913.81
Supporting reasons: Identified as a pullback resistance, indicating a potential area that could halt any further upward movement.

Potential Direction: Bullish
Overall momentum of the chart: Bullish
The price could see a short-term pullback toward the pivot before rising again toward the 1st resistance.
Pivot: 24.235.98
Supporting reasons: Identified as an overlap support, where renewed buying pressure could emerge to push the price higher.
1st support: 23,418.05
Supporting reasons: Identified as a pullback support, indicating a key level where the price could stabilize once more.
1st resistance: 25,330.21
Supporting reasons: Identified as an overlap resistance, indicating a potential area that could halt any further upward movement.

Potential Direction: Bullish
Overall momentum of the chart: Bullish
The price could see a short-term pullback toward the pivot before rising again toward the 1st resistance.
Pivot: 6,964.66
Supporting reasons: Identified as a pullback support, where renewed buying pressure could emerge to push the price higher.
1st support: 6,835.91
Supporting reasons: Identified as an overlap support, indicating a potential level where the price could stabilize once again.
1st resistance: 7,191.60
Supporting reasons: Identified as a resistance that aligns with the 127.2% Fibonacci extension, indicating a potential area that could halt any further upward movement.

Potential Direction: Bullish
Overall momentum of the chart: Bearish
The price could see a short-term pullback toward the pivot before rising again toward the 1st resistance.
Pivot: 73,432.05
Supporting reasons: Identified as a pullback support, where renewed buying pressure could emerge to push the price higher.
1st support: 70,413.20
Supporting reasons: Identified as a pullback support, indicating a potential level where the price could stabilize once more.
1st resistance: 78,331.50
Supporting reasons: Identified as a swing high resistance, indicating a potential area that could halt any further upward movement.

Potential Direction: Bearish
Overall momentum of the chart: Bullish
The price could see a short-term pullback toward the pivot before continuing its bearish move down toward the 1st support.
Pivot: 2,383.52
Supporting reasons: Identified as a pullback resistance, where selling pressures could intensify and potentially cap any upward retracement.
1st support: 2,162.92
Supporting reasons: Identified as an overlap support, indicating a potential level where the price could stabilize once more.
1st resistance: 2,465.95
Supporting reasons: Identified as a swing high resistance, indicating a potential area that could halt any further upward movement.

Potential Direction: Bearish
Overall momentum of the chart: Bullish
The price has already reacted off the pivot and may continue its bearish move toward the 1st support.
Pivot: 95.50
Supporting reasons: Identified as a pullback resistance, where selling pressures could intensify and potentially cap any upward retracement.
1st support: 78.05
Supporting reasons: Identified as an overlap support, indicating a key level where the price could stabilize once more.
1st resistance: 105.53
Supporting reasons: Identified as an overlap resistance, indicating a potential area that could halt any further upward movement.

Potential Direction: Bearish
Overall momentum of the chart: Bullish
The price has already reacted off the pivot and may continue its bearish move toward the 1st support.
Pivot: 4,863.14
Supporting reasons: Identified as a pullback resistance, where selling pressures could intensify and potentially cap any upward retracement.
1st support: 4,701.11
Supporting reasons: Identified as an overlap support, indicating a key level where the price could stabilize once more.
1st resistance: 4,964.21
Supporting reasons: Identified as an overlap resistance, indicating a potential area that could halt any further upward movement.

The accuracy, completeness and timeliness of the information contained on this site cannot be guaranteed. IC Markets Global does not warranty, guarantee or make any representations, or assume any liability regarding financial results based on the use of the information in the site.
News, views, opinions, recommendations and other information obtained from sources outside of www.icmarkets.com, used in this site are believed to be reliable, but we cannot guarantee their accuracy or completeness. All such information is subject to change at any time without notice. IC Markets Global assumes no responsibility for the content of any linked site.
The fact that such links may exist does not indicate approval or endorsement of any material contained on any linked site. IC Markets Global is not liable for any harm caused by the transmission, through accessing the services or information on this site, of a computer virus, or other computer code or programming device that might be used to access, delete, damage, disable, disrupt or otherwise impede in any manner, the operation of the site or of any user’s software, hardware, data or property.
The post Tuesday 21st April 2026: Technical Outlook and Review first appeared on IC Your Trading Edge | Official Blog.
429687 April 21, 2026 15:40 ICMarkets Market News
US Stocks Drift Despite Increased Gulf Tensions – S&P off 0.24%
US equity markets closed marginally lower overnight, with investors continuing to monitor developments in the Middle East while largely brushing off ongoing geopolitical risks. The Dow Jones finished virtually unchanged, slipping just -0.01% to 49,442, while the S&P 500 declined -0.24% to 7,109, and the Nasdaq fell -0.26% to 24,404. In fixed income markets, US Treasury yields edged slightly higher, with the 2-year yield rising 1.2 basis points to 3.720% and the 10-year yield up 0.3 basis points to 4.251%. Currency markets saw mixed flows, with the US dollar initially strengthening on safe-haven demand before reversing course to eventually close marginally lower, with the DXY down 0.05% at 98.05. Commodity markets were more reactive to geopolitical tensions, particularly surrounding the ongoing closure of the Strait of Hormuz. Oil prices surged, with Brent crude climbing 4.30% to $94.27 and WTI crude rising 4.65% to $87.79, as traders priced in the risk of further supply disruptions. In contrast, gold eased slightly, slipping -0.20% to $4,820.66, as haven demand remained subdued.
Investors’ Glasses Remain ¾ Full Despite Strait Closure
Some market participants were surprised by the market’s reaction to the updates from the Middle East over the weekend. Things had been looking rosy going into the weekend, but strikes on vessels in the Strait of Hormuz and its closure, alongside the possibility of talks between the US and Iran being delayed, had markets open on the back foot yesterday. However, the downside moves were limited, with stocks in particular proving resilient despite oil prices spiking higher and remaining at elevated levels for the trading day. Attention now moves to whether any talks will take place this week, with both sides remaining cagey, and when exactly the ceasefire between the two nations is set to end – President Trump announced the two-week ceasefire on April 7, so it is set to expire sometime today. Traders are expecting another lively day, with confirmation of talks likely to lead to more relief rallies, while if hostilities resume, the muted reaction that we saw in markets yesterday is unlikely to occur again, especially if oil pushes up through the $100 level again.
Geopolitics and Data to Make for a Busy Day Ahead
Looking ahead, geopolitical developments will remain a key driver of sentiment, though focus will also turn to upcoming economic data, which should keep volatility elevated across all three trading sessions. In the Asian session, New Zealand CPI has already been released, the data printing at +0.9% q/q against the expected +0.8%, pushing expectations for a rate hike from the RBNZ to as early as July. The European session brings UK labour market data, including Claimant Count (exp 22.6k), Average Earnings Index (exp 3.6%), and the unemployment rate (exp 5.2%) early in the session, with any deviations from expectations likely to see some strong moves in the pound. In the New York session, attention will centre on retail sales data (exp +1.4% m/m) and core retail sales (exp +1.4% m/m), due out early in the day, before attention shifts to Washington, DC, and the scheduled testimony from Fed Chair-designate Kevin Warsh in front of the Senate Committee. Pending home sales data (exp 0.0% m/m) also features, and we are set to hear from the Fed’s Christopher Waller later in the day.
The post General Market Analysis – 21/04/26 first appeared on IC Your Trading Edge | Official Blog.
429686 April 21, 2026 15:40 ICMarkets Market News
IC Markets Global – Asia Fundamental Forecast | 21 April 2026
What happened in the U.S. session?
Markets were led by a mix of renewed geopolitical risk around the Iran conflict and a still‑robust macro backdrop, pushing equities and index futures modestly lower despite prior record‑high levels, while oil prices and energy‑linked assets rallied on fresh supply‑risk concerns. The U.S. dollar and Treasury yields held firm or ticked higher, reflecting safe‑haven demand and persistent yield differentials, making rate‑sensitive growth stocks, energy‑sector names, and USD crosses the most directly impacted instruments.
What does it mean for the Asia Session?
Middle‑East‑related oil and risk‑sentiment swings, fresh China trade numbers that may confirm or chill the regional export‑growth story, and Japanese industrial data feeding into BoJ‑policy expectations; together these will shape intraday direction in Asian equities, commodity‑linked FX (AUD, SGD, KRW), and local‑currency fixed‑income, with any escalation in US‑Iran tensions likely to amplify safe‑haven flows and tighten margins‑sensitive sectors.
The Dollar Index (DXY)
Key news events today
Core Retail Sales m/m (12:30 pm GMT)
Retail Sales m/m (12:30 pm GMT)
Fed Chairman-Designate Warsh Testifies (2:00 pm GMT)
Pending Home Sales m/m (2:00 pm GMT)
What can we expect from DXY today?
The US dollar maintained firmness, buoyed by safe-haven flows from Iran Strait disruptions, oil price surges, and cautious Fed policy amid sticky inflation, with DXY hovering near 100 despite some local currency adjustments like Uzbekistan’s lower official rate; analysts foresee near-term gains but longer-term softening as risks ease.
Central Bank Notes:
Next 24 Hours Bias
Medium Bearish
Gold (XAU)
Key news events today
Core Retail Sales m/m (12:30 pm GMT)
Retail Sales m/m (12:30 pm GMT)
Fed Chairman-Designate Warsh Testifies (2:00 pm GMT)
Pending Home Sales m/m (2:00 pm GMT)
What can we expect from Gold today?
Gold prices have shown resilience amid geopolitical tensions and macroeconomic shifts as of April 21, 2026. Recent trading data indicate spot gold hovering around $4,800–$4,833 per ounce, with a modest uptick following a brief stall near monthly peaks driven by US-Iran peace hopes that tempered safe-haven demand.
Next 24 Hours Bias
Medium Bullish
The Australian Dollar (AUD)
Key news events today
No major news event
What can we expect from AUD today?
The Australian Dollar (AUD) experienced a slight decline against the US Dollar, trading at around 0.7157, down 0.19% from the prior session amid renewed Middle East tensions impacting risk assets. This followed a strong recent performance, with the AUD/USD reaching four-year highs near 0.7192 earlier in the week, driven by optimism over potential US-Iran de-escalation, resilient Australian jobs data (unemployment steady at 4.3%), and China’s solid Q1 growth supporting commodity demand.
Central Bank Notes:
Next 24 Hours Bias
Medium Bullish
The Kiwi Dollar (NZD)
Key news events today
No major news event
What can we expect from NZD today?
The NZD remains range-bound below 0.5900, pressured by USD caution from US-Iran talks and contained NZ inflation (3.4% food CPI), reducing near-term RBNZ rate cut odds to just 10 basis points in Q3; no major April 21 events beyond business confidence data suggest imminent volatility, though China ties and global risk appetite will drive near-term moves.
Central Bank Notes:
Next 24 Hours Bias
Medium Bearish
The Japanese Yen (JPY)
Key news events today
No major news event
What can we expect from JPY today?
The yen holds steady but vulnerable around 159 USD amid BoJ rate hike speculation, intervention watches, and wide US-Japan yield gaps; traders await the central bank’s April 28 decision for direction, with officials signaling readiness to act against excessive weakening.
Central Bank Notes:
Next 24 Hours Bias
Medium Bearish
Oil
Key news events today
API Crude Oil Stock (8:30 pm GMT)
What can we expect from Oil today?
Oil markets remain highly volatile today, driven by ongoing uncertainties around the U.S.-Iran ceasefire and Strait of Hormuz transit issues. WTI crude closed the prior week near $83.60 after dipping toward $79, with analysts forecasting a turbulent session amid reports of slowed shipping in the strait and potential early spikes above $90 if supply fears intensify. Brent has similarly fluctuated, recently around $98, as ceasefire violations like Israel’s strikes on Lebanon stir renewed tensions despite Trump’s two-week deal.
Next 24 Hours Bias
Strong Bullish
The post IC Markets Global – Asia Fundamental Forecast | 21 April 2026 first appeared on IC Your Trading Edge | Official Blog.
429665 April 20, 2026 18:40 ICMarkets Market News
European markets opened lower Monday as renewed tensions between the United States and Iran raised concerns that a fragile ceasefire could collapse. The pan-European Stoxx 600 slipped about 0.9% in early trading, with major regional indexes also posting losses. The U.K.’s FTSE 100 declined roughly 0.4%, Germany’s DAX dropped 1.3%, France’s CAC 40 fell nearly 1.1%, and Italy’s FTSE MIB lost around 1.2%, while most sectors traded in negative territory shortly after the opening bell.
The weakness followed reports that a U.S. Navy guided-missile destroyer fired on and disabled an Iranian-flagged cargo vessel in the Gulf of Oman before Marines boarded and seized it. The move marked a further escalation after Iran reportedly targeted commercial ships attempting to pass through the same maritime route earlier on Sunday.
Since last week, Washington has enforced a naval blockade on vessels entering and leaving Iranian ports. Tehran considers the action a violation of the ceasefire and cited it as a reason for cancelling expected negotiations in Islamabad.
President Donald Trump warned that the U.S. could strike Iranian infrastructure if Tehran rejected Washington’s terms. Meanwhile, U.S. futures declined despite mixed Asia-Pacific trading, while investors awaited further geopolitical developments and policy signals.
The post Monday 20th April 2026: European Stocks Slide as U.S.–Iran Tensions Threaten Ceasefire Stability first appeared on IC Your Trading Edge | Official Blog.
429664 April 20, 2026 18:00 ICMarkets Market News
IC Markets Global – Europe Fundamental Forecast | 20 April 2026
What happened in the Asia session?
Today’s Asia session was priced heavily around the U.S.–Iran escalation story, with equities on modestly divergent moves, oil and dollar‑linked assets in focus, and Asian EM FX and rates reflecting both the immediate war‑risk shock and the longer‑term drag of higher energy prices on growth and inflation.
What does it mean for the Europe & US sessions?
Iran war’s ongoing volatility, including oil price surges from Strait of Hormuz tensions, mixed signals on ceasefires boosting U.S. stocks via “TINA” trades, and corporate updates like National Australia Bank’s $503 million impairment from Mideast risks. In macro data, watch U.S. retail sales and S&P PMI for economic health amid energy shocks, European PMIs and sentiment indices for ECB vigilance on growth/inflation risks flagged by Lagarde, and global indicators like China’s steady LPRs plus UK inflation ahead.
The Dollar Index (DXY)
Key news events today
No major news event
What can we expect from DXY today?
The US dollar rebounded firmly, hitting a one-week high near 98.5 on the DXY as Middle East flare-ups, including Hormuz disruptions, spurred safe-haven flows despite fleeting peace optimism. Sticky core inflation, rising oil costs, and Fed hawkishness versus dovish peers like the ECB and BoJ bolstered its yield appeal, pressuring EUR, GBP, AUD, and NZD lower in early trading. Traders eye upcoming data for DXY’s push above 100, amid forecasts of prolonged strength tempered by 2026’s broader uncertainties.
Central Bank Notes:
Next 24 Hours Bias
Medium Bearish
Gold (XAU)
Key news events today
No major news event
What can we expect from Gold today?
Gold is edging lower in early‑day trade, hovering around 4,760–4,830 USD/oz after a steep prior‑week rally that briefly stabilized above 4,800 as a key technical level. Safe‑haven demand linked to lingering geopolitical and inflation risks has kept prices elevated over the past month and year, but the release of relatively more stable macro data and eased Middle‑East tensions are now prompting a modest profit‑taking pullback, with traders closely watching resistance near 4,930 and support near 4,640 to decide whether the next leg is higher toward 5,000 or temporarily lower toward 4,600.
Next 24 Hours Bias
Medium Bullish
The Euro (EUR)
Key news events today
ECB President Lagarde Speaks (4:40 pm GMT)
What can we expect from EUR today?
The Swiss franc is trading near multi‑month ranges against the US dollar and euro, underpinned by a mix of safe‑haven demand and concerns about Swiss National Bank (SNB) intervention if the currency strengthens too quickly. USD/CHF is hovering just below key resistance around 0.8000.
Central Bank Notes:
The next meeting is on 29 April 2026
Next 24 Hours Bias
Medium Bearish
The Swiss Franc (CHF)
Key news events today
No major news event
What can we expect from CHF today?
The Swiss Franc maintains its robust safe-haven status with USD/CHF near 0.78, driven by geopolitical risks in the Middle East and SNB’s vigilant policy stance at 0% rates, though no fresh catalysts dominate today amid a quiet economic calendar; recent pullbacks from 0.80 resistance suggest potential consolidation, tempered by the currency’s long-term 9.51% yearly gain.
Central Bank Notes:
The next meeting is on 18 June 2026.
Next 24 Hours Bias
Medium Bearish
The Pound (GBP)
Key news events today
No major news event
What can we expect from GBP today?
The pound edges lower by 0.11% to 1.3502 versus the USD, influenced by Strait of Hormuz reopening boosting some gains, yet weighed by UK jobs weakness (5.2% unemployment), neutral RSI at 40, and US NFP anticipation; technical outlooks favor buys from 1.3480-1.3540 targeting 1.3600-1.3620 amid fragile uptrends.
Central Bank Notes:
Next 24 Hours Bias
Medium Bullish
The Canadian Dollar (CAD)
Key news events today
CPI m/m (12:30 pm GMT)
Median CPI y/y (12:30 pm GMT)
Trimmed CPI y/y (12:30 pm GMT)
Common CPI y/y (12:30 pm GMT)
What can we expect from CAD today?
The Canadian dollar held steady near 1.37-1.39 against the USD, building on a recent 4-week high from oil rallies and reduced Middle East tensions (e.g., Iran’s waterway reopening), while limiting losses despite USD safe-haven demand. Forecasts signal mild CAD strengthening into late 2026 amid stabilizing commodities and policy divergence.
Central Bank Notes:
Next 24 Hours Bias
Weak Bearish
Oil
Key news events today
No major news event
What can we expect from Oil today?
Oil markets on April 20, 2026, are experiencing extreme volatility driven by escalating US-Iran tensions in the Strait of Hormuz. Brent crude rose sharply to around $94.76 per barrel, up nearly 5%, while WTI crude hovered near $83-84 after dipping to $79 last week, with forecasts warning of potential surges toward $100 amid shipping disruptions and a US Navy seizure of an Iranian vessel.
Next 24 Hours Bias
Strong Bullish
The post IC Markets Global – Europe Fundamental Forecast | 20 April 2026 first appeared on IC Your Trading Edge | Official Blog.
429647 April 20, 2026 18:00 ICMarkets Market News
Potential Direction: Bullish
Overall momentum of the chart: Bearish
The price could see a short-term pullback toward the pivot before rising again toward the 1st resistance.
Pivot: 98.01
Supporting reasons: Identified as a pullback support that aligns with the 50% Fiboancci retracement, where renewed buying pressure could emerge to push the price higher.
1st support: 95.80
Supporting reasons: Identified as a swing low support, indicating a potential area where the price could again stabilize.
1st resistance: 1000.53
Supporting reasons: Identified as a swing high resistance, indicating a potential area that could halt any further upward movement

Potential Direction: Bearish
Overall momentum of the chart: Bullish
cccc
1st support: 1.1631
Supporting reasons: Identified as a pullback support, indicating a potential level where the price could stabilize once again
1st resistance: 1.2044
Supporting reasons: Identified as a swing high resistance, indicating a potential level that could cap further upward movement.

Potential Direction: Bullish
Overall momentum of the chart: Bearish
The price could see a short-term pullback toward the pivot before rising again toward the 1st resistance.
Pivot: 184.74
Supporting reasons: Identified as a pullback support, where renewed buying pressure could emerge to push the price higher.
1st support: 181.46
Supporting reasons: Identified as an overlap support, indicating a potential area where the price could again stabilize.
1st resistance: 189.52
Supporting reasons: Identified as a resistance that aligns with the 161.8% Fibonacci extension, indicating a potential level that could cap further upward movement.

Potential Direction: Bullish
Overall momentum of the chart: Bullish
The price could make a short-term pullback toward the pivot before rising again toward the 1st resistance
Pivot: 0.8675
Supporting reasons: Identified as a pullback support that aligns with the 50% Fibonacci retracement, where renewed buying pressure could emerge to push the price higher.
1st support: 0.8619
Supporting reasons: Identified as a swing low support, indicating a potential area where the price could stabilize once more.
1st resistance: 0.8769
Supporting reasons: Identified as an overlap resistance, indicating a potential level that could cap further upward movement.

Potential Direction: Bullish
Overall momentum of the chart: Bullish
The price could make a short-term pullback toward the pivot before rising again toward the 1st resistance
Pivot: 1.3437
Supporting reasons: Identified as a pullback support, where renewed buying pressure could emerge to push the price higher.
1st support: 1.3195
Supporting reasons: Identified as an overlap support that aligns with the 78.6% Fibonacci retracement, indicating a potential area where the price could stabilize once more.
1st resistance: 1.3860
Supporting reasons: Identified as a swing high resistance, indicating a potential level that could halt further upward movement.

Potential Direction: Bullish
Overall momentum of the chart: Bullish
The price could make a short-term pullback toward the pivot before rising again toward the 1st resistance
Pivot: 213.22
Supporting reasons: Identified as a pullback support, where renewed buying pressure could emerge to push the price higher.
1st support: 209.64
Supporting reasons: Identified as an overlap support, indicating a potential level where the price could stabilize once more.
1st resistance: 217.18
Supporting reasons: Identified as a resistance that aligns with the 127.2% Fibonacci extension, indicating a potential level that could halt further upward movement.

Potential Direction: Bearish
Overall momentum of the chart: Bearish
The price could see a short-term pullback toward the pivot before continuing its bearish move down toward the 1st support.
Pivot: 0.7851
Supporting reasons: Identified as a pullback resistance, where selling pressures could intensify and potentially cap any upward retracement.
1st support: 0.7752
Supporting reasons: Identified as an overlap support, indicating a potential level where the price could stabilize once again.
1st resistance: 0.8030
Supporting reasons: Identified as a swing high resistance, indicating a potential level that could cap further upward movement.

Potential Direction: Bullish
Overall momentum of the chart: Bullish
The price has already bounced off the pivot and may continue its bullish move toward the 1st resistance
Pivot: 157.58
Supporting reasons: Identified as an overlap support, where renewed buying pressure could emerge to push the price higher.
1st support: 154.24
Supporting reasons: Identified as an overlap support, indicating a strong area where buyers might return, and the price could stabilize once again.
1st resistance: 161.74
Supporting reasons: Identified as a swing high resistance. This level represents the next key area where upward movement could be capped amid increased selling pressure

Potential Direction: Bullish
Overall momentum of the chart: Bearish
The price could make a short-term pullback toward the pivot before rising again toward the 1st resistance
Pivot: 1.3725
Supporting reasons: Identified as a pullback support that aligns with the 50% Fibonacci retracement, where renewed buying pressure could emerge to push the price higher.
1st support: 1.3647
Supporting reasons: Identified as a pullback support that aligns with the 61.8% Fibonacci retracement, indicating a key level where the price could stabilize once more.
1st resistance: 1.3940
Supporting reasons: Identified as an overlap resistance, making it a possible target for bullish advances and a level where some sellers could return to cap gains

Potential Direction: Bullish
Overall momentum of the chart: Bullish
The price could make a short-term pullback toward the pivot before rising again toward the 1st resistance
Pivot: 0.6943
Supporting reasons: Identified as a pullback support, where renewed buying pressure could emerge to push the price higher.
1st support: 0.6676
Supporting reasons: Identified as an overlap support, this area has provided strong support historically and may attract buying interest for a potential short-term bounce
1st resistance: 0.7182
Supporting reasons: Identified as a swing high resistance, indicating a potential area that could halt any further upward movement.

Potential Direction: Bearish
Overall momentum of the chart: Bearish
The price has already reacted off the pivot and may continue its bearish move toward the 1st support.
Pivot: 0.5946
Supporting reasons: Identified as an overlap resistance that aligns with the 61.8% Fibonacci retracement, where selling pressures could intensify and potentially cap any upward retracement.
1st support: 0.57747
Supporting reasons: Identified as a pullback support, this area has provided strong support historically and may attract buying interest for a potential short-term bounce
1st resistance: 0.6079
Supporting reasons: Identified a swing high resistance, indicating a potential area that could halt any further upward movement.

Potential Direction: Bearish
Overall momentum of the chart: Bullish
The price could see a short-term pullback toward the pivot before continuing its bearish move down toward the 1st support.
Pivot: 49,687.50
Supporting reasons: Identified as an overlap resistance, where selling pressures could intensify and potentially cap any upward retracement.
1st support: 46,872.00
Supporting reasons: Identified as a pullback support, suggesting a potential area where the price could stabilize once again.
1st resistance: 50,477.23
Supporting reasons: Identified as a swing high resistance, indicating a potential area that could halt any further upward movement.

Potential Direction: Bearish
Overall momentum of the chart: Bullish
The price could see a short-term pullback toward the pivot before continuing its bearish move down toward the 1st support.
Pivot: 24,350.21
Supporting reasons: Identified as a pullback resistance, where selling pressures could intensify and potentially cap any upward retracement.
1st support: 23,332.36
Supporting reasons: Identified as a pullback support, indicating a key level where the price could stabilize once more.
1st resistance: 25,451.76
Supporting reasons: Identified as a swing high resistance, indicating a potential area that could halt any further upward movement.

Potential Direction: Bullish
Overall momentum of the chart: Bullish
The price could make a short-term pullback toward the pivot before rising again toward the 1st resistance
Pivot: 6,829.63
Supporting reasons: Identified as a pullback support, where renewed buying pressure could emerge to push the price higher.
1st support: 6,531.49
Supporting reasons: Identified as a pullback support, indicating a potential level where the price could stabilize once again.
1st resistance: 7,205.89
Supporting reasons: Identified as a resistance that aligns with the 127.2% Fibonacci extension, indicating a potential area that could halt any further upward movement.

Potential Direction: Bearish
Overall momentum of the chart: Bullish
The price has already reacted off the pivot and may continue its bearish move toward the 1st support.
Pivot: 76,476.06
Supporting reasons: Identified as a pullback resistance that aligns with the 50% Fibonacci retracement, where selling pressures could intensify and potentially cap any upward retracement.
1st support: 59,822.56
Supporting reasons: Identified as a swing low support, indicating a potential level where the price could stabilize once more.
1st resistance: 85,026.77
Supporting reasons: Identified as a pullback resistance that aligns with the 61.8% Fibonacci retracement, indicating a potential area that could halt any further upward movement.

Potential Direction: Bearish
Overall momentum of the chart: Bullish
The price could see a short-term pullback toward the pivot before continuing its bearish move down toward the 1st support.
Pivot: 2,618.80
Supporting reasons: Identified as a pullback resistance that aligns with the 50% Fibonacci retracement, where selling pressures could intensify and potentially cap any upward retracement.
1st support: 1,823.98
Supporting reasons: Identified as an overlap support, indicating a potential level where the price could stabilize once more.
1st resistance: 3,053.33
Supporting reasons: Identified as a swing high resistance, indicating a potential area that could halt any further upward movement.

Potential Direction: Bearish
Overall momentum of the chart: Bullish
The price could see a short-term pullback toward the pivot before continuing its bearish move down toward the 1st support.
Pivot: 87.53
Supporting reasons: Identified as a pullback resistance, where selling pressures could intensify and potentially cap any upward retracement.
1st support: 70.92
Supporting reasons: Identified as a pullback support, indicating a key level where the price could stabilize once more.
1st resistance: 119.24
Supporting reasons: Identified as a pullback resistance, indicating a potential area that could halt any further upward movement.

Potential Direction: Bearish
Overall momentum of the chart: Bullish
The price could see a short-term pullback toward the pivot before continuing its bearish move down toward the 1st support.
Pivot: 4,858.96
Supporting reasons: Identified as a pullback resistance that aligns with the 61.8% Fibonacci retracement, where selling pressures could intensify and potentially cap any upward retracement.
1st support: 4,367.70
Supporting reasons: Identified as an overlap support, indicating a key level where the price could stabilize once more.
1st resistance: 5,464.42
Supporting reasons: Identified as a swing high resistance, indicating a potential area that could halt any further upward movement.

The accuracy, completeness and timeliness of the information contained on this site cannot be guaranteed. IC Markets Global does not warranty, guarantee or make any representations, or assume any liability regarding financial results based on the use of the information in the site.
News, views, opinions, recommendations and other information obtained from sources outside of www.icmarkets.com, used in this site are believed to be reliable, but we cannot guarantee their accuracy or completeness. All such information is subject to change at any time without notice. IC Markets Global assumes no responsibility for the content of any linked site.
The fact that such links may exist does not indicate approval or endorsement of any material contained on any linked site. IC Markets Global is not liable for any harm caused by the transmission, through accessing the services or information on this site, of a computer virus, or other computer code or programming device that might be used to access, delete, damage, disable, disrupt or otherwise impede in any manner, the operation of the site or of any user’s software, hardware, data or property.
The post Monday 20th April 2026: Technical Outlook and Review first appeared on IC Your Trading Edge | Official Blog.
429645 April 20, 2026 17:40 ICMarkets Market News

The post Ex-Dividend 21/04/2026 first appeared on IC Your Trading Edge | Official Blog.