Articles

IC Markets Global – Asia Fundamental Forecast | 20 April 2026
429644 April 20, 2026 17:40 ICMarkets Market News
IC Markets Global – Asia Fundamental Forecast | 20 April 2026
What happened in the U.S. session?
The U.S. session on April 18 featured equity rallies driven by Trump’s de-escalation signals on the U.S.-Iran war, easing oil inflation fears, and spurring record Nasdaq/Dow gains, while bonds rallied on tempered rate hike worries amid stable labor data but cautious consumer trends; oil and energy-sensitive currencies like CAD saw relief, underscoring geopolitics’ outsized market sway over absent macro prints.
What does it mean for the Asia Session?
Asian traders face a pivotal start with the PBOC interest rate decision at 01:15 GMT, likely holding at 3.00% but poised to influence CNY pairs, equities, and commodities amid fragile US-Iran ceasefire hopes that have tempered oil spikes (WTI ~$93) and lifted indices like Nikkei’s recent record; New Zealand trade data adds forex cues, while lingering Middle East risks and soft prior China imports underscore volatility potential across oil, gold (~$4,800), and regional benchmarks.
The Dollar Index (DXY)
Key news events today
No major news event
What can we expect from DXY today?
The US Dollar has shown resilience amid ongoing Middle East tensions, including a fragile ceasefire and US blockade on the Strait of Hormuz, supporting its safe-haven status and linking it closely to oil price fluctuations. Recent market updates indicate the DXY hovered around pre-war levels near 98-99 after oil eased to the $80s, with forecasts pointing to short-term strength (e.g., EUR/USD at 1.14 in 3 months) driven by sticky US inflation, delayed Fed cuts, and higher defense spending risks, though medium-term debt concerns could pressure it lower.
Central Bank Notes:
- The Federal Open Market Committee (FOMC) is widely expected to hold the federal funds rate target range steady at 3.50%–3.75% at its March 17–18, 2026, meeting, amid rising oil prices from the US-Israel war against Iran and persistent inflation pressures, delaying any 2026 cuts potentially to September.
- The Committee continues to pursue maximum employment and 2% inflation goals, with the labor market weakening further as nonfarm payrolls declined by 92,000 in February 2026 and the unemployment rate rose to 4.4% from 4.3% in January.
- Officials face tilted risks from geopolitical tensions, elevated oil prices, and sticky inflation, with CPI steady at 2.4% year-over-year in February 2026, headline PCE at 2.8% in January, and core PCE rising to 3.1%.
- Economic activity has cooled after robust Q4 2025 growth near 5%, with the Atlanta Fed GDPNow now estimating Q1 2026 growth at around 2.1%–2.7% amid softer consumer spending and labor data.
- December 2025’s Summary of Economic Projections forecasts 2025 unemployment at a median of 4.5%, 2026 GDP growth at 2.3%, and core PCE at 2.5%, with the dot plot signaling one more cut in 2026 to a median 3.4% funds rate; March updates may reflect softer labor and inflation upticks.
- The Committee maintains its data-dependent stance amid a softening labor market, inflation above target, and new oil shocks, likely holding rates at 3.50%-3.75% with ongoing divisions and possible hawkish dissents on rate cuts.
- The FOMC continues its adjusted quantitative tightening, with Treasury rolloff caps at $5 billion per month and agency MBS at $35 billion per month to ensure ample reserves post-2025 program adjustments.
- The next meeting is scheduled for 28 to 29 April 2026.
Next 24 Hours Bias
Medium Bearish
Gold (XAU)
Key news events today
No major news event
What can we expect from Gold today?
Gold hit an all-time high of $5,608 in January 2026 but has been consolidating post a bearish March, with forecasts suggesting potential upside to $5,320 or downside to $4,254 depending on macro releases. Weekly outlooks highlight demand zones near $4,400–$4,650 and supply at prior highs.
Next 24 Hours Bias
Medium Bullish
The Australian Dollar (AUD)
Key news events today
No major news event
What can we expect from AUD today?
The Australian Dollar (AUD) has shown resilience in recent trading sessions leading into April 20, 2026, with the AUD/USD pair hovering around 0.7167-0.7170 as of late last week, marking a 4-year high near 0.71 and reflecting a 2.04% monthly gain amid improving global risk sentiment.
Central Bank Notes:
- The Reserve Bank of Australia (RBA) is expected to hold its cash rate at 3.85% at the March 16-17, 2026 policy meeting, following the widely anticipated 25 basis point hike to 3.85% in early February after persistent inflation pressures from late 2025. While some banks like CBA, NAB, and Westpac now forecast a further 25 basis point rise to 4.10% as soon as May if inflation data remains sticky, consensus tilts toward a pause in March to assess incoming monthly CPI and labor market signals. The February hike reversed prior cuts, entering mildly restrictive territory amid capacity pressures, with the board emphasizing data dependence.
- Inflation remains elevated, with December 2025 CPI at 3.8% year-on-year and trimmed mean at 3.3%, above the 2–3% target midpoint. RBA’s February Statement revised forecasts higher, projecting trimmed-mean inflation to peak in mid-2026 above 3% and remain elevated through early 2027, driven by services, housing, and demand resilience despite some monthly cooling, such as January’s 0.2% MoM gauge. Monthly CPI data continues to highlight core stickiness beyond energy rebates, delaying the target return to late 2027 or beyond.
- January 2026 monthly indicators showed modest easing, but headline CPI risks upward surprises from housing (up recently) and services amid firm domestic demand. Trimmed mean pressures persist from wage growth and capacity constraints, with consumer expectations ticking to 5% YoY in February surveys. Enhanced monthly reporting sharpens vigilance on potential broad-based pick-up.
- The labor market shows softening, with unemployment around 4.1-4.4%, down slightly to 4.1% in December, but unit labor costs are elevated due to subdued productivity. Household spending faces higher borrowing costs post-hike, yet private demand recovery sustains capacity strains. Vulnerabilities persist amid resilient employment dynamics.
- Global growth modestly revised up but tempered by geopolitics and commodity volatility; policy now restrictive post-February, with the RBA balancing inflation against employment risks. Data from the monthly CPI and Q1 GDP will guide, amid household debt sensitivities.
- Sustained restrictive stance post-February anchors inflation return to target, upholding dual mandate with flexibility to new risks like further inflation upticks.
- Markets price a March hold at 3.85%, with big four banks split: CBA, NAB, Westpac eye May hike to 4.10% if persistence continues, while others see limited upside unless acceleration. Upcoming monthly CPI pivotal for Q2 trajectory.
- Policy vigilance counters inflation stickiness against household fragilities and global uncertainties, reaffirming adaptability under dual mandate.
- Base case favors March hold with risks tilted hawkish for further hikes if data is hot; monthly indicators key to 2026 path.
- The next meeting is on 5 to 6 May 2026.
Next 24 Hours Bias
Medium Bullish
The Kiwi Dollar (NZD)
Key news events today
CPI q/q (10:45 pm GMT)
What can we expect from NZD today?
The New Zealand Dollar (NZD) has faced ongoing pressure in recent months amid dovish signals from the Reserve Bank of New Zealand (RBNZ), which held rates at 2.25% in February 2026 while signaling prolonged accommodative policy, contributing to NZD/USD dipping toward 0.5989 before partial recoveries above 0.6000.
Central Bank Notes:
- The Reserve Bank of New Zealand’s (RBNZ) Monetary Policy Committee (MPC) is widely expected to hold the Official Cash Rate (OCR) steady at 2.25% at its 8 April 2026 Monetary Policy Review, aligning with unanimous market consensus from Reuters polls and previews.
- The MPC continues its data-dependent “wait-and-see” approach after February’s pause, balancing stimulus from prior 325 basis point cuts against inflation’s path back to the 2% target, with readiness for gradual normalization only if recovery strengthens or inflation exceeds forecasts.
- Headline CPI, last at 3.1%, is on track to re-enter the 1-3% band in Q2 2026 and hit 2% by mid-2027, aided by spare capacity, moderating wages, and softer food/fuel prices; two-year business inflation expectations have ticked up slightly to 2.37%.
- Household spending and housing remain subdued amid cautious consumption, low net migration, and labor market softness, though easing retail rates support budgets; high-frequency GDP indicators show steadying momentum in an early recovery phase.
- Accommodative borrowing costs from the low OCR are boosting mortgage approvals and sentiment, but business credit growth lags due to uneven confidence; overall stimulus persists below the 3% neutral rate.
- Risks are balanced, with a favorable global environment—including stronger dairy/meat exports and a softer NZ dollar—offsetting oil shocks and prior China/US trade worries; vigilance remains on second-round inflation effects.
- Forecasts point to potential OCR hikes starting late 2026 (e.g., December) or early 2027 to 2.50% by year-end if activity/inflation firms, but policy stays supportive if recovery unfolds gradually as expected.
- The next meeting is on 27 May 2026.
Next 24 Hours Bias
Medium Bearish
The Japanese Yen (JPY)
Key news events today
No major news event
What can we expect from JPY today?
The Japanese Yen (JPY) has faced ongoing pressure in early April 2026, trading around the USD/JPY 158-160 range amid volatility driven by Bank of Japan (BoJ) policy signals and global market dynamics. Recent exchange rate data show minor fluctuations, with rates near 159.85 on April 13, reflecting resilience despite broader USD strength and concerns over Tokyo’s cooling core inflation, which has tempered rate hike expectations.
Central Bank Notes:
- The Policy Board of the Bank of Japan meets on 18–19 April 2026, with markets anticipating the short-term policy rate to remain at 0.75%, as the bank continues evaluating the December 2025 and prior hikes’ effects amid data-dependent normalization.
- The BOJ will target the uncollateralized overnight call rate around 0.75% and indicate future hikes hinge on impacts to lending, financing, and activity, with Governor Ueda signaling scrutiny of data for potential moves in April or later meetings.
- JGB tapering advances per plan, cutting outright purchases by ¥400 billion quarterly through Q1 2026 and slowing to ¥200 billion from April onward, targeting roughly ¥2-3 trillion monthly by mid-2026, adjustable for market stability
- Japan’s economy maintains moderate growth into Q1 2026, building on the Q4 2025 rebound via exports and fiscal measures, though manufacturing sentiment holds soft amid overseas demand weakness and yen pressures.
- Core CPI (ex-fresh food) likely stays near 2.3-2.5% y/y in early 2026. Tokyo prints off prior highs but above 2%, while core-core hovers around 2.6%, reflecting sustained but easing inflationary forces.
- Input costs ease further from import peaks, yet services inflation, 5% wage targets in shunto talks, and anchored expectations above 2% support price persistence, with upside risks from yen and geopolitics.
- Near-term real GDP may ease below trend due to tightening and external shocks like Iran tensions, but negative real rates, wage gains, and stimulus should underpin consumption and capex rebound.
- Medium-term, overseas recovery, labor shortages, and productivity lifts are set to fuel wages and core inflation near/above 2%, enabling gradual hikes toward 1% if conditions align.
- The next meeting is on 27 to 28 April 2026.
Next 24 Hours Bias
Medium Bearish
Oil
Key news events today
No major news event
What can we expect from Oil today?
Oil markets remain highly volatile, driven primarily by ongoing tensions in the Strait of Hormuz, where disruptions to tanker traffic continue to fuel supply uncertainty. WTI crude closed the prior week near $83.60 after dipping toward $79, with analysts forecasting a turbulent Monday open potentially spiking above $90 amid reports of slowed shipping and fast-changing Middle East developments.
Next 24 Hours Bias
Strong Bullish
The post IC Markets Global – Asia Fundamental Forecast | 20 April 2026 first appeared on IC Your Trading Edge | Official Blog.
The Week Ahead – Week Commencing 20 April 2026
429637 April 20, 2026 17:00 ICMarkets Market News
Geopolitical updates again dominated moves last week, and that pattern looks set to continue into the coming days and weeks ahead. Sentiment had pushed higher during the course of the week, and we saw ‘risk on’ moves hit fresh levels towards the end of the week, with US stock indices closing the last three days at record levels and other risk assets pushing higher as haven trades unwound.
However, updates over the weekend, with news that Iran has again shut the Strait of Hormuz and Israel and Hezbollah have continued hostilities, have seen a sharp change in sentiment, and unless this flips again in the hours approaching the Monday open, then traders are expecting to see some sharp downside gapping once trading recommences.
Despite updates from the Middle East likely to dominate most moves in financial markets, there are also some key data releases, central bank updates, and quarterly earnings reports due out as we progress through the trading week, which will add strongly to the trading mix, especially from a longer-term perspective.
Here is our usual day-by-day breakdown of the major risk events this week:

Updates from the Persian Gulf over the weekend are expected to see some big moves on the Asian open on Monday, and although there are some key fundamental data updates as we progress through the day, geopolitical updates are expected to dominate. Chinese Loan Prime Rate updates are due midway through the Asian session, although their impact is expected to be minimal. There is nothing of note scheduled during the London session on Monday; however, Canadian markets will fall into focus early in the New York session with key CPI data due out.

Tuesday is busy on the calendar front, with some key updates due across all three sessions. The Asian session will see an early focus on New Zealand markets, with CPI data due out, whilst the European session sees the first of several key UK data updates for the week released, with the monthly employment numbers scheduled. The New York session sees the main US data for the week released, with retail sales data out early in the day, before we hear the key testimony from Fed Chair designate Kevin Warsh when he talks before the Senate.

It’s a quieter calendar day on Wednesday for the market, with just UK data again to the fore, with key CPI and PPI data due out early in the London session. The US session sees the weekly US crude oil inventory update, as well as speeches from the Buba’s Joachim Nagel and ECB President Christine Lagarde.

It is Flash PMI day on Thursday again, with both service and manufacturing numbers due out from several jurisdictions, including Australia, France, Germany, the EU, the UK, and the US. In addition to those data drops, the New York session also has the usual weekly unemployment claims numbers out.

It’s a quieter day on the calendar to round out the week. Retail sales data is due out from both the UK and Canada early in their respective trading sessions, and we also hear from SNB Chairman Martin Schlegel in the London session; however, traders will remain vigilant into the weekend for any geopolitical updates that could hit markets as liquidity thins in later sessions.
The post The Week Ahead – Week Commencing 20 April 2026 first appeared on IC Your Trading Edge | Official Blog.
General Market Analysis – 20/04/26
429636 April 20, 2026 17:00 ICMarkets Market News
Weekend Updates to Flip Markets Today – Brent up 8% on the Open
US equity markets closed out last week on a strong note, with all three major indices posting solid gains as optimism grew around potential peace developments in the Middle East and the reopening of the Strait of Hormuz. The Dow Jones rallied 1.79% to finish at 49,447, while the S&P 500 rose 1.20% to 7,126 and the Nasdaq gained 1.52% to close at 24,468, both extending to fresh record levels. Despite the positive finish on Friday, the outlook for the new week has flipped following weekend developments, with the Strait of Hormuz now closed again. In currency markets, the US dollar was largely unchanged on Friday, edging just 0.01% higher to 98.23, holding near multi-month lows. Bond markets saw a move lower in yields, with the US 2-year yield falling 6.6 basis points to 3.708%, while the 10-year yield declined 6.3 basis points to 4.248%. Commodity markets were particularly volatile, with oil prices sharply lower on easing supply concerns tied to the temporary reopening of the Strait. Brent crude dropped 9.07% to settle at $90.38, while WTI fell 11.45% to $83.85. Gold, meanwhile, moved against the broader risk tone again, rising 0.84% to $4,830.34.
Investors Fear that the Gulf Ceasefire Will End and Hit Markets Hard
Investor fears that the ceasefire between the US and Iran will come to a close on Tuesday have increased rapidly over the last couple of days, and concerns are growing that we could see a resumption and a possible increase in hostilities in the days ahead, with President Trump again making threats against Iranian infrastructure. Markets went into the weekend in a buoyant mood as both sides talked up chances of peace in the region and the Strait of Hormuz reopened to traffic. However, Iran has once again closed the Strait of Hormuz as clashes continued in Lebanon between Israel and Hezbollah, and the US seized an Iranian-linked ship in the Strait. Traders are now expecting most of last week’s positive moves to unwind in the coming sessions and days unless we see another sharp turnaround in rhetoric from both sides. Oil prices have already retraced much of Friday’s losses, and traders are expecting more ‘risk off’ moves as we progress through the day.
Quiet Calendar, but Busy Day Ahead for Traders
Traders are expecting another busy day at their desks after updates from the Middle East over the weekend have seen sentiment turn on its head. The Asian session has opened on the back foot as oil prices have shot back up with the Strait of Hormuz closed again, and traders are expecting more volatility as the session progresses. There will be a brief focus on fundamentals midway through the session today, with Chinese Loan Prime Rate updates due. Both the 1-year and the 5-year rates are expected to remain steady at 3.00% and 3.50%, respectively, and any moves would be a shock. There is little of note in the London session on the calendar today; however, Canadian markets will be in focus just after the New York open, with key inflation data due out. The headline CPI (exp +1.1% m/m) and Median CPI (exp +2.4% y/y) will be in focus, and traders are expecting moves in the loonie on the back of any significant deviations. We also hear from ECB President Christine Lagarde later in the day, but again, most market participants are expecting updates on the conflict in the Middle East to dominate.
The post General Market Analysis – 20/04/26 first appeared on IC Your Trading Edge | Official Blog.
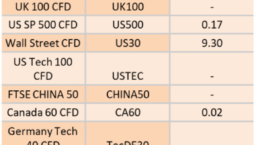
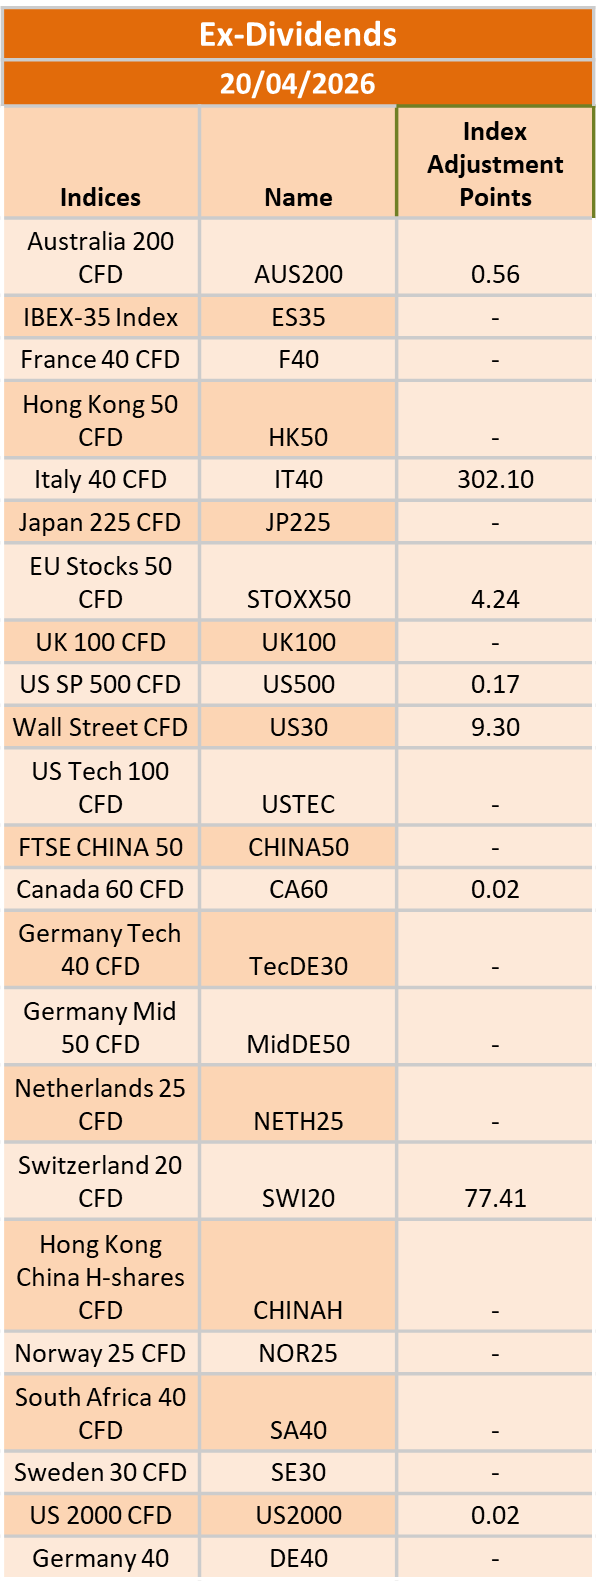
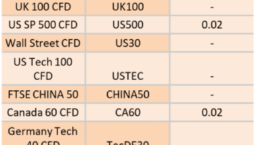
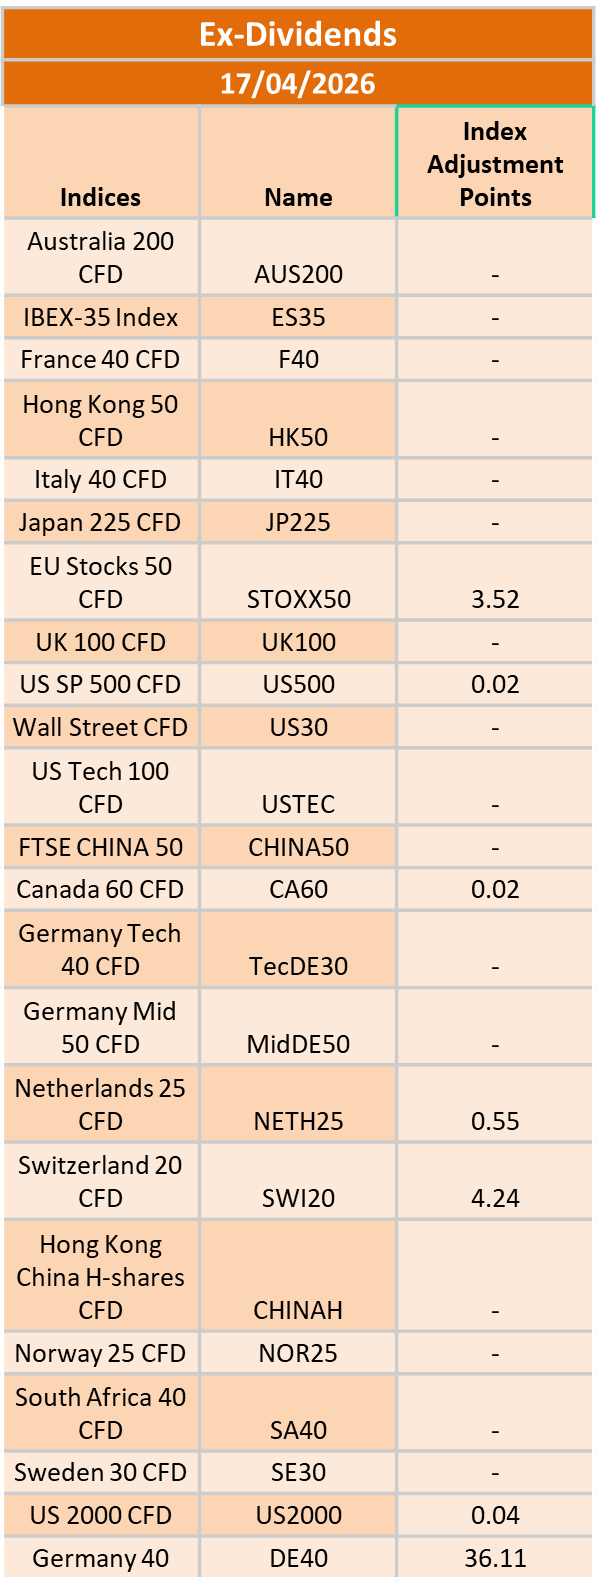
Ex-Dividend 20/04/2026
429607 April 17, 2026 17:40 ICMarkets Market News
The post Ex-Dividend 20/04/2026 first appeared on IC Your Trading Edge | Official Blog.
IC Markets Global – Europe Fundamental Forecast | 17 April 2026
429605 April 17, 2026 16:00 ICMarkets Market News
IC Markets Global – Europe Fundamental Forecast | 17 April 2026
What happened in the Asia session?
Markets traded mixed-to-lower amid thin data flow, prioritizing U.S.-Iran ceasefire progress that capped oil below $100 and buoyed weekly equity gains despite intraday caution from Middle East risks; instruments like WTI crude, CNH/USD, Nikkei, and Kospi bore the brunt, reflecting stabilized commodities and soft risk appetite.
What does it mean for the Europe & US sessions?
Traders face a risk-on environment fueled by President Trump’s comments on ending the Iran war soon, potential US-Iran talks, and an Israel-Lebanon truce, which have lifted oil prices lower to $90.12 and supported Wall Street futures (S&P +0.08%, Dow +0.15%) following Thursday’s index highs. Hedge funds eye top monthly gains in years, while big bank earnings highlight private credit concerns; key data includes Singapore non-oil exports, with a broader focus on CPI, labor stats, retail sales, and bond yields for forex and equity moves. Volatility may stem from these macro releases amid receding geopolitical risks.
The Dollar Index (DXY)
Key news events today
FOMC Member Waller Speaks (6:00 pm GMT)
What can we expect from DXY today?
The US Dollar maintained a firm stance, driven by sticky US inflation, record oil exports amid the Iran conflict, and wide interest rate differentials versus peers like the ECB and BoJ, with the DXY hovering near 100 despite minor pullbacks from peace talk optimism; EUR/USD forecasts eyed upside to 1.1840, while broader monthly trends favored USD strength amid volatile, headline-driven trading..
Central Bank Notes:
- The Federal Open Market Committee (FOMC) is widely expected to hold the federal funds rate target range steady at 3.50%–3.75% at its March 17–18, 2026, meeting, amid rising oil prices from the US-Israel war against Iran and persistent inflation pressures, delaying any 2026 cuts potentially to September.
- The Committee continues to pursue maximum employment and 2% inflation goals, with the labor market weakening further as nonfarm payrolls declined by 92,000 in February 2026 and the unemployment rate rose to 4.4% from 4.3% in January.
- Officials face tilted risks from geopolitical tensions, elevated oil prices, and sticky inflation, with CPI steady at 2.4% year-over-year in February 2026, headline PCE at 2.8% in January, and core PCE rising to 3.1%.
- Economic activity has cooled after robust Q4 2025 growth of nearly 5%, with the Atlanta Fed GDPNow now estimating Q1 2026 growth at around 2.1%–2.7% amid softer consumer spending and labour data.
- December 2025’s Summary of Economic Projections forecasts 2025 unemployment at a median of 4.5%, 2026 GDP growth at 2.3%, and core PCE at 2.5%, with the dot plot signalling one more cut in 2026 to a median 3.4% funds rate; March updates may reflect softer labor and inflation upticks.
- The Committee maintains its data-dependent stance amid a softening labor market, inflation above target, and new oil shocks, likely holding rates at 3.50%-3.75% with ongoing divisions and possible hawkish dissents on rate cuts.
- The FOMC continues its adjusted quantitative tightening, with Treasury rolloff caps at $5 billion per month and agency MBS at $35 billion per month to ensure ample reserves post-2025 program adjustments.
- The next meeting is scheduled for 28 to 29 April 2026.
Next 24 Hours Bias
Medium Bearish
Gold (XAU)
Key news events today
FOMC Member Waller Speaks (6:00 pm GMT)
What can we expect from Gold today?
Gold prices stabilized near record highs around $4,800-$4,812 per ounce, showing marginal gains amid a softer US dollar and renewed safe-haven demand, though on track for a weekly decline after five weeks of advances. TradingEconomics reported spot gold at $4,791.53, up 0.06% daily but down 0.58% monthly, influenced by escalating Middle East tensions boosting oil prices and curbing Fed rate cut expectations.
Next 24 Hours Bias
Medium Bullish
The Euro (EUR)
Key news events today
No major news event
What can we expect from EUR today?
The euro saw limited specific news, but recent market data shows it trading around $1.1761 after a 0.30% gain earlier in the week, marking six straight up sessions amid broader USD pullbacks. Broader European developments, like Hungary awaiting EU approval for a €16 billion defense plan and ongoing Ukraine-EU integration talks, continue to influence sentiment without direct euro impacts today.
Central Bank Notes:
- The Governing Council of the ECB is expected to keep the three key interest rates unchanged at its 29–30 April 2026 meeting, with the main refinancing rate at 2.15%, marginal lending facility at 2.40%, and deposit facility at 2.00%. This reflects an ongoing commitment to 2% inflation stability amid heightened uncertainties from Middle East tensions and US trade policies under President Trump. Market probabilities indicate around 58% odds of no change, though some banks now price in potential hikes due to rising inflation risks.
- Price dynamics show increasing upside pressures, with headline HICP inflation likely around 2.0-2.2% in early 2026, driven by energy costs from Middle East conflicts offsetting euro strength. Core inflation remains sticky but moderating slowly, with projections revised upward to 2.6% for 2026 overall amid hawkish signals from ECB leadership.
- Updated Eurosystem staff projections for April 2026 may forecast headline inflation at 2.1-2.2% in 2026, 1.9% in 2027, and 2.0% in 2028, with upside risks from energy and trade dominating balanced prior views. A stronger euro provides some counterbalance, but recent data revisions highlight persistent pressures.
- Euro area GDP growth holds steady, with Q2 2026 surveys suggesting 0.2-0.3% qoq growth, in line with 1.1-1.3% annual forecasts through 2027. Defence spending, infrastructure, and low unemployment support resilience against trade headwinds and softer external demand.
- The labour market remains tight, with unemployment steady near 6.4%, bolstered by wage growth and participation gains. Supportive credit conditions continue aiding investment and consumption despite global risks.
- Business sentiment is cautious amid US tariffs, geopolitical flare-ups, and supply chain easing; a somewhat weaker euro boosts exports, while fiscal measures aid domestic activity.
- The Governing Council maintains its data-dependent, meeting-by-meeting stance, scrutinizing inflation, transmission, and external shocks without pre-committing to rate paths.
- Balance sheet normalization advances smoothly, with APP/PEPP wind-downs complete and no liquidity issues; banks show ample reserves and stable funding access.
The next meeting is on 29 April 2026
Next 24 Hours Bias
Medium Bearish
The Swiss Franc (CHF)
Key news events today
No major news event
What can we expect from CHF today?
The Swiss franc is trading in a firm but contained range, with USD/CHF near 0.7825 after a multi‑month period in which the franc has appreciated roughly 9.5% over the past year, despite some recent give‑back versus the greenback. The franc continues to benefit from safe‑haven demand amid global geopolitical tensions and a weaker dollar, while the Swiss National Bank stands ready to intervene if appreciation accelerates too sharply, all against a backdrop of low domestic inflation and a neutral policy stance.
Central Bank Notes:
- At its monetary policy assessment on 19 March 2026, the Swiss National Bank (SNB) is widely expected to leave the policy rate unchanged at 0%, continuing the extended pause since September 2025, as the Governing Board assesses current settings as adequate to maintain inflation near the target without resorting to negative rates.
- Inflation data since December indicate persistent weakness, with headline CPI hovering around 0% year-on-year through early 2026 and core measures subdued at roughly 0.4%, underscoring limited price pressures and lingering, though contained, deflation risks.
- The SNB’s updated conditional inflation forecast shows minimal change from December, with averages of about 0.2% in 2025 (now complete), 0.3% in 2026, and 0.6% in 2027 under a steady 0% policy rate. However, recent flat CPI readings may slightly lower near-term expectations, preserving scope for further easing if needed.
- Global conditions remain challenging, marked by U.S. tariff escalations under President Trump, subdued external demand, and uncertainties in major export markets such as Europe and the U.S., prompting the SNB to exercise caution despite resilient Swiss domestic activity.
- Sentiment in manufacturing and export sectors stays soft amid franc appreciation and weaker foreign orders, squeezing margins. Yet, overall GDP growth is expected to be around 1.5% in 2026, with unemployment edging up modestly from historic lows.
- The SNB reaffirms its readiness to intervene via rate cuts or FX operations should deflationary pressures intensify, while emphasizing clear communication through detailed meeting minutes and coordination with global partners on currency matters.
The next meeting is on 18 June 2026.
Next 24 Hours Bias
Medium Bearish
The Pound (GBP)
Key news events today
No major news event
What can we expect from GBP today?
Sterling is holding a modestly stronger stance today, as the GBP/USD pair trades near the mid‑1.35s after a small pullback, with the pound still underpinned by a recalibration of Bank of England rate expectations toward at least two hikes in 2026, even as UK growth remains sluggish. Geopolitical flux around the Middle East and energy flows are keeping volatility elevated.
Central Bank Notes:
- The Bank of England’s Monetary Policy Committee (MPC) met on 19 March 2026, maintaining the Bank Rate at 3.75 per cent in a unanimous decision, following the prior narrow 5–4 vote to hold at the 5 February 2026 meeting. This pause reflects a sharp reversal from earlier market expectations of a 25-basis-point cut, driven by a Middle East conflict sparking global energy and commodity price surges. The March meeting did not include a Monetary Policy Report, with the next one due in April.
- Quantitative tightening (QT) proceeds unchanged at the 2025 pace of gilt holdings reductions, maintaining gradual balance-sheet normalization attuned to liquidity conditions and supportive of a restrictive stance amid new shocks.
- Headline CPI inflation faces near-term upside from the energy shock, reversing prior disinflation trends in domestic prices and wages; pre-shock services inflation had eased but now contends with higher utility and input costs, keeping pressures above the 2 per cent target. MPC projections will update in April, but analysts see inflation at 3-4 per cent by the end of 2026.
- UK growth softens further into Q2 2026, with unemployment risks rising amid potential confidence drops, higher precautionary saving, and widening output gaps; regular pay growth had cooled pre-shock but now faces business cost pass-through.
- Global headwinds intensify via Middle East conflict, driving volatile energy/commodity prices and sterling/gilt swings; MPC deems direct shocks manageable if demand weakens sufficiently to limit second-round effects.
- Inflation risks now tilt upwards from energy persistence and potential wage/cost embedding, offset by downside from demand slack and job losses; prior balance has shifted amid uncertainty on shock duration.
- The MPC adopts a wait-and-see posture post-shock, with policy deemed somewhat restrictive pre-event; all members are ready to act data-dependently for 2 per cent sustainability, eyeing April for fuller impact analysis and possible easing if disinflation resumes. Governor Bailey’s guidance stresses close monitoring without firm-cut commitments.
- The next meeting is on 30 April 2026.
Next 24 Hours Bias
Medium Bullish
The Canadian Dollar (CAD)
Key news events today
No major news event
What can we expect from CAD today?
The Canadian dollar faces bearish USD/CAD forecasts targeting declines below 1.3715 after testing 1.3815 resistance, buoyed slightly by oil resilience and labor data but pressured by shifting speculative shorts and USD stability ahead of US NFP. Weekly ranges hold at 1.37-1.41, with CAD/USD bets near 0.72 reflecting cautious optimism amid easing geopolitical risks, though reversals loom if key levels break. Traders eye inflation and oil for near-term direction in this commodity-linked currency.
Central Bank Notes:
- The Governing Council held the overnight rate target steady at 2.25% at its 25 March 2026 meeting, aligning with consensus forecasts and extending the pause in policy adjustments amid balanced risks. The Bank emphasized persistent global uncertainties from Middle East conflicts and U.S. trade policies under President Trump, but affirmed the current stance supports ongoing disinflation without immediate shifts despite elevated energy price volatility.
- U.S. tariff threats and regional geopolitical tensions continue weighing on business sentiment, though Canadian manufacturing PMI has edged higher into expansion territory, with export orders firming on energy demand. Goods exports, led by crude oil, sustained momentum into February, offsetting cautious capex as firms prioritize resilience over aggressive growth.
- Economic growth carried into Q1 2026 at an annualized pace of around 2.2%, building on Q4 2025’s solid performance, fueled by resource exports, government outlays, and manufacturing rebound. February preliminary data points to steady expansion, though winter weather and supply chain frictions modestly curbed potential upside.
- Services sector PMI climbed further above 50, with broad gains in tech, hospitality, and business services; consumer-facing areas showed tentative improvement as real wages rose, though high service costs still restrained discretionary outlays. The Bank sees this diffusion as evidence of rebalancing toward sustainable activity.
- National housing resales ticked up in January-February alongside modest price gains, buoyed by stable rates and improved affordability in select regions, while inventory buildup in urban centers prevents excessive tightening. Officials anticipate continued moderation, aided by prudent mortgage rules amid steady household formation.
- Headline CPI eased to about 2.1% year-over-year in February 2026 estimates, staying within the control band, as core gauges like CPI-trim and median dipped to near 2.7% on softer food and durable goods pressures—despite sticky shelter costs. This reinforces the Bank’s view of inflation sustainably approaching the target.
- Policymakers reiterated that 2.25% remains well-calibrated to anchor 2% inflation and foster adjustment, with no cuts signaled barring downside surprises in growth or prices. Attention now turns to Q2 durability, core inflation persistence, and evolving trade/geopolitical clarity.
- The next meeting is on 23 April 2026.
Next 24 Hours Bias
Weak Bearish
Oil
Key news events today
No major news event
What can we expect from Oil today?
Oil prices are pulling back slightly from their recent highs but remain elevated, with Brent near $98/bbl and WTI around $93/bbl, as easing Middle‑East tensions, especially optimism around a US‑Iran deal, temper earlier risk premiums, while a larger‑than‑expected drop in US crude inventories helps keep the market supported and reinforces a still‑tight near‑term supply picture across global energy markets.
Next 24 Hours Bias
Strong Bullish
The post IC Markets Global – Europe Fundamental Forecast | 17 April 2026 first appeared on IC Your Trading Edge | Official Blog.
Friday 17th April 2026: Technical Outlook and Review
429587 April 17, 2026 15:40 ICMarkets Market News
DXY (U.S. Dollar Index):
Potential Direction: Bearish
Overall momentum of the chart: Bearish
The price could see a short-term pullback toward the pivot before continuing its bearish move down toward the 1st support.
Pivot: 98.57
Supporting reasons: Identified as a pullback resistance, where selling pressures could intensify and potentially cap any upward retracement.
1st support: 97.50
Supporting reasons: Identified as an overlap support, indicating a potential area where the price could again stabilize.
1st resistance: 99.35
Supporting reasons: Identified as a pullback resistance, indicating a potential area that could halt any further upward movement
EUR/USD:
Potential Direction: Bullish
Overall momentum of the chart: Bullish
The price could see a short-term pullback toward the pivot before rising again toward the 1st resistance.
Pivot: 1.1721
Supporting reasons: Identified as a pullback support, where renewed buying pressure could emerge to push the price higher.
1st support: 1.1655
Supporting reasons: Identified as an overlap support, indicating a potential level where the price could stabilize once again.
1st resistance: 1.1820
Supporting reasons: Identified as a swing high resistance, indicating a potential level that could cap further upward movement.
EUR/JPY:
Potential Direction: Bullish
Overall momentum of the chart: Bullish
The price could see a short-term pullback toward the pivot before rising again toward the 1st resistance.
Pivot: 186.20
Supporting reasons: Identified as a pullback support, where renewed buying pressure could emerge to push the price higher.
1st support: 184.68
Supporting reasons: Identified as an overlap support, indicating a potential area where the price could again stabilize.
1st resistance: 189.75
Supporting reasons: Identified as a s resistance that aligns with the 161.8% Fibonacci extension, indicating a potential level that could cap further upward movement.
EUR/GBP:
Potential Direction: Bullish
Overall momentum of the chart: Bullish
The price could see a short-term pullback toward the pivot before rising again toward the 1st resistance.
Pivot: 0.8679
Supporting reasons: Identified as an overlap support, where renewed buying pressure could emerge to push the price higher.
1st support: 0.8660
Supporting reasons: Identified as an overlap support, indicating a potential area where the price could stabilize once more.
1st resistance: 0.8713
Supporting reasons: Identified as an overlap resistance, indicating a potential level that could cap further upward movement.
GBP/USD:
Potential Direction: Bullish
Overall momentum of the chart: Bullish
The price could see a short-term pullback toward the pivot before rising again toward the 1st resistance.
Pivot: 1.3478
Supporting reasons: Identified as a pullback support, where renewed buying pressure could emerge to push the price higher.
1st support: 1.3345
Supporting reasons: Identified as a pullback support, indicating a potential area where the price could stabilize once more.
1st resistance: 1.3598
Supporting reasons: Identified as a pullback resistance, indicating a potential level that could halt further upward movement.
GBP/JPY:
Potential Direction: Bullish
Overall momentum of the chart: Bullish
The price could see a short-term pullback toward the pivot before rising again toward the 1st resistance.
Pivot: 213.30
Supporting reasons: Identified as a pullback support, where renewed buying pressure could emerge to push the price higher.
1st support: 211.47
Supporting reasons: Identified as a pullback support, indicating a potential level where the price could stabilize once more.
1st resistance: 215.72
Supporting reasons: Identified as a resistance that aligns with the 161.8% Fibonacci extension, indicating a potential level that could halt further upward movement.
USD/CHF:
Potential Direction: Bearish
Overall momentum of the chart: Bearish
The price could see a short-term pullback toward the pivot before continuing its bearish move down toward the 1st support.
Pivot: 0.7870
Supporting reasons: Identified as a pullback resistance that aligns with the 61.8% Fibonacci retracement, where selling pressures could intensify and potentially cap any upward retracement.
1st support: 0.7770
Supporting reasons: Identified as an overlap support, indicating a potential level where the price could stabilize once again.
1st resistance: 0.7918
Supporting reasons: Identified as an overlap resistance, indicating a potential level that could cap further upward movement.
USD/JPY:
Potential Direction: Bearish
Overall momentum of the chart: Bullish
The price has already reacted off the pivot and may continue its bearish move toward the 1st support.
Pivot: 159.85
Supporting reasons: Identified as an overlap resistance, where selling pressures could intensify and potentially cap any upward retracement.
1st support: 157.66
Supporting reasons: Identified as an overlap support, indicating a strong area where buyers might return, and the price could stabilize once again.
1st resistance: 160.46
Supporting reasons: Identified as an overlap resistance. This level represents the next key area where upward movement could be capped amid increased selling pressure
USD/CAD:
Potential Direction: Brarish
Overall momentum of the chart: Bullish
The price could see a short-term pullback toward the pivot before continuing its bearish move down toward the 1st support.
Pivot: 1.3798
Supporting reasons: Identified as a pullback resistance, where selling pressures could intensify and potentially cap any upward retracement.
1st support: 1.3702
Supporting reasons: Identified as an overlap support that aligns with the 61.8% Fibonacci retracement, indicating a key level where the price could stabilize once more.
1st resistance: 1.3869
Supporting reasons: Identified as an overlap resistance, making it a possible target for bullish advances and a level where some sellers could return to cap gains
AUD/USD:
Potential Direction: Bullish
Overall momentum of the chart: Bullish
The price could see a short-term pullback toward the pivot before rising again toward the 1st resistance.
Pivot: 0.7089
Supporting reasons: Identified as a pullback support, where renewed buying pressure could emerge to push the price higher.
1st support: 0.6999
Supporting reasons: Identified as an overlap support, this area has provided strong support historically and may attract buying interest for a potential short-term bounce
1st resistance: 0.7183
Supporting reasons: Identified as a swing high resistance, indicating a potential area that could halt any further upward movement.
NZD/USD
Potential Direction: Bullish
Overall momentum of the chart: Bullish
The price could see a short-term pullback toward the pivot before rising again toward the 1st resistance.
Pivot: 0.5773
Supporting reasons: Identified as a pullback support, where renewed buying pressure could emerge to push the price higher.
1st support: 0.5679
Supporting reasons: Identified as a swing low support, this area has provided strong support historically and may attract buying interest for a potential short-term bounce
1st resistance: 0.5944
Supporting reasons: Identified as an overlap resistance, indicating a potential area that could halt any further upward movement.
US30 (DJIA):
Potential Direction: Bullish
Overall momentum of the chart: Bullish
The price could see a short-term pullback toward the pivot before rising again toward the 1st resistance.
Pivot: 47,319.51
Supporting reasons: Identified as an overlap support, where renewed buying pressure could emerge to push the price higher.
1st support: 46,578.51
Supporting reasons: Identified as a pullback support, suggesting a potential area where the price could stabilize once again.
1st resistance: 48,770.44
Supporting reasons: Identified as a pullback resistance, indicating a potential area that could halt any further upward movement.
DE40 (DAX):
Potential Direction: Bullish
Overall momentum of the chart: Bullish
The price could see a short-term pullback toward the pivot before rising again toward the 1st resistance.
Pivot: 23,410.05
Supporting reasons: Identified as an overlap support, where renewed buying pressure could emerge to push the price higher.
1st support: 22,790.93
Supporting reasons: Identified as a pullback support, indicating a key level where the price could stabilize once more.
1st resistance: 24,271.11
Supporting reasons: Identified as an overlap resistance, indicating a potential area that could halt any further upward movement.
US500 (S&P 500):
Potential Direction: Bullish
Overall momentum of the chart: Bullish
The price could see a short-term pullback toward the pivot before rising again toward the 1st resistance.
Pivot: 6,964.66
Supporting reasons: Identified as a pullback support, where renewed buying pressure could emerge to push the price higher.
1st support: 6,835.91
Supporting reasons: Identified as an overlap support, indicating a potential level where the price could stabilize once again.
1st resistance: 7,191.60
Supporting reasons: Identified as a resistance that aligns with the 127.2% Fibonacci extension, indicating a potential area that could halt any further upward movement.
BTC/USD (Bitcoin):
Potential Direction: Bullish
Overall momentum of the chart: Bearish
The price could see a short-term pullback toward the pivot before rising again toward the 1st resistance.
Pivot: 71,993.87
Supporting reasons: Identified as a pullback support, where renewed buying pressure could emerge to push the price higher.
1st support: 69,108.33
Supporting reasons: Identified as a pullback support, indicating a potential level where the price could stabilize once more.
1st resistance: 75,973.32
Supporting reasons: Identified as a swing high resistance, indicating a potential area that could halt any further upward movement.
ETH/USD (Ethereum):
Potential Direction: Bullish
Overall momentum of the chart: Bullish
The price has already bounced off the pivot and may continue its bullish move toward the 1st resistance
Pivot: 2,297.28
Supporting reasons: Identified as a pullback support, where renewed buying pressure could emerge to push the price higher.
1st support: 2,162.92
Supporting reasons: Identified as an overlap support, indicating a potential level where the price could stabilize once more.
1st resistance: 2,673.32
Supporting reasons: Identified as a resistance that aligns with the 161.8% Fibonacci extension, indicating a potential area that could halt any further upward movement.
WTI/USD (Oil):
Potential Direction: Bearish
Overall momentum of the chart: Bullish
The price has already reacted off the pivot and may continue its bearish move toward the 1st support.
Pivot: 92.39
Supporting reasons: Identified as a pullback resistance, where selling pressures could intensify and potentially cap any upward retracement.
1st support: 78.05
Supporting reasons: Identified as an overlap support, indicating a key level where the price could stabilize once more.
1st resistance: 105.53
Supporting reasons: Identified as an overlap resistance, indicating a potential area that could halt any further upward movement.
XAU/USD (GOLD):
Potential Direction: Bearish
Overall momentum of the chart: Bullish
The price could see a short-term pullback toward the pivot before continuing its bearish move down toward the 1st support.
Pivot: 4,863.14
Supporting reasons: Identified as a pullback resistance, where selling pressures could intensify and potentially cap any upward retracement.
1st support: 4,7001.11
Supporting reasons: Identified as an overlap support, indicating a key level where the price could stabilize once more.
1st resistance: 5,046.38
Supporting reasons: Identified as an overlap resistance, indicating a potential area that could halt any further upward movement.
The accuracy, completeness and timeliness of the information contained on this site cannot be guaranteed. IC Markets Global does not warranty, guarantee or make any representations, or assume any liability regarding financial results based on the use of the information in the site.
News, views, opinions, recommendations and other information obtained from sources outside of www.icmarkets.com, used in this site are believed to be reliable, but we cannot guarantee their accuracy or completeness. All such information is subject to change at any time without notice. IC Markets Global assumes no responsibility for the content of any linked site.
The fact that such links may exist does not indicate approval or endorsement of any material contained on any linked site. IC Markets Global is not liable for any harm caused by the transmission, through accessing the services or information on this site, of a computer virus, or other computer code or programming device that might be used to access, delete, damage, disable, disrupt or otherwise impede in any manner, the operation of the site or of any user’s software, hardware, data or property.
The post Friday 17th April 2026: Technical Outlook and Review first appeared on IC Your Trading Edge | Official Blog.
Friday 17th April 2026: Asia Markets Slip as Middle East Caution Offsets Wall Street Record Rally
429586 April 17, 2026 15:40 ICMarkets Market News
Global Markets:
- Asian Stock Markets : Nikkei down 0.90%, Shanghai Composite down 0.30% Hang Seng down 1.40% ASX down 0.28%
- Commodities : Gold at $4,814.96 (0.14%) Silver at $78.978 (0.34%), Brent Oil at $98.21 (-1.20%), WTI Oil at $93.46 (-1.31%)
- Rates : US 10-year yield at 4.319, UK 10-year yield at 4.8530, Germany 10-year yield at 3.0319
News & Data:
- (USD) Unemployment Claims 207K to 213K expected
Markets Update:
Asia-Pacific markets opened lower Friday as cautious optimism over developments in the Middle East tempered investor sentiment, diverging from Wall Street’s record-setting rally. U.S. President Donald Trump said the conflict involving Iran “should be ending pretty soon,” reinforcing expectations of easing tensions.
Earlier, Trump confirmed that Israel and Lebanon had agreed to a 10-day ceasefire starting at 5 p.m. ET. Iran’s parliament speaker noted that Israel halting attacks on Lebanon remains a key condition for potential U.S.-Iran negotiations. Trump also indicated the next round of in-person talks between Washington and Tehran could take place next weekend. Meanwhile, a two-week ceasefire between the U.S. and Iran is set to expire April 21.
Oil prices declined, with West Texas Intermediate falling 1.18% to $93.57 per barrel and Brent crude dropping 0.97% to $98.43. Japan’s export credit agency plans to establish a 600 billion yen ($3.8 billion) investment window to help Asian countries secure energy supplies.
Japan’s Nikkei 225 slipped 0.95% after Thursday’s record high, while the Topix lost 1.10%. South Korea’s Kospi fell 0.23%, Australia’s S&P/ASX 200 dropped 0.49%, and Hong Kong’s Hang Seng declined 0.54%.
Overnight, the S&P 500 and Nasdaq closed at fresh record highs, extending their strong rally.
Upcoming Events:
- 12:30 PM GMT – CAD Foreign Securities Purchases
The post Friday 17th April 2026: Asia Markets Slip as Middle East Caution Offsets Wall Street Record Rally first appeared on IC Your Trading Edge | Official Blog.
General Market Analysis – 17/04/26
429585 April 17, 2026 15:00 ICMarkets Market News
US Stocks Hit Record Levels on Continued Peace Hopes – S&P up 0.26%
US equity markets posted modest gains overnight, with all three major indices closing higher as sentiment remained supported by ongoing optimism surrounding developments in the Middle East. The S&P 500 rose 0.26% to finish at 7,041, while the Nasdaq gained 0.36% to a fresh record close of 24,102. The Dow Jones lagged slightly but still edged up 0.24% to 48,578. In currency markets, the US dollar strengthened modestly, rising 0.17% to 98.22, although it continues to hover near recent lows. Meanwhile, US Treasury yields pushed higher, with the 2-year yield up 1.2 basis points to 3.773% and the 10-year yield climbing 2.8 basis points to 4.311%, reflecting a slight shift in rate expectations and ongoing resilience in economic data. Commodity markets were more active, with oil prices moving higher again as traders priced in the likelihood of extended negotiations in the Middle East. Brent crude rose 3.37% to $98.16, while WTI gained 3.72% to $94.69. Gold was little changed on the session, slipping 0.05% to $4,787.78, as slightly higher yields and a firmer dollar capped upside momentum.
Markets Poised at Pivotal Levels into the Weekend
Markets are poised at key levels going into the final trading day of the week today, with traders looking for confirmation of progress in the Middle East over the coming sessions and days before committing to bigger directional positions. Market confidence was underpinned yesterday by reports of a ceasefire agreement between Israel and Lebanon, alongside confirmation that the US and Iran are set to resume talks this weekend. However, some caution remains, with indications that a broader agreement could take up to six months to finalise. Key sticking points between the US and Iran will come into contention again over the weekend, and traders will be keenly observing the Strait of Hormuz for any signs that we could see a return to significant traffic levels in the short term. Signs that traffic is increasing should see oil prices pull back and sentiment rise, whereas if traffic remains at low levels for a longer period of time, expect sentiment to sour and oil to rise further. Several key financial products are now trading at key technical levels, including major US indices, gold, AUDUSD, EURUSD, and USDJPY, and all could see significant moves if we see a step in either direction.
Quiet Calendar Day into the Weekend
Looking ahead, the macroeconomic calendar is very quiet on the final trading day of the week, once again leaving geopolitical developments in the Gulf region as the primary driver of market sentiment into the weekend. We have heard updates from President Trump already today which have appeared optimistic; however, markets are now craving certainty, and traders will be keeping a wary eye on newswires as we move through the sessions today. There is very little on the calendar for the first two sessions of the day today, and although we do hear from some big central banker names later in the day, including the MPC’s Huw Pill and Fed members Mary Daly, Thomas Barkin, and Christopher Waller, geopolitics is set to drive markets into the weekend.
The post General Market Analysis – 17/04/26 first appeared on IC Your Trading Edge | Official Blog.
IC Markets Global – Asia Fundamental Forecast | 17 April 2026
429584 April 17, 2026 15:00 ICMarkets Market News
IC Markets Global – Asia Fundamental Forecast | 17 April 2026
What happened in the U.S. session?
A slightly hotter‑than‑expected labor‑market tone, as weekly initial jobless claims undershot consensus and reinforced the view that the Fed will remain cautious on aggressive easing despite geopolitical overhangs from the Iran‑related conflict. This backdrop, combined with record‑high closes in the S&P 500 and Nasdaq and continued de‑escalation optimism in the Middle East, boosted risk‑on flows into U.S. equity futures, tech‑heavy indices, and the dollar.
What does it mean for the Asia Session?
Updates on US–Iran negotiations and the status of the Strait of Hormuz, since any shift in the perceived war risk can quickly move oil, global equities, and inflation‑sensitive assets. Regional central‑bank cues, especially from the Bank of Japan ahead of its mid‑month meeting, and the confirmation of China’s early‑year growth rebound will also shape flows into equities, FX, and commodities, with the yen, energy, and technology‑linked names remaining particularly sensitive to the day’s headlines.
The Dollar Index (DXY)
Key news events today
FOMC Member Waller Speaks (6:00 pm GMT)
What can we expect from DXY today?
The US dollar showed limited movement amid a quiet economic calendar and lingering Middle East tensions influencing trader sentiment. With no major US data releases scheduled, the Dollar Index (DXY) hovered near recent lows around 98-99, reflecting a mix of safe-haven support from stalled US-Iran talks and pressure from risk-on flows favoring currencies like the Australian dollar.
Central Bank Notes:
- The Federal Open Market Committee (FOMC) is widely expected to hold the federal funds rate target range steady at 3.50%–3.75% at its March 17–18, 2026, meeting, amid rising oil prices from the US-Israel war against Iran and persistent inflation pressures, delaying any 2026 cuts potentially to September.
- The Committee continues to pursue maximum employment and 2% inflation goals, with the labor market weakening further as nonfarm payrolls declined by 92,000 in February 2026 and the unemployment rate rose to 4.4% from 4.3% in January.
- Officials face tilted risks from geopolitical tensions, elevated oil prices, and sticky inflation, with CPI steady at 2.4% year-over-year in February 2026, headline PCE at 2.8% in January, and core PCE rising to 3.1%.
- Economic activity has cooled after robust Q4 2025 growth near 5%, with the Atlanta Fed GDPNow now estimating Q1 2026 growth at around 2.1%–2.7% amid softer consumer spending and labor data.
- December 2025’s Summary of Economic Projections forecasts 2025 unemployment at a median of 4.5%, 2026 GDP growth at 2.3%, and core PCE at 2.5%, with the dot plot signaling one more cut in 2026 to a median 3.4% funds rate; March updates may reflect softer labor and inflation upticks.
- The Committee maintains its data-dependent stance amid a softening labor market, inflation above target, and new oil shocks, likely holding rates at 3.50%-3.75% with ongoing divisions and possible hawkish dissents on rate cuts.
- The FOMC continues its adjusted quantitative tightening, with Treasury rolloff caps at $5 billion per month and agency MBS at $35 billion per month to ensure ample reserves post-2025 program adjustments.
- The next meeting is scheduled for 28 to 29 April 2026.
Next 24 Hours Bias
Medium Bearish
Gold (XAU)
Key news events today
FOMC Member Waller Speaks (6:00 pm GMT)
What can we expect from Gold today?
Gold prices showed modest gains, holding steady around $4,800-$4,850 per ounce amid ongoing Middle East tensions and safe-haven demand, though the metal remained on track for a weekly decline after five weeks of gains. Forecasts suggested a trading range of $4,701-$4,996, with recovery potential driven by US Dollar weakness ahead of key jobs data and oil price stabilization following Trump administration comments on Iran-related supply issues.
Next 24 Hours Bias
Medium Bullish
The Australian Dollar (AUD)
Key news events today
No major news event
What can we expect from AUD today?
AUD/USD rose 0.66% to 0.7172, with forecasts eyeing 0.71 by quarter-end and 0.73 in 12 months; however, oil price surges and Strait of Hormuz risks capped upside amid vacillating USD sentiment. Technicals suggest mild bullish bias above 0.6976 Fibonacci support, though reversals below 0.6985 could target 0.6775.
Central Bank Notes:
- The Reserve Bank of Australia (RBA) is expected to hold its cash rate at 3.85% at the March 16-17, 2026 policy meeting, following the widely anticipated 25 basis point hike to 3.85% in early February after persistent inflation pressures from late 2025. While some banks like CBA, NAB, and Westpac now forecast a further 25 basis point rise to 4.10% as soon as May if inflation data remains sticky, consensus tilts toward a pause in March to assess incoming monthly CPI and labor market signals. The February hike reversed prior cuts, entering mildly restrictive territory amid capacity pressures, with the board emphasizing data dependence.
- Inflation remains elevated, with December 2025 CPI at 3.8% year-on-year and trimmed mean at 3.3%, above the 2–3% target midpoint. RBA’s February Statement revised forecasts higher, projecting trimmed-mean inflation to peak in mid-2026 above 3% and remain elevated through early 2027, driven by services, housing, and demand resilience despite some monthly cooling, such as January’s 0.2% MoM gauge. Monthly CPI data continues to highlight core stickiness beyond energy rebates, delaying the target return to late 2027 or beyond.
- January 2026 monthly indicators showed modest easing, but headline CPI risks upward surprises from housing (up recently) and services amid firm domestic demand. Trimmed mean pressures persist from wage growth and capacity constraints, with consumer expectations ticking to 5% YoY in February surveys. Enhanced monthly reporting sharpens vigilance on potential broad-based pick-up.
- The labor market shows softening, with unemployment around 4.1-4.4%, down slightly to 4.1% in December, but unit labor costs are elevated due to subdued productivity. Household spending faces higher borrowing costs post-hike, yet private demand recovery sustains capacity strains. Vulnerabilities persist amid resilient employment dynamics.
- Global growth modestly revised up but tempered by geopolitics and commodity volatility; policy now restrictive post-February, with the RBA balancing inflation against employment risks. Data from the monthly CPI and Q1 GDP will guide, amid household debt sensitivities.
- Sustained restrictive stance post-February anchors inflation return to target, upholding dual mandate with flexibility to new risks like further inflation upticks.
- Markets price a March hold at 3.85%, with big four banks split: CBA, NAB, Westpac eye May hike to 4.10% if persistence continues, while others see limited upside unless acceleration. Upcoming monthly CPI pivotal for Q2 trajectory.
- Policy vigilance counters inflation stickiness against household fragilities and global uncertainties, reaffirming adaptability under dual mandate.
- Base case favors March hold with risks tilted hawkish for further hikes if data is hot; monthly indicators key to 2026 path.
- The next meeting is on 5 to 6 May 2026.
Next 24 Hours Bias
Medium Bullish
The Kiwi Dollar (NZD)
Key news events today
No major news event
What can we expect from NZD today?
The NZD/USD pair exhibited upward momentum in a bullish channel around 0.5902, driven by technical indicators and recent RBNZ stability, despite lingering pressures from global risk aversion and Middle East developments; no confirmed events or shifts were reported specifically for April 17.
Central Bank Notes:
- The Reserve Bank of New Zealand’s (RBNZ) Monetary Policy Committee (MPC) is widely expected to hold the Official Cash Rate (OCR) steady at 2.25% at its 8 April 2026 Monetary Policy Review, aligning with unanimous market consensus from Reuters polls and previews.
- The MPC continues its data-dependent “wait-and-see” approach after February’s pause, balancing stimulus from prior 325 basis point cuts against inflation’s path back to the 2% target, with readiness for gradual normalization only if recovery strengthens or inflation exceeds forecasts.
- Headline CPI, last at 3.1%, is on track to re-enter the 1-3% band in Q2 2026 and hit 2% by mid-2027, aided by spare capacity, moderating wages, and softer food/fuel prices; two-year business inflation expectations have ticked up slightly to 2.37%.
- Household spending and housing remain subdued amid cautious consumption, low net migration, and labor market softness, though easing retail rates support budgets; high-frequency GDP indicators show steadying momentum in an early recovery phase.
- Accommodative borrowing costs from the low OCR are boosting mortgage approvals and sentiment, but business credit growth lags due to uneven confidence; overall stimulus persists below the 3% neutral rate.
- Risks are balanced, with a favorable global environment—including stronger dairy/meat exports and a softer NZ dollar—offsetting oil shocks and prior China/US trade worries; vigilance remains on second-round inflation effects.
- Forecasts point to potential OCR hikes starting late 2026 (e.g., December) or early 2027 to 2.50% by year-end if activity/inflation firms, but policy stays supportive if recovery unfolds gradually as expected.
- The next meeting is on 27 May 2026.
Next 24 Hours Bias
Medium Bearish
The Japanese Yen (JPY)
Key news events today
No major news event
What can we expect from JPY today?
The Japanese Yen (JPY) saw limited movement amid thin trading volumes influenced by the Good Friday holiday hangover and anticipation for the Bank of Japan’s (BoJ) policy meeting on April 28. USD/JPY hovered around 159.60 during Asian hours, stabilizing after recent gains but facing downward pressure from Tokyo’s verbal intervention warnings and BoJ officials like Koji Nakamura highlighting oil price risks to growth and inflation outlook.
Central Bank Notes:
- The Policy Board of the Bank of Japan meets on 18–19 April 2026, with markets anticipating the short-term policy rate to remain at 0.75%, as the bank continues evaluating the December 2025 and prior hikes’ effects amid data-dependent normalization.
- The BOJ will target the uncollateralized overnight call rate around 0.75% and indicate future hikes hinge on impacts to lending, financing, and activity, with Governor Ueda signaling scrutiny of data for potential moves in April or later meetings.
- JGB tapering advances per plan, cutting outright purchases by ¥400 billion quarterly through Q1 2026 and slowing to ¥200 billion from April onward, targeting roughly ¥2-3 trillion monthly by mid-2026, adjustable for market stability
- Japan’s economy maintains moderate growth into Q1 2026, building on the Q4 2025 rebound via exports and fiscal measures, though manufacturing sentiment holds soft amid overseas demand weakness and yen pressures.
- Core CPI (ex-fresh food) likely stays near 2.3-2.5% y/y in early 2026. Tokyo prints off prior highs but above 2%, while core-core hovers around 2.6%, reflecting sustained but easing inflationary forces.
- Input costs ease further from import peaks, yet services inflation, 5% wage targets in shunto talks, and anchored expectations above 2% support price persistence, with upside risks from yen and geopolitics.
- Near-term real GDP may ease below trend due to tightening and external shocks like Iran tensions, but negative real rates, wage gains, and stimulus should underpin consumption and capex rebound.
- Medium-term, overseas recovery, labor shortages, and productivity lifts are set to fuel wages and core inflation near/above 2%, enabling gradual hikes toward 1% if conditions align.
- The next meeting is on 27 to 28 April 2026.
Next 24 Hours Bias
Medium Bearish
Oil
Key news events today
No major news event
What can we expect from Oil today?
Oil prices stabilize in the $90-$100 range after a turbulent week marked by a 12% WTI drop from $117 highs, fueled by unwinding geopolitical bets on US-Iran conflict and Hormuz disruptions that slashed 13 million b/d flows. Bearish technicals signal potential breaks below $86.80 support, tempered by fragile truce talks and OPEC+ quota tweaks, keeping traders cautious amid volatility.
Next 24 Hours Bias
Strong Bullish
The post IC Markets Global – Asia Fundamental Forecast | 17 April 2026 first appeared on IC Your Trading Edge | Official Blog.
Ex-Dividend 17/04/2026
429561 April 16, 2026 17:40 ICMarkets Market News
The post Ex-Dividend 17/04/2026 first appeared on IC Your Trading Edge | Official Blog.
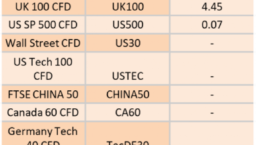
Ex-Dividend 16/04/2026
429528 April 15, 2026 17:40 ICMarkets Market News
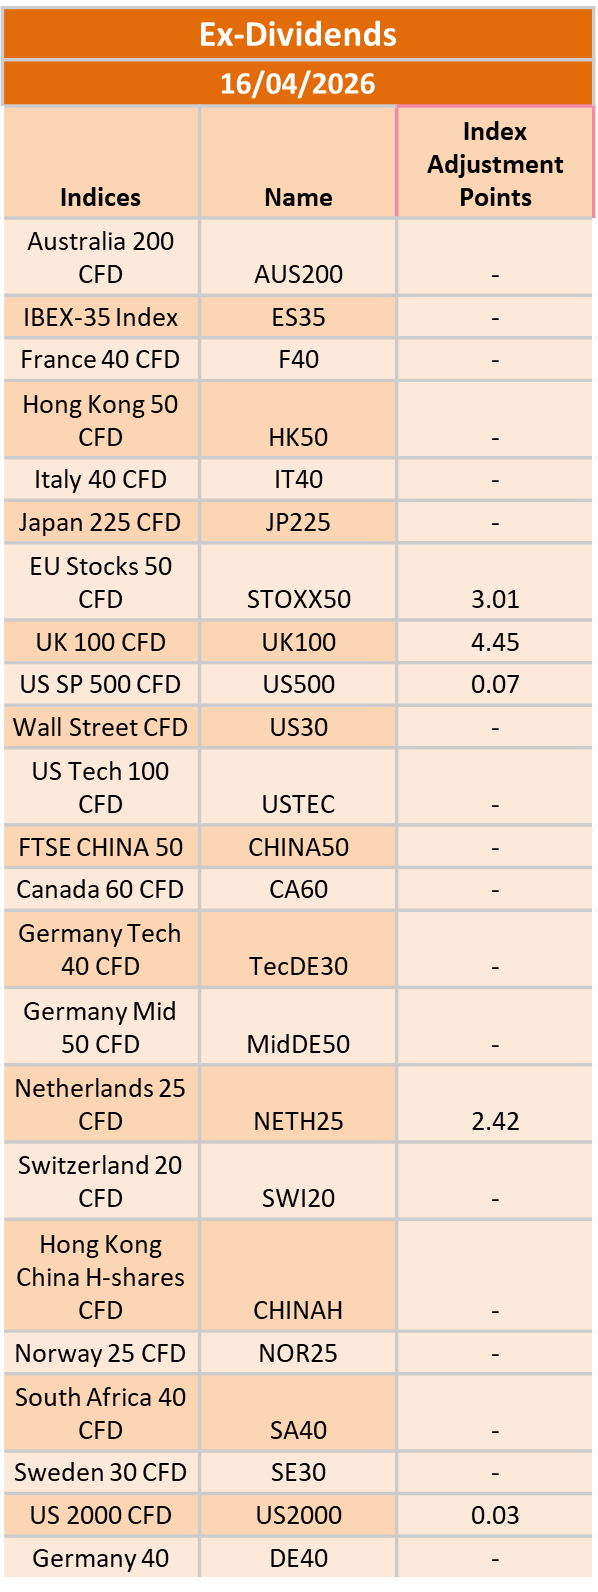
The post Ex-Dividend 16/04/2026 first appeared on IC Your Trading Edge | Official Blog.
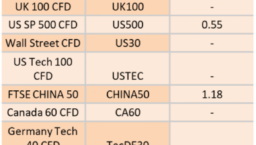
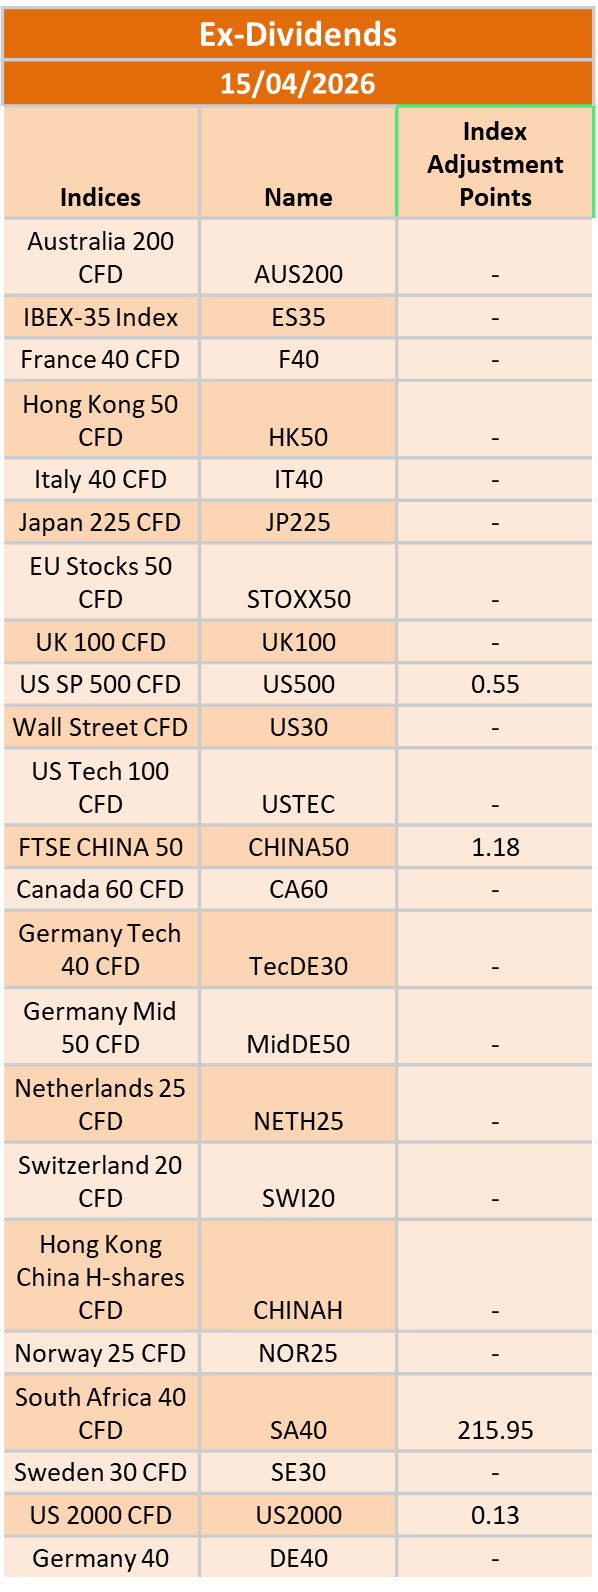
Ex-Dividend 15/04/2026
429526 April 15, 2026 17:40 ICMarkets Market News
The post Ex-Dividend 15/04/2026 first appeared on IC Your Trading Edge | Official Blog.