Articles
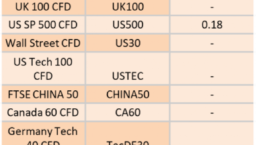
Ex-Dividend 14/04/2026
429478 April 13, 2026 17:40 ICMarkets Market News
The post Ex-Dividend 14/04/2026 first appeared on IC Your Trading Edge | Official Blog.
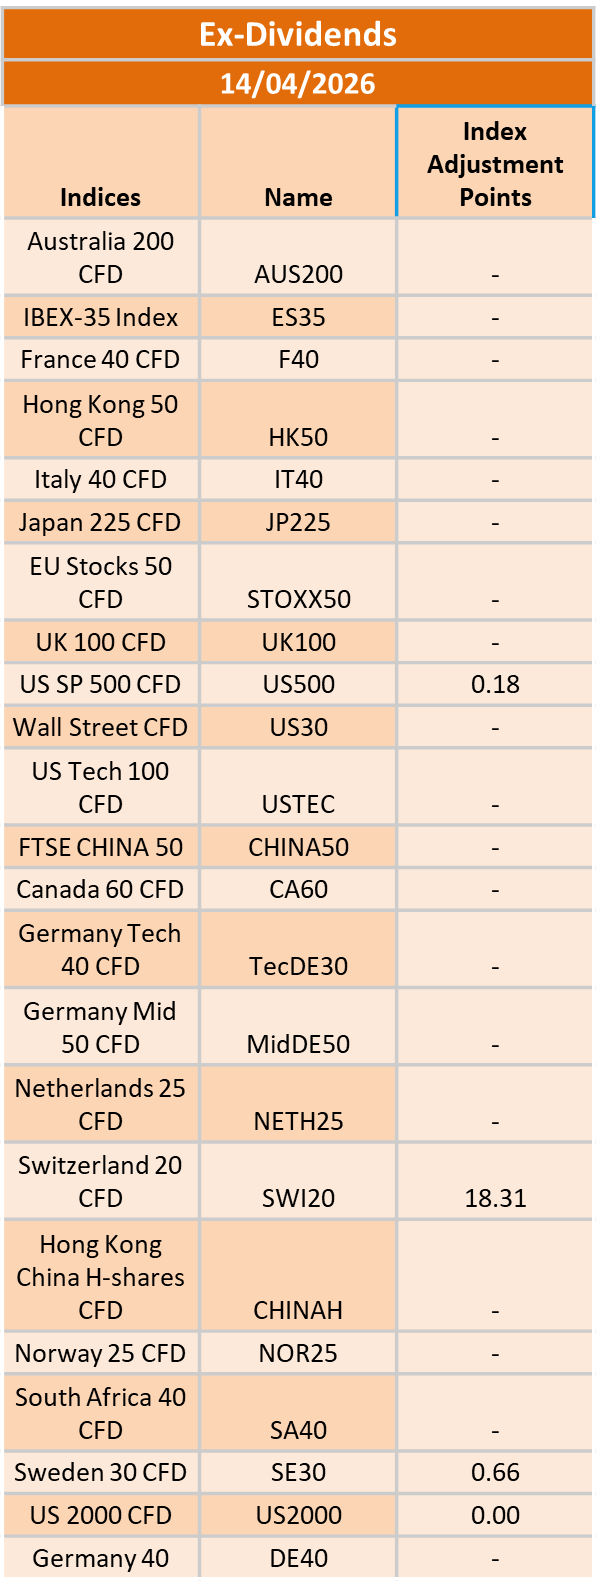
Ex-Dividend 13/04/2026
429449 April 10, 2026 17:00 ICMarkets Market News
The post Ex-Dividend 13/04/2026 first appeared on IC Your Trading Edge | Official Blog.
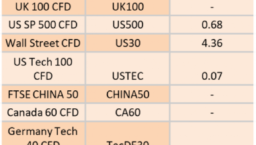
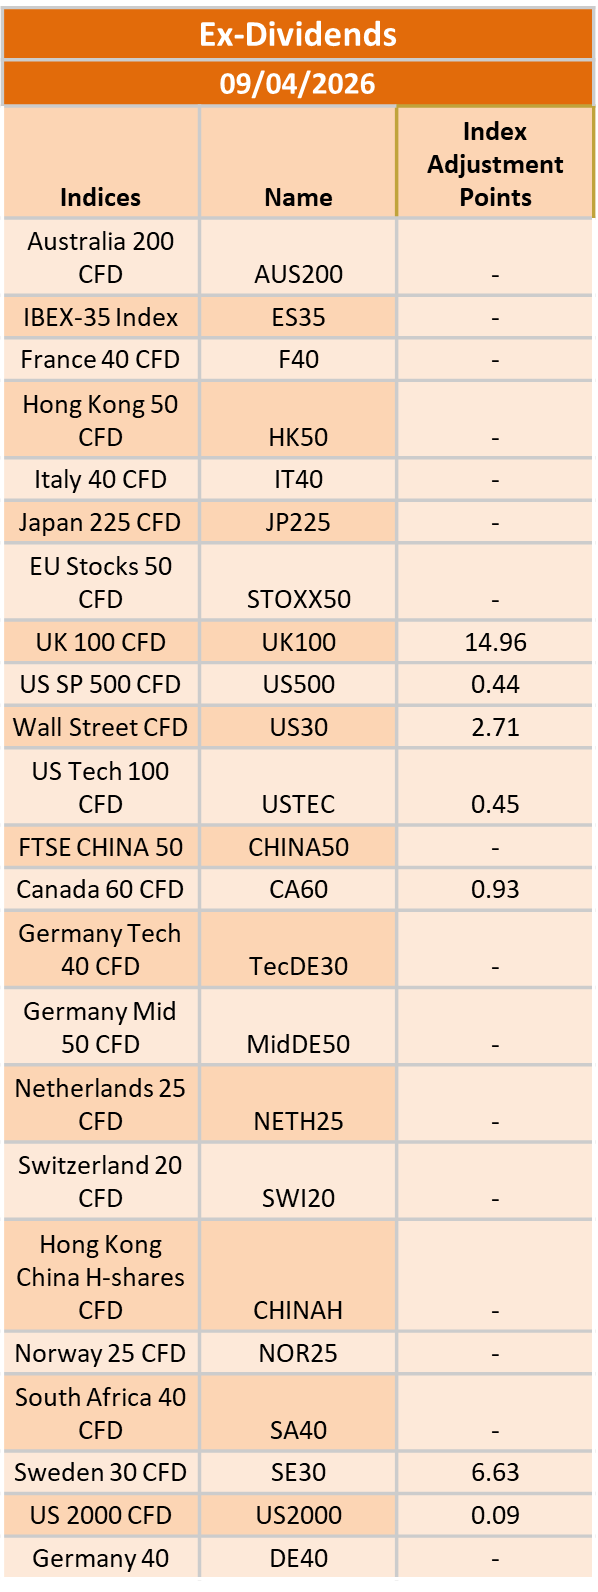
Ex-Dividend 10/04/2026
429415 April 9, 2026 18:00 ICMarkets Market News
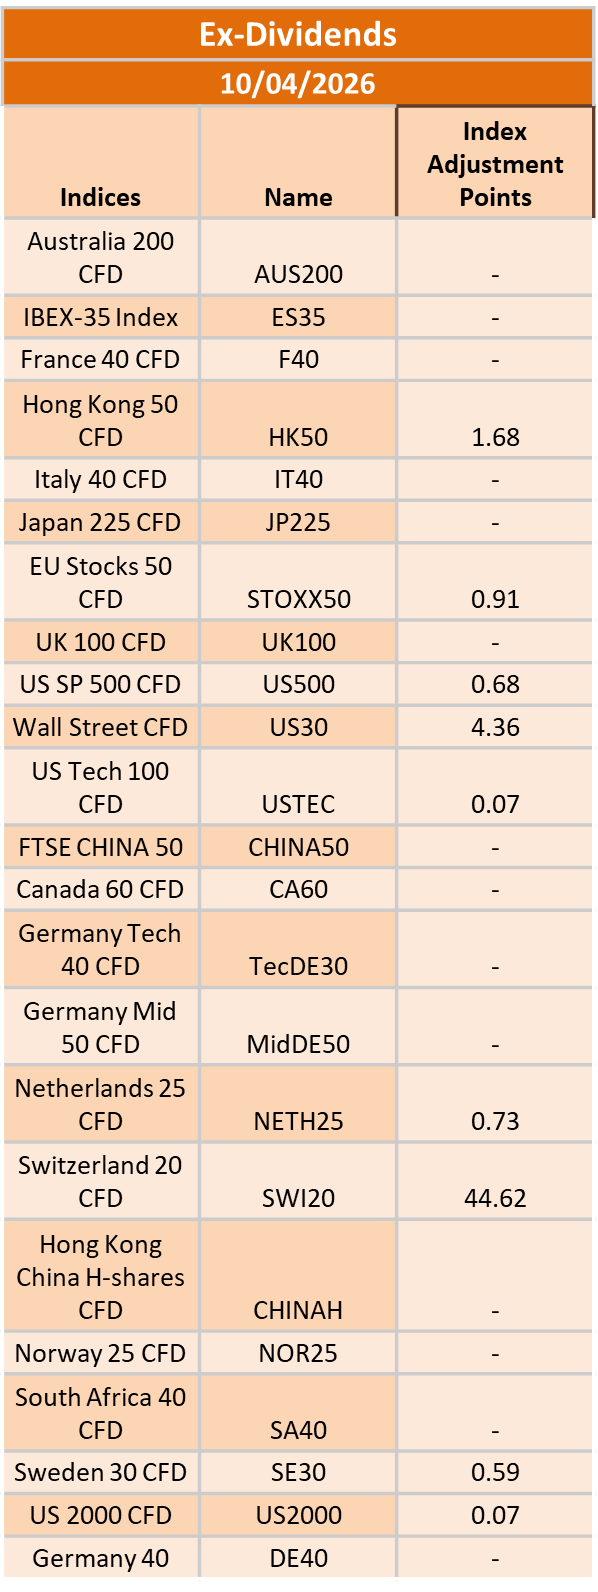
The post Ex-Dividend 10/04/2026 first appeared on IC Your Trading Edge | Official Blog.
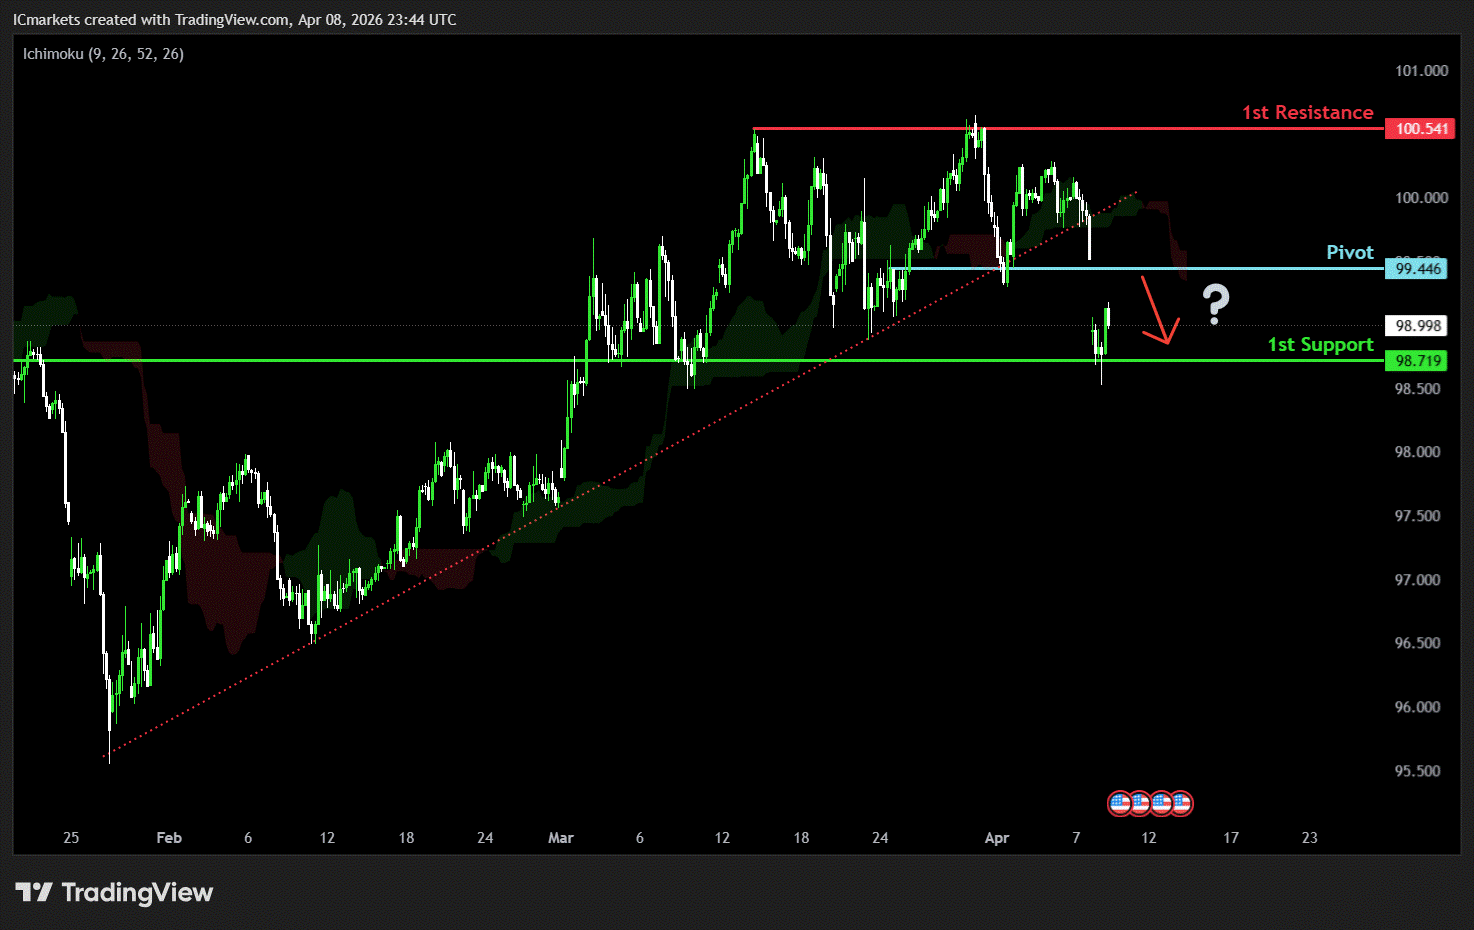
Thursday 9th April 2026: Technical Outlook and Review
429395 April 9, 2026 14:40 ICMarkets Market News
DXY (U.S. Dollar Index):
Potential Direction: Bearish
Overall momentum of the chart: Bearish
The price could see a short-term pullback toward the pivot before continuing its bearish move down toward the 1st support.
Pivot: 99.44
Supporting reasons: Identified as a pullback resistance, where selling pressures could intensify and potentially cap any upward retracement.
1st support: 98.71
Supporting reasons: Identified as a pullback support, indicating a potential area where the price could again stabilize.
1st resistance: 100.54
Supporting reasons: Identified as a swing high resistance, indicating a potential area that could halt any further upward movement
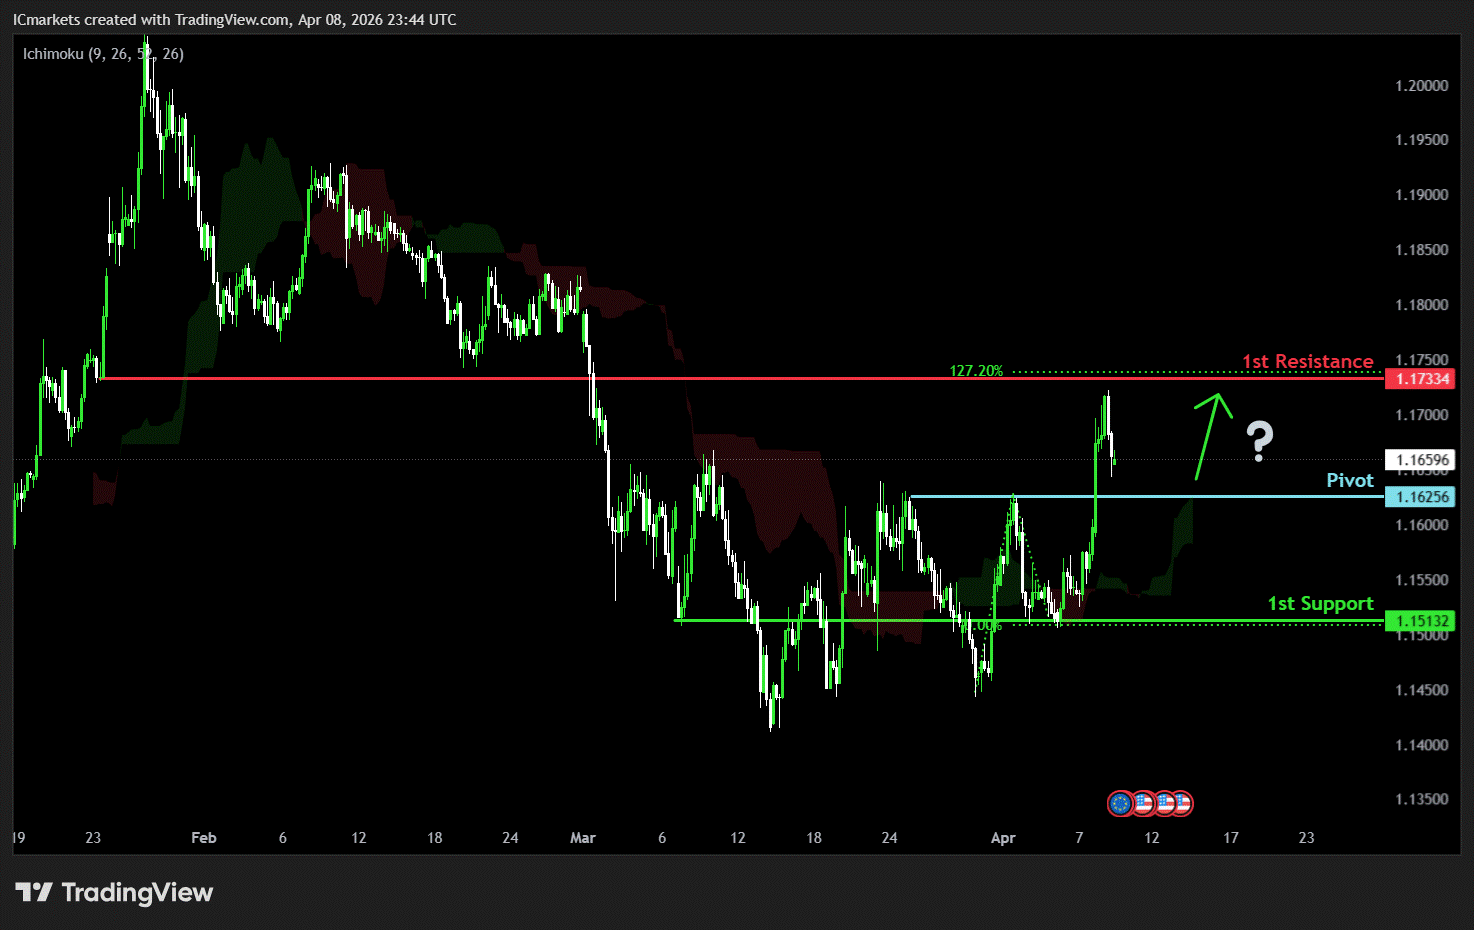
EUR/USD:
Potential Direction: Bullish
Overall momentum of the chart: Bullish
The price could see a short-term pullback toward the pivot before rising again toward the 1st resistance.
Pivot: 1.1625
Supporting reasons: Identified as a pullback support, where renewed buying pressure could emerge to push the price higher.
1st support: 1.1513
Supporting reasons: Identified as a pullback support, indicating a potential level where the price could stabilize once again.
1st resistance: 1.1733
Supporting reasons: Identified as a pullback resistance that aligns with the 127.2% Fibonacci projection, indicating a potential level that could cap further upward movement.
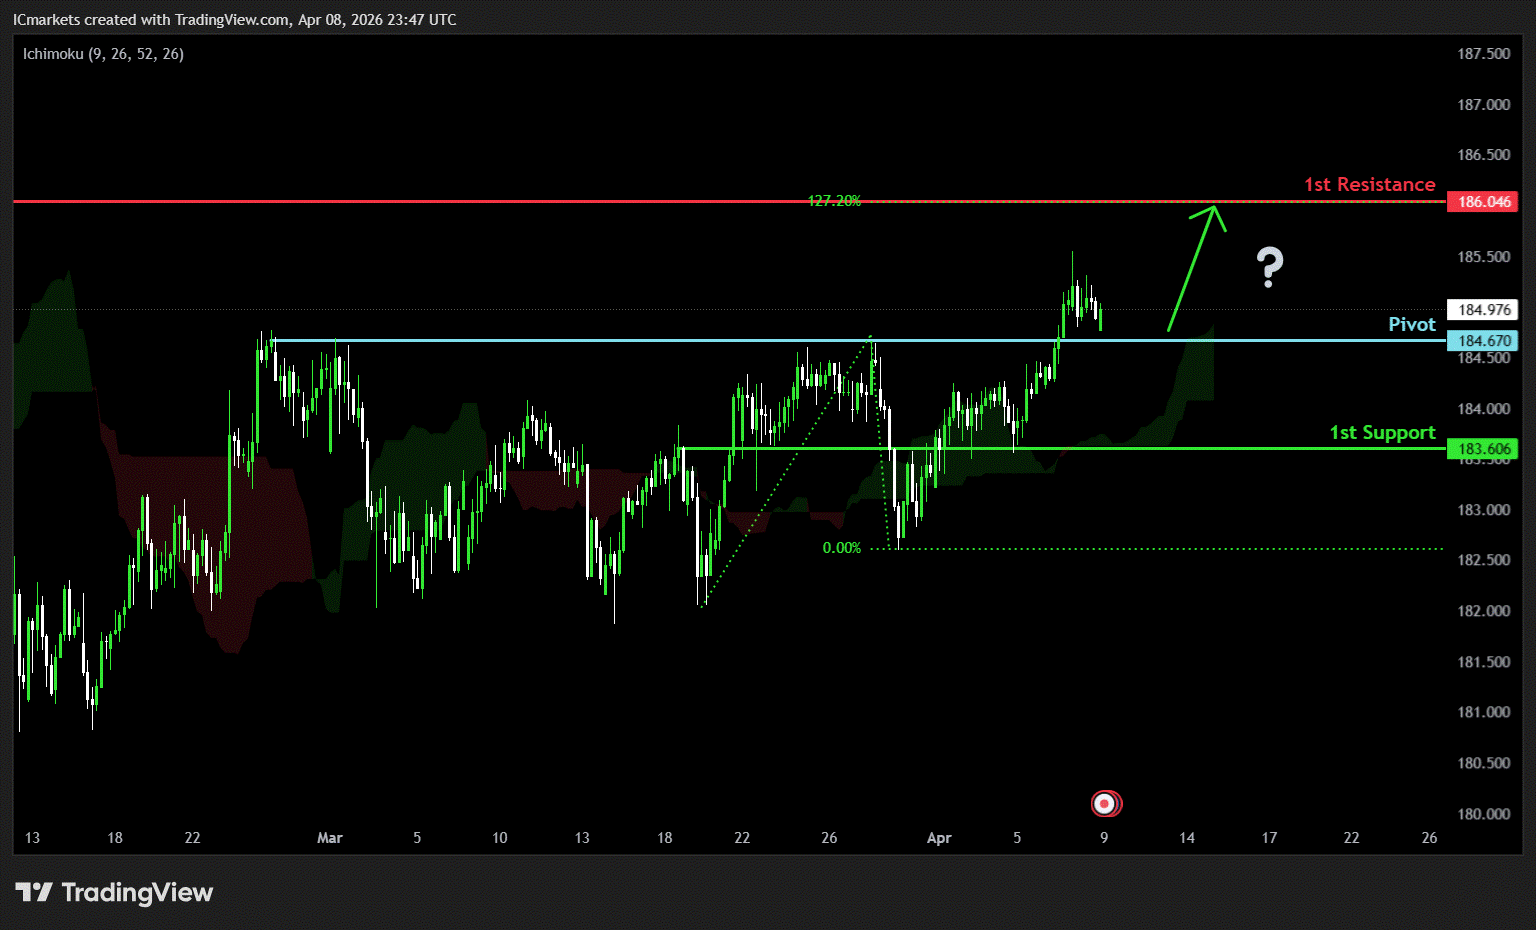
EUR/JPY:
Potential Direction: Bullish
Overall momentum of the chart: Bullish
The price could see a short-term pullback toward the pivot before rising again toward the 1st resistance.
Pivot: 184.67
Supporting reasons: Identified as a pullback support, where renewed buying pressure could emerge to push the price higher.
1st support: 183.60
Supporting reasons: Identified as an overlap support, indicating a potential area where the price could again stabilize.
1st resistance: 186.04
Supporting reasons: Identified as a swing high resistance that aligns with the 127.2% Fibonacci projection, indicating a potential level that could cap further upward movement.
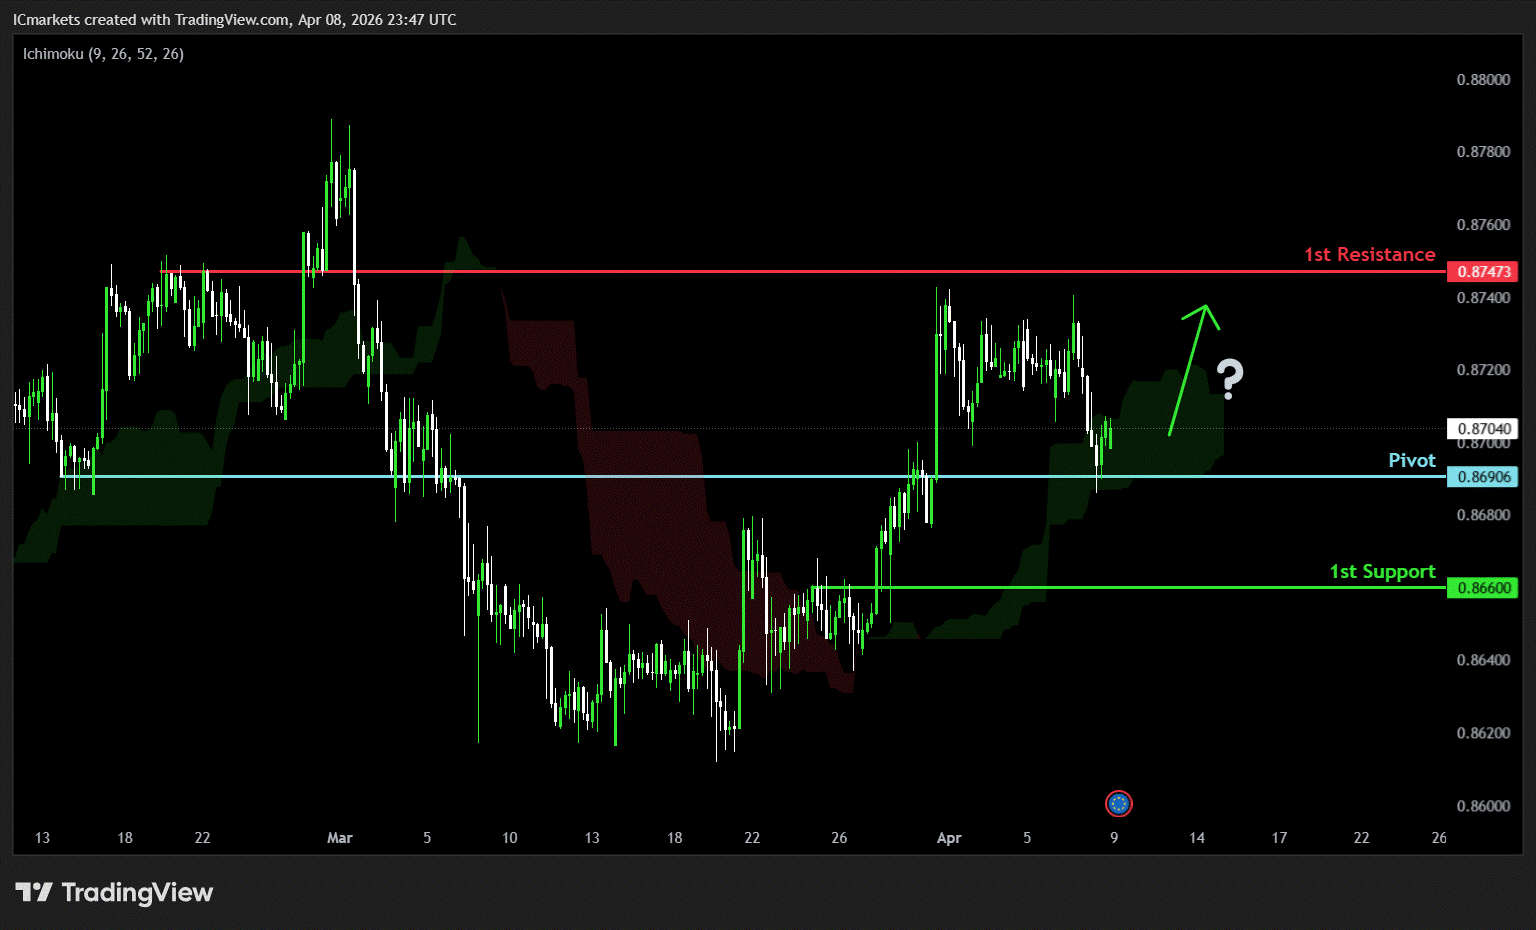
EUR/GBP:
Potential Direction: Bullish
Overall momentum of the chart: Bullish
The price has already bounced off the pivot and may continue its bullish move toward the 1st resistance
Pivot: 0.8690
Supporting reasons: Identified as a pullback support, where renewed buying pressure could emerge to push the price higher.
1st support: 0.8660
Supporting reasons: Identified as an overlap support, indicating a potential area where the price could stabilize once more.
1st resistance: 0.8747
Supporting reasons: Identified as a pullback resistance, indicating a potential level that could cap further upward movement.
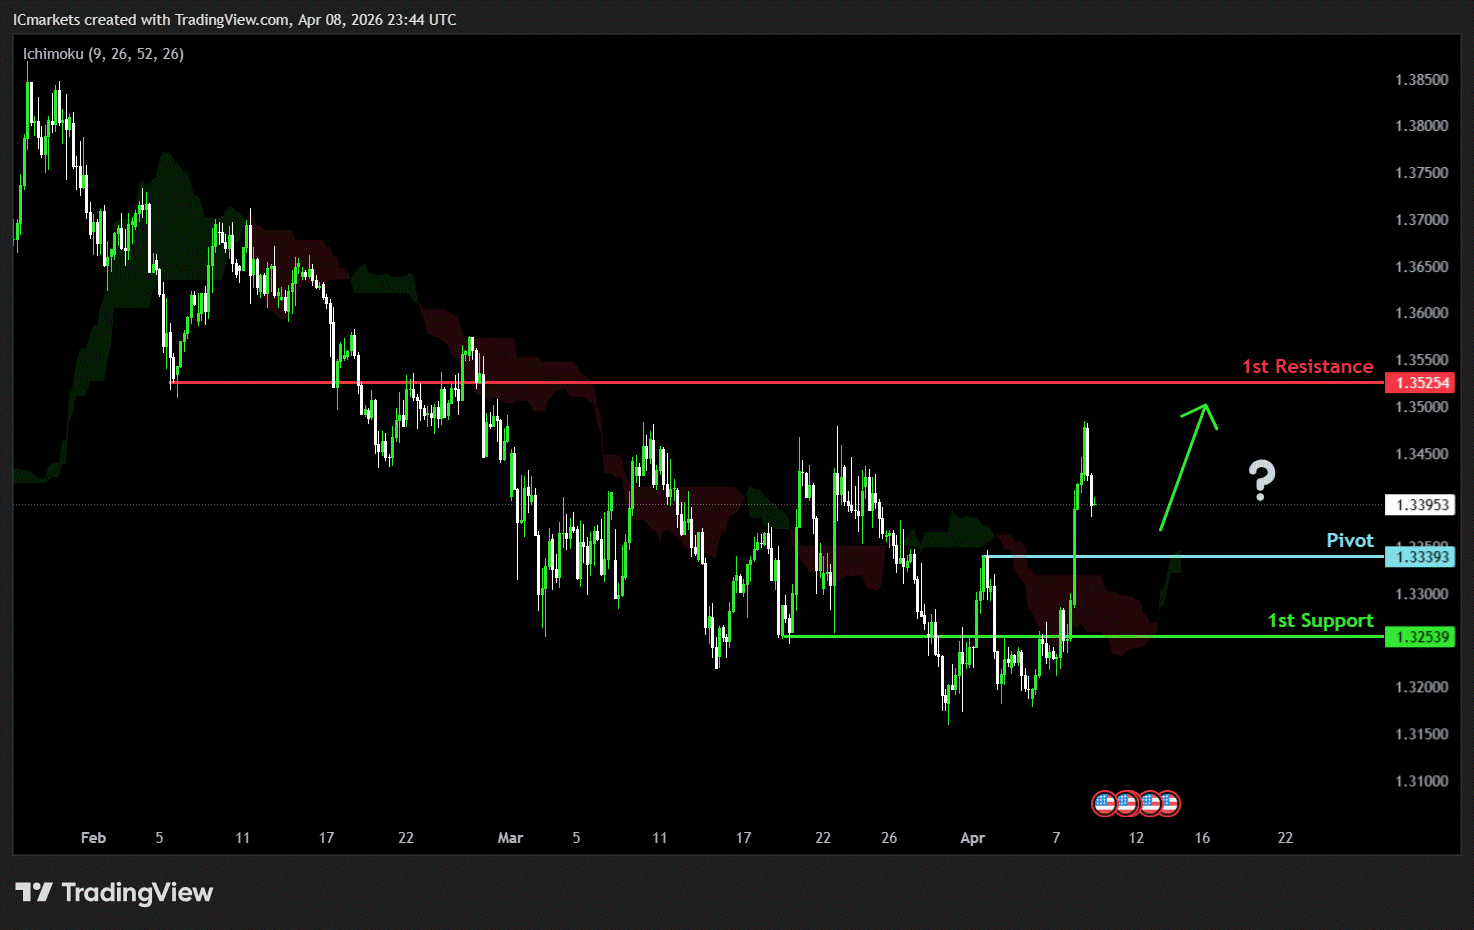
GBP/USD:
Potential Direction: Bullish
Overall momentum of the chart: Bullish
The price could see a short-term pullback toward the pivot before rising again toward the 1st resistance.
Pivot: 1.3393
Supporting reasons: Identified as a pullback support, where renewed buying pressure could emerge to push the price higher.
1st support: 1.3253
Supporting reasons: Identified as a pullback support, indicating a potential area where the price could stabilize once more.
1st resistance: 1.3525
Supporting reasons: Identified as a pullback resistance, indicating a potential level that could halt further upward movement.
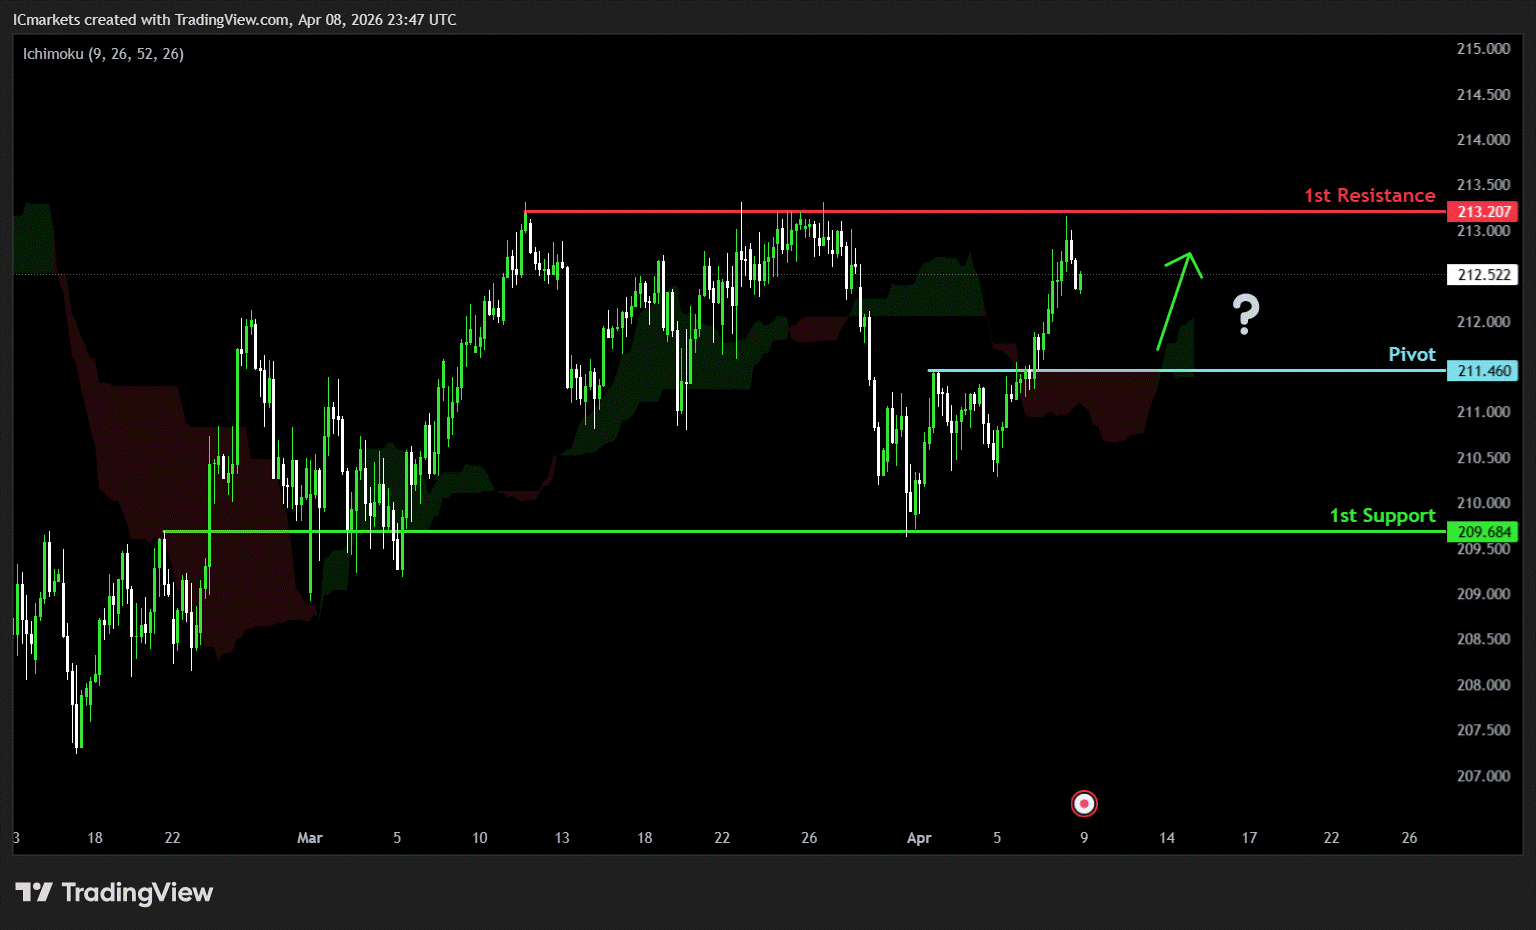
GBP/JPY:
Potential Direction: Bullish
Overall momentum of the chart: Bullish
The price could see a short-term pullback toward the pivot before rising again toward the 1st resistance.
Pivot: 211.46
Supporting reasons: Identified as a pullback support, where renewed buying pressure could emerge to push the price higher.
1st support: 209.68
Supporting reasons: Identified as an overlap support, indicating a potential level where the price could stabilize once more.
1st resistance: 213.20
Supporting reasons: Identified as a swing high resistance, indicating a potential level that could halt further upward movement.
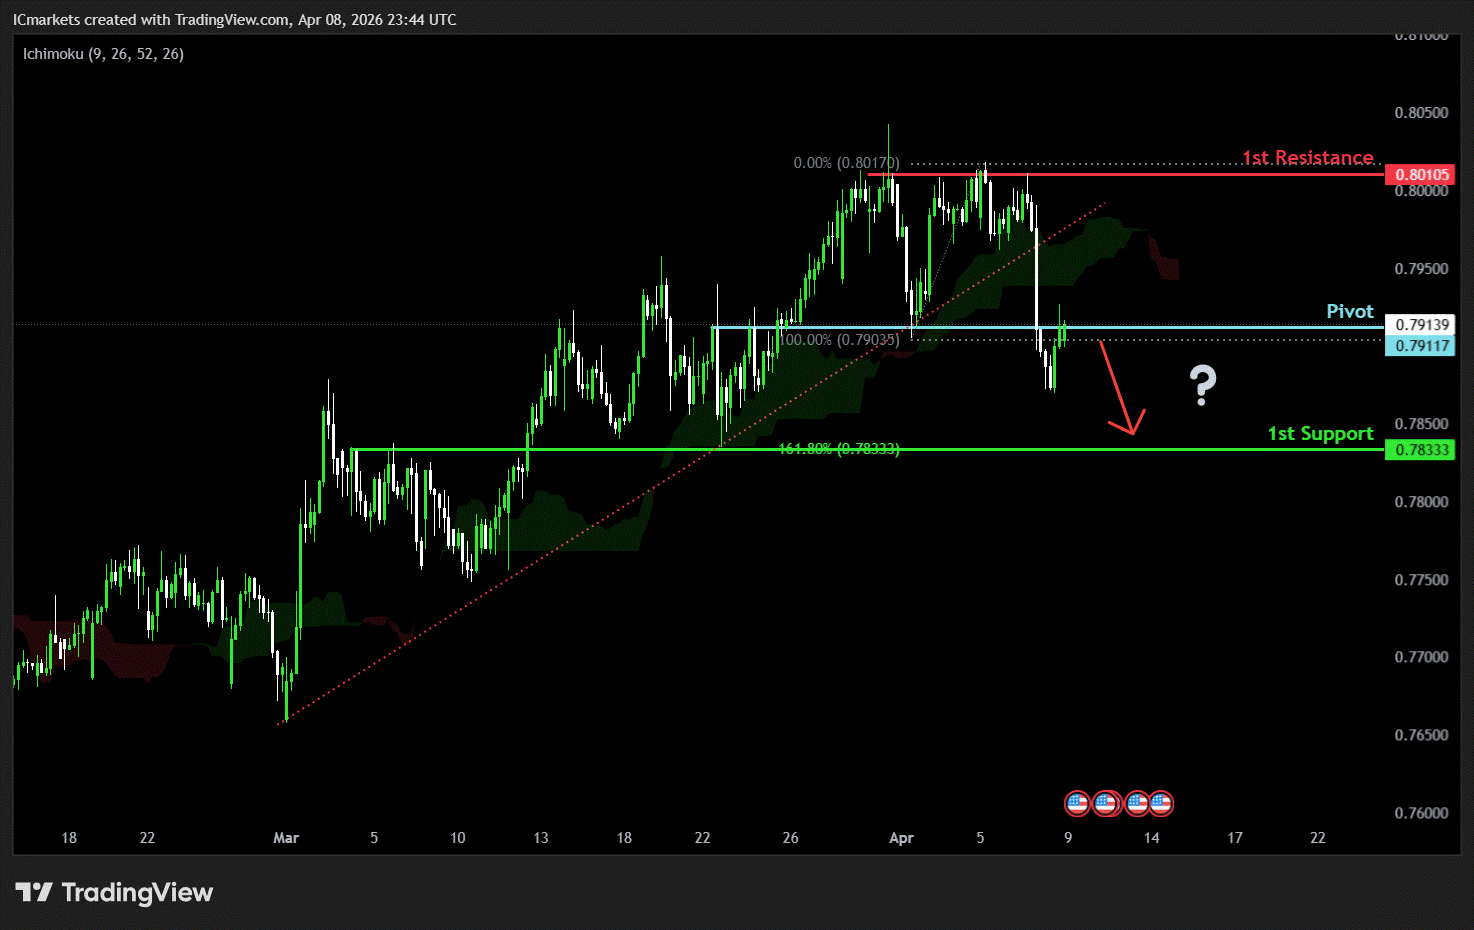
USD/CHF:
Potential Direction: Bearish
Overall momentum of the chart: Bearish
The price could see a short-term pullback toward the pivot before continuing its bearish move down toward the 1st support.
Pivot: 0.7911
Supporting reasons: Identified as a pullback resistance, where selling pressures could intensify and potentially cap any upward retracement.
1st support: 0.7859
Supporting reasons: Identified as an overlap support that aligns with the 161.8% Fibonacci extension, indicating a potential level where the price could stabilize once again.
1st resistance: 0.8010
Supporting reasons: Identified as a swing high resistance, indicating a potential level that could cap further upward movement.
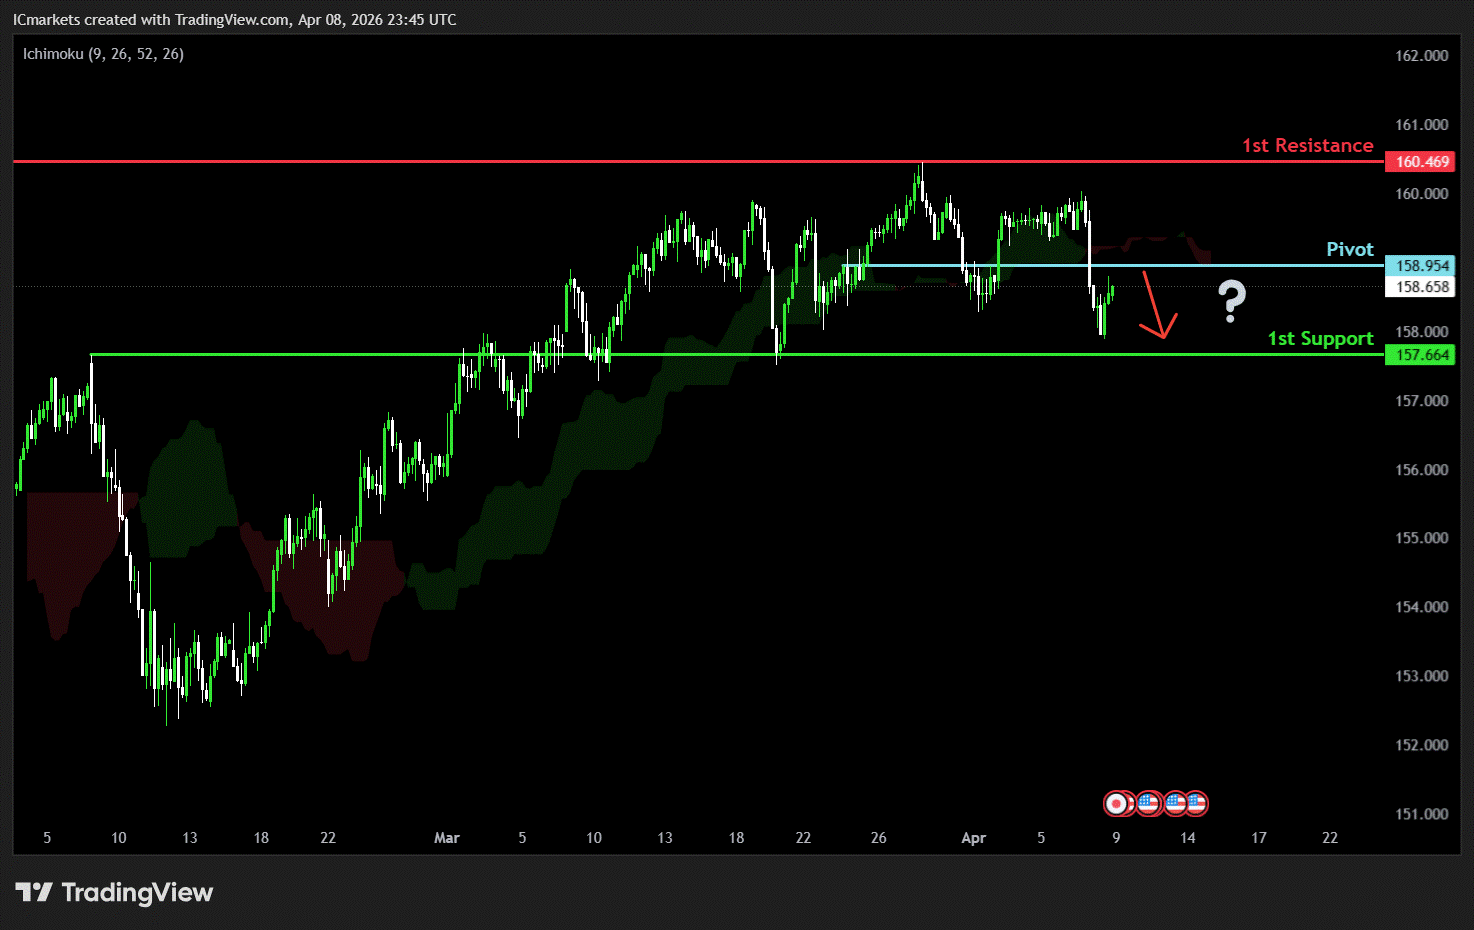
USD/JPY:
Potential Direction: Bearish
Overall momentum of the chart: Bullish
The price could see a short-term pullback toward the pivot before continuing its bearish move down toward the 1st support.
Pivot: 158.95
Supporting reasons: Identified as a pullback resistance, where selling pressures could intensify and potentially cap any upward retracement.
1st support: 157.64
Supporting reasons: Identified as an overlap support, indicating a strong area where buyers might return, and the price could stabilize once again.
1st resistance: 160.46
Supporting reasons: Identified as an overlap resistance. This level represents the next key area where upward movement could be capped amid increased selling pressure
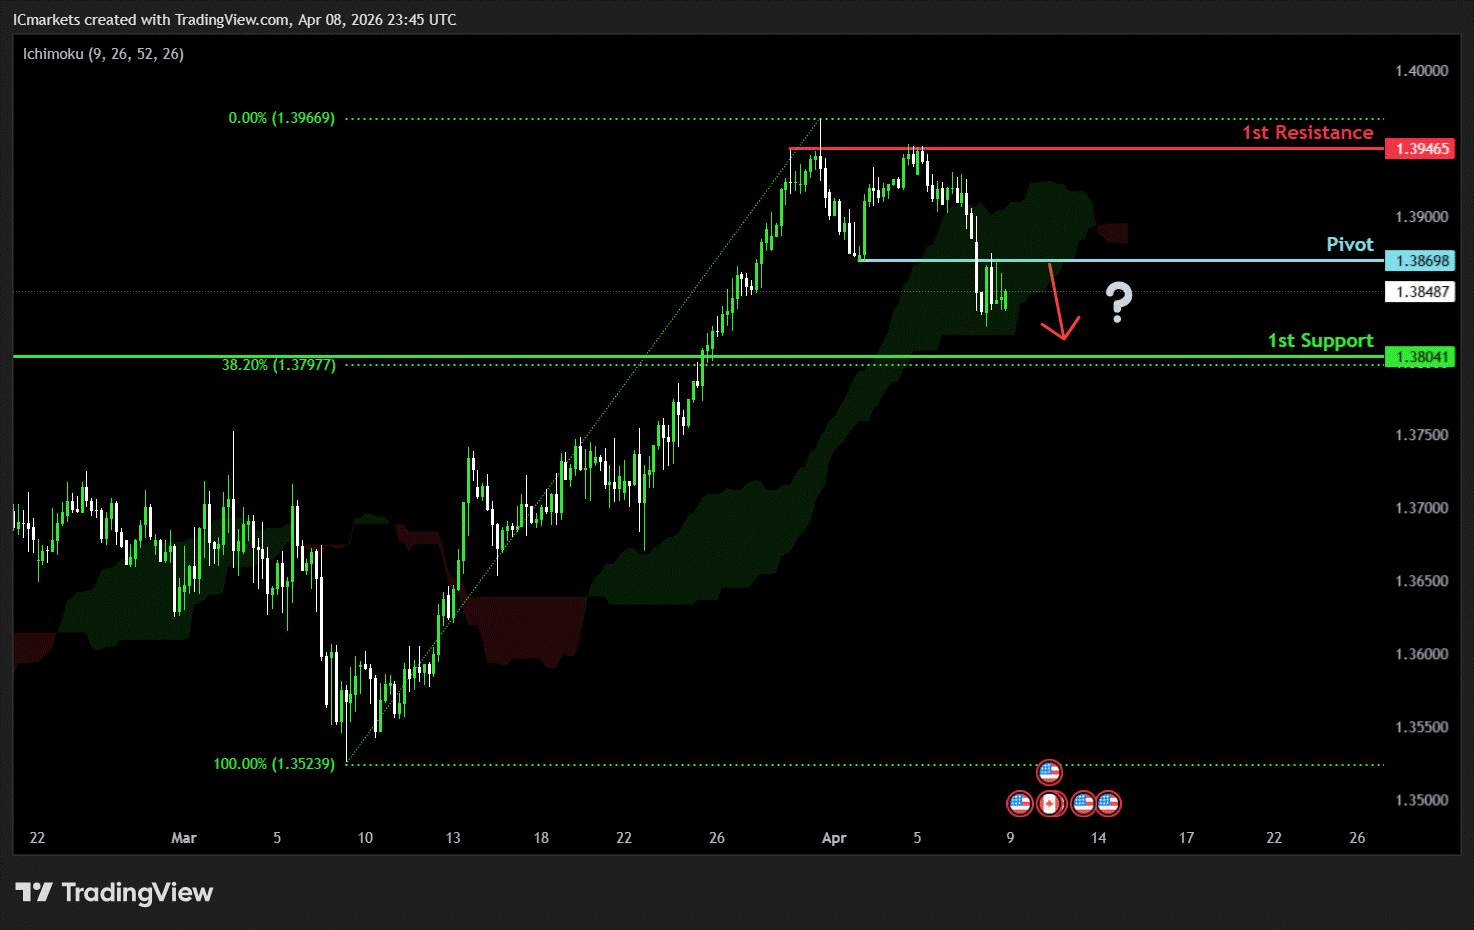
USD/CAD:
Potential Direction: Brarish
Overall momentum of the chart: Bullish
The price has already reacted off the pivot and may continue its bearish move toward the 1st support.
Pivot: 1.3869
Supporting reasons: Identified as a pullback resistance, where selling pressures could intensify and potentially cap any upward retracement.
1st support: 1.3804
Supporting reasons: Identified as a pullback support that aligns with the 38.2% Fibonacci retracement, indicating a key level where the price could stabilize once more.
1st resistance: 1.3946
Supporting reasons: Identified as a swing high resistance, making it a possible target for bullish advances and a level where some sellers could return to cap gains
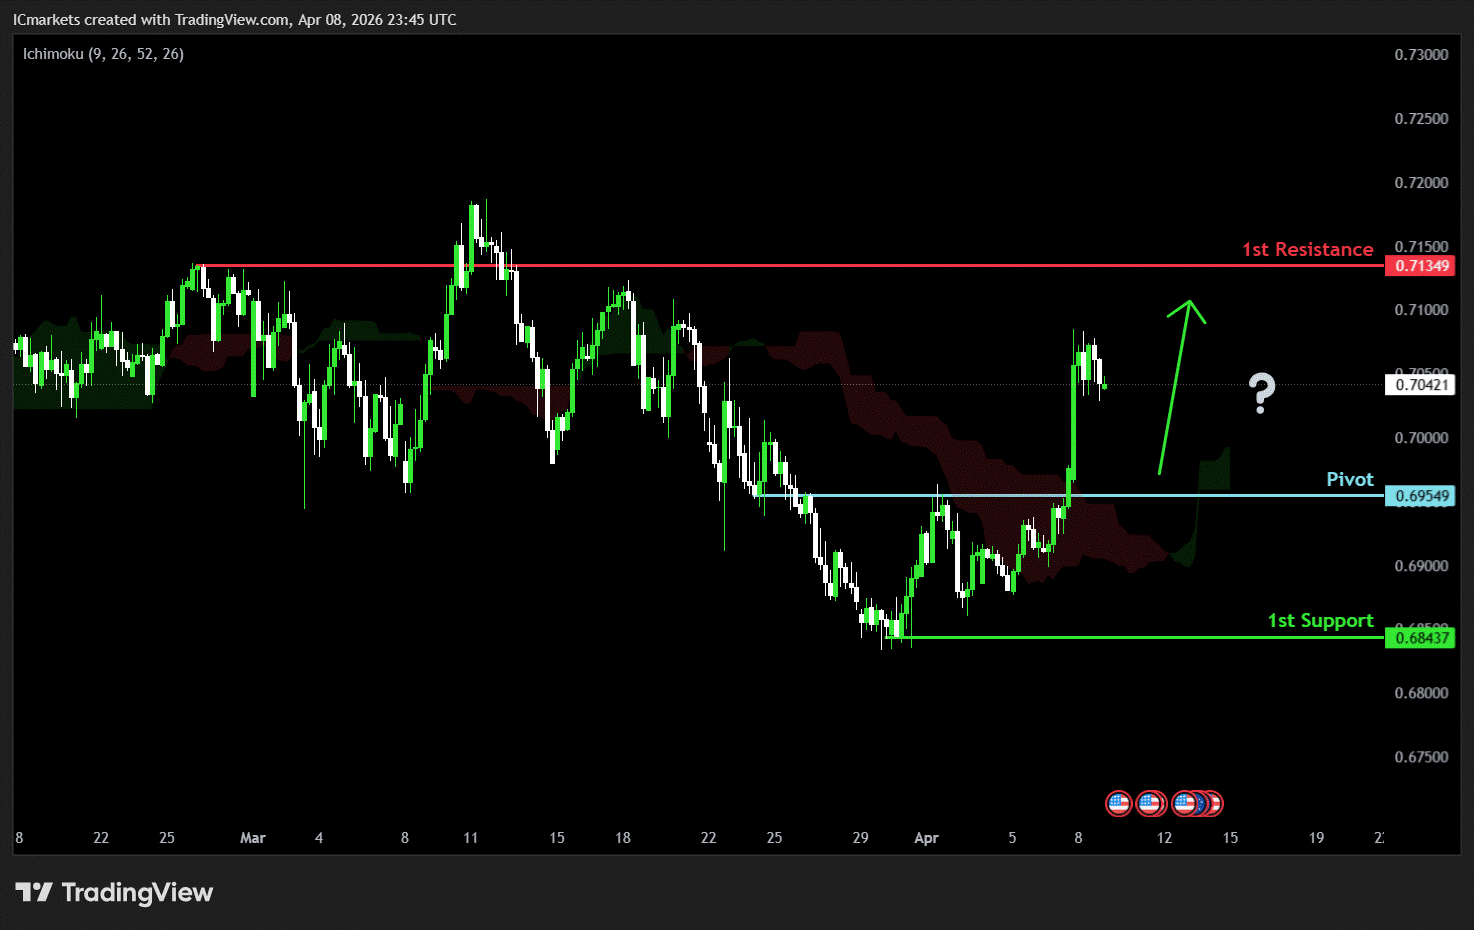
AUD/USD:
Potential Direction: Bullish
Overall momentum of the chart: Bullish
The price could see a short-term pullback toward the pivot before rising again toward the 1st resistance.
Pivot: 0.6954
Supporting reasons: Identified as a pullback support, where renewed buying pressure could emerge to push the price higher.
1st support: 0.6843
Supporting reasons: Identified as a multi-swing low support, this area has provided strong support historically and may attract buying interest for a potential short-term bounce
1st resistance: 0.7134
Supporting reasons: Identified as a pullback resistance, indicating a potential area that could halt any further upward movement.
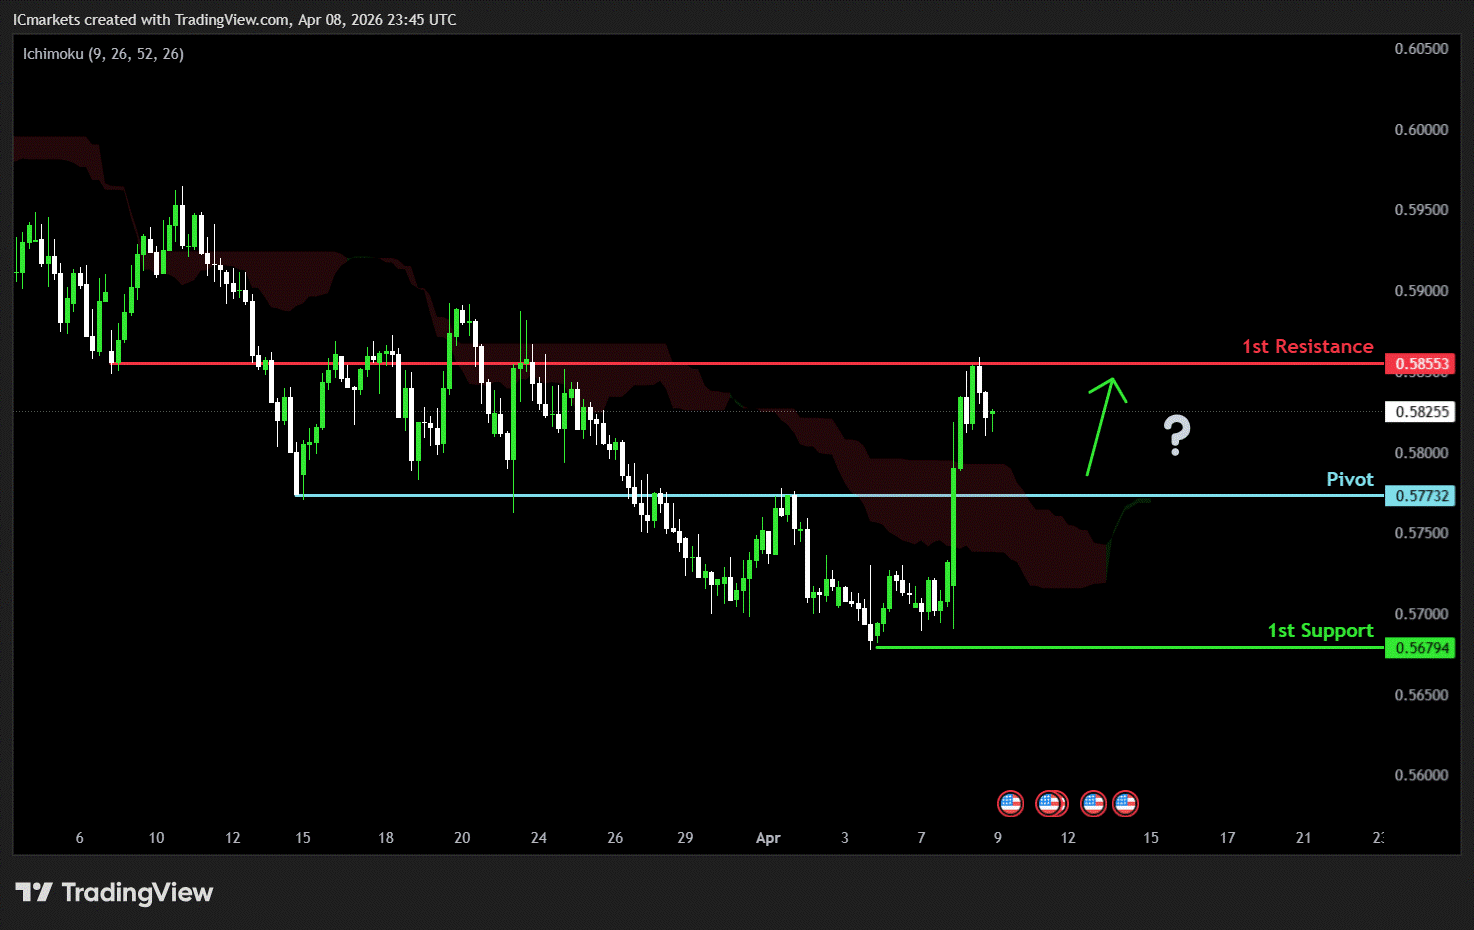
NZD/USD
Potential Direction: Bullish
Overall momentum of the chart: Bullish
The price could see a short-term pullback toward the pivot before rising again toward the 1st resistance.
Pivot: 0.5773
Supporting reasons: Identified as a pullback support, where renewed buying pressure could emerge to push the price higher.
1st support: 0.5679
Supporting reasons: Identified as a swing low support, this area has provided strong support historically and may attract buying interest for a potential short-term bounce
1st resistance: 0.5855
Supporting reasons: Identified as a pullback resistance, indicating a potential area that could halt any further upward movement.
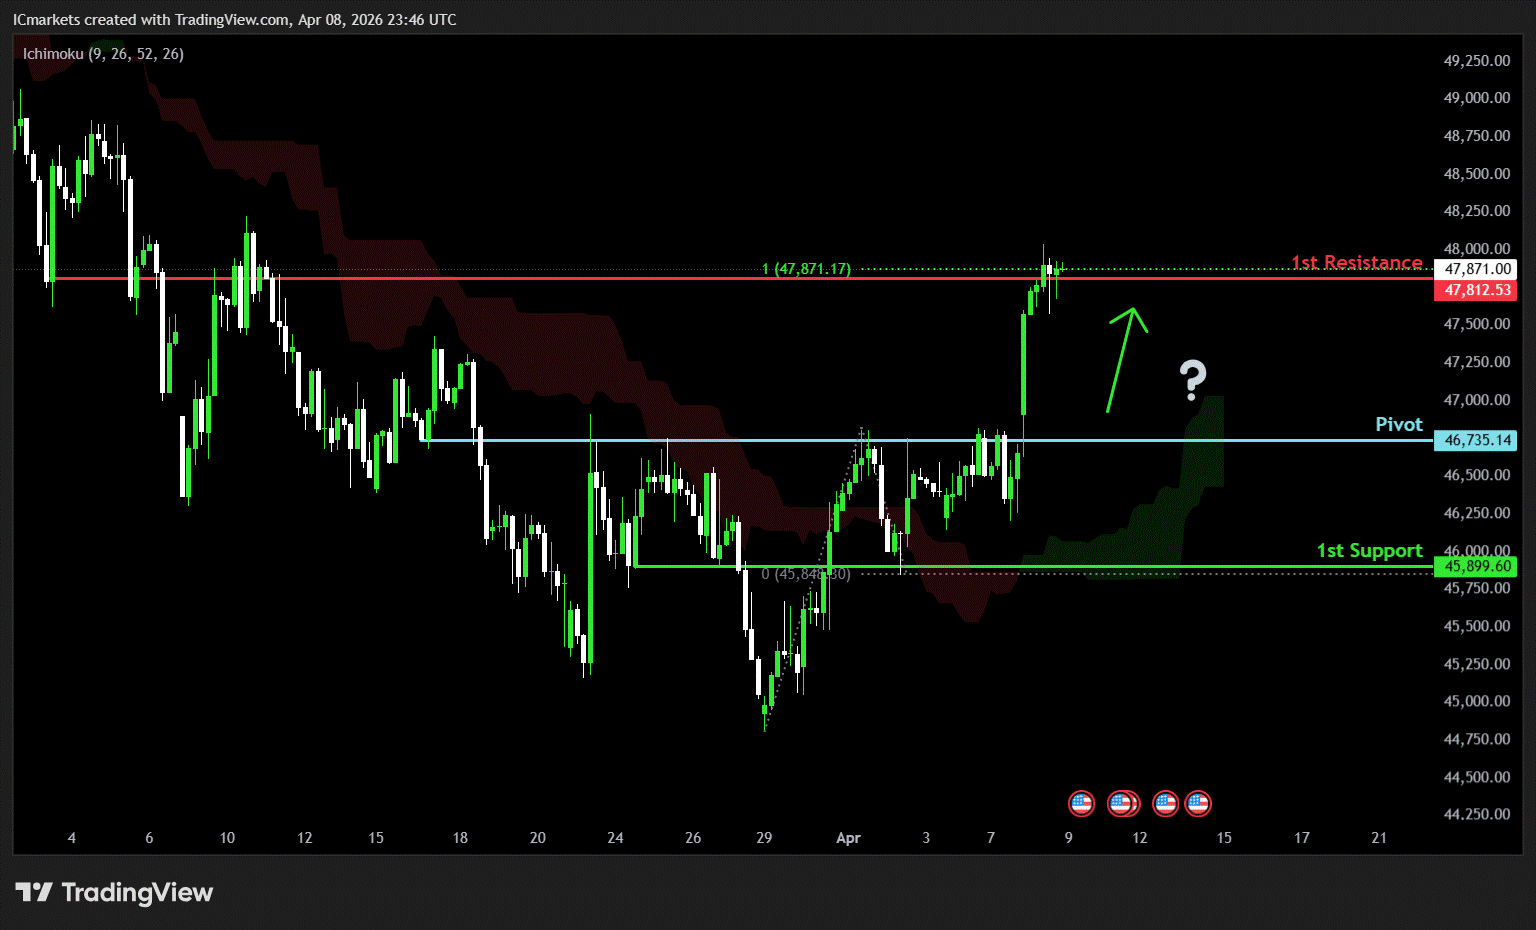
US30 (DJIA):
Potential Direction: Bullish
Overall momentum of the chart: Bullish
The price could see a short-term pullback toward the pivot before rising again toward the 1st resistance.
Pivot: 46,735.14
Supporting reasons: Identified as a pullback support, where renewed buying pressure could emerge to push the price higher.
1st support: 45,899.60
Supporting reasons: Identified as an overlap support, suggesting a potential area where the price could stabilize once again.
1st resistance: 47,812.53
Supporting reasons: Identified as a pullback resistance that aligns with the 100% Fibonacci projection, indicating a potential area that could halt any further upward movement.
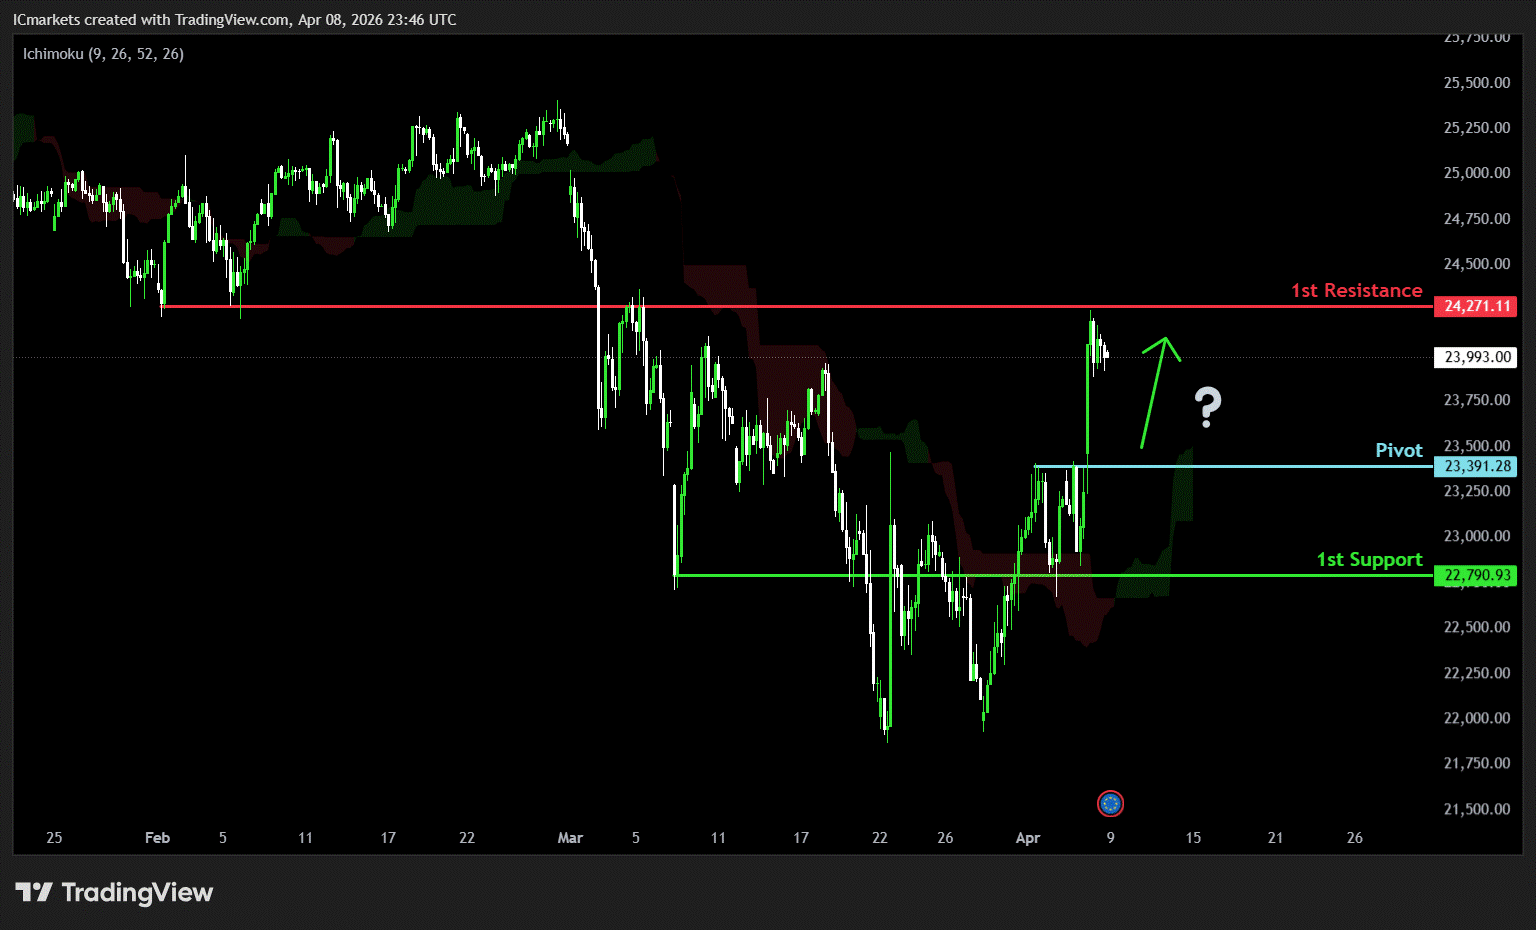
DE40 (DAX):
Potential Direction: Bullish
Overall momentum of the chart: Bullish
The price could see a short-term pullback toward the pivot before rising again toward the 1st resistance.
Pivot: 23,391.28
Supporting reasons: Identified as a pullback support, where renewed buying pressure could emerge to push the price higher.
1st support: 22,790.93
Supporting reasons: Identified as a pullback support, indicating a key level where the price could stabilize once more.
1st resistance: 24,271.11
Supporting reasons: Identified as an overlap resistance, indicating a potential area that could halt any further upward movement.
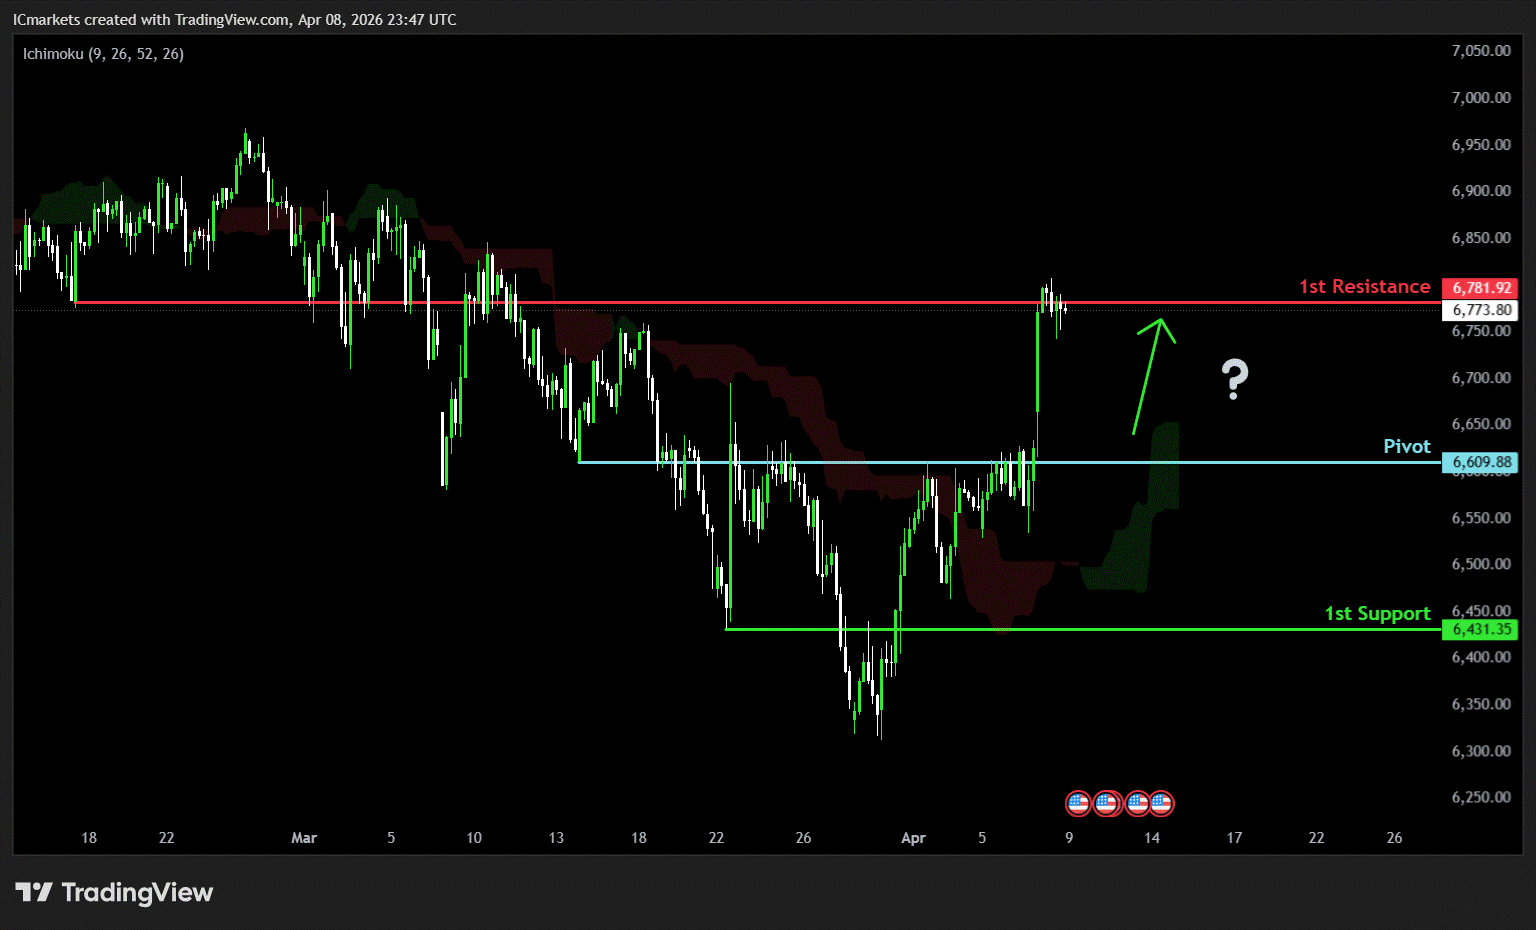
US500 (S&P 500):
Potential Direction: Bullish
Overall momentum of the chart: Bullish
The price could see a short-term pullback toward the pivot before rising again toward the 1st resistance.
Pivot: 6,609.88
Supporting reasons: Identified as a pullback support, where renewed buying pressure could emerge to push the price higher.
1st support: 6,431.35
Supporting reasons: Identified as a pullback support, indicating a potential level where the price could stabilize once again.
1st resistance: 6,781.92
Supporting reasons: Identified as an overlap resistance, indicating a potential area that could halt any further upward movement.
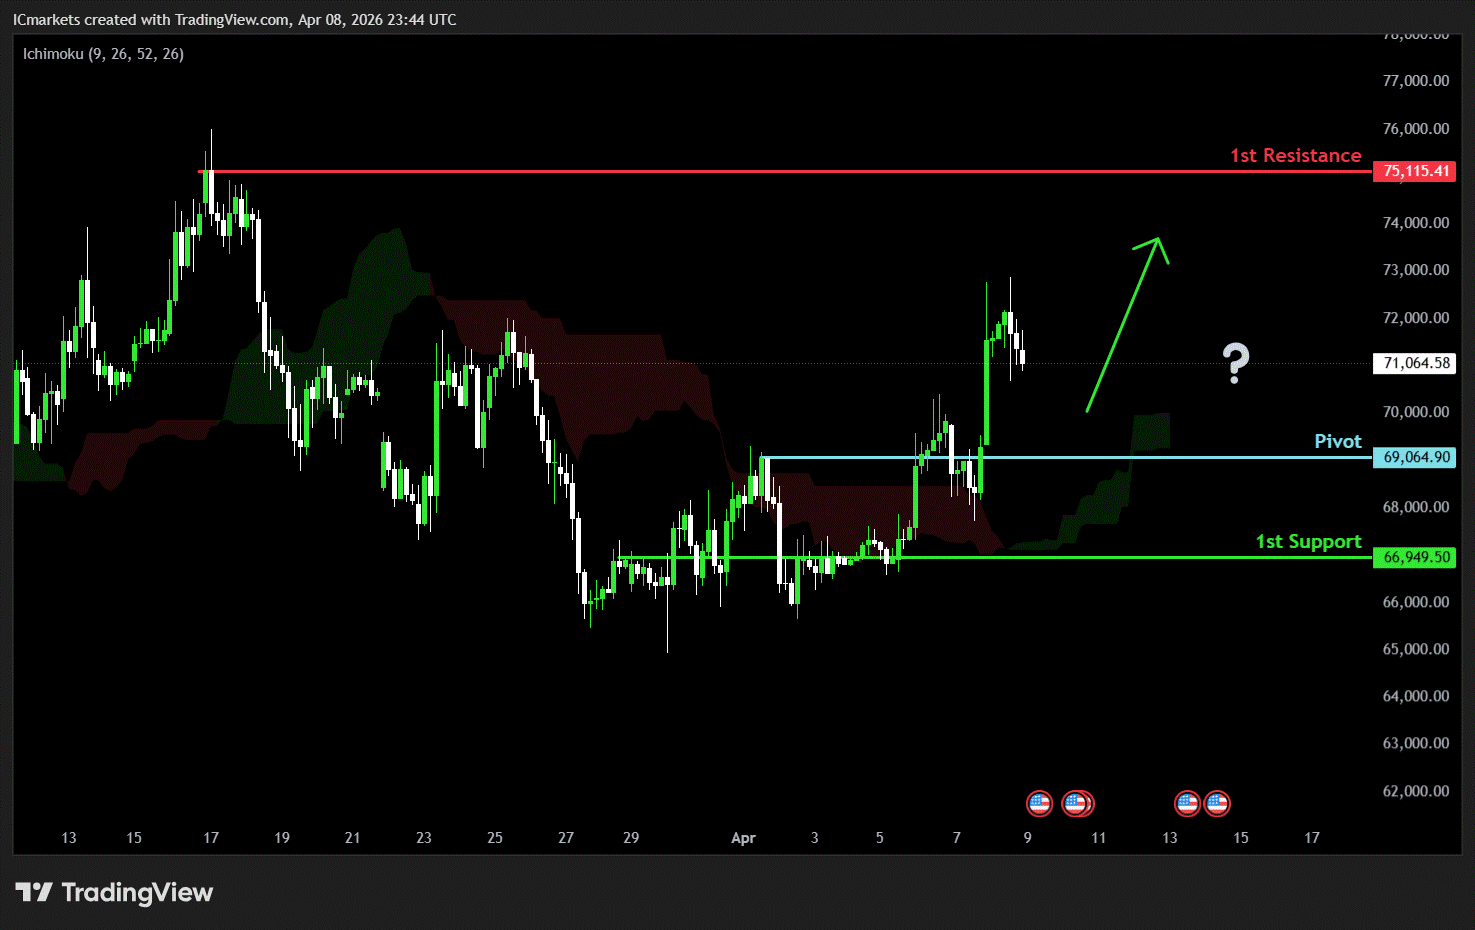
BTC/USD (Bitcoin):
Potential Direction: Bullish
Overall momentum of the chart: Bearish
The price could see a short-term pullback toward the pivot before rising again toward the 1st resistance.
Pivot: 69,064.90
Supporting reasons: Identified as a pullback support, where renewed buying pressure could emerge to push the price higher.
1st support: 66,949.50
Supporting reasons: Identified as a pullback support, indicating a potential level where the price could stabilize once more.
1st resistance: 75,115.41
Supporting reasons: Identified as a swing high resistance, indicating a potential area that could halt any further upward movement.
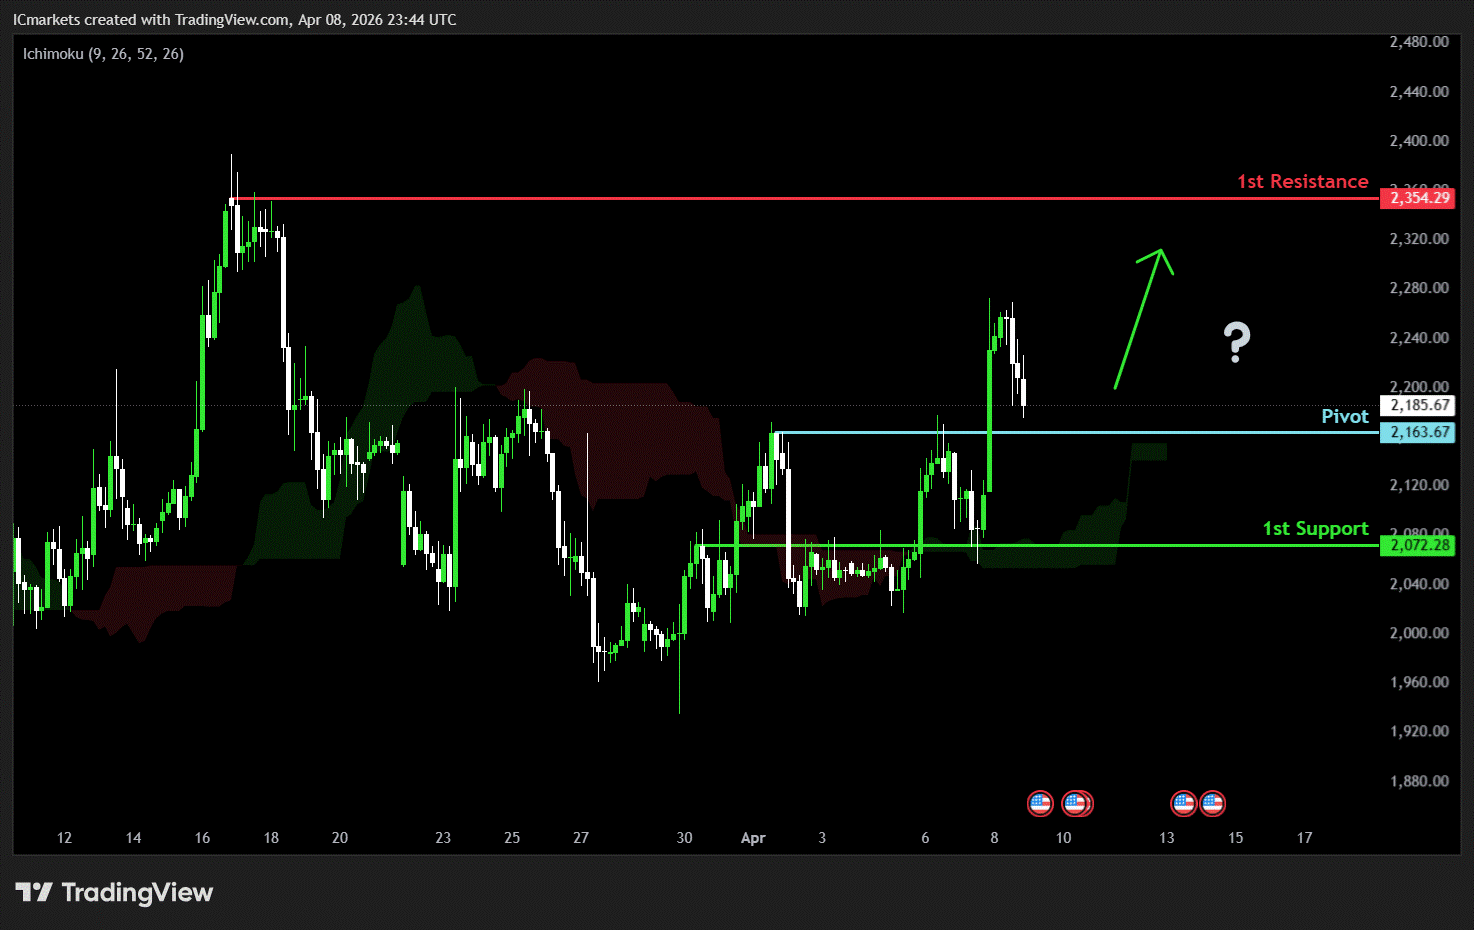
ETH/USD (Ethereum):
Potential Direction: Bullish
Overall momentum of the chart: Bullish
The price could see a short-term pullback toward the pivot before rising again toward the 1st resistance.
Pivot: 2,163.67
Supporting reasons: Identified as a pullback support, where renewed buying pressure could emerge to push the price higher.
1st support: 2,0723.28
Supporting reasons: Identified as an overlap support, indicating a potential level where the price could stabilize once more.
1st resistance: 2,354.29
Supporting reasons: Identified as a swing high resistance, indicating a potential area that could halt any further upward movement.
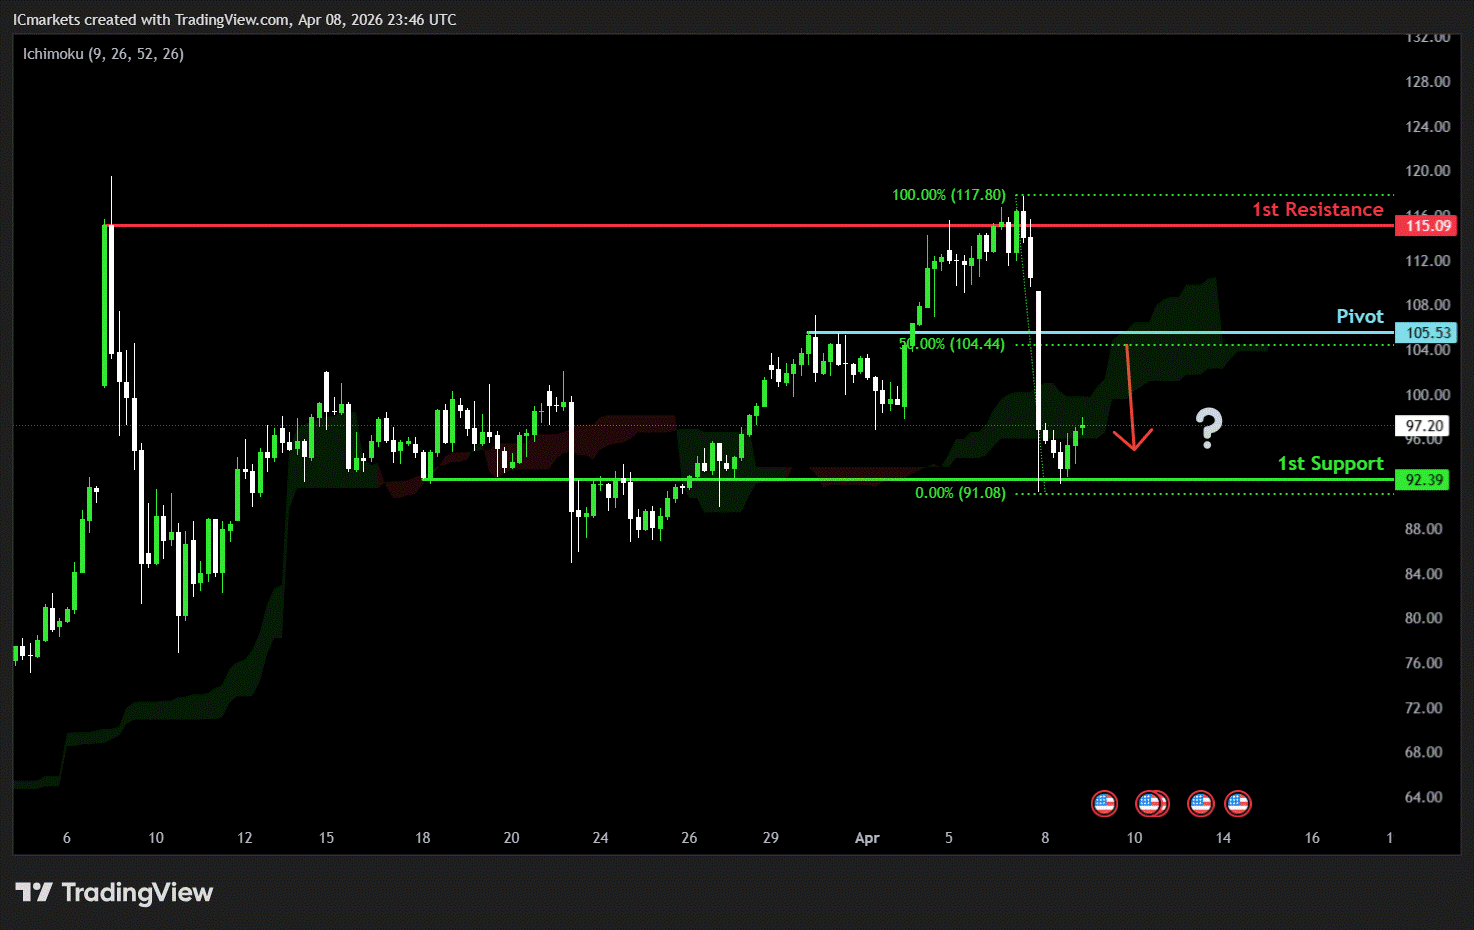
WTI/USD (Oil):
Potential Direction: Bearish
Overall momentum of the chart: Bullish
The price could see a short-term pullback toward the pivot before continuing its bearish move down toward the 1st support.
Pivot: 105.53
Supporting reasons: Identified as a pullback resistance, where selling pressures could intensify and potentially cap any upward retracement.
1st support: 92.39
Supporting reasons: Identified as an overlap support that aligns with the 50% Fibonacci retracement, indicating a key level where the price could stabilize once more.
1st resistance: 115.09
Supporting reasons: Identified as a swing high resistance, indicating a potential area that could halt any further upward movement.
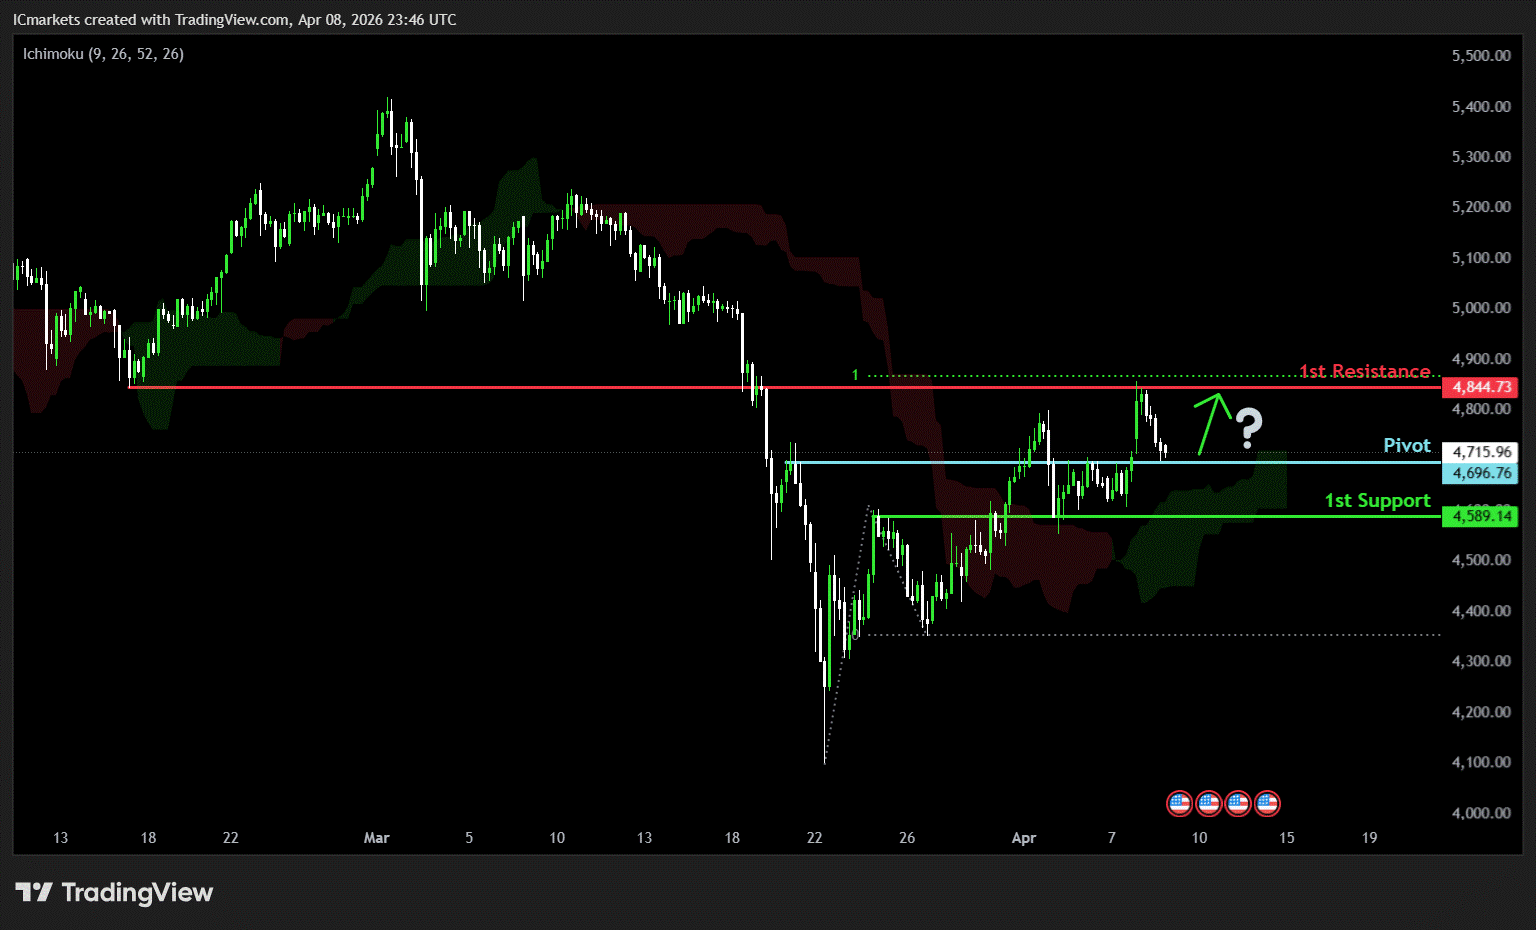
XAU/USD (GOLD):
Potential Direction: Bullish
Overall momentum of the chart: Bullish
The price could see a short-term pullback toward the pivot before rising again toward the 1st resistance.
Pivot: 4,696.76
Supporting reasons: Identified as a pullback support, where renewed buying pressure could emerge to push the price higher.
1st support: 4,589.14
Supporting reasons: Identified as an overlap support, indicating a key level where the price could stabilize once more.
1st resistance: 4,844.73
Supporting reasons: Identified as a pullback resistance that aligns with the 100% Fibonacci projection, indicating a potential area that could halt any further upward movement.
The accuracy, completeness and timeliness of the information contained on this site cannot be guaranteed. IC Markets Global does not warranty, guarantee or make any representations, or assume any liability regarding financial results based on the use of the information in the site.
News, views, opinions, recommendations and other information obtained from sources outside of www.icmarkets.com, used in this site are believed to be reliable, but we cannot guarantee their accuracy or completeness. All such information is subject to change at any time without notice. IC Markets Global assumes no responsibility for the content of any linked site.
The fact that such links may exist does not indicate approval or endorsement of any material contained on any linked site. IC Markets Global is not liable for any harm caused by the transmission, through accessing the services or information on this site, of a computer virus, or other computer code or programming device that might be used to access, delete, damage, disable, disrupt or otherwise impede in any manner, the operation of the site or of any user’s software, hardware, data or property.
The post Thursday 9th April 2026: Technical Outlook and Review first appeared on IC Your Trading Edge | Official Blog.

Thursday 9th April 2026: Asia-Pacific Markets Fall as Iran Accuses U.S. of Ceasefire Breach Amid Rising Tensions
429394 April 9, 2026 14:40 ICMarkets Market News
Global Markets:
- Asian Stock Markets : Nikkei down 0.80%, Shanghai Composite down 0.73% Hang Seng down 0.41% ASX down 0.04%
- Commodities : Gold at $4,742.10 (-0.72%) Silver at $74.183 (-1.60%), Brent Oil at $96.77 (2.14%), WTI Oil at $97.32 (3.07%)
- Rates : US 10-year yield at 4.289, UK 10-year yield at 4.7130, Germany 10-year yield at 2.9423
News & Data:
- (USD) Crude Oil Inventories – M to -1.0M expected
Markets Update:
Asia-Pacific markets declined on Thursday as investors reacted to renewed tensions after Iran’s parliamentary speaker accused the United States of violating the terms of a recently announced two-week ceasefire agreement.
On Wednesday, U.S. President Donald Trump said Washington would suspend attacks on Iran for two weeks as part of what he described as a “double-sided” ceasefire. He added that Iran had presented a 10-point proposal that could serve as a workable foundation for negotiations. The pause in hostilities was conditional on Iran agreeing to reopen the Strait of Hormuz, a key global oil transit route. Iran’s foreign minister indicated that Tehran would halt its “defensive” operations if attacks on the country stopped, while media reports said Israel had also agreed to the arrangement.
However, Iran’s parliamentary speaker Mohammed Bagher Ghalibaf later accused the U.S. of breaching the agreement, citing restrictions on Iran’s uranium enrichment rights, Israel’s continued strikes in Lebanon, and reports of a drone entering Iranian airspace.
Regional markets moved lower following the developments. South Korea’s Kospi dropped 1.41% and the Kosdaq lost 1.61%. Japan’s Nikkei 225 declined 0.76%, while the Topix fell 0.75%. Australia’s S&P/ASX 200 slipped 0.10%. China’s CSI 300 fell 0.72%, and Hong Kong’s Hang Seng Index eased 0.63%.
Meanwhile, oil prices rose and U.S. stock futures edged lower after strong gains on Wall Street overnight.
Upcoming Events:
- 12:30 PM GMT – USD Core PCE Price Index m/m
- 12:30 PM GMT – USD Final GDP q/q
The post Thursday 9th April 2026: Asia-Pacific Markets Fall as Iran Accuses U.S. of Ceasefire Breach Amid Rising Tensions first appeared on IC Your Trading Edge | Official Blog.
IC Markets Global – Asia Fundamental Forecast | 09 April 2026
429393 April 9, 2026 14:00 ICMarkets Market News
IC Markets Global – Asia Fundamental Forecast | 09 April 2026
What happened in the U.S. session?
The U.S.-Iran ceasefire announcement triggered a sharp risk-on rally in stocks and a collapse in oil prices during the overnight U.S. session, dwarfing reactions to FOMC minutes and state jobs data; equities and crude were most impacted, reflecting de-escalation relief amid prior war tensions.
What does it mean for the Asia Session?
Amid fragile US-Iran de-escalation, Asian traders face a pivotal Thursday with South Korea’s likely rate hold at 2.50% and potential Hormuz reopening sparking oil and risk-asset swings; watch KRW, JPY pairs, and commodities closely for breakouts, as recent oil volatility has fueled gold strength and equity rebounds despite thin holiday liquidity.
The Dollar Index (DXY)
Key news events today
Core PCE Price Index m/m (12:30 pm GMT)
Final GDP q/q (12:30 pm GMT)
Final GDP Price Index q/q (12:30 pm GMT)
Unemployment Claims (12:30 pm GMT)
What can we expect from DXY today?
The US Dollar has shown resilience amid ongoing geopolitical tensions and upcoming economic data releases. As of early trading on Thursday, the Dollar Index (DXY) hovered near 99.05 after softening slightly from recent peaks around 100, buoyed by President Trump’s agreement to a two-week ceasefire with Iran in exchange for safe passage through the Strait of Hormuz, which eased some oil disruption fears but kept markets cautious.
Central Bank Notes:
- The Federal Open Market Committee (FOMC) is widely expected to hold the federal funds rate target range steady at 3.50%–3.75% at its March 17–18, 2026, meeting, amid rising oil prices from the US-Israel war against Iran and persistent inflation pressures, delaying any 2026 cuts potentially to September.
- The Committee continues to pursue maximum employment and 2% inflation goals, with the labor market weakening further as nonfarm payrolls declined by 92,000 in February 2026 and the unemployment rate rose to 4.4% from 4.3% in January.
- Officials face tilted risks from geopolitical tensions, elevated oil prices, and sticky inflation, with CPI steady at 2.4% year-over-year in February 2026, headline PCE at 2.8% in January, and core PCE rising to 3.1%.
- Economic activity has cooled after robust Q4 2025 growth near 5%, with the Atlanta Fed GDPNow now estimating Q1 2026 growth at around 2.1%–2.7% amid softer consumer spending and labor data.
- December 2025’s Summary of Economic Projections forecasts 2025 unemployment at a median of 4.5%, 2026 GDP growth at 2.3%, and core PCE at 2.5%, with the dot plot signaling one more cut in 2026 to a median 3.4% funds rate; March updates may reflect softer labor and inflation upticks.
- The Committee maintains its data-dependent stance amid a softening labor market, inflation above target, and new oil shocks, likely holding rates at 3.50%-3.75% with ongoing divisions and possible hawkish dissents on rate cuts.
- The FOMC continues its adjusted quantitative tightening, with Treasury rolloff caps at $5 billion per month and agency MBS at $35 billion per month to ensure ample reserves post-2025 program adjustments.
- The next meeting is scheduled for 28 to 29 April 2026.
Next 24 Hours Bias
Medium Bearish
Gold (XAU)
Key news events today
Core PCE Price Index m/m (12:30 pm GMT)
Final GDP q/q (12:30 pm GMT)
Final GDP Price Index q/q (12:30 pm GMT)
Unemployment Claims (12:30 pm GMT)
What can we expect from Gold today?
Gold prices are expected to navigate heightened volatility around $4,670–$4,700 per ounce, bolstered by escalating U.S.-China-EU trade tensions from Trump’s tariffs and safe-haven flows, though tempered by Fed hawkishness and yield pressures; forecasts eye a corrective dip to $4,625 support before upside toward $5,035, with year-to-date gains exceeding 70% underscoring its robust 2026 performance amid global uncertainty.
Next 24 Hours Bias
Medium Bearish
The Australian Dollar (AUD)
Key news events today
No major news event
What can we expect from AUD today?
The AUD/USD pair exhibited resilience, rising toward 0.7050 amid USD selling and RBA hawkishness, though persistent Middle East uncertainties and oil volatility limited aggressive gains, positioning the Aussie for potential consolidation near recent supports around 0.7000.
Central Bank Notes:
- The Reserve Bank of Australia (RBA) is expected to hold its cash rate at 3.85% at the March 16-17, 2026 policy meeting, following the widely anticipated 25 basis point hike to 3.85% in early February after persistent inflation pressures from late 2025. While some banks like CBA, NAB, and Westpac now forecast a further 25 basis point rise to 4.10% as soon as May if inflation data remains sticky, consensus tilts toward a pause in March to assess incoming monthly CPI and labor market signals. The February hike reversed prior cuts, entering mildly restrictive territory amid capacity pressures, with the board emphasizing data dependence.
- Inflation remains elevated, with December 2025 CPI at 3.8% year-on-year and trimmed mean at 3.3%, above the 2–3% target midpoint. RBA’s February Statement revised forecasts higher, projecting trimmed-mean inflation to peak in mid-2026 above 3% and remain elevated through early 2027, driven by services, housing, and demand resilience despite some monthly cooling, such as January’s 0.2% MoM gauge. Monthly CPI data continues to highlight core stickiness beyond energy rebates, delaying the target return to late 2027 or beyond.
- January 2026 monthly indicators showed modest easing, but headline CPI risks upward surprises from housing (up recently) and services amid firm domestic demand. Trimmed mean pressures persist from wage growth and capacity constraints, with consumer expectations ticking to 5% YoY in February surveys. Enhanced monthly reporting sharpens vigilance on potential broad-based pick-up.
- The labor market shows softening, with unemployment around 4.1-4.4%, down slightly to 4.1% in December, but unit labor costs are elevated due to subdued productivity. Household spending faces higher borrowing costs post-hike, yet private demand recovery sustains capacity strains. Vulnerabilities persist amid resilient employment dynamics.
- Global growth modestly revised up but tempered by geopolitics and commodity volatility; policy now restrictive post-February, with the RBA balancing inflation against employment risks. Data from the monthly CPI and Q1 GDP will guide, amid household debt sensitivities.
- Sustained restrictive stance post-February anchors inflation return to target, upholding dual mandate with flexibility to new risks like further inflation upticks.
- Markets price a March hold at 3.85%, with big four banks split: CBA, NAB, Westpac eye May hike to 4.10% if persistence continues, while others see limited upside unless acceleration. Upcoming monthly CPI pivotal for Q2 trajectory.
- Policy vigilance counters inflation stickiness against household fragilities and global uncertainties, reaffirming adaptability under dual mandate.
- Base case favors March hold with risks tilted hawkish for further hikes if data is hot; monthly indicators key to 2026 path.
- The next meeting is on 5 to 6 May 2026.
Next 24 Hours Bias
Medium Bearish
The Kiwi Dollar (NZD)
Key news events today
No major news event
What can we expect from NZD today?
The New Zealand Dollar (NZD) saw limited specific updates directly tied to April 9, 2026, based on available recent data, but it continued testing key support levels around 0.5710 against the USD amid anticipation for the Reserve Bank of New Zealand (RBNZ) meeting. Earlier in the week, on April 6, NZD/USD rose slightly near 0.5710 as ceasefire hopes in global tensions weighed on the US Dollar, offsetting some bearish pressure from a 3.88% monthly decline noted by late March.
Central Bank Notes:
- The Reserve Bank of New Zealand’s (RBNZ) Monetary Policy Committee (MPC) is widely expected to hold the Official Cash Rate (OCR) steady at 2.25% at its 8 April 2026 Monetary Policy Review, aligning with unanimous market consensus from Reuters polls and previews.
- The MPC continues its data-dependent “wait-and-see” approach after February’s pause, balancing stimulus from prior 325 basis point cuts against inflation’s path back to the 2% target, with readiness for gradual normalization only if recovery strengthens or inflation exceeds forecasts.
- Headline CPI, last at 3.1%, is on track to re-enter the 1-3% band in Q2 2026 and hit 2% by mid-2027, aided by spare capacity, moderating wages, and softer food/fuel prices; two-year business inflation expectations have ticked up slightly to 2.37%.
- Household spending and housing remain subdued amid cautious consumption, low net migration, and labor market softness, though easing retail rates support budgets; high-frequency GDP indicators show steadying momentum in an early recovery phase.
- Accommodative borrowing costs from the low OCR are boosting mortgage approvals and sentiment, but business credit growth lags due to uneven confidence; overall stimulus persists below the 3% neutral rate.
- Risks are balanced, with a favorable global environment—including stronger dairy/meat exports and a softer NZ dollar—offsetting oil shocks and prior China/US trade worries; vigilance remains on second-round inflation effects.
- Forecasts point to potential OCR hikes starting late 2026 (e.g., December) or early 2027 to 2.50% by year-end if activity/inflation firms, but policy stays supportive if recovery unfolds gradually as expected.
- The next meeting is on 27 May 2026.
Next 24 Hours Bias
Weak Bearish
The Japanese Yen (JPY)
Key news events today
No major news event
What can we expect from JPY today?
The Japanese yen is trading in a relatively stable but still weak range, with USD/JPY hovering near 159 as dealers balance the risk of fresh FX intervention from Tokyo against expectations for a further Bank of Japan rate hike later in April. Recent policy‑speak and modest risk‑off sentiment have helped cap yen losses, but the currency has remained under pressure over the past year amid persistent dollar strength and only gradual monetary tightening by the BoJ.
Central Bank Notes:
- The Policy Board of the Bank of Japan meets on 18–19 April 2026, with markets anticipating the short-term policy rate to remain at 0.75%, as the bank continues evaluating the December 2025 and prior hikes’ effects amid data-dependent normalization.
- The BOJ will target the uncollateralized overnight call rate around 0.75% and indicate future hikes hinge on impacts to lending, financing, and activity, with Governor Ueda signaling scrutiny of data for potential moves in April or later meetings.
- JGB tapering advances per plan, cutting outright purchases by ¥400 billion quarterly through Q1 2026 and slowing to ¥200 billion from April onward, targeting roughly ¥2-3 trillion monthly by mid-2026, adjustable for market stability
- Japan’s economy maintains moderate growth into Q1 2026, building on the Q4 2025 rebound via exports and fiscal measures, though manufacturing sentiment holds soft amid overseas demand weakness and yen pressures.
- Core CPI (ex-fresh food) likely stays near 2.3-2.5% y/y in early 2026. Tokyo prints off prior highs but above 2%, while core-core hovers around 2.6%, reflecting sustained but easing inflationary forces.
- Input costs ease further from import peaks, yet services inflation, 5% wage targets in shunto talks, and anchored expectations above 2% support price persistence, with upside risks from yen and geopolitics.
- Near-term real GDP may ease below trend due to tightening and external shocks like Iran tensions, but negative real rates, wage gains, and stimulus should underpin consumption and capex rebound.
- Medium-term, overseas recovery, labor shortages, and productivity lifts are set to fuel wages and core inflation near/above 2%, enabling gradual hikes toward 1% if conditions align.
- The next meeting is on 27 to 28 April 2026.
Next 24 Hours Bias
Medium Bearish
Oil
Key news events today
No major news event
What can we expect from Oil today?
Oil markets are experiencing extreme volatility driven primarily by escalating U.S.-Iran tensions, including President Trump’s self-imposed deadline for potential strikes on Iranian infrastructure if the Strait of Hormuz remains closed, pushing Brent crude above $111 per barrel and WTI near $116 per barrel amid fears of prolonged supply disruptions.
Next 24 Hours Bias
Medium Bullish
The post IC Markets Global – Asia Fundamental Forecast | 09 April 2026 first appeared on IC Your Trading Edge | Official Blog.
IC Markets Global – Europe Fundamental Forecast | 09 April 2026
429392 April 9, 2026 14:00 ICMarkets Market News
IC Markets Gobal – Europe Fundamental Forecast | 09 April 2026
What happened in the Asia session?
Asian markets traded cautiously today as the optimism from the US–Iran two‑week ceasefire began to fade, with investors re‑focusing on the risk that the Strait of Hormuz could again become a flashpoint for supply disruptions. Oil prices pulled back from their most recent spikes but stayed structurally higher than pre‑crisis levels, supporting energy‑related equities and inflating input‑cost pressures in import‑dependent Asian economies.
What does it mean for the Europe & US sessions?
Today’s trading session is likely to be shaped by a recalibration of risk‑on sentiment after the big U.S.–Iran ceasefire‑driven rally, with stocks and bonds reacting to Tehran’s cooler view on the deal while oil stays supported by residual supply‑risk concerns. Traders should keep an eye on the day’s U.S. and European macro releases, especially inflation, activity, and Fed‑speaker comments, since these will either confirm or challenge the current narrative of a less hawkish Fed.
The Dollar Index (DXY)
Key news events today
Core PCE Price Index m/m (12:30 pm GMT)
Final GDP q/q (12:30 pm GMT)
Final GDP Price Index q/q (12:30 pm GMT)
Unemployment Claims (12:30 pm GMT)
What can we expect from DXY today?
Today the dollar is trading near 99.1 on the DXY, pausing after a run higher into early April as markets digest a fragile US–Iran ceasefire, elevated oil prices, and sticky inflation-driven expectations for an extended Fed‑rate‑hold period. The greenback remains broadly firm versus major currencies, supported by its safe‑haven status and relatively high US yields, though traders are wary of any rapid de‑escalation in the Gulf conflict or a shift back toward earlier Fed‑cut pricing, which could cap further upside.
Central Bank Notes:
- The Federal Open Market Committee (FOMC) is widely expected to hold the federal funds rate target range steady at 3.50%–3.75% at its March 17–18, 2026, meeting, amid rising oil prices from the US-Israel war against Iran and persistent inflation pressures, delaying any 2026 cuts potentially to September.
- The Committee continues to pursue maximum employment and 2% inflation goals, with the labor market weakening further as nonfarm payrolls declined by 92,000 in February 2026 and the unemployment rate rose to 4.4% from 4.3% in January.
- Officials face tilted risks from geopolitical tensions, elevated oil prices, and sticky inflation, with CPI steady at 2.4% year-over-year in February 2026, headline PCE at 2.8% in January, and core PCE rising to 3.1%.
- Economic activity has cooled after robust Q4 2025 growth of nearly 5%, with the Atlanta Fed GDPNow now estimating Q1 2026 growth at around 2.1%–2.7% amid softer consumer spending and labour data.
- December 2025’s Summary of Economic Projections forecasts 2025 unemployment at a median of 4.5%, 2026 GDP growth at 2.3%, and core PCE at 2.5%, with the dot plot signalling one more cut in 2026 to a median 3.4% funds rate; March updates may reflect softer labor and inflation upticks.
- The Committee maintains its data-dependent stance amid a softening labor market, inflation above target, and new oil shocks, likely holding rates at 3.50%-3.75% with ongoing divisions and possible hawkish dissents on rate cuts.
- The FOMC continues its adjusted quantitative tightening, with Treasury rolloff caps at $5 billion per month and agency MBS at $35 billion per month to ensure ample reserves post-2025 program adjustments.
- The next meeting is scheduled for 28 to 29 April 2026.
Next 24 Hours Bias
Medium Bearish
Gold (XAU)
Key news events today
Core PCE Price Index m/m (12:30 pm GMT)
Final GDP q/q (12:30 pm GMT)
Final GDP Price Index q/q (12:30 pm GMT)
Unemployment Claims (12:30 pm GMT)
What can we expect from Gold today?
Gold prices sit in the mid‑4,700s USD per ounce after a sharp early‑April correction from January’s record highs near 5,600 USD/oz, leaving the metal still up roughly 52% year‑on‑year but down about 8–9% over the last month. The dip has been driven by dollar strength, higher‑for‑longer rate expectations, and technical profit‑taking.
Next 24 Hours Bias
Weak Bearish
The Euro (EUR)
Key news events today
No major news event
What can we expect from EUR today?
As of today, Thursday, the euro is trading in a consolidative, range‑bound environment against the US dollar, with EUR/USD hovering around the 1.14–1.1650 zone after recent volatility tied to higher US‑dollar‑denominated interest rates and geopolitical risk sentiment.
Central Bank Notes:
- The Governing Council of the ECB is expected to keep the three key interest rates unchanged at its 29–30 April 2026 meeting, with the main refinancing rate at 2.15%, marginal lending facility at 2.40%, and deposit facility at 2.00%. This reflects an ongoing commitment to 2% inflation stability amid heightened uncertainties from Middle East tensions and US trade policies under President Trump. Market probabilities indicate around 58% odds of no change, though some banks now price in potential hikes due to rising inflation risks.
- Price dynamics show increasing upside pressures, with headline HICP inflation likely around 2.0-2.2% in early 2026, driven by energy costs from Middle East conflicts offsetting euro strength. Core inflation remains sticky but moderating slowly, with projections revised upward to 2.6% for 2026 overall amid hawkish signals from ECB leadership.
- Updated Eurosystem staff projections for April 2026 may forecast headline inflation at 2.1-2.2% in 2026, 1.9% in 2027, and 2.0% in 2028, with upside risks from energy and trade dominating balanced prior views. A stronger euro provides some counterbalance, but recent data revisions highlight persistent pressures.
- Euro area GDP growth holds steady, with Q2 2026 surveys suggesting 0.2-0.3% qoq growth, in line with 1.1-1.3% annual forecasts through 2027. Defence spending, infrastructure, and low unemployment support resilience against trade headwinds and softer external demand.
- The labour market remains tight, with unemployment steady near 6.4%, bolstered by wage growth and participation gains. Supportive credit conditions continue aiding investment and consumption despite global risks.
- Business sentiment is cautious amid US tariffs, geopolitical flare-ups, and supply chain easing; a somewhat weaker euro boosts exports, while fiscal measures aid domestic activity.
- The Governing Council maintains its data-dependent, meeting-by-meeting stance, scrutinizing inflation, transmission, and external shocks without pre-committing to rate paths.
- Balance sheet normalization advances smoothly, with APP/PEPP wind-downs complete and no liquidity issues; banks show ample reserves and stable funding access.
The next meeting is on 29 April 2026
Next 24 Hours Bias
Medium Bearish
The Swiss Franc (CHF)
Key news events today
No major news event
What can we expect from CHF today?
The Swiss franc is trading in a relatively narrow band versus the dollar and euro, after modest recent pullbacks but on a still‑positive yearly trend underpinned by the SNB’s inflation‑focused policy and its safe‑haven status amid global uncertainty. At the same time, the franc’s biggest story today is its digital‑currency evolution: six major Swiss banks have launched a sandbox to test a Swiss‑franc‑pegged stablecoin and blockchain‑based uses of the digital franc.
Central Bank Notes:
- At its monetary policy assessment on 19 March 2026, the Swiss National Bank (SNB) is widely expected to leave the policy rate unchanged at 0%, continuing the extended pause since September 2025, as the Governing Board assesses current settings as adequate to maintain inflation near the target without resorting to negative rates.
- Inflation data since December indicate persistent weakness, with headline CPI hovering around 0% year-on-year through early 2026 and core measures subdued at roughly 0.4%, underscoring limited price pressures and lingering, though contained, deflation risks.
- The SNB’s updated conditional inflation forecast shows minimal change from December, with averages of about 0.2% in 2025 (now complete), 0.3% in 2026, and 0.6% in 2027 under a steady 0% policy rate. However, recent flat CPI readings may slightly lower near-term expectations, preserving scope for further easing if needed.
- Global conditions remain challenging, marked by U.S. tariff escalations under President Trump, subdued external demand, and uncertainties in major export markets such as Europe and the U.S., prompting the SNB to exercise caution despite resilient Swiss domestic activity.
- Sentiment in manufacturing and export sectors stays soft amid franc appreciation and weaker foreign orders, squeezing margins. Yet, overall GDP growth is expected to be around 1.5% in 2026, with unemployment edging up modestly from historic lows.
- The SNB reaffirms its readiness to intervene via rate cuts or FX operations should deflationary pressures intensify, while emphasizing clear communication through detailed meeting minutes and coordination with global partners on currency matters.
The next meeting is on 18 June 2026.
Next 24 Hours Bias
Medium Bullish
The Pound (GBP)
Key news events today
No major news event
What can we expect from GBP today?
The British pound is trading on a slightly stronger note today, Thursday, after a robust rebound in the past 24 hours, with GBP/USD around the mid‑1.330s and headed for its largest one‑day gain in about three weeks following a US–Iran ceasefire that eased risk‑off demand for the dollar.
Central Bank Notes:
- The Bank of England’s Monetary Policy Committee (MPC) met on 19 March 2026, maintaining the Bank Rate at 3.75 per cent in a unanimous decision, following the prior narrow 5–4 vote to hold at the 5 February 2026 meeting. This pause reflects a sharp reversal from earlier market expectations of a 25-basis-point cut, driven by a Middle East conflict sparking global energy and commodity price surges. The March meeting did not include a Monetary Policy Report, with the next one due in April.
- Quantitative tightening (QT) proceeds unchanged at the 2025 pace of gilt holdings reductions, maintaining gradual balance-sheet normalization attuned to liquidity conditions and supportive of a restrictive stance amid new shocks.
- Headline CPI inflation faces near-term upside from the energy shock, reversing prior disinflation trends in domestic prices and wages; pre-shock services inflation had eased but now contends with higher utility and input costs, keeping pressures above the 2 per cent target. MPC projections will update in April, but analysts see inflation at 3-4 per cent by the end of 2026.
- UK growth softens further into Q2 2026, with unemployment risks rising amid potential confidence drops, higher precautionary saving, and widening output gaps; regular pay growth had cooled pre-shock but now faces business cost pass-through.
- Global headwinds intensify via Middle East conflict, driving volatile energy/commodity prices and sterling/gilt swings; MPC deems direct shocks manageable if demand weakens sufficiently to limit second-round effects.
- Inflation risks now tilt upwards from energy persistence and potential wage/cost embedding, offset by downside from demand slack and job losses; prior balance has shifted amid uncertainty on shock duration.
- The MPC adopts a wait-and-see posture post-shock, with policy deemed somewhat restrictive pre-event; all members are ready to act data-dependently for 2 per cent sustainability, eyeing April for fuller impact analysis and possible easing if disinflation resumes. Governor Bailey’s guidance stresses close monitoring without firm-cut commitments.
- The next meeting is on 30 April 2026.
Next 24 Hours Bias
Weak Bearish
The Canadian Dollar (CAD)
Key news events today
No major news event
What can we expect from GBP today?
The Canadian dollar is trading in a relatively narrow, range‑bound fashion today, lingering around the mid‑1.3800s versus the US dollar (USD/CAD), with only modest intraday swings and no major breakout yet. Recent technical commentary points to the loonie being caught between elevated oil prices, supportive for Canada’s terms of trade, and a still‑strong US dollar driven by elevated US yields and tight‑money expectations, capping large upside moves.
Central Bank Notes:
- The Governing Council held the overnight rate target steady at 2.25% at its 25 March 2026 meeting, aligning with consensus forecasts and extending the pause in policy adjustments amid balanced risks. The Bank emphasized persistent global uncertainties from Middle East conflicts and U.S. trade policies under President Trump, but affirmed the current stance supports ongoing disinflation without immediate shifts despite elevated energy price volatility.
- U.S. tariff threats and regional geopolitical tensions continue weighing on business sentiment, though Canadian manufacturing PMI has edged higher into expansion territory, with export orders firming on energy demand. Goods exports, led by crude oil, sustained momentum into February, offsetting cautious capex as firms prioritize resilience over aggressive growth.
- Economic growth carried into Q1 2026 at an annualized pace of around 2.2%, building on Q4 2025’s solid performance, fueled by resource exports, government outlays, and manufacturing rebound. February preliminary data points to steady expansion, though winter weather and supply chain frictions modestly curbed potential upside.
- Services sector PMI climbed further above 50, with broad gains in tech, hospitality, and business services; consumer-facing areas showed tentative improvement as real wages rose, though high service costs still restrained discretionary outlays. The Bank sees this diffusion as evidence of rebalancing toward sustainable activity.
- National housing resales ticked up in January-February alongside modest price gains, buoyed by stable rates and improved affordability in select regions, while inventory buildup in urban centers prevents excessive tightening. Officials anticipate continued moderation, aided by prudent mortgage rules amid steady household formation.
- Headline CPI eased to about 2.1% year-over-year in February 2026 estimates, staying within the control band, as core gauges like CPI-trim and median dipped to near 2.7% on softer food and durable goods pressures—despite sticky shelter costs. This reinforces the Bank’s view of inflation sustainably approaching the target.
- Policymakers reiterated that 2.25% remains well-calibrated to anchor 2% inflation and foster adjustment, with no cuts signaled barring downside surprises in growth or prices. Attention now turns to Q2 durability, core inflation persistence, and evolving trade/geopolitical clarity.
- The next meeting is on 23 April 2026.
Next 24 Hours Bias
Weak Bearish
Oil
Key news events today
No major news event
What can we expect from Oil today?
Oil prices are higher on Thursday, as Brent and WTI climb back toward the mid‑$90s after Wednesday’s steep sell‑off, driven by renewed nervousness over the Strait of Hormuz and doubts about how long the US–Iran two‑week ceasefire will hold. Markets remain in a risk‑on mode for Middle‑East supply disruptions, with crude still trading far above pre‑conflict levels even as the ceasefire opens a narrow window for shipping and diplomacy.
Next 24 Hours Bias
Medium Bullish
The post IC Markets Global – Europe Fundamental Forecast | 09 April 2026 first appeared on IC Your Trading Edge | Official Blog.
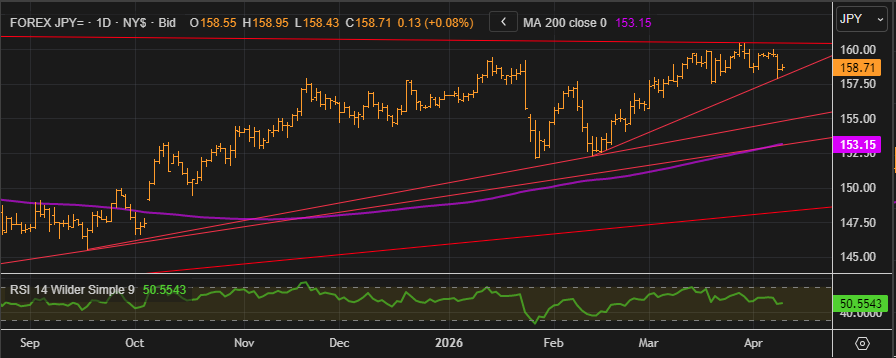
Trade USDJPY on the US CPI Data Release
429390 April 9, 2026 13:40 ICMarkets Market News
FX traders have been absorbed with updates from the war in the Middle East for the past few weeks which have been driving the direction of major currencies and the dollar in particular, however some focus will come back to fundamental data at the end of this week with key inflation updates due out of the US. The Core PCE number is due out on Thursday, however it is the CPI data on Friday that is likely to more impactful on the market with expectations sitting for much higher prints than last month in light of the inflationary conditions brought about by the recent energy prices surges from the war in the Middle East.
The headline month-on-month number is expected to show an increase of 1.0% against last month’s 0.3% rise while the year-on-year data is expected to indicate a 3.4% increase against last month’s 2.4% result. The Core data is expected to show a more modest 0.3% increase against last month’s 0.2% rise, but the propensity for moves in the dollar will likely come from the headline numbers.
USDJPY is again looking like a favourite for good moves form a technical perspective and anything +/- 0.3% on the data should see good moves in the pair. It is sitting just above the long-term support level on the Daily charts after the big move on the back of the recent Middle East ceasefire news and this should provide a good trading level for bulls and bears alike around the data. Resistance is now sitting further north but traders will be aware that a strong number may force the hand of the Bank of Japan if we see levels above 160 again in the near term.
Resistance 2: 161.75 – 2024 High
Resistance 1: 160.46 – Trendline Resistance and 2026 High
Support 1: 157.86 – April Low and Trendline Support
Support 2: 154.80 – Long term Trendline Support
The accuracy, completeness and timeliness of the information contained on this site cannot be guaranteed. IC Markets Global does not warranty, guarantee or make any representations, or assume any liability regarding financial results based on the use of the information in the site.
News, views, opinions, recommendations and other information obtained from sources outside of www.icmarkets.com, used in this site are believed to be reliable, but we cannot guarantee their accuracy or completeness. All such information is subject to change at any time without notice. IC Markets Global assumes no responsibility for the content of any linked site.
The fact that such links may exist does not indicate approval or endorsement of any material contained on any linked site. IC Markets Global is not liable for any harm caused by the transmission, through accessing the services or information on this site, of a computer virus, or other computer code or programming device that might be used to access, delete, damage, disable, disrupt or otherwise impede in any manner, the operation of the site or of any user’s software, hardware, data or property.
The post Trade USDJPY on the US CPI Data Release first appeared on IC Your Trading Edge | Official Blog.
General Market Analysis – 9/04/26
429389 April 9, 2026 13:40 ICMarkets Market News
Stocks Surge Higher After Ceasefire Announced – Dow up 2.85%
Global markets rallied strongly overnight following confirmation that the US and Iran had agreed to a ceasefire in the Middle East, driving a broad-based relief move across risk assets. US equities surged, with the Dow Jones rising 2.85% to 47,909, the S&P 500 gaining 2.51% to 6,782, and the Nasdaq advancing 2.80% to 22,635. Despite the strength, some caution lingers after Iran accused the US of breaching the agreement shortly after it came into effect. In currency markets, the US dollar weakened sharply as safe-haven demand unwound, with the dollar index falling 0.82% to 99.04. US Treasury markets were less reactive overall, with yields initially moving lower before stabilising, leaving the 2-year yield marginally down at 3.785% and the 10-year yield little changed at 4.291%. As expected, commodities saw significant volatility, particularly in energy markets where the geopolitical risk premium was rapidly priced out. Brent crude dropped 11.81% to $96.37 per barrel, while WTI fell even more sharply, declining 16.41% to $94.41. Gold initially rallied on the weaker dollar before trimming gains, closing modestly higher by 0.27% at $4,719.15.
Tensions Remain Elevated in the Middle East
Traders are preparing for more volatility across financial markets today, as although the overall sentiment with regard to the ceasefire in the Middle East is positive, there are still some crucial factors that have investors remaining somewhat cautious that the path back to ‘normal’ may not be a smooth one. The fact that the Iranians have already called out the US and claimed that they have violated the terms of the ceasefire is already concerning, and the fact that the Strait of Hormuz is seeing very little flow through it will increase those worries. In addition to this, Israel is still attacking – and being attacked from – Lebanon, as they are not part of the ceasefire agreement, so hostilities are still ongoing in the region. The situation still feels finely balanced, and traders are preparing to react to updates, with signs of significant shipping moving through the Strait likely to lead to strong risk-on moves, while any signs that the ceasefire may not last are likely to lead to hard risk-off moves again.
Another Busy Day Ahead for Traders
Looking ahead, markets will remain highly sensitive to further developments out of the Middle East, with products likely to remain volatile on every update from each side. The Asian session looks set to open in a cautiously optimistic mood after a good day on Wall Street, despite some concerns about the ceasefire situation. There is little on the event calendar in the Asian session, and so sentiment will dominate moves. The London session is also relatively quiet, although focus will jump onto Swiss markets early in the day when SNB Chairman Martin Schlegel speaks in Bern. The major data drop of the day again comes in the New York session, with some big numbers due for release. The main focus will be on the Fed’s favoured inflation indicator, the Core PCE Price Index (exp +0.4% m/m), which comes out alongside Final GDP (exp +0.7% q/q), Final GDP Price Index (exp +3.8% q/q), and the Weekly Unemployment Claims (exp 210k) data. All will be closely watched and could provide a more fundamental driver for markets in between ongoing geopolitical headlines.
The post General Market Analysis – 9/04/26 first appeared on IC Your Trading Edge | Official Blog.
Ex-Dividend 9/04/2026
429366 April 8, 2026 17:40 ICMarkets Market News
The post Ex-Dividend 9/04/2026 first appeared on IC Your Trading Edge | Official Blog.
Wednesday 8th April 2026: Asia-Pacific Markets Surge as Trump Announces Two-Week Pause on Iran Strike Plans
429360 April 8, 2026 15:00 ICMarkets Market News
Global Markets:
- Asian Stock Markets : Nikkei up 5.23%, Shanghai Composite up 1.92% Hang Seng up 2.77% ASX up 2.64%
- Commodities : Gold at $4,830.01 (2.06%) Silver at $76.465 (6.22%), Brent Oil at $94.79 (-13.24%), WTI Oil at $95.92 (-15.08%)
- Rates : US 10-year yield at 4.240, UK 10-year yield at 4.9070, Germany 10-year yield at 3.0830
News & Data:
- (USD) Core Durable Goods Orders m/m 0.8% to 0.5% expected
- (USD) Durable Goods Orders m/m -1.4 to -1.1 expected
Markets Update:
Asia-Pacific markets rallied Wednesday after U.S. President Donald Trump said he would suspend planned attacks on Iranian infrastructure for two weeks, easing fears of further escalation in the Middle East. The pause is conditional on Iran agreeing to the “complete, immediate, and safe” reopening of the Strait of Hormuz, Trump said in a post on Truth Social.
Iranian Foreign Minister Abbas Araghchi, speaking on behalf of the Supreme National Security Council, said Tehran’s armed forces would cease defensive operations and coordinate to ensure safe passage through the Strait of Hormuz during the two-week period.
Oil prices dropped sharply following the announcement, with U.S. West Texas Intermediate crude falling 14% to $96.86 per barrel in late trading, reflecting expectations of improved supply stability.
Regional equities surged. South Korea’s Kospi jumped 5.8%, while the Kosdaq rose 4.1%, led by strong gains in Samsung Electronics and SK Hynix. Japan’s Nikkei 225 advanced 4.95% and the Topix climbed 3.1%. China’s CSI 300 gained 1.95%, Hong Kong’s Hang Seng Index rose 2.56%, and Australia’s S&P/ASX 200 added 2.7%.
U.S. futures also strengthened, with Dow futures rising 718 points, while S&P 500 and Nasdaq 100 futures gained 1.6% and 1.7%, respectively, amid optimism over easing geopolitical tensions.
Upcoming Events:
- 06:00 PM GMT – USD FOMC Meeting Minutes
The post Wednesday 8th April 2026: Asia-Pacific Markets Surge as Trump Announces Two-Week Pause on Iran Strike Plans first appeared on IC Your Trading Edge | Official Blog.
IC Markets Global – Europe Fundamental Forecast | 08 April 2026
429359 April 8, 2026 15:00 ICMarkets Market News
IC Markets Global – Europe Fundamental Forecast | 08 April 2026
What happened in the Asia session?
Middle‑East war risk (US–Iran tensions over the Strait of Hormuz), a fresh US‑services‑PMI print that softened but still showed expansion, and front‑end expectations for Fed policy as traders brace for Friday’s CPI. Asian equities traded in a narrow but risk‑on‑tinged range, with South Korea’s Kospi and Japan’s Topix ticking higher on AI‑chip‑related earnings strength, while oil prices held near multi‑year highs as WTI traded around 113 and Brent just above 110, reinforced by Trump’s threat to strike Iranian infrastructure if the Strait is not reopened.
What does it mean for the Europe & US sessions?
U.S.–Iran cease‑fire deal that lifted global equities and knocked oil down, while still leaving macro traders nervous about stubborn inflation and a potentially hawkish Fed; as European and U.S. sessions overlap, the key plays are Treasuries, crude, and equity‑index levels around the 10‑year yield and labour‑market‑driven policy expectations.
The Dollar Index (DXY)
Key news events today
FOMC Meeting Minutes (6:00 pm GMT)
What can we expect from DXY today?
The US dollar is trading slightly softer versus a basket of majors as a temporary Iran‑ceasefire narrative lifts risk‑on sentiment and lifts the euro, yen, and pound, but the greenback remains anchored by elevated US yields and cautious Fed policy. The Dollar Index is near 99.8, down from a recent peak slightly above 100.
Central Bank Notes:
- The Federal Open Market Committee (FOMC) is widely expected to hold the federal funds rate target range steady at 3.50%–3.75% at its March 17–18, 2026, meeting, amid rising oil prices from the US-Israel war against Iran and persistent inflation pressures, delaying any 2026 cuts potentially to September.
- The Committee continues to pursue maximum employment and 2% inflation goals, with the labor market weakening further as nonfarm payrolls declined by 92,000 in February 2026 and the unemployment rate rose to 4.4% from 4.3% in January.
- Officials face tilted risks from geopolitical tensions, elevated oil prices, and sticky inflation, with CPI steady at 2.4% year-over-year in February 2026, headline PCE at 2.8% in January, and core PCE rising to 3.1%.
- Economic activity has cooled after robust Q4 2025 growth of nearly 5%, with the Atlanta Fed GDPNow now estimating Q1 2026 growth at around 2.1%–2.7% amid softer consumer spending and labour data.
- December 2025’s Summary of Economic Projections forecasts 2025 unemployment at a median of 4.5%, 2026 GDP growth at 2.3%, and core PCE at 2.5%, with the dot plot signalling one more cut in 2026 to a median 3.4% funds rate; March updates may reflect softer labor and inflation upticks.
- The Committee maintains its data-dependent stance amid a softening labor market, inflation above target, and new oil shocks, likely holding rates at 3.50%-3.75% with ongoing divisions and possible hawkish dissents on rate cuts.
- The FOMC continues its adjusted quantitative tightening, with Treasury rolloff caps at $5 billion per month and agency MBS at $35 billion per month to ensure ample reserves post-2025 program adjustments.
- The next meeting is scheduled for 28 to 29 April 2026.
Next 24 Hours Bias
Medium Bearish
Gold (XAU)
Key news events today
FOMC Meeting Minutes (6:00 pm GMT)
What can we expect from Gold today?
Gold prices are trading higher in the mid‑$4,600s to near $4,800 per ounce as a softer US dollar and lingering geopolitical risk fuel safe‑haven demand, even after the metal pulled back sharply from its recent multi‑week highs near $4,400–$4,500. Central‑bank buying and elevated global inflation concerns continue to support the metal.
Next 24 Hours Bias
Weak Bearish
The Euro (EUR)
Key news events today
No major news event
What can we expect from EUR today?
The euro is holding steady in a narrow range versus the dollar, underpinned by a surprisingly resilient eurozone manufacturing sector and a moderate rebound in inflation to 2.5% in March, which supports a cautious easing bias from the ECB. Economic sentiment across the bloc has softened somewhat, particularly in services, but a disconnect between a still‑solid industrial base and weak‑sentiment data is keeping the euro supported without a strong breakout, as markets await clearer signals on both ECB and Fed rate‑path timing.
Central Bank Notes:
- The Governing Council of the ECB is expected to keep the three key interest rates unchanged at its 29–30 April 2026 meeting, with the main refinancing rate at 2.15%, marginal lending facility at 2.40%, and deposit facility at 2.00%. This reflects an ongoing commitment to 2% inflation stability amid heightened uncertainties from Middle East tensions and US trade policies under President Trump. Market probabilities indicate around 58% odds of no change, though some banks now price in potential hikes due to rising inflation risks.
- Price dynamics show increasing upside pressures, with headline HICP inflation likely around 2.0-2.2% in early 2026, driven by energy costs from Middle East conflicts offsetting euro strength. Core inflation remains sticky but moderating slowly, with projections revised upward to 2.6% for 2026 overall amid hawkish signals from ECB leadership.
- Updated Eurosystem staff projections for April 2026 may forecast headline inflation at 2.1-2.2% in 2026, 1.9% in 2027, and 2.0% in 2028, with upside risks from energy and trade dominating balanced prior views. A stronger euro provides some counterbalance, but recent data revisions highlight persistent pressures.
- Euro area GDP growth holds steady, with Q2 2026 surveys suggesting 0.2-0.3% qoq growth, in line with 1.1-1.3% annual forecasts through 2027. Defence spending, infrastructure, and low unemployment support resilience against trade headwinds and softer external demand.
- The labour market remains tight, with unemployment steady near 6.4%, bolstered by wage growth and participation gains. Supportive credit conditions continue aiding investment and consumption despite global risks.
- Business sentiment is cautious amid US tariffs, geopolitical flare-ups, and supply chain easing; a somewhat weaker euro boosts exports, while fiscal measures aid domestic activity.
- The Governing Council maintains its data-dependent, meeting-by-meeting stance, scrutinizing inflation, transmission, and external shocks without pre-committing to rate paths.
- Balance sheet normalization advances smoothly, with APP/PEPP wind-downs complete and no liquidity issues; banks show ample reserves and stable funding access.
The next meeting is on 29 April 2026
Next 24 Hours Bias
Medium Bearish
The Swiss Franc (CHF)
Key news events today
No major news event
What can we expect from CHF today?
Today, the Swiss franc is trading in a familiar 2026 regime: fundamentally strong and in demand as a safe‑haven currency, but heavily watched for potential SNB intervention should the move versus the euro or dollar accelerate too rapidly, with USD/CHF lately hovering around the 0.8000 zone amid mixed risk‑sentiment cues and lingering Middle‑East‑related safe‑haven flows.
Central Bank Notes:
- At its monetary policy assessment on 19 March 2026, the Swiss National Bank (SNB) is widely expected to leave the policy rate unchanged at 0%, continuing the extended pause since September 2025, as the Governing Board assesses current settings as adequate to maintain inflation near the target without resorting to negative rates.
- Inflation data since December indicate persistent weakness, with headline CPI hovering around 0% year-on-year through early 2026 and core measures subdued at roughly 0.4%, underscoring limited price pressures and lingering, though contained, deflation risks.
- The SNB’s updated conditional inflation forecast shows minimal change from December, with averages of about 0.2% in 2025 (now complete), 0.3% in 2026, and 0.6% in 2027 under a steady 0% policy rate. However, recent flat CPI readings may slightly lower near-term expectations, preserving scope for further easing if needed.
- Global conditions remain challenging, marked by U.S. tariff escalations under President Trump, subdued external demand, and uncertainties in major export markets such as Europe and the U.S., prompting the SNB to exercise caution despite resilient Swiss domestic activity.
- Sentiment in manufacturing and export sectors stays soft amid franc appreciation and weaker foreign orders, squeezing margins. Yet, overall GDP growth is expected to be around 1.5% in 2026, with unemployment edging up modestly from historic lows.
- The SNB reaffirms its readiness to intervene via rate cuts or FX operations should deflationary pressures intensify, while emphasizing clear communication through detailed meeting minutes and coordination with global partners on currency matters.
The next meeting is on 18 June 2026.
Next 24 Hours Bias
Medium Bullish
The Pound (GBP)
Key news events today
No major news event
What can we expect from GBP today?
The pound is struggling to sustain gains versus the dollar and euro amid a mix of still‑hawkish‑leaning U.S. policy expectations, elevated energy prices, and residual geopolitical risk, leaving GBP in a consolidation phase just above recent multi‑month lows rather than breaking out in any clear direction on Wednesday.
Central Bank Notes:
- The Bank of England’s Monetary Policy Committee (MPC) met on 19 March 2026, maintaining the Bank Rate at 3.75 per cent in a unanimous decision, following the prior narrow 5–4 vote to hold at the 5 February 2026 meeting. This pause reflects a sharp reversal from earlier market expectations of a 25-basis-point cut, driven by a Middle East conflict sparking global energy and commodity price surges. The March meeting did not include a Monetary Policy Report, with the next one due in April.
- Quantitative tightening (QT) proceeds unchanged at the 2025 pace of gilt holdings reductions, maintaining gradual balance-sheet normalization attuned to liquidity conditions and supportive of a restrictive stance amid new shocks.
- Headline CPI inflation faces near-term upside from the energy shock, reversing prior disinflation trends in domestic prices and wages; pre-shock services inflation had eased but now contends with higher utility and input costs, keeping pressures above the 2 per cent target. MPC projections will update in April, but analysts see inflation at 3-4 per cent by the end of 2026.
- UK growth softens further into Q2 2026, with unemployment risks rising amid potential confidence drops, higher precautionary saving, and widening output gaps; regular pay growth had cooled pre-shock but now faces business cost pass-through.
- Global headwinds intensify via Middle East conflict, driving volatile energy/commodity prices and sterling/gilt swings; MPC deems direct shocks manageable if demand weakens sufficiently to limit second-round effects.
- Inflation risks now tilt upwards from energy persistence and potential wage/cost embedding, offset by downside from demand slack and job losses; prior balance has shifted amid uncertainty on shock duration.
- The MPC adopts a wait-and-see posture post-shock, with policy deemed somewhat restrictive pre-event; all members are ready to act data-dependently for 2 per cent sustainability, eyeing April for fuller impact analysis and possible easing if disinflation resumes. Governor Bailey’s guidance stresses close monitoring without firm-cut commitments.
- The next meeting is on 30 April 2026.
Next 24 Hours Bias
Weak Bearish
The Canadian Dollar (CAD)
Key news events today
No major news event
What can we expect from GBP today?
The Canadian dollar shows modest strength versus the US dollar, with USD/CAD trading around the low‑1.38s after a small multi‑session pullback from levels above 1.39, supported by a weaker greenback and a temporary de‑escalation in US–Iran hostilities.
Central Bank Notes:
- The Governing Council held the overnight rate target steady at 2.25% at its 25 March 2026 meeting, aligning with consensus forecasts and extending the pause in policy adjustments amid balanced risks. The Bank emphasized persistent global uncertainties from Middle East conflicts and U.S. trade policies under President Trump, but affirmed the current stance supports ongoing disinflation without immediate shifts despite elevated energy price volatility.
- U.S. tariff threats and regional geopolitical tensions continue weighing on business sentiment, though Canadian manufacturing PMI has edged higher into expansion territory, with export orders firming on energy demand. Goods exports, led by crude oil, sustained momentum into February, offsetting cautious capex as firms prioritize resilience over aggressive growth.
- Economic growth carried into Q1 2026 at an annualized pace of around 2.2%, building on Q4 2025’s solid performance, fueled by resource exports, government outlays, and manufacturing rebound. February preliminary data points to steady expansion, though winter weather and supply chain frictions modestly curbed potential upside.
- Services sector PMI climbed further above 50, with broad gains in tech, hospitality, and business services; consumer-facing areas showed tentative improvement as real wages rose, though high service costs still restrained discretionary outlays. The Bank sees this diffusion as evidence of rebalancing toward sustainable activity.
- National housing resales ticked up in January-February alongside modest price gains, buoyed by stable rates and improved affordability in select regions, while inventory buildup in urban centers prevents excessive tightening. Officials anticipate continued moderation, aided by prudent mortgage rules amid steady household formation.
- Headline CPI eased to about 2.1% year-over-year in February 2026 estimates, staying within the control band, as core gauges like CPI-trim and median dipped to near 2.7% on softer food and durable goods pressures—despite sticky shelter costs. This reinforces the Bank’s view of inflation sustainably approaching the target.
- Policymakers reiterated that 2.25% remains well-calibrated to anchor 2% inflation and foster adjustment, with no cuts signaled barring downside surprises in growth or prices. Attention now turns to Q2 durability, core inflation persistence, and evolving trade/geopolitical clarity.
- The next meeting is on 23 April 2026.
Next 24 Hours Bias
Weak Bearish
Oil
Key news events today
EIA Crude Oil Inventories (2:30 pm GMT)
What can we expect from Oil today?
Oil prices collapsed below 100 dollars per barrel, as Brent and WTI each fell by roughly 14% on news of a U.S.‑led two‑week ceasefire with Iran that is set to reopen the Strait of Hormuz and ease near‑term supply fears. Although the move marks a sharp reversal from the record‑setting rally in March, market participants remain wary of renewed Middle‑East escalation, keeping the outlook volatile and leaving a floor around the mid‑80‑dollar zone if the truce holds.
Next 24 Hours Bias
Medium Bullish
The post IC Markets Global – Europe Fundamental Forecast | 08 April 2026 first appeared on IC Your Trading Edge | Official Blog.