Articles

General Market Analysis – 8/04/26
429356 April 8, 2026 14:40 ICMarkets Market News
Markets Rally After Ceasefire Confirmed – Oil down 16%
US equity markets finished little changed overnight, recovering from earlier sharp losses as investors weighed the increasing likelihood of a ceasefire in the Middle East against the approaching deadline set by Donald Trump. The Dow slipped 0.18% to close at 46,584, while the S&P 500 edged 0.08% higher to 6,616 and the Nasdaq gained 0.10% to finish at 22,017, reflecting a cautious tone throughout the session. In fixed income, US Treasury yields moved notably lower as geopolitical tensions appeared to ease, with the 2-year yield falling 6.0 basis points to 3.788% and the 10-year yield declining 3.8 basis points to 4.293%. The US dollar also softened, dropping 0.31% to 99.67, as reports emerged that Pakistan had requested a two-week extension to the US deadline and urged Iran to reopen the Strait of Hormuz. Commodity markets reflected the shifting sentiment. Oil prices reversed sharply from earlier highs, with Brent crude falling 3.70% to $105.77 and WTI declining 1.25% to $111.00. Gold, however, moved higher by 1.22% to $4,706.51, as the dollar fell.
Developments accelerated early in the Asian session, with confirmation of a two-week ceasefire in the Gulf and Iran agreeing to reopen the Strait of Hormuz. The reaction across markets was swift and decisive—oil prices plunged more than 16%, the US dollar fell around 1%, and global equity markets rallied strongly as risk appetite returned.
Relief Rallies to Dominate Markets Today
The market was on tenterhooks going into today’s trading sessions, with huge uncertainty surrounding which way the coin would land in the Middle East. The subsequent announcement of a ceasefire has led to huge relief rallies in the market that constitute not only a positive move from the ceasefire, but the effect has almost doubled the impact as there has not been the promised escalation which Trump had threatened. There is no doubt that there will be further twists in the Gulf in the coming days and weeks, but many in the market are now hoping that this is not only a ceasefire but an end to hostilities altogether. If we continue to get updates in line with this narrative, then expect these rallies to increase; however, any signs of further strikes would see risk-off trades come back to the forefront of investor attention and markets move accordingly.
Markets to Rally in Sessions Ahead
Looking ahead, volatility is expected to remain elevated, albeit with a clear bias toward risk-on positioning after confirmation came through of a ceasefire early in the Asian session. Attention will also turn to key macroeconomic events, with the latest policy decision from the Reserve Bank of New Zealand due out midway through the day. The bank is expected to keep rates on hold at 2.25%, but the devil will be in the detail of the statement, which could now be out of date given this morning’s ceasefire update and the later press conference. There is little of note on the calendar in the European time zone, but traders are expecting the reaction to this morning’s update in the Gulf to continue to push markets through the session. The New York session is also relatively quiet, with just the Weekly US Crude Oil Inventory (last 5.5 mio barrels) update likely to feature on the data front; however, the Federal Reserve meeting minutes toward the end of the session will influence markets and could even take some of the wind out of the sails provided by the ceasefire announcement.
The post General Market Analysis – 8/04/26 first appeared on IC Your Trading Edge | Official Blog.
Wednesday 8th April 2026: Technical Outlook and Review
429339 April 8, 2026 14:40 ICMarkets Market News
DXY (U.S. Dollar Index):
Potential Direction: Bearish
Overall momentum of the chart: Bearish
The price could see a short-term pullback toward the pivot before continuing its bearish move down toward the 1st support.
Pivot: 99.44
Supporting reasons: Identified as a pullback resistance, where selling pressures could intensify and potentially cap any upward retracement.
1st support: 98.71
Supporting reasons: Identified as a pullback support, indicating a potential area where the price could again stabilize.
1st resistance: 100.54
Supporting reasons: Identified as a swing high resistance, indicating a potential area that could halt any further upward movement
EUR/USD:
Potential Direction: Bullish
Overall momentum of the chart: Bullish
The price could see a short-term pullback toward the pivot before rising again toward the 1st resistance.
Pivot: 1.1625
Supporting reasons: Identified as a pullback support, where renewed buying pressure could emerge to push the price higher.
1st support: 1.1513
Supporting reasons: Identified as a pullback support, indicating a potential level where the price could stabilize once again.
1st resistance: 1.1733
Supporting reasons: Identified as a pullback resistance that aligns with the 127.2% Fibonacci projection, indicating a potential level that could cap further upward movement.
EUR/JPY:
Potential Direction: Bullish
Overall momentum of the chart: Bullish
The price could see a short-term pullback toward the pivot before rising again toward the 1st resistance.
Pivot: 184.67
Supporting reasons: Identified as a pullback support, where renewed buying pressure could emerge to push the price higher.
1st support: 183.60
Supporting reasons: Identified as an overlap support, indicating a potential area where the price could again stabilize.
1st resistance: 186.04
Supporting reasons: Identified as a swing high resistance that aligns with the 127.2% Fibonacci projection, indicating a potential level that could cap further upward movement.
EUR/GBP:
Potential Direction: Bullish
Overall momentum of the chart: Bullish
The price could see a short-term pullback toward the pivot before rising again toward the 1st resistance.
Pivot: 0.8690
Supporting reasons: Identified as a pullback support, where renewed buying pressure could emerge to push the price higher.
1st support: 0.8660
Supporting reasons: Identified as an overlap support, indicating a potential area where the price could stabilize once more.
1st resistance: 0.8747
Supporting reasons: Identified as a pullback resistance, indicating a potential level that could cap further upward movement.
GBP/USD:
Potential Direction: Bullish
Overall momentum of the chart: Bullish
The price could see a short-term pullback toward the pivot before rising again toward the 1st resistance.
Pivot: 1.3393
Supporting reasons: Identified as a pullback support, where renewed buying pressure could emerge to push the price higher.
1st support: 1.3253
Supporting reasons: Identified as a pullback support, indicating a potential area where the price could stabilize once more.
1st resistance: 1.3525
Supporting reasons: Identified as a pullback resistance, indicating a potential level that could halt further upward movement.
GBP/JPY:
Potential Direction: Bullish
Overall momentum of the chart: Bullish
The price could see a short-term pullback toward the pivot before rising again toward the 1st resistance.
Pivot: 211.46
Supporting reasons: Identified as a pullback support, where renewed buying pressure could emerge to push the price higher.
1st support: 209.68
Supporting reasons: Identified as an overlap support, indicating a potential level where the price could stabilize once more.
1st resistance: 213.20
Supporting reasons: Identified as a swing high resistance, indicating a potential level that could halt further upward movement.
USD/CHF:
Potential Direction: Bearish
Overall momentum of the chart: Bearish
The price could see a short-term pullback toward the pivot before continuing its bearish move down toward the 1st support.
Pivot: 0.7911
Supporting reasons: Identified as a pullback resistance, where selling pressures could intensify and potentially cap any upward retracement.
1st support: 0.7859
Supporting reasons: Identified as an overlap support that aligns with the 161.8% Fibonacci extension, indicating a potential level where the price could stabilize once again.
1st resistance: 0.8010
Supporting reasons: Identified as a swing high resistance, indicating a potential level that could cap further upward movement.
USD/JPY:
Potential Direction: Bearish
Overall momentum of the chart: Bullish
The price could see a short-term pullback toward the pivot before continuing its bearish move down toward the 1st support.
Pivot: 99.44
Supporting reasons: Identified as a pullback resistance, where selling pressures could intensify and potentially cap any upward retracement.
1st support: 157.64
Supporting reasons: Identified as an overlap support, indicating a strong area where buyers might return, and the price could stabilize once again.
1st resistance: 160.46
Supporting reasons: Identified as an overlap resistance. This level represents the next key area where upward movement could be capped amid increased selling pressure
USD/CAD:
Potential Direction: Brarish
Overall momentum of the chart: Bullish
The price could see a short-term pullback toward the pivot before continuing its bearish move down toward the 1st support.
Pivot: 1.3869
Supporting reasons: Identified as a pullback resistance, where selling pressures could intensify and potentially cap any upward retracement.
1st support: 1.3804
Supporting reasons: Identified as a pullback support that aligns with the 38.2% Fibonacci retracement, indicating a key level where the price could stabilize once more.
1st resistance: 1.3946
Supporting reasons: Identified as a swing high resistance, making it a possible target for bullish advances and a level where some sellers could return to cap gains
AUD/USD:
Potential Direction: Bullish
Overall momentum of the chart: Bullish
The price could see a short-term pullback toward the pivot before rising again toward the 1st resistance.
Pivot: 0.6954
Supporting reasons: Identified as a pullback support, where renewed buying pressure could emerge to push the price higher.
1st support: 0.6843
Supporting reasons: Identified as a multi-swing low support, this area has provided strong support historically and may attract buying interest for a potential short-term bounce
1st resistance: 0.7134
Supporting reasons: Identified as a pullback resistance, indicating a potential area that could halt any further upward movement.
NZD/USD
Potential Direction: Bullish
Overall momentum of the chart: Bullish
The price could see a short-term pullback toward the pivot before rising again toward the 1st resistance.
Pivot: 0.5773
Supporting reasons: Identified as a pullback support, where renewed buying pressure could emerge to push the price higher.
1st support: 0.5679
Supporting reasons: Identified as a swing low support, this area has provided strong support historically and may attract buying interest for a potential short-term bounce
1st resistance: 0.5855
Supporting reasons: Identified as a pullback resistance, indicating a potential area that could halt any further upward movement.
US30 (DJIA):
Potential Direction: Bullish
Overall momentum of the chart: Bullish
The price could see a short-term pullback toward the pivot before rising again toward the 1st resistance.
Pivot: 46,735.14
Supporting reasons: Identified as a pullback support, where renewed buying pressure could emerge to push the price higher.
1st support: 45,899.60
Supporting reasons: Identified as an overlap support, suggesting a potential area where the price could stabilize once again.
1st resistance: 47,812.53
Supporting reasons: Identified as a pullback resistance that aligns with the 100% Fibonacci projection, indicating a potential area that could halt any further upward movement.
DE40 (DAX):
Potential Direction: Bullish
Overall momentum of the chart: Bullish
The price could see a short-term pullback toward the pivot before rising again toward the 1st resistance.
Pivot: 23,391.28
Supporting reasons: Identified as a pullback support, where renewed buying pressure could emerge to push the price higher.
1st support: 22,790.93
Supporting reasons: Identified as a pullback support, indicating a key level where the price could stabilize once more.
1st resistance: 24,271.11
Supporting reasons: Identified as an overlap resistance, indicating a potential area that could halt any further upward movement.
US500 (S&P 500):
Potential Direction: Bullish
Overall momentum of the chart: Bullish
The price could see a short-term pullback toward the pivot before rising again toward the 1st resistance.
Pivot: 6,609.88
Supporting reasons: Identified as a pullback support, where renewed buying pressure could emerge to push the price higher.
1st support: 6,431.35
Supporting reasons: Identified as a pullback support, indicating a potential level where the price could stabilize once again.
1st resistance: 6,781.92
Supporting reasons: Identified as an overlap resistance, indicating a potential area that could halt any further upward movement.
BTC/USD (Bitcoin):
Potential Direction: Bullish
Overall momentum of the chart: Bearish
The price could see a short-term pullback toward the pivot before rising again toward the 1st resistance.
Pivot: 69,064.90
Supporting reasons: Identified as a pullback support, where renewed buying pressure could emerge to push the price higher.
1st support: 66,949.50
Supporting reasons: Identified as a pullback support, indicating a potential level where the price could stabilize once more.
1st resistance: 75,115.41
Supporting reasons: Identified as a swing high resistance, indicating a potential area that could halt any further upward movement.
ETH/USD (Ethereum):
Potential Direction: Bullish
Overall momentum of the chart: Bullish
The price could see a short-term pullback toward the pivot before rising again toward the 1st resistance.
Pivot: 2,163.67
Supporting reasons: Identified as a pullback support, where renewed buying pressure could emerge to push the price higher.
1st support: 2,0723.28
Supporting reasons: Identified as an overlap support, indicating a potential level where the price could stabilize once more.
1st resistance: 2,354.29
Supporting reasons: Identified as a swing high resistance, indicating a potential area that could halt any further upward movement.
WTI/USD (Oil):
Potential Direction: Bearish
Overall momentum of the chart: Bullish
The price could see a short-term pullback toward the pivot before continuing its bearish move down toward the 1st support.
Pivot: 105.53
Supporting reasons: Identified as a pullback resistance, where selling pressures could intensify and potentially cap any upward retracement.
1st support: 92.39
Supporting reasons: Identified as an overlap support, indicating a key level where the price could stabilize once more.
1st resistance: 115.09
Supporting reasons: Identified as a swing high resistance, indicating a potential area that could halt any further upward movement.
XAU/USD (GOLD):
Potential Direction: Bullish
Overall momentum of the chart: Bullish
The price could see a short-term pullback toward the pivot before rising again toward the 1st resistance.
Pivot: 4,696.76
Supporting reasons: Identified as a pullback support, where renewed buying pressure could emerge to push the price higher.
1st support: 4,589.14
Supporting reasons: Identified as an overlap support, indicating a key level where the price could stabilize once more.
1st resistance: 4,844.73
Supporting reasons: Identified as a pullback resistance that aligns with the 100% Fibonacci projection, indicating a potential area that could halt any further upward movement.
The accuracy, completeness and timeliness of the information contained on this site cannot be guaranteed. IC Markets Global does not warranty, guarantee or make any representations, or assume any liability regarding financial results based on the use of the information in the site.
News, views, opinions, recommendations and other information obtained from sources outside of www.icmarkets.com, used in this site are believed to be reliable, but we cannot guarantee their accuracy or completeness. All such information is subject to change at any time without notice. IC Markets Global assumes no responsibility for the content of any linked site.
The fact that such links may exist does not indicate approval or endorsement of any material contained on any linked site. IC Markets Global is not liable for any harm caused by the transmission, through accessing the services or information on this site, of a computer virus, or other computer code or programming device that might be used to access, delete, damage, disable, disrupt or otherwise impede in any manner, the operation of the site or of any user’s software, hardware, data or property.
The post Wednesday 8th April 2026: Technical Outlook and Review first appeared on IC Your Trading Edge | Official Blog.
IC Markets Global – Asia Fundamental Forecast | 08 April 2026
429338 April 8, 2026 14:02 ICMarkets Market News
IC Markets Global – Asia Fundamental Forecast | 08 April 2026
What happened in the U.S. session?
Overnight U.S. trading was dominated by a surprisingly strong March jobs report and hawkish Fed commentary that pushed back expectations for rate cuts, while geopolitical headlines around Iran and the Strait of Hormuz sent oil sharply higher and initially weighed on risk assets; ultimately, tech‑heavy indices recovered and ended marginally positive as de‑escalation‑risk premiums eased, leaving equities, oil, and the dollar as the most reactive instruments to the confluence of macro data and politics.
What does it mean for the Asia Session?
Escalating US-Iran tensions on April 8, 2026, as President Trump’s Tuesday evening deadline for Iran to reopen the Strait of Hormuz looms, with threats of strikes on civilian infrastructure like power plants and bridges if unmet; Iran has rejected a 45-day ceasefire and proposed a 10-point plan dismissed by Trump, fueling oil price surges near $113 for WTI its highest since June 2022 and potential volatility in risk assets.
The Dollar Index (DXY)
Key news events today
FOMC Meeting Minutes (6:00 pm GMT)
What can we expect from DXY today?
The dollar is trading resiliently, supported by a mix of geopolitical risk‑off flows, durable US yield advantages, and a still‑restrictive Fed stance, all of which are helping the greenback outperform most G‑10 peers despite longer‑term questions about its reserve‑currency role.
Central Bank Notes:
- The Federal Open Market Committee (FOMC) is widely expected to hold the federal funds rate target range steady at 3.50%–3.75% at its March 17–18, 2026, meeting, amid rising oil prices from the US-Israel war against Iran and persistent inflation pressures, delaying any 2026 cuts potentially to September.
- The Committee continues to pursue maximum employment and 2% inflation goals, with the labor market weakening further as nonfarm payrolls declined by 92,000 in February 2026 and the unemployment rate rose to 4.4% from 4.3% in January.
- Officials face tilted risks from geopolitical tensions, elevated oil prices, and sticky inflation, with CPI steady at 2.4% year-over-year in February 2026, headline PCE at 2.8% in January, and core PCE rising to 3.1%.
- Economic activity has cooled after robust Q4 2025 growth near 5%, with the Atlanta Fed GDPNow now estimating Q1 2026 growth at around 2.1%–2.7% amid softer consumer spending and labor data.
- December 2025’s Summary of Economic Projections forecasts 2025 unemployment at a median of 4.5%, 2026 GDP growth at 2.3%, and core PCE at 2.5%, with the dot plot signaling one more cut in 2026 to a median 3.4% funds rate; March updates may reflect softer labor and inflation upticks.
- The Committee maintains its data-dependent stance amid a softening labor market, inflation above target, and new oil shocks, likely holding rates at 3.50%-3.75% with ongoing divisions and possible hawkish dissents on rate cuts.
- The FOMC continues its adjusted quantitative tightening, with Treasury rolloff caps at $5 billion per month and agency MBS at $35 billion per month to ensure ample reserves post-2025 program adjustments.
- The next meeting is scheduled for 28 to 29 April 2026.
Next 24 Hours Bias
Medium Bearish
Gold (XAU)
Key news events today
FOMC Meeting Minutes (6:00 pm GMT)
What can we expect from Gold today?
Gold is consolidating in a narrow but historically high band around the mid‑$4,600s per ounce, balancing a recent correction with persistent safe‑haven demand driven by Middle‑East tensions and the extension of a key U.S. policy deadline. Prices are supported by central‑bank buying and retail hedging, yet constrained by a firmer dollar and uncertainty over whether the latest diplomatic move signals de‑escalation or prolonged risk, keeping the metal in a choppy, range‑bound environment.
Next 24 Hours Bias
Medium Bearish
The Australian Dollar (AUD)
Key news events today
No major news event
What can we expect from AUD today?
The Australian Dollar edged higher in a volatile session, stabilizing above 0.6900 against the USD as markets clung to slim positives from Iran Strait traffic and de-escalation signals amid US-Iran deadline fears, though paralysis from conflicting headlines on escalation versus ceasefires kept ranges wide and data secondary.
Central Bank Notes:
- The Reserve Bank of Australia (RBA) is expected to hold its cash rate at 3.85% at the March 16-17, 2026 policy meeting, following the widely anticipated 25 basis point hike to 3.85% in early February after persistent inflation pressures from late 2025. While some banks like CBA, NAB, and Westpac now forecast a further 25 basis point rise to 4.10% as soon as May if inflation data remains sticky, consensus tilts toward a pause in March to assess incoming monthly CPI and labor market signals. The February hike reversed prior cuts, entering mildly restrictive territory amid capacity pressures, with the board emphasizing data dependence.
- Inflation remains elevated, with December 2025 CPI at 3.8% year-on-year and trimmed mean at 3.3%, above the 2–3% target midpoint. RBA’s February Statement revised forecasts higher, projecting trimmed-mean inflation to peak in mid-2026 above 3% and remain elevated through early 2027, driven by services, housing, and demand resilience despite some monthly cooling, such as January’s 0.2% MoM gauge. Monthly CPI data continues to highlight core stickiness beyond energy rebates, delaying the target return to late 2027 or beyond.
- January 2026 monthly indicators showed modest easing, but headline CPI risks upward surprises from housing (up recently) and services amid firm domestic demand. Trimmed mean pressures persist from wage growth and capacity constraints, with consumer expectations ticking to 5% YoY in February surveys. Enhanced monthly reporting sharpens vigilance on potential broad-based pick-up.
- The labor market shows softening, with unemployment around 4.1-4.4%, down slightly to 4.1% in December, but unit labor costs are elevated due to subdued productivity. Household spending faces higher borrowing costs post-hike, yet private demand recovery sustains capacity strains. Vulnerabilities persist amid resilient employment dynamics.
- Global growth modestly revised up but tempered by geopolitics and commodity volatility; policy now restrictive post-February, with the RBA balancing inflation against employment risks. Data from the monthly CPI and Q1 GDP will guide, amid household debt sensitivities.
- Sustained restrictive stance post-February anchors inflation return to target, upholding dual mandate with flexibility to new risks like further inflation upticks.
- Markets price a March hold at 3.85%, with big four banks split: CBA, NAB, Westpac eye May hike to 4.10% if persistence continues, while others see limited upside unless acceleration. Upcoming monthly CPI pivotal for Q2 trajectory.
- Policy vigilance counters inflation stickiness against household fragilities and global uncertainties, reaffirming adaptability under dual mandate.
- Base case favors March hold with risks tilted hawkish for further hikes if data is hot; monthly indicators key to 2026 path.
- The next meeting is on 5 to 6 May 2026.
Next 24 Hours Bias
Medium Bearish
The Kiwi Dollar (NZD)
Key news events today
Official Cash Rate (2:00 am GMT)
RBNZ Rate Statement (2:00 am GMT)
RBNZ Press Conference (3:00 am GMT)
What can we expect from NZD today?
The NZD remained range-bound near recent lows, supported by softer USD sentiment but capped by RBNZ’s accommodative stance at 2.25% OCR and expectations of a potential September hike; broader factors like Chinese data and US policy volatility continue influencing its path, with forecasts eyeing 0.57 quarterly and 0.59 annually.
Central Bank Notes:
- The Reserve Bank of New Zealand’s (RBNZ) Monetary Policy Committee (MPC) is widely expected to hold the Official Cash Rate (OCR) steady at 2.25% at its 8 April 2026 Monetary Policy Review, aligning with unanimous market consensus from Reuters polls and previews.
- The MPC continues its data-dependent “wait-and-see” approach after February’s pause, balancing stimulus from prior 325 basis point cuts against inflation’s path back to the 2% target, with readiness for gradual normalization only if recovery strengthens or inflation exceeds forecasts.
- Headline CPI, last at 3.1%, is on track to re-enter the 1-3% band in Q2 2026 and hit 2% by mid-2027, aided by spare capacity, moderating wages, and softer food/fuel prices; two-year business inflation expectations have ticked up slightly to 2.37%.
- Household spending and housing remain subdued amid cautious consumption, low net migration, and labor market softness, though easing retail rates support budgets; high-frequency GDP indicators show steadying momentum in an early recovery phase.
- Accommodative borrowing costs from the low OCR are boosting mortgage approvals and sentiment, but business credit growth lags due to uneven confidence; overall stimulus persists below the 3% neutral rate.
- Risks are balanced, with a favorable global environment—including stronger dairy/meat exports and a softer NZ dollar—offsetting oil shocks and prior China/US trade worries; vigilance remains on second-round inflation effects.
- Forecasts point to potential OCR hikes starting late 2026 (e.g., December) or early 2027 to 2.50% by year-end if activity/inflation firms, but policy stays supportive if recovery unfolds gradually as expected.
- The next meeting is on 27 May 2026.
Next 24 Hours Bias
Weak Bearish
The Japanese Yen (JPY)
Key news events today
No major news event
What can we expect from JPY today?
USD/JPY hovered near 159.6-160, reflecting yen struggles from safe-haven dollar demand amid global uncertainties, tempered by BoJ hawkishness and Tokyo’s intervention threats that limited upside beyond recent peaks. Markets eyed the BoJ’s April policy meeting for rate hike clarity, with forecasts pointing to potential USD/JPY at 160 by quarter-end but longer-term easing to 155.
Central Bank Notes:
- The Policy Board of the Bank of Japan meets on 18–19 April 2026, with markets anticipating the short-term policy rate to remain at 0.75%, as the bank continues evaluating the December 2025 and prior hikes’ effects amid data-dependent normalization.
- The BOJ will target the uncollateralized overnight call rate around 0.75% and indicate future hikes hinge on impacts to lending, financing, and activity, with Governor Ueda signaling scrutiny of data for potential moves in April or later meetings.
- JGB tapering advances per plan, cutting outright purchases by ¥400 billion quarterly through Q1 2026 and slowing to ¥200 billion from April onward, targeting roughly ¥2-3 trillion monthly by mid-2026, adjustable for market stability
- Japan’s economy maintains moderate growth into Q1 2026, building on the Q4 2025 rebound via exports and fiscal measures, though manufacturing sentiment holds soft amid overseas demand weakness and yen pressures.
- Core CPI (ex-fresh food) likely stays near 2.3-2.5% y/y in early 2026. Tokyo prints off prior highs but above 2%, while core-core hovers around 2.6%, reflecting sustained but easing inflationary forces.
- Input costs ease further from import peaks, yet services inflation, 5% wage targets in shunto talks, and anchored expectations above 2% support price persistence, with upside risks from yen and geopolitics.
- Near-term real GDP may ease below trend due to tightening and external shocks like Iran tensions, but negative real rates, wage gains, and stimulus should underpin consumption and capex rebound.
- Medium-term, overseas recovery, labor shortages, and productivity lifts are set to fuel wages and core inflation near/above 2%, enabling gradual hikes toward 1% if conditions align.
- The next meeting is on 27 to 28 April 2026.
Next 24 Hours Bias
Medium Bearish
Oil
Key news events today
EIA Crude Oil Inventories (2:30 pm GMT)
What can we expect from Oil today?
Oil markets remain highly volatile, driven primarily by escalating U.S.-Iran tensions over the Strait of Hormuz. WTI crude settled near $112 per barrel yesterday, with Brent around $110, reflecting a year-to-date surge of nearly 100% amid fears of prolonged supply disruptions from the effective closure of this critical chokepoint, which once handled 20% of global oil flows.
Next 24 Hours Bias
Medium Bullish
The post IC Markets Global – Asia Fundamental Forecast | 08 April 2026 first appeared on IC Your Trading Edge | Official Blog.
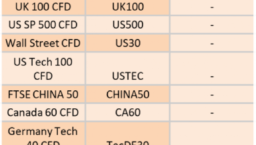
Ex-Dividend 8/04/2026
429333 April 8, 2026 11:00 ICMarkets Market News
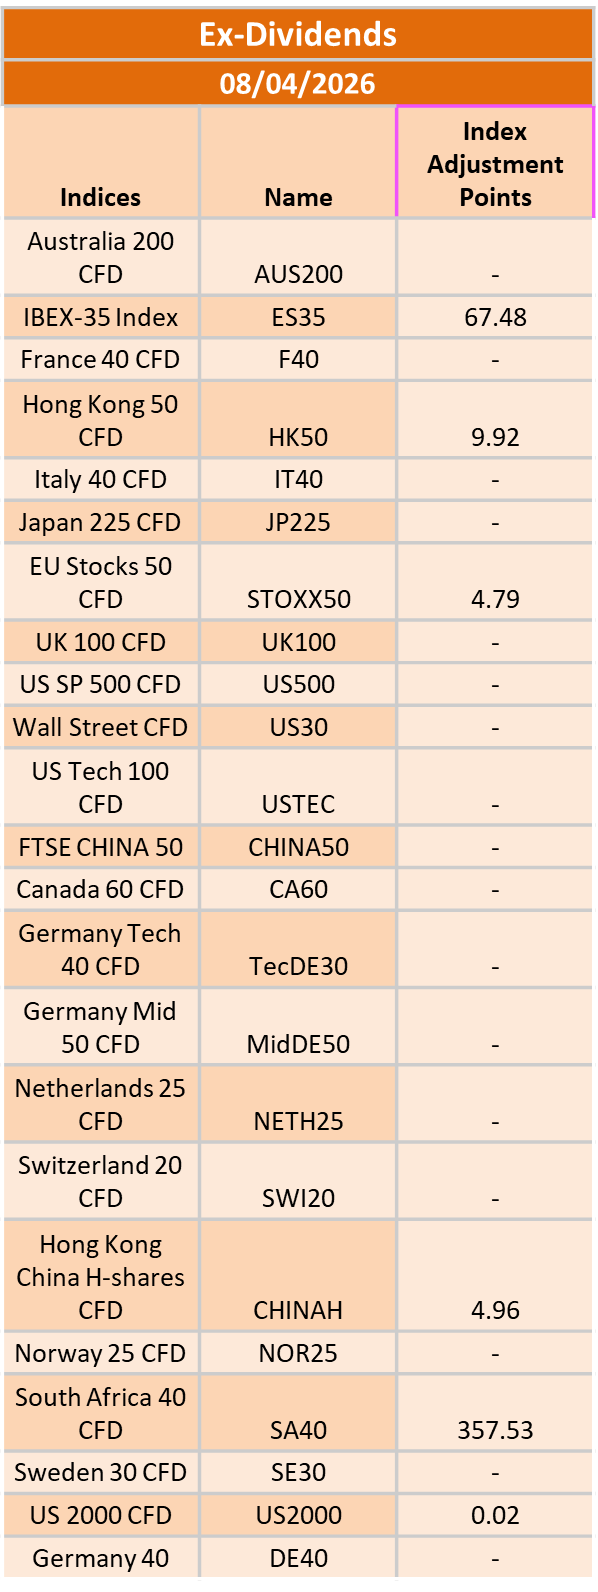
The post Ex-Dividend 8/04/2026 first appeared on IC Your Trading Edge | Official Blog.
IC Markets Global – Europe Fundamental Forecast | 07 April 2026
429309 April 7, 2026 16:40 ICMarkets Market News
IC Markets Global – Europe Fundamental Forecast | 07 April 2026
What happened in the Asia session?
Asia’s session today is operating in the shadow of Friday’s strong US jobs data and further threats of escalation in the Iran conflict, which have tilted the macro backdrop toward higher‑for‑longer US rates and elevated oil‑driven inflation risks. This has kept the dollar relatively firm, pushed energy‑linked instruments like crude oil sharply higher, and weighed on gold and several cyclical‑heavy Asian equity indices.
What does it mean for the Europe & US sessions?
Traders should be alert to fresh momentum in oil driven by Trump’s looming Iran‑related deadline, resilient U.S. labor‑market signals that are pushing back on near‑term Fed‑cut bets, and European equities’ mixed reaction to persistent inflation and geopolitical risk; together, these forces are sustaining a “higher‑for‑longer” rate‑risk narrative that is keeping bond yields supported and driving selective flows into defensives and AI‑related tech rather than broad cyclical exposure.
The Dollar Index (DXY)
Key news events today
Core Durable Goods Orders m/m (12:30 pm GMT)
Durable Goods Orders m/m (12:30 pm GMT)
What can we expect from DXY today?
The US Dollar remains robust today amid ongoing Middle East tensions, particularly the closure of the Strait of Hormuz since late February, which has driven oil prices above $110 per barrel and bolstered safe-haven demand for USD. The DXY index hovers around 100, supported by the Federal Reserve holding rates at 3.50–3.75% ahead of its April 29 decision, sticky core inflation, and resilient US economic data like March’s 178,000 non-farm payrolls.
Central Bank Notes:
- The Federal Open Market Committee (FOMC) is widely expected to hold the federal funds rate target range steady at 3.50%–3.75% at its March 17–18, 2026, meeting, amid rising oil prices from the US-Israel war against Iran and persistent inflation pressures, delaying any 2026 cuts potentially to September.
- The Committee continues to pursue maximum employment and 2% inflation goals, with the labor market weakening further as nonfarm payrolls declined by 92,000 in February 2026 and the unemployment rate rose to 4.4% from 4.3% in January.
- Officials face tilted risks from geopolitical tensions, elevated oil prices, and sticky inflation, with CPI steady at 2.4% year-over-year in February 2026, headline PCE at 2.8% in January, and core PCE rising to 3.1%.
- Economic activity has cooled after robust Q4 2025 growth of nearly 5%, with the Atlanta Fed GDPNow now estimating Q1 2026 growth at around 2.1%–2.7% amid softer consumer spending and labour data.
- December 2025’s Summary of Economic Projections forecasts 2025 unemployment at a median of 4.5%, 2026 GDP growth at 2.3%, and core PCE at 2.5%, with the dot plot signalling one more cut in 2026 to a median 3.4% funds rate; March updates may reflect softer labor and inflation upticks.
- The Committee maintains its data-dependent stance amid a softening labor market, inflation above target, and new oil shocks, likely holding rates at 3.50%-3.75% with ongoing divisions and possible hawkish dissents on rate cuts.
- The FOMC continues its adjusted quantitative tightening, with Treasury rolloff caps at $5 billion per month and agency MBS at $35 billion per month to ensure ample reserves post-2025 program adjustments.
- The next meeting is scheduled for 28 to 29 April 2026.
Next 24 Hours Bias
Medium Bullish
Gold (XAU)
Key news events today
Core Durable Goods Orders m/m (12:30 pm GMT)
Durable Goods Orders m/m (12:30 pm GMT)
What can we expect from Gold today?
Gold remains range-bound between $4,576 and $4,701, influenced by President Trump’s signals of prolonged conflict in Iran, which dampen safe-haven demand amid a firmer U.S. dollar and surging Brent crude. Forecasts suggest sideways trading today, with analysts watching for any ceasefire developments or dollar shifts that could trigger short-term downside or renewed upside momentum.
Next 24 Hours Bias
Weak Bullish
The Euro (EUR)
Key news events today
No major news event
What can we expect from EUR today?
The euro is consolidating amid modest risk‑on flows and lingering dollar strength, with EUR/USD trading near 1.16 without a clear directional bias; markets are focused on upcoming U.S.‑data and global risk‑sentiment drivers, while Eurozone fundamentals and ECB‑policy expectations remain relatively stable and supportive of a sideways‑to‑slightly‑constructive profile for the euro.
Central Bank Notes:
- The Governing Council of the ECB is expected to keep the three key interest rates unchanged at its 29–30 April 2026 meeting, with the main refinancing rate at 2.15%, marginal lending facility at 2.40%, and deposit facility at 2.00%. This reflects an ongoing commitment to 2% inflation stability amid heightened uncertainties from Middle East tensions and US trade policies under President Trump. Market probabilities indicate around 58% odds of no change, though some banks now price in potential hikes due to rising inflation risks.
- Price dynamics show increasing upside pressures, with headline HICP inflation likely around 2.0-2.2% in early 2026, driven by energy costs from Middle East conflicts offsetting euro strength. Core inflation remains sticky but moderating slowly, with projections revised upward to 2.6% for 2026 overall amid hawkish signals from ECB leadership.
- Updated Eurosystem staff projections for April 2026 may forecast headline inflation at 2.1-2.2% in 2026, 1.9% in 2027, and 2.0% in 2028, with upside risks from energy and trade dominating balanced prior views. A stronger euro provides some counterbalance, but recent data revisions highlight persistent pressures.
- Euro area GDP growth holds steady, with Q2 2026 surveys suggesting 0.2-0.3% qoq growth, in line with 1.1-1.3% annual forecasts through 2027. Defence spending, infrastructure, and low unemployment support resilience against trade headwinds and softer external demand.
- The labour market remains tight, with unemployment steady near 6.4%, bolstered by wage growth and participation gains. Supportive credit conditions continue aiding investment and consumption despite global risks.
- Business sentiment is cautious amid US tariffs, geopolitical flare-ups, and supply chain easing; a somewhat weaker euro boosts exports, while fiscal measures aid domestic activity.
- The Governing Council maintains its data-dependent, meeting-by-meeting stance, scrutinizing inflation, transmission, and external shocks without pre-committing to rate paths.
- Balance sheet normalization advances smoothly, with APP/PEPP wind-downs complete and no liquidity issues; banks show ample reserves and stable funding access.
The next meeting is on 29 April 2026
Next 24 Hours Bias
Weak Bearish
The Swiss Franc (CHF)
Key news events today
No major news event
What can we expect from CHF today?
The Swiss Franc has strengthened notably in 2026—up nearly 3% YTD versus the USD—bolstered by a weakening dollar, persistent Euro weakness, and its safe-haven status amid market volatility and policy divergence. While SNB interventions loom to cap excessive gains, business outlooks remain bullish on CHF demand, with USD/CHF eyeing 0.76 support and EUR/CHF near multi-year lows; traders watch for stabilization cues absent fresh catalysts today.
Central Bank Notes:
- At its monetary policy assessment on 19 March 2026, the Swiss National Bank (SNB) is widely expected to leave the policy rate unchanged at 0%, continuing the extended pause since September 2025, as the Governing Board assesses current settings as adequate to maintain inflation near the target without resorting to negative rates.
- Inflation data since December indicate persistent weakness, with headline CPI hovering around 0% year-on-year through early 2026 and core measures subdued at roughly 0.4%, underscoring limited price pressures and lingering, though contained, deflation risks.
- The SNB’s updated conditional inflation forecast shows minimal change from December, with averages of about 0.2% in 2025 (now complete), 0.3% in 2026, and 0.6% in 2027 under a steady 0% policy rate. However, recent flat CPI readings may slightly lower near-term expectations, preserving scope for further easing if needed.
- Global conditions remain challenging, marked by U.S. tariff escalations under President Trump, subdued external demand, and uncertainties in major export markets such as Europe and the U.S., prompting the SNB to exercise caution despite resilient Swiss domestic activity.
- Sentiment in manufacturing and export sectors stays soft amid franc appreciation and weaker foreign orders, squeezing margins. Yet, overall GDP growth is expected to be around 1.5% in 2026, with unemployment edging up modestly from historic lows.
- The SNB reaffirms its readiness to intervene via rate cuts or FX operations should deflationary pressures intensify, while emphasizing clear communication through detailed meeting minutes and coordination with global partners on currency matters.
The next meeting is on 18 June 2026.
Next 24 Hours Bias
Medium Bearish
The Pound (GBP)
Key news events today
No major news event
What can we expect from GBP today?
The British pound has been trading under pressure today, largely stuck in a dollar‑driven risk‑off backdrop, with GBP/USD hovering around the mid‑1.3200s in early London trading. Recent data show the pair down over 650 pips from its January high near 1.3870, and many analysts now view sterling as technically oversold but still dominated by geopolitical and dollar‑strength headwinds.
Central Bank Notes:
- The Bank of England’s Monetary Policy Committee (MPC) met on 19 March 2026, maintaining the Bank Rate at 3.75 per cent in a unanimous decision, following the prior narrow 5–4 vote to hold at the 5 February 2026 meeting. This pause reflects a sharp reversal from earlier market expectations of a 25-basis-point cut, driven by a Middle East conflict sparking global energy and commodity price surges. The March meeting did not include a Monetary Policy Report, with the next one due in April.
- Quantitative tightening (QT) proceeds unchanged at the 2025 pace of gilt holdings reductions, maintaining gradual balance-sheet normalization attuned to liquidity conditions and supportive of a restrictive stance amid new shocks.
- Headline CPI inflation faces near-term upside from the energy shock, reversing prior disinflation trends in domestic prices and wages; pre-shock services inflation had eased but now contends with higher utility and input costs, keeping pressures above the 2 per cent target. MPC projections will update in April, but analysts see inflation at 3-4 per cent by the end of 2026.
- UK growth softens further into Q2 2026, with unemployment risks rising amid potential confidence drops, higher precautionary saving, and widening output gaps; regular pay growth had cooled pre-shock but now faces business cost pass-through.
- Global headwinds intensify via Middle East conflict, driving volatile energy/commodity prices and sterling/gilt swings; MPC deems direct shocks manageable if demand weakens sufficiently to limit second-round effects.
- Inflation risks now tilt upside from energy persistence and potential wage/cost embedding, offset by downside from demand slack and job losses; prior balance has shifted amid uncertainty on shock duration.
- The MPC adopts a wait-and-see posture post-shock, with policy deemed somewhat restrictive pre-event; all members are ready to act data-dependently for 2 per cent sustainability, eyeing April for fuller impact analysis and possible easing if disinflation resumes. Governor Bailey’s guidance stresses close monitoring without firm-cut commitments.
- The next meeting is on 30 April 2026.
Next 24 Hours Bias
Weak Bearish
The Canadian Dollar (CAD)
Key news events today
Ivey PMI (2:00 pm GMT)
What can we expect from GBP today?
The Canadian dollar is trading slightly softer against the US dollar, with USD/CAD hovering near 1.393 as the greenback draws support from safe‑haven demand and firm US monetary‑policy expectations, while higher oil prices only partially offset Loonie weakness.
Central Bank Notes:
- The Governing Council held the overnight rate target steady at 2.25% at its 25 March 2026 meeting, aligning with consensus forecasts and extending the pause in policy adjustments amid balanced risks. The Bank emphasized persistent global uncertainties from Middle East conflicts and U.S. trade policies under President Trump, but affirmed the current stance supports ongoing disinflation without immediate shifts despite elevated energy price volatility.
- U.S. tariff threats and regional geopolitical tensions continue weighing on business sentiment, though Canadian manufacturing PMI has edged higher into expansion territory, with export orders firming on energy demand. Goods exports, led by crude oil, sustained momentum into February, offsetting cautious capex as firms prioritize resilience over aggressive growth.
- Economic growth carried into Q1 2026 at an annualized pace of around 2.2%, building on Q4 2025’s solid performance, fueled by resource exports, government outlays, and manufacturing rebound. February preliminary data points to steady expansion, though winter weather and supply chain frictions modestly curbed potential upside.
- Services sector PMI climbed further above 50, with broad gains in tech, hospitality, and business services; consumer-facing areas showed tentative improvement as real wages rose, though high service costs still restrain discretionary outlays. The Bank sees this diffusion as evidence of rebalancing toward sustainable activity.
- National housing resales ticked up in January-February alongside modest price gains, buoyed by stable rates and improved affordability in select regions, while inventory buildup in urban centers prevents excessive tightening. Officials anticipate continued moderation, aided by prudent mortgage rules amid steady household formation.
- Headline CPI eased to about 2.1% year-over-year in February 2026 estimates, staying within the control band, as core gauges like CPI-trim and median dipped to near 2.7% on softer food and durable goods pressures—despite sticky shelter costs. This reinforces the Bank’s view of inflation sustainably approaching the target.
- Policymakers reiterated that 2.25% remains well-calibrated to anchor 2% inflation and foster adjustment, with no cuts signaled barring downside surprises in growth or prices. Attention now turns to Q2 durability, core inflation persistence, and evolving trade/geopolitical clarity.
- The next meeting is on 23 April 2026.
Next 24 Hours Bias
Weak Bearish
Oil
Key news events today
API Crude Oil Stock (8:30 pm GMT)
What can we expect from Oil today?
Oil markets are experiencing upward pressure on prices amid ongoing geopolitical tensions, particularly in the Middle East involving Iran and the Strait of Hormuz, as well as the Ukraine conflict disrupting supplies. OPEC+ has agreed to a gradual production increase starting this month, with an initial adjustment of 206,000 barrels per day by eight key members, following their April 5 meeting to assess low inventories and market stability, though flexibility remains for further cuts if needed.
Next 24 Hours Bias
Strong Bullish
The post IC Markets Global – Europe Fundamental Forecast | 07 April 2026 first appeared on IC Your Trading Edge | Official Blog.
Tuesday 7th April 2026: Asia-Pacific Markets Turn Volatile as Iran Conflict Pressures Investors
429308 April 7, 2026 16:40 ICMarkets Market News
Global Markets:
- Asian Stock Markets : Nikkei up 0.10%, Shanghai Composite up 0.03% Hang Seng down 0.70% ASX up 1.54%
- Commodities : Gold at $4,687.80 (0.09%) Silver at $73.155 (0.42%), Brent Oil at $111.32 (1.41%), WTI Oil at $115.38 (2.62%)
- Rates : US 10-year yield at 4.347, UK 10-year yield at 4.8460, Germany 10-year yield at 2.9951
News & Data:
- (USD) ISM Services PMI 54.0 to 54.8 expected
Markets Update:
Asia-Pacific markets traded unevenly Tuesday, reversing early gains as investors reacted to escalating developments surrounding the Iran conflict. U.S. President Donald Trump warned that Iran’s civilian infrastructure could be targeted within 24 hours if a peace agreement is not reached, while also indicating ongoing negotiations with Tehran.
Trump repeated his demand that Iran reopen the Strait of Hormuz by Tuesday evening, a critical route for global energy shipments. He cautioned that failure to comply could trigger strikes on bridges and power facilities. Meanwhile, both sides are considering a framework to end the five-week conflict. Iran rejected Washington’s ceasefire proposal and instead suggested a 10-point plan that includes lifting sanctions, ensuring safe passage through the strait, and securing a lasting regional truce.
Oil prices climbed sharply on the uncertainty, with West Texas Intermediate rising 3.4% to $116.20 per barrel and Brent crude gaining 1.7% to $111.59.
Regional equities reflected the volatility. Australia’s S&P/ASX 200 rose 1.4%, while Japan’s Nikkei 225 slipped 0.17% and South Korea’s Kosdaq dropped 1.5%. India’s Nifty 50 and Sensex each declined about 0.5%.
Strategists noted geopolitical swings can create opportunities for long-term investors, especially in utilities, financials, industrials, and technology, with defense and energy sectors positioned to benefit most from the conflict-driven uncertainty.
Upcoming Events:
- 12:30 PM GMT – USD Core Durable Goods Orders m/m
- 12:30 PM GMT – USD Durable Goods Orders m/m
The post Tuesday 7th April 2026: Asia-Pacific Markets Turn Volatile as Iran Conflict Pressures Investors first appeared on IC Your Trading Edge | Official Blog.
Tuesday 7th April 2026: Technical Outlook and Review
429305 April 7, 2026 16:01 ICMarkets Market News
DXY (U.S. Dollar Index):
Potential Direction: Bullish
Overall momentum of the chart: Bearish
The price has already bounced off the pivot and may continue its bullish move toward the 1st resistance
Pivot: 99.44
Supporting reasons: Identified as an overlap support, where renewed buying pressure could emerge to push the price higher.
1st support: 98.85
Supporting reasons: Identified as a pullback support, indicating a potential area where the price could again stabilize.
1st resistance: 100.54
Supporting reasons: Identified as a swing high resistance, indicating a potential area that could halt any further upward movement
EUR/USD:
Potential Direction: Bullish
Overall momentum of the chart: Bullish
The price has already bounced off the pivot and may continue its bullish move toward the 1st resistance
Pivot: 1.1515
Supporting reasons: Identified as an overlap support that aligns with the 61.8% Fibonacci retracement, where renewed buying pressure could emerge to push the price higher.
1st support: 1.1414
Supporting reasons: Identified as a swing high support, indicating a potential level where the price could stabilize once again.
1st resistance: 1.1622
Supporting reasons: Identified as a multi-swing high resistance, indicating a potential level that could cap further upward movement.
EUR/JPY:
Potential Direction: Bullish
Overall momentum of the chart: Bullish
The price has already bounced off the pivot and may continue its bullish move toward the 1st resistance
Pivot: 183.60
Supporting reasons: Identified as a pullback support that aligns with the 50% Fibonacci retracement, where renewed buying pressure could emerge to push the price higher.
1st support: 182.21
Supporting reasons: Identified as an overlap support, indicating a potential area where the price could again stabilize.
1st resistance: 184.68
Supporting reasons: Identified as an overlap resistance, indicating a potential level that could cap further upward movement.
EUR/GBP:
Potential Direction: Bullish
Overall momentum of the chart: Bullish
The price could see a short-term pullback toward the pivot before rising again toward the 1st resistance.
Pivot: 0.8690
Supporting reasons: Identified as a pullback support, where renewed buying pressure could emerge to push the price higher.
1st support: 0.8660
Supporting reasons: Identified as an overlap support, indicating a potential area where the price could stabilize once more.
1st resistance: 0.8747
Supporting reasons: Identified as a pullback resistance, indicating a potential level that could cap further upward movement.
GBP/USD:
Potential Direction: Bearish
Overall momentum of the chart: Bullish
The price has already reacted off the pivot and may continue its bearish move toward the 1st support.
Pivot: 1.3259
Supporting reasons: Identified as a pullback resistance that aligns with the 50% Fibonacci retracement, where selling pressures could intensify and potentially cap any upward retracement.
1st support: 1.3159
Supporting reasons: Identified as a swing low support, indicating a potential area where the price could stabilize once more.
1st resistance: 1.3382
Supporting reasons: Identified as a pullback resistance, indicating a potential level that could halt further upward movement.
GBP/JPY:
Potential Direction: Bearish
Overall momentum of the chart: Bullish
The price could see a short-term pullback toward the pivot before rising again toward the 1st resistance.
Pivot: 212.02
Supporting reasons: Identified as a pullback resistance that aligns with the 61.8% Fibonacci retracement, where selling pressures could intensify and potentially cap any upward retracement.
1st support: 209.68
Supporting reasons: Identified as an overlap support, indicating a potential level where the price could stabilize once more.
1st resistance: 213.20
Supporting reasons: Identified as a swing high resistance, indicating a potential level that could halt further upward movement.
USD/CHF:
Potential Direction: Bullish
Overall momentum of the chart: Bearish
The price has already bounced off the pivot and may continue its bullish move toward the 1st resistance
Pivot: 0.7911
Supporting reasons: Identified as an overlap support that aligns with the 61.8% Fibonacci retracement, where renewed buying pressure could emerge to push the price higher.
1st support: 0.7859
Supporting reasons: Identified as an overlap support, indicating a potential level where the price could stabilize once again.
1st resistance: 0.8043
Supporting reasons: Identified as a swing high resistance, indicating a potential level that could cap further upward movement.
USD/JPY:
Potential Direction: Bullish
Overall momentum of the chart: Bullish
The price could see a short-term pullback toward the pivot before rising again toward the 1st resistance.
Pivot: 158.95
Supporting reasons: Identified as a pullback support, where renewed buying pressure could emerge to push the price higher.
1st support: 157.64
Supporting reasons: Identified as an overlap support, indicating a strong area where buyers might return, and the price could stabilize once again.
1st resistance: 160.46
Supporting reasons: Identified as an overlap resistance. This level represents the next key area where upward movement could be capped amid increased selling pressure
USD/CAD:
Potential Direction: Bullish
Overall momentum of the chart: Bullish
The price could see a short-term pullback toward the pivot before rising again toward the 1st resistance.
Pivot: 1.3842
Supporting reasons: Identified as an overlap support, where renewed buying pressure could emerge to push the price higher.
1st support: 1.3739
Supporting reasons: Identified as a pullback support, indicating a key level where the price could stabilize once more.
1st resistance: 1.3946
Supporting reasons: Identified as a swing high resistance, making it a possible target for bullish advances and a level where some sellers could return to cap gains
AUD/USD:
Potential Direction: Bearish
Overall momentum of the chart: Bullish
The price has already reacted off the pivot and may continue its bearish move toward the 1st support.
Pivot: 0.6954
Supporting reasons: Identified as an overlap resistance, where selling pressures could intensify and potentially cap any upward retracement.
1st support: 0.6843
Supporting reasons: Identified as a multi-swing low support, this area has provided strong support historically and may attract buying interest for a potential short-term bounce
1st resistance: 0.7013
Supporting reasons: Identified as an overlap resistance, indicating a potential area that could halt any further upward movement.
NZD/USD
Potential Direction: Bearish
Overall momentum of the chart: Bullish
The price has already reacted off the pivot and may continue its bearish move toward the 1st support.
Pivot: 0.5773
Supporting reasons: Identified as an overlap resistance, where selling pressures could intensify and potentially cap any upward retracement.
1st support: 0.5679
Supporting reasons: Identified as a swing low support, this area has provided strong support historically and may attract buying interest for a potential short-term bounce
1st resistance: 0.5813
Supporting reasons: Identified as a pullback resistance, indicating a potential area that could halt any further upward movement.
US30 (DJIA):
Potential Direction: Bullish
Overall momentum of the chart: Bullish
The price has already bounced off the pivot and may continue its bullish move toward the 1st resistance
Pivot: 46,173.04
Supporting reasons: Identified as a pullback support, where renewed buying pressure could emerge to push the price higher.
1st support: 45,175.49
Supporting reasons: Identified as a pullback support, suggesting a potential area where the price could stabilize once again.
1st resistance: 47,472.76
Supporting reasons: Identified as an overlap resistance, indicating a potential area that could halt any further upward movement.
DE40 (DAX):
Potential Direction: Bullish
Overall momentum of the chart: Bullish
The price has already bounced off the pivot and may continue its bullish move toward the 1st resistance
Pivot: 22,790.93
Supporting reasons: Identified as a pullback support, where renewed buying pressure could emerge to push the price higher.
1st support: 21,921.45
Supporting reasons: Identified as a swing low support, indicating a key level where the price could stabilize once more.
1st resistance: 23,914.00
Supporting reasons: Identified as a swing high resistance, indicating a potential area that could halt any further upward movement.
US500 (S&P 500):
Potential Direction: Bullish
Overall momentum of the chart: Bullish
The price could see a short-term pullback toward the pivot before rising again toward the 1st resistance.
Pivot: 6,431.35
Supporting reasons: Identified as a pullback support, where renewed buying pressure could emerge to push the price higher.
1st support: 6,332.96
Supporting reasons: Identified as a swing high support, indicating a potential level where the price could stabilize once again.
1st resistance: 6,609.88
Supporting reasons: Identified as an overlap resistance, indicating a potential area that could halt any further upward movement.
BTC/USD (Bitcoin):
Potential Direction: Bullish
Overall momentum of the chart: Bearish
The price could see a short-term pullback toward the pivot before rising again toward the 1st resistance.
Pivot: 67,331.99
Supporting reasons: Identified as a pullback support, where renewed buying pressure could emerge to push the price higher.
1st support: 65,245.68
Supporting reasons: Identified as a multi-swing low support, indicating a potential level where the price could stabilize once more.
1st resistance: 70,572.17
Supporting reasons: Identified as a pullback resistance, indicating a potential area that could halt any further upward movement.
ETH/USD (Ethereum):
Potential Direction: Bullish
Overall momentum of the chart: Bullish
The price could see a short-term pullback toward the pivot before rising again toward the 1st resistance.
Pivot: 2,068.80
Supporting reasons: Identified as a pullback support, where renewed buying pressure could emerge to push the price higher.
1st support: 1,984.38
Supporting reasons: Identified as an overlap support, indicating a potential level where the price could stabilize once more.
1st resistance: 2,214.38
Supporting reasons: Identified as a pullback resistance that aligns with the 61.8% Fibonacci retracement, indicating a potential area that could halt any further upward movement.
WTI/USD (Oil):
Potential Direction: Bullish
Overall momentum of the chart: Bullish
The price could see a short-term pullback toward the pivot before rising again toward the 1st resistance.
Pivot: 105.53
Supporting reasons: Identified as a pullback support, where renewed buying pressure could emerge to push the price higher.
1st support:100.34
Supporting reasons: Identified as a pullback support, indicating a key level where the price could stabilize once more.
1st resistance: 115.09
Supporting reasons: Identified as a swing high resistance, indicating a potential area that could halt any further upward movement.
XAU/USD (GOLD):
Potential Direction: Bullish
Overall momentum of the chart: Bullish
The price has already bounced off the pivot and may continue its bullish move toward the 1st resistance
Pivot: 4,600.95
Supporting reasons: Identified as an overlap support, where renewed buying pressure could emerge to push the price higher.
1st support: 4,471.58
Supporting reasons: Identified as a pullback support, indicating a key level where the price could stabilize once more.
1st resistance: 4,844.73
Supporting reasons: Identified as a pullback resistance that aligns with the 100% Fibonacci projection, indicating a potential area that could halt any further upward movement.
The accuracy, completeness and timeliness of the information contained on this site cannot be guaranteed. IC Markets Global does not warranty, guarantee or make any representations, or assume any liability regarding financial results based on the use of the information in the site.
News, views, opinions, recommendations and other information obtained from sources outside of www.icmarkets.com, used in this site are believed to be reliable, but we cannot guarantee their accuracy or completeness. All such information is subject to change at any time without notice. IC Markets Global assumes no responsibility for the content of any linked site.
The fact that such links may exist does not indicate approval or endorsement of any material contained on any linked site. IC Markets Global is not liable for any harm caused by the transmission, through accessing the services or information on this site, of a computer virus, or other computer code or programming device that might be used to access, delete, damage, disable, disrupt or otherwise impede in any manner, the operation of the site or of any user’s software, hardware, data or property.
The post Tuesday 7th April 2026: Technical Outlook and Review first appeared on IC Your Trading Edge | Official Blog.
General Market Analysis – 7/04/26
429301 April 7, 2026 15:40 ICMarkets Market News
Markets Cautious on Middle East Developments – S&P up 0.4%
US equity markets began the week on a cautiously positive note, with all three major indices closing higher as investors continued to assess the evolving situation in the Middle East. Hopes of a potential ceasefire provided some underlying support; however, recent commentary from both sides suggests the conflict is likely to persist, particularly with a US-imposed deadline fast approaching, keeping a degree of caution in play. The Dow rose 0.36% to close at 46,669, while the S&P 500 gained 0.44% to finish at 6,611. The Nasdaq outperformed slightly, climbing 0.54% to settle at 21,996, as risk sentiment held relatively steady despite the geopolitical backdrop. In currency markets, the US Dollar Index was largely unchanged on the session, slipping marginally by 0.04% to 99.99. Treasury markets also saw limited movement, with the 2-year yield edging up 0.8 basis points to 3.848%, while the 10-year yield eased 1.0 basis point to 4.331%, leaving the curve little changed overall. Commodity markets saw choppy price action, particularly in energy again. Brent crude rose 0.44% to $109.51 per barrel, while WTI gained 0.87% to $112.56. In contrast, gold prices drifted lower, falling 0.58% to $6,649.85 by the close.
Dollar to Dominate FX Moves on Middle East Updates
The US dollar has been trading in a tight but sensitive range, with price action increasingly dictated by headlines out of the Middle East rather than traditional macro drivers. Recent sessions show the dollar holding relatively steady as markets balance escalation risks against intermittent ceasefire hopes. Earlier in the conflict, the greenback pushed higher as investors moved into safe-haven assets amid rising geopolitical uncertainty and surging oil prices. However, those gains have been uneven, with periods of consolidation or pullback emerging whenever de-escalation rhetoric surfaces. At its core, the move remains a classic risk-off/risk-on dynamic:
• Escalation (military threats, supply disruptions, higher oil) → supports the USD via safe-haven demand and inflation-driven rate expectations
• Ceasefire or de-escalation signals → reduce risk aversion, prompting USD pullbacks as capital rotates back into risk assets
In short, the dollar bias remains to the upside while conflict risks persist, but the move is not one-directional. Any credible shift toward a ceasefire or resolution is likely to see the USD quickly retrace, reflecting how headline-driven and reactive current FX markets have become. A lot will depend on updates that the market receives in the coming sessions, with the propensity for big moves high.
Geopolitics to Dominate Sentiment Again Today
Looking ahead, market participants will remain highly sensitive to further developments out of the Middle East, which continue to act as the primary driver of sentiment. Asian markets are set to open on a cautious note today, with no data releases scheduled; all eyes will be on newswires as the day progresses, but the skew seems to be to the downside at the moment. The London session is also quiet on the calendar front; however, we do have the first of some big US data once New York opens, which will distract attention away from the Middle East, however briefly. Durable Goods Orders data (exp. -1.1% m/m) and Core Durable Goods (exp. +0.5%) are due out early in the session, while later in the day Canada’s Ivey PMI (exp. 55.9) numbers are due out. Again, traders are expecting the short-term impact to be minimal in the current conditions; however, further down the track they will have a bearing on market moves.
The post General Market Analysis – 7/04/26 first appeared on IC Your Trading Edge | Official Blog.
IC Markets Global – Asia Fundamental Forecast | 07 April 2026
429300 April 7, 2026 15:40 ICMarkets Market News
IC Markets Global – Asia Fundamental Forecast | 07 April 2026
What happened in the U.S. session?
U.S. markets overnight grappled with subdued macro releases like the NY Fed GSCPI and Treasury auctions amid dominant Iran war headlines, where Trump’s escalation threats drove oil (Brent >$111/bbl) sharply higher on supply fears, while stock futures edged mixed (S&P +0.1%) on flickering ceasefire hopes; the lingering strong March jobs beat (178k added, 4.3% unemployment) reinforced Fed pause expectations but heightened inflation risks from energy shocks.
What does it mean for the Asia Session?
Asian markets remain on edge for Trump-Iran developments that could spike oil further, disrupt Gulf shipping, and trigger retaliatory volatility, compounded by RBNZ’s policy meeting, light liquidity, and ongoing BOJ watch favor tight risk management on breakouts in JPY, CNH, and commodities..
The Dollar Index (DXY)
Key news events today
Core Durable Goods Orders m/m (12:30 pm GMT)
Durable Goods Orders m/m (12:30 pm GMT)
What can we expect from DXY today?
The US dollar experienced mixed pressures, amid ongoing geopolitical tensions in the Middle East, particularly the Iran conflict and Hormuz Strait disruptions, which have kept oil prices elevated above $110 per barrel and supported safe-haven demand for USD.
Central Bank Notes:
- The Federal Open Market Committee (FOMC) is widely expected to hold the federal funds rate target range steady at 3.50%–3.75% at its March 17–18, 2026, meeting, amid rising oil prices from the US-Israel war against Iran and persistent inflation pressures, delaying any 2026 cuts potentially to September.
- The Committee continues to pursue maximum employment and 2% inflation goals, with the labor market weakening further as nonfarm payrolls declined by 92,000 in February 2026 and the unemployment rate rose to 4.4% from 4.3% in January.
- Officials face tilted risks from geopolitical tensions, elevated oil prices, and sticky inflation, with CPI steady at 2.4% year-over-year in February 2026, headline PCE at 2.8% in January, and core PCE rising to 3.1%.
- Economic activity has cooled after robust Q4 2025 growth near 5%, with the Atlanta Fed GDPNow now estimating Q1 2026 growth at around 2.1%–2.7% amid softer consumer spending and labor data.
- December 2025’s Summary of Economic Projections forecasts 2025 unemployment at a median of 4.5%, 2026 GDP growth at 2.3%, and core PCE at 2.5%, with the dot plot signaling one more cut in 2026 to a median 3.4% funds rate; March updates may reflect softer labor and inflation upticks.
- The Committee maintains its data-dependent stance amid a softening labor market, inflation above target, and new oil shocks, likely holding rates at 3.50%-3.75% with ongoing divisions and possible hawkish dissents on rate cuts.
- The FOMC continues its adjusted quantitative tightening, with Treasury rolloff caps at $5 billion per month and agency MBS at $35 billion per month to ensure ample reserves post-2025 program adjustments.
- The next meeting is scheduled for 28 to 29 April 2026.
Next 24 Hours Bias
Medium Bearish
Gold (XAU)
Key news events today
Core Durable Goods Orders m/m (12:30 pm GMT)
Durable Goods Orders m/m (12:30 pm GMT)
What can we expect from Gold today?
Gold’s resilience stems from a rare alignment of seven bullish factors—war risks, supply threats, policy shifts, and safe-haven buying keeping prices near peaks despite minor pullbacks. Expect volatility around today’s geopolitical deadlines, with upside risks dominant.
Next 24 Hours Bias
Medium Bullish
The Australian Dollar (AUD)
Key news events today
No major news event
What can we expect from AUD today?
The Australian dollar is trading near 0.691–0.692 against the US dollar, recovering modestly from recent multi‑week lows but still well below its early‑2026 highs around 0.71. The AUD is supported by a still‑hawkish‑leaning Reserve Bank of Australia and expectations of further rate hikes later this year, but weighed down by renewed Middle‑East tensions, risk‑off sentiment.
Central Bank Notes:
- The Reserve Bank of Australia (RBA) is expected to hold its cash rate at 3.85% at the March 16-17, 2026 policy meeting, following the widely anticipated 25 basis point hike to 3.85% in early February after persistent inflation pressures from late 2025. While some banks like CBA, NAB, and Westpac now forecast a further 25 basis point rise to 4.10% as soon as May if inflation data remains sticky, consensus tilts toward a pause in March to assess incoming monthly CPI and labor market signals. The February hike reversed prior cuts, entering mildly restrictive territory amid capacity pressures, with the board emphasizing data dependence.
- Inflation remains elevated, with December 2025 CPI at 3.8% year-on-year and trimmed mean at 3.3%, above the 2–3% target midpoint. RBA’s February Statement revised forecasts higher, projecting trimmed-mean inflation to peak in mid-2026 above 3% and remain elevated through early 2027, driven by services, housing, and demand resilience despite some monthly cooling, such as January’s 0.2% MoM gauge. Monthly CPI data continues to highlight core stickiness beyond energy rebates, delaying the target return to late 2027 or beyond.
- January 2026 monthly indicators showed modest easing, but headline CPI risks upward surprises from housing (up recently) and services amid firm domestic demand. Trimmed mean pressures persist from wage growth and capacity constraints, with consumer expectations ticking to 5% YoY in February surveys. Enhanced monthly reporting sharpens vigilance on potential broad-based pick-up.
- The labor market shows softening, with unemployment around 4.1-4.4%, down slightly to 4.1% in December, but unit labor costs are elevated due to subdued productivity. Household spending faces higher borrowing costs post-hike, yet private demand recovery sustains capacity strains. Vulnerabilities persist amid resilient employment dynamics.
- Global growth modestly revised up but tempered by geopolitics and commodity volatility; policy now restrictive post-February, with the RBA balancing inflation against employment risks. Data from the monthly CPI and Q1 GDP will guide, amid household debt sensitivities.
- Sustained restrictive stance post-February anchors inflation return to target, upholding dual mandate with flexibility to new risks like further inflation upticks.
- Markets price a March hold at 3.85%, with big four banks split: CBA, NAB, Westpac eye May hike to 4.10% if persistence continues, while others see limited upside unless acceleration. Upcoming monthly CPI pivotal for Q2 trajectory.
- Policy vigilance counters inflation stickiness against household fragilities and global uncertainties, reaffirming adaptability under dual mandate.
- Base case favors March hold with risks tilted hawkish for further hikes if data is hot; monthly indicators key to 2026 path.
- The next meeting is on 5 to 6 May 2026.
Next 24 Hours Bias
Weak Bullish
The Kiwi Dollar (NZD)
Key news events today
No major news event
What can we expect from NZD today?
The New Zealand Dollar (NZD) has seen limited specific updates for April 7, 2026, based on available recent market data, but it continues to trade in a range influenced by broader trends like RBNZ policy expectations and global risk sentiment. As of late March 2026, NZD/USD hovered around 0.5711, reflecting a monthly decline of about 3.88% amid softening domestic growth and geopolitical pressures.
Central Bank Notes:
- The Reserve Bank of New Zealand’s (RBNZ) Monetary Policy Committee (MPC) is widely expected to hold the Official Cash Rate (OCR) steady at 2.25% at its 8 April 2026 Monetary Policy Review, aligning with unanimous market consensus from Reuters polls and previews.
- The MPC continues its data-dependent “wait-and-see” approach after February’s pause, balancing stimulus from prior 325 basis point cuts against inflation’s path back to the 2% target, with readiness for gradual normalization only if recovery strengthens or inflation exceeds forecasts.
- Headline CPI, last at 3.1%, is on track to re-enter the 1-3% band in Q2 2026 and hit 2% by mid-2027, aided by spare capacity, moderating wages, and softer food/fuel prices; two-year business inflation expectations have ticked up slightly to 2.37%.
- Household spending and housing remain subdued amid cautious consumption, low net migration, and labor market softness, though easing retail rates support budgets; high-frequency GDP indicators show steadying momentum in an early recovery phase.
- Accommodative borrowing costs from the low OCR are boosting mortgage approvals and sentiment, but business credit growth lags due to uneven confidence; overall stimulus persists below the 3% neutral rate.
- Risks are balanced, with a favorable global environment—including stronger dairy/meat exports and a softer NZ dollar—offsetting oil shocks and prior China/US trade worries; vigilance remains on second-round inflation effects.
- Forecasts point to potential OCR hikes starting late 2026 (e.g., December) or early 2027 to 2.50% by year-end if activity/inflation firms, but policy stays supportive if recovery unfolds gradually as expected.
- The next meeting is on 27 May 2026.
Next 24 Hours Bias
Medium Bearish
The Japanese Yen (JPY)
Key news events today
No major news event
What can we expect from JPY today?
The Japanese Yen held relatively steady against the US Dollar at around 159.6-160, buoyed by fresh intervention threats from Tokyo officials amid Middle East-driven oil price spikes that exacerbate Japan’s import vulnerabilities. While BoJ hawkishness and market positioning limit sharp declines, lingering geopolitical risks and dollar strength keep USD/JPY elevated near recent highs.
Central Bank Notes:
- The Policy Board of the Bank of Japan meets on 18–19 April 2026, with markets anticipating the short-term policy rate to remain at 0.75%, as the bank continues evaluating the December 2025 and prior hikes’ effects amid data-dependent normalization.
- The BOJ will target the uncollateralized overnight call rate around 0.75% and indicate future hikes hinge on impacts to lending, financing, and activity, with Governor Ueda signaling scrutiny of data for potential moves in April or later meetings.
- JGB tapering advances per plan, cutting outright purchases by ¥400 billion quarterly through Q1 2026 and slowing to ¥200 billion from April onward, targeting roughly ¥2-3 trillion monthly by mid-2026, adjustable for market stability
- Japan’s economy maintains moderate growth into Q1 2026, building on Q4 2025 rebound via exports and fiscal measures, though manufacturing sentiment holds soft amid overseas demand weakness and yen pressures.
- Core CPI (ex-fresh food) likely stays near 2.3-2.5% y/y in early 2026 Tokyo prints, off prior highs but above 2%, while core-core hovers around 2.6%, reflecting sustained but easing inflationary forces.
- Input costs ease further from import peaks, yet services inflation, 5% wage targets in shunto talks, and anchored expectations above 2% support price persistence, with upside risks from yen and geopolitics.
- Near-term real GDP may ease below trend due to tightening and external shocks like Iran tensions, but negative real rates, wage gains, and stimulus should underpin consumption and capex rebound.
- Medium-term, overseas recovery, labor shortages, and productivity lifts are set to fuel wages and core inflation near/above 2%, enabling gradual hikes toward 1% if conditions align.
- The next meeting is on 27 to 28 April 2026.
Next 24 Hours Bias
Medium Bearish
Oil
Key news events today
API Crude Oil Stock (8:30 pm GMT)
What can we expect from Oil today?
Oil markets on Tuesday, remain volatile amid ongoing Middle East tensions, with crude prices showing signs of easing from recent peaks but still elevated due to supply disruptions and geopolitical risks. Brent crude has begun correcting overbought conditions after declining slightly, trading above key moving averages like EMA50 while supported by an ascending short-term trendline.
Next 24 Hours Bias
Strong Bullish
The post IC Markets Global – Asia Fundamental Forecast | 07 April 2026 first appeared on IC Your Trading Edge | Official Blog.
IC Markets Global – Asia Fundamental Forecast | 25 March 2026
429296 April 7, 2026 15:00 ICMarkets Market News
IC Markets Global – Asia Fundamental Forecast | 25 March 2026
What happened in the U.S. session?
U.S. import/export prices ticked higher modestly while the current account deficit narrowed, offering some relief on inflation but highlighting persistent trade frictions amid tariff reversals and global tensions; this spurred a weaker dollar, gold rally, and yield softening, with equities mixed and oil choppy as the primary movers.
What does it mean for the Asia Session?
US-Iran developments for volatility in oil, equities, and FX, as Trump’s de-escalation comments fuel regional rebounds but skepticism persists amid fragile peace hopes; oil’s plunge eases inflation fears, supporting risk assets like Kospi and Nikkei, while gold and USD dynamics hinge on sustained dollar strength.
The Dollar Index (DXY)
Key news events today
President Trump Speaks (11:20 pm GMT)
What can we expect from DXY today?
The US Dollar edged higher to near 99.40 on the DXY, supported by safe-haven flows from the protracted Iran conflict—marked by denied talks, potential Gulf allies’ involvement, and persistent oil-driven inflation pressures—despite trader doubts on de-escalation and no imminent Fed easing.
Central Bank Notes:
- The Federal Open Market Committee (FOMC) is widely expected to hold the federal funds rate target range steady at 3.50%–3.75% at its March 17–18, 2026, meeting, amid rising oil prices from the US-Israel war against Iran and persistent inflation pressures, delaying any 2026 cuts potentially to September.
- The Committee continues to pursue maximum employment and 2% inflation goals, with the labor market weakening further as nonfarm payrolls declined by 92,000 in February 2026 and the unemployment rate rose to 4.4% from 4.3% in January.
- Officials face tilted risks from geopolitical tensions, elevated oil prices, and sticky inflation, with CPI steady at 2.4% year-over-year in February 2026, headline PCE at 2.8% in January, and core PCE rising to 3.1%.
- Economic activity has cooled after robust Q4 2025 growth near 5%, with the Atlanta Fed GDPNow now estimating Q1 2026 growth at around 2.1%–2.7% amid softer consumer spending and labor data.
- December 2025’s Summary of Economic Projections forecasts 2025 unemployment at a median of 4.5%, 2026 GDP growth at 2.3%, and core PCE at 2.5%, with the dot plot signaling one more cut in 2026 to a median 3.4% funds rate; March updates may reflect softer labor and inflation upticks.
- The Committee maintains its data-dependent stance amid a softening labor market, inflation above target, and new oil shocks, likely holding rates at 3.50%-3.75% with ongoing divisions and possible hawkish dissents on rate cuts.
- The FOMC continues its adjusted quantitative tightening, with Treasury rolloff caps at $5 billion per month and agency MBS at $35 billion per month to ensure ample reserves post-2025 program adjustments.
- The next meeting is scheduled for 28 to 29 April 2026.
Next 24 Hours Bias
Weak Bullish
Gold (XAU)
Key news events today
President Trump Speaks (11:20 pm GMT)
What can we expect from Gold today?
Gold prices showed modest gains today, Wednesday, March 25, 2026, amid ongoing market consolidation and safe-haven demand pressures. Spot gold rose to around $4,594.79 per troy ounce, up 2.72% from the prior session, though it remains down over 11% in the past month after peaking near $5,600 earlier this year.
Next 24 Hours Bias
Weak Bullish
The Australian Dollar (AUD)
Key news events today
CPI m/m (12:30 am GMT)
CPI y/y (12:30 am GMT)
Trimmed Mean CPI m/m (12:30 am GMT)
What can we expect from AUD today?
The Australian dollar is trading cautiously today,, as markets await the release of Australia’s February CPI inflation data, which is due later in the day and is a key input for the RBA’s next policy decision. Recent headlines show AUD/USD drifting around the 0.696–0.700 zone, down slightly on the day after a broader pull‑back from intramonth highs near 0.718 in early March
Central Bank Notes:
- The Reserve Bank of Australia (RBA) is expected to hold its cash rate at 3.85% at the March 16-17, 2026 policy meeting, following the widely anticipated 25 basis point hike to 3.85% in early February after persistent inflation pressures from late 2025. While some banks like CBA, NAB, and Westpac now forecast a further 25 basis point rise to 4.10% as soon as May if inflation data remains sticky, consensus tilts toward a pause in March to assess incoming monthly CPI and labor market signals. The February hike reversed prior cuts, entering mildly restrictive territory amid capacity pressures, with the board emphasizing data dependence.
- Inflation remains elevated, with December 2025 CPI at 3.8% year-on-year and trimmed mean at 3.3%, above the 2–3% target midpoint. RBA’s February Statement revised forecasts higher, projecting trimmed-mean inflation to peak in mid-2026 above 3% and remain elevated through early 2027, driven by services, housing, and demand resilience despite some monthly cooling, such as January’s 0.2% MoM gauge. Monthly CPI data continues to highlight core stickiness beyond energy rebates, delaying the target return to late 2027 or beyond.
- January 2026 monthly indicators showed modest easing, but headline CPI risks upward surprises from housing (up recently) and services amid firm domestic demand. Trimmed mean pressures persist from wage growth and capacity constraints, with consumer expectations ticking to 5% YoY in February surveys. Enhanced monthly reporting sharpens vigilance on potential broad-based pick-up.
- The labor market shows softening, with unemployment around 4.1-4.4%, down slightly to 4.1% in December, but unit labor costs are elevated due to subdued productivity. Household spending faces higher borrowing costs post-hike, yet private demand recovery sustains capacity strains. Vulnerabilities persist amid resilient employment dynamics.
- Global growth modestly revised up but tempered by geopolitics and commodity volatility; policy now restrictive post-February, with the RBA balancing inflation against employment risks. Data from the monthly CPI and Q1 GDP will guide, amid household debt sensitivities.
- Sustained restrictive stance post-February anchors inflation return to target, upholding dual mandate with flexibility to new risks like further inflation upticks.
- Markets price a March hold at 3.85%, with big four banks split: CBA, NAB, Westpac eye May hike to 4.10% if persistence continues, while others see limited upside unless acceleration. Upcoming monthly CPI pivotal for Q2 trajectory.
- Policy vigilance counters inflation stickiness against household fragilities and global uncertainties, reaffirming adaptability under dual mandate.
- Base case favors March hold with risks tilted hawkish for further hikes if data is hot; monthly indicators key to 2026 path.
- The next meeting is on 5 to 6 May 2026.
Next 24 Hours Bias
Medium Bullish
The Kiwi Dollar (NZD)
Key news events today
No major news event
What can we expect from NZD today?
The New Zealand Dollar has traded in a volatile range of approximately 0.582-0.594 against the USD through mid-to-late March 2026, undermined by Middle East conflicts fueling oil-driven inflation fears and risk-off sentiment, yet showing resilience post-disappointing Q4 GDP data on March 18 due to USD pullbacks and RBNZ policy stability expectations.
Central Bank Notes:
- The Monetary Policy Committee (MPC) left the Official Cash Rate (OCR) unchanged at 2.25% at its 18 February 2026 meeting, as widely expected, maintaining a unanimous decision and emphasizing a balance between supporting the nascent economic recovery and ensuring inflation returns sustainably to the 2% midpoint of the 1–3% target band.
- The Committee judged that the prior cumulative easing of 325 basis points provides ongoing stimulus, warranting patience amid uneven recovery signals, while noting readiness to normalize policy gradually as inflation pressures subside and activity strengthens.
- Headline CPI inflation, recently at 3.1%, is projected to dip back within the target band in the coming quarter—supported by spare capacity, modest wage growth, and declining food/fuel prices—before reaching 2.0% by mid-2027, with two-year-ahead business expectations edging up to 2.37%.
- Domestic demand shows gradual stabilization with softer household spending and a muted housing market, partially offset by easing retail rates boosting budgets, though cautious consumption, low migration, and a weak labour market continue to cap services inflation as wage moderation takes hold.
- Financial conditions remain accommodative as lower OCR flows through to borrowing costs, aiding mortgage approvals and housing sentiment, but business credit growth stays subdued amid uneven confidence and sensitivity to the recovery’s pace.
- Recent indicators point to weak but steadying GDP momentum in an early-stage rebound from 2025 lows, with high-frequency data showing gradual broadening despite persistent headwinds from elevated costs, fragile sentiment, and subdued investment.
- External risks are now viewed as balanced rather than downside-skewed, with a supportive global backdrop offsetting prior concerns over China and US trade policy, while a lower NZ dollar aids exports and tradables inflation.
- Looking to mid-2026, the MPC adopted a data-dependent stance with forecasts signaling OCR hikes likely from late 2026 or early 2027—potentially as soon as December if activity or inflation exceeds projections—while keeping policy accommodative for now if the gradual recovery aligns with expectations.
- The next meeting is on 7 April 2026.
Next 24 Hours Bias
Weak Bearish
The Japanese Yen (JPY)
Key news events today
No major news event
What can we expect from JPY today?
The USD/JPY pair hovered near 158.69-159.09, reflecting a slight daily dip but continued monthly weakening of the Yen, driven by steady BOJ policy, oil recovery pressuring imports, and technical patterns forecasting a near-term correction lower unless resistance at 160.45 breaks. Over the past 12 months, the Yen has declined 6.13%, with expectations for it to reach 154.01 in a year.
Central Bank Notes:
- The Policy Board of the Bank of Japan meets on 18–19 April 2026, with markets anticipating the short-term policy rate to remain at 0.75%, as the bank continues evaluating the December 2025 and prior hikes’ effects amid data-dependent normalization.
- The BOJ will target the uncollateralized overnight call rate around 0.75% and indicate future hikes hinge on impacts to lending, financing, and activity, with Governor Ueda signaling scrutiny of data for potential moves in April or later meetings.
- JGB tapering advances per plan, cutting outright purchases by ¥400 billion quarterly through Q1 2026 and slowing to ¥200 billion from April onward, targeting roughly ¥2-3 trillion monthly by mid-2026, adjustable for market stability
- Japan’s economy maintains moderate growth into Q1 2026, building on Q4 2025 rebound via exports and fiscal measures, though manufacturing sentiment holds soft amid overseas demand weakness and yen pressures.
- Core CPI (ex-fresh food) likely stays near 2.3-2.5% y/y in early 2026 Tokyo prints, off prior highs but above 2%, while core-core hovers around 2.6%, reflecting sustained but easing inflationary forces.
- Input costs ease further from import peaks, yet services inflation, 5% wage targets in shunto talks, and anchored expectations above 2% support price persistence, with upside risks from yen and geopolitics.
- Near-term real GDP may ease below trend due to tightening and external shocks like Iran tensions, but negative real rates, wage gains, and stimulus should underpin consumption and capex rebound.
- Medium-term, overseas recovery, labor shortages, and productivity lifts are set to fuel wages and core inflation near/above 2%, enabling gradual hikes toward 1% if conditions align.
- The next meeting is on 27 to 28 April 2026.
Next 24 Hours Bias
Medium Bearish
Oil
Key news events today
EIA Crude Oil Inventories ( 2:30 pm GMT)
What can we expect from Oil today?
Oil prices remain elevated today, amid escalating Middle East tensions, particularly the US/Israel-Iran conflict, disrupting supplies and driving a geopolitical risk premium of about $20 per barrel. Brent crude recently surged past $103 per barrel on March 24, up over 3%, while WTI followed suit, with earlier sessions holding steady above $107 as markets brace for potential Hormuz Strait issues following President Trump’s 48-hour ultimatum to Iran.
Next 24 Hours Bias
Strong Bullish
The post IC Markets Global – Asia Fundamental Forecast | 25 March 2026 first appeared on IC Your Trading Edge | Official Blog.
IC Markets Global – Europe Fundamental Forecast | 25 March 2026
429295 April 7, 2026 15:00 ICMarkets Market News
IC Markets Global – Europe Fundamental Forecast | 25 March 2026
What happened in the Asia session?
China’s medium-term lending facility (MLF) operation stands out as a key event for gauging liquidity and interest rate signals amid ongoing regional tensions. Broader headlines were dominated by lingering effects of the Middle East conflict, including President Trump’s prior threats over the Strait of Hormuz and Iran’s denial of de-escalation talks, which continued to fuel oil price volatility and inflation fears, alongside a cautious rebound in equities tracking Wall Street’s mixed close.
What does it mean for the Europe & US sessions?
Oil prices are dropping over 5% amid uncertainty over U.S.-Iran talks and President Trump’s signals on negotiations, despite Tehran’s denials, alongside a Moody’s downgrade of a KKR private credit fund to junk status, signalling distress in that sector. Barclays has raised its 2026 S&P 500 year-end target to 7,650, citing robust tech earnings and economic resilience outweighing Middle East tensions, AI disruptions, and private credit stress, while the prior day’s S&P 500 surge was fueled by Nvidia and Tesla gains on softer tariff expectations from the Trump administration.
The Dollar Index (DXY)
Key news events today
President Trump Speaks (11:20 pm GMT)
What can we expect from DXY today?
The US Dollar showed resilience today amid ongoing Middle East tensions, particularly the Iran conflict, which continues to bolster its safe-haven appeal while pushing oil prices higher around $108 per barrel. Trading in tight ranges, the Dollar Index (DXY) hovered near 99.65-99.90, supported by firm US yields and limited Federal Reserve rate-cut expectations (just one projected for late 2026).
Central Bank Notes:
- The Federal Open Market Committee (FOMC) is widely expected to hold the federal funds rate target range steady at 3.50%–3.75% at its March 17–18, 2026, meeting, amid rising oil prices from the US-Israel war against Iran and persistent inflation pressures, delaying any 2026 cuts potentially to September.
- The Committee continues to pursue maximum employment and 2% inflation goals, with the labor market weakening further as nonfarm payrolls declined by 92,000 in February 2026 and the unemployment rate rose to 4.4% from 4.3% in January.
- Officials face tilted risks from geopolitical tensions, elevated oil prices, and sticky inflation, with CPI steady at 2.4% year-over-year in February 2026, headline PCE at 2.8% in January, and core PCE rising to 3.1%.
- Economic activity has cooled after robust Q4 2025 growth of nearly 5%, with the Atlanta Fed GDPNow now estimating Q1 2026 growth at around 2.1%–2.7% amid softer consumer spending and labour data.
- December 2025’s Summary of Economic Projections forecasts 2025 unemployment at a median of 4.5%, 2026 GDP growth at 2.3%, and core PCE at 2.5%, with the dot plot signalling one more cut in 2026 to a median 3.4% funds rate; March updates may reflect softer labor and inflation upticks.
- The Committee maintains its data-dependent stance amid a softening labor market, inflation above target, and new oil shocks, likely holding rates at 3.50%-3.75% with ongoing divisions and possible hawkish dissents on rate cuts.
- The FOMC continues its adjusted quantitative tightening, with Treasury rolloff caps at $5 billion per month and agency MBS at $35 billion per month to ensure ample reserves post-2025 program adjustments.
- The next meeting is scheduled for 28 to 29 April 2026.
Next 24 Hours Bias
WeakBullish
Gold (XAU)
Key news events today
President Trump Speaks (11:20 pm GMT)
What can we expect from Gold today?
Gold prices are experiencing significant downward pressure today, amid a stronger US dollar, rising bond yields, and ongoing geopolitical tensions in the Middle East, including US-Iran conflicts that have already triggered sharp corrections. Spot gold is trading around $4,470 per ounce, down about 0.4% on the day after a recent free-fall that erased over 20% from its January peak of $5,594, with the metal now stalling near $4,400 as war risks balance safe-haven demand against profit-taking.
Next 24 Hours Bias
Medium Bearish
The Euro (EUR)
Key news events today
CB President Lagarde Speaks (8:45 am GMT)
What can we expect from EUR today?
The Euro remains on the defensive today amid geopolitical risks from Iran driving oil higher and dampening eurozone confidence, with EUR/USD testing supports near 1.1578 as traders eye US jobs data; political developments like the EU-US trade deal vote offer some long-term optimism, but near-term bias stays bearish without stronger ECB signals or regional stabilization.
Central Bank Notes:
- The Governing Council of the ECB is widely expected to keep the three key interest rates unchanged at its 18–19 March 2026 meeting, holding the main refinancing rate at 2.15%, the marginal lending facility at 2.40%, and the deposit facility at 2.00%. This stance continues to support medium-term price stability, with inflation stabilizing near the 2% target amid resilient growth and balanced risks. Market odds show a 99% probability of no change, reflecting caution over global trade uncertainties and US policy under President Trump.
- Price dynamics remain stable close to the 2% target. Headline HICP inflation eased to around 1.7% in January 2026, with base effects and a strong euro supporting further moderation toward 1.9% for the year. Core and services inflation continue to moderate, bolstered by anchored expectations despite some sticky components.
- Updated Eurosystem staff projections for March 2026 are expected to show headline inflation at 1.9% in 2026, 1.8% in 2027, and stabilizing at 2% by 2028, with balanced risks from trade tensions offset by fiscal support. Recent data revisions have slightly raised prior forecasts, but a stronger euro imports deflationary pressures.
- Euro area GDP growth remains resilient, with Q1 2026 surveys pointing to a 0.3-0.4% qoq expansion, aligning with annual forecasts of 1.2-1.4% through 2027. Public investment in defence and infrastructure, alongside low unemployment, underpins activity despite softer consumption and trade headwinds.
- The labour market stays robust, with unemployment holding near 6.4% at historic lows into early 2026, supported by rising participation and real wage growth. Credit conditions remain supportive for household spending and business investment.
- Business sentiment reflects caution from US tariffs and geopolitical risks, tempered by easing supply chains, a weaker euro aiding exports, and fiscal measures boosting domestic investment.
- The Governing Council will continue its data-dependent, meeting-by-meeting approach, closely monitoring inflation trends, transmission, and external uncertainties without signalling a preset path.
- Balance sheet normalization proceeds steadily, with APP and PEPP reinvestments ended and portfolios reducing at a controlled pace, showing no liquidity strains.
The next meeting is on 30 to 31 March 2026
Next 24 Hours Bias
Weak Bearish
The Swiss Franc (CHF)
Key news events today
No major news event
What can we expect from CHF today?
The Swiss Franc held firm near recent highs, with USD/CHF at approximately 0.7874 amid safe-haven flows from global risks, as the SNB reiterated its 0% rate stance and intervention readiness to mitigate deflationary pressures from the currency’s strength; Swiss firms expect modest further appreciation against a weakening euro, though low inflation at 0.1% and uncertain growth temper aggressive moves.
Central Bank Notes:
- At its monetary policy assessment on 19 March 2026, the Swiss National Bank (SNB) is widely expected to leave the policy rate unchanged at 0%, continuing the extended pause since September 2025, as the Governing Board assesses current settings as adequate to maintain inflation near the target without resorting to negative rates.
- Inflation data since December indicate persistent weakness, with headline CPI hovering around 0% year-on-year through early 2026 and core measures subdued at roughly 0.4%, underscoring limited price pressures and lingering, though contained, deflation risks.
- The SNB’s updated conditional inflation forecast shows minimal change from December, with averages of about 0.2% in 2025 (now complete), 0.3% in 2026, and 0.6% in 2027 under a steady 0% policy rate. However, recent flat CPI readings may slightly lower near-term expectations, preserving scope for further easing if needed.
- Global conditions remain challenging, marked by U.S. tariff escalations under President Trump, subdued external demand, and uncertainties in major export markets such as Europe and the U.S., prompting the SNB to exercise caution despite resilient Swiss domestic activity.
- Sentiment in manufacturing and export sectors stays soft amid franc appreciation and weaker foreign orders, squeezing margins. Yet, overall GDP growth is expected to be around 1.5% in 2026, with unemployment edging up modestly from historic lows.
- The SNB reaffirms its readiness to intervene via rate cuts or FX operations should deflationary pressures intensify, while emphasizing clear communication through detailed meeting minutes and coordination with global partners on currency matters.
The next meeting is on 18 June 2026.
Next 24 Hours Bias
Medium Bearish
The Pound (GBP)
Key news events today
CPI y/y (7:00 am GMT)
What can we expect from GBP today?
The Pound Sterling edged higher to about $1.3426 versus the USD, buoyed by de-escalation in US-Iran tensions that curbed dollar strength and oil price surges, though persistent 3% UK inflation, Middle East risks, and BoE caution temper the upside amid a sideways-to-higher trading range. Weekly, GBP remains up around 1.2% despite Tuesday’s dip, with markets eyeing US NFP data and potential BoE rate cut bets..
Central Bank Notes:
- The Bank of England’s Monetary Policy Committee (MPC) met on 19 March 2026, maintaining the Bank Rate at 3.75 per cent in a unanimous decision, following the prior narrow 5–4 vote to hold at the 5 February 2026 meeting. This pause reflects a sharp reversal from earlier market expectations of a 25-basis-point cut, driven by a Middle East conflict sparking global energy and commodity price surges. The March meeting did not include a Monetary Policy Report, with the next one due in April.
- Quantitative tightening (QT) proceeds unchanged at the 2025 pace of gilt holdings reductions, maintaining gradual balance-sheet normalization attuned to liquidity conditions and supportive of a restrictive stance amid new shocks.
- Headline CPI inflation faces near-term upside from the energy shock, reversing prior disinflation trends in domestic prices and wages; pre-shock services inflation had eased but now contends with higher utility and input costs, keeping pressures above the 2 per cent target. MPC projections will update in April, but analysts see inflation at 3-4 per cent by the end of 2026.
- UK growth softens further into Q2 2026, with unemployment risks rising amid potential confidence drops, higher precautionary saving, and widening output gaps; regular pay growth had cooled pre-shock but now faces business cost pass-through.
- Global headwinds intensify via Middle East conflict, driving volatile energy/commodity prices and sterling/gilt swings; MPC deems direct shocks manageable if demand weakens sufficiently to limit second-round effects.
- Inflation risks now tilt upside from energy persistence and potential wage/cost embedding, offset by downside from demand slack and job losses; prior balance has shifted amid uncertainty on shock duration.
- The MPC adopts a wait-and-see posture post-shock, with policy deemed somewhat restrictive pre-event; all members are ready to act data-dependently for 2 per cent sustainability, eyeing April for fuller impact analysis and possible easing if disinflation resumes. Governor Bailey’s guidance stresses close monitoring without firm-cut commitments.
- The next meeting is on 30 April 2026.
Next 24 Hours Bias
Medium Bearish
The Canadian Dollar (CAD)
Key news events today
No major news event
What can we expect from GBP today?
The Canadian Dollar weakened against the USD, with USD/CAD trading near recent highs (1.37+ range), driven by declining oil prices as Middle East tensions eased and ongoing U.S.-Canada trade risks, including tariff threats, weighed on sentiment despite constructive bank outlooks for a gradual CAD recovery later in the year amid stabilizing commodities and policy caution.
Central Bank Notes:
- The Governing Council left the overnight rate target unchanged at 2.25% at its 28 January 2026 meeting, consistent with market expectations and reinforcing the pause in easing after the December hold. The Bank highlighted ongoing global trade uncertainties, including U.S. policy risks, but noted a steadier external environment with no immediate need for policy shifts amid fragile world demand.
- Uncertainty from U.S. tariffs continues to cloud business confidence, yet Canadian manufacturing PMI and export orders have stabilized further, with backlogs modestly increasing despite restrained investment. Recent data indicate that goods exports, particularly energy, have provided ongoing support, though firms remain selective in their expansion plans.
- Canada’s economy maintained momentum into late 2025 and early 2026, with Q4 GDP estimates around 2.0-2.5% annualized following Q3’s 2.6% rebound, driven by crude oil exports, public spending, and a partial service-sector recovery. January flash indicators suggest a balanced start to Q1, though weather disruptions slightly tempered output gains.
- Services activity strengthened, with PMI remaining above 50 and gains spreading to tech, tourism, and professional sectors; however, consumer services remained uneven due to persistent high prices, which curbed non-essential spending despite wage growth. The Bank views this broadening as a sign of structural adjustment progressing.
- Housing markets edged firmer nationally, with resales and prices up modestly in December-January on lower rates and steady demand, though major cities face renewed pressures tempered by strict lending rules and affordability hurdles. The Bank expects this stabilization to persist without overheating.
- CPI inflation held near 2.2% year-over-year in December 2025 and into January 2026 estimates, within the 1-3% band, while core metrics like CPI-median and trim eased toward 2.8%, signalling waning underlying pressures despite shelter and energy volatility. This supports the Bank’s confidence in target convergence.
- Officials reaffirmed the 2.25% rate as appropriate for sustaining 2% inflation and economic adjustment, with no near-term cuts anticipated absent growth or inflation shocks. Focus shifts to Q1 data durability, core trend sustainability, and trade policy clarity.
- The next meeting is on 25 March 2026.
Next 24 Hours Bias
Medium Bullish
Oil
Key news events today
API Crude Oil Stock (every Tuesday 8:30 pm GMT)
What can we expect from Oil today?
Oil prices experienced a sharp decline today, amid growing hopes for a ceasefire in the ongoing Iran conflict that’s been disrupting Middle East supplies. Brent crude fell around 6% to $98.28 per barrel, while WTI dropped over 5% to about $87.68, retreating from recent highs above $100 driven by Strait of Hormuz tensions.
Next 24 Hours Bias
Strong Bullish
The post IC Markets Global – Europe Fundamental Forecast | 25 March 2026 first appeared on IC Your Trading Edge | Official Blog.
Wednesday 25th March 2026: Technical Outlook and Review
429275 April 7, 2026 14:40 ICMarkets Market News
DXY (U.S. Dollar Index):
Potential Direction: Bearish
Overall momentum of the chart: Bearish
The price has already reacted off the pivot and may continue its bearish move toward the 1st support.
Pivot: 99.51
Supporting reasons: Identified as a pullback resistance, where selling pressures could intensify and potentially cap any upward retracement.
1st support: 98.69
Supporting reasons: Identified as a swing low support that aligns with the 127.2% Fibonacci extension, indicating a potential area where the price could again stabilize.
1st resistance: 100.50
Supporting reasons: Identified as a swing high resistance, indicating a potential area that could halt any further upward movement
EUR/USD:
Potential Direction: Bullish
Overall momentum of the chart: Bullish
The price could see a short-term pullback toward the pivot before rising again toward the 1st resistance.
Pivot: 1.1545
Supporting reasons: Identified as a pullback support, where renewed buying pressure could emerge to push the price higher.
1st support: 1.1414
Supporting reasons: Identified as a swing low support, indicating a potential level where the price could stabilize once again.
1st resistance: 1.1678
Supporting reasons: Identified as a pullback resistance, indicating a potential level that could cap further upward movement.
EUR/JPY:
Potential Direction: Bullish
Overall momentum of the chart: Bullish
The price has already bounced off the pivot and may continue its bullish move toward the 1st resistance
Pivot: 183.60
Supporting reasons: Identified as an overlap support, where renewed buying pressure could emerge to push the price higher.
1st support: 182.21
Supporting reasons: Identified as an overlap support, indicating a potential area where the price could again stabilize.
1st resistance: 184.68
Supporting reasons: Identified as an overlap resistance, indicating a potential level that could cap further upward movement.
EUR/GBP:
Potential Direction: Bearish
Overall momentum of the chart: Bullish
The price has already reacted off the pivot and may continue its bearish move toward the 1st support.
Pivot: 0.8678
Supporting reasons: Identified as an overlap resistance that aligns with the 38.2% Fibonacci retracement, where selling pressures could intensify and potentially cap any upward retracement.
1st support: 0.8615
Supporting reasons: Identified as a swing low support, indicating a potential area where the price could stabilize once more.
1st resistance: 0.8708
Supporting reasons: Identified as an overlap resistance, indicating a potential level that could cap further upward movement.
GBP/USD:
Potential Direction: Bullish
Overall momentum of the chart: Bullish
The price has already bounced off the pivot and may continue its bullish move toward the 1st resistance
Pivot: 1.3376
Supporting reasons: Identified as a pullback support, where renewed buying pressure could emerge to push the price higher.
1st support: 1.3274
Supporting reasons: Identified as an overlap support, indicating a potential area where the price could stabilize once more.
1st resistance: 1.3484
Supporting reasons: Identified as an overlap resistance, indicating a potential level that could halt further upward movement.
GBP/JPY:
Potential Direction: Bullish
Overall momentum of the chart: Bullish
The price has already bounced off the pivot and may continue its bullish move toward the 1st resistance
Pivot: 212.43
Supporting reasons: Identified as a pullback support, where renewed buying pressure could emerge to push the price higher.
1st support: 211.05
Supporting reasons: Identified as an overlap support, indicating a potential level where the price could stabilize once more.
1st resistance: 213.91
Supporting reasons: Identified as a resistance that aligns with the 161.8% Fibonacci extension, indicating a potential level that could halt further upward movement.
USD/CHF:
Potential Direction: Bullish
Overall momentum of the chart: Bearish
The price could see a short-term pullback toward the pivot before rising again toward the 1st resistance.
Pivot: 0.7823
Supporting reasons: Identified as a pullback support, where renewed buying pressure could emerge to push the price higher.
1st support: 0.7762
Supporting reasons: Identified as an overlap support, indicating a potential level where the price could stabilize once again.
1st resistance: 0.7911
Supporting reasons: Identified as an overlap resistance, indicating a potential level that could cap further upward movement.
USD/JPY:
Potential Direction: Bearish
Overall momentum of the chart: Bullish
The price has already reacted off the pivot and may continue its bearish move toward the 1st support.
Pivot: 158.88
Supporting reasons: Identified as a pullback support, where renewed buying pressure could emerge to push the price higher.
1st support: 157.53
Supporting reasons: Identified as an overlap support, indicating a strong area where buyers might return, and the price could stabilize once again.
1st resistance: 159.87
Supporting reasons: Identified as a swing high resistance. This level represents the next key area where upward movement could be capped amid increased selling pressure
USD/CAD:
Potential Direction: Bullish
Overall momentum of the chart: Bearish
The price could see a short-term pullback toward the pivot before rising again toward the 1st resistance.
Pivot: 1.3733
Supporting reasons: Identified as an overlap support, where renewed buying pressure could emerge to push the price higher.
1st support: 1.3700
Supporting reasons: Identified as an overlap support, indicating a key level where the price could stabilize once more.
1st resistance: 1.3814
Supporting reasons: Identified as a resistance that aligns with the 127.2% Fibonacci extension, making it a possible target for bullish advances and a level where some sellers could return to cap gains
AUD/USD:
Potential Direction: Bearish
Overall momentum of the chart: Bullish
The price could see a short-term pullback toward the pivot before continuing its bearish move down toward the 1st support.
Pivot: 0.7015
Supporting reasons: Identified as an overlap resistance, where selling pressures could intensify and potentially cap any upward retracement.
1st support: 0.6911
Supporting reasons: Identified as a swing low support, this area has provided strong support historically and may attract buying interest for a potential short-term bounce
1st resistance: 0.7115
Supporting reasons: Identified as a swing high resistance, indicating a potential area that could halt any further upward movement.
NZD/USD
Potential Direction: Bearish
Overall momentum of the chart: Bullish
The price could see a short-term pullback toward the pivot before continuing its bearish move down toward the 1st support.
Pivot: 0.5908
Supporting reasons: Identified as an overlap resistance, where selling pressures could intensify and potentially cap any upward retracement.
1st support: 0.5773
Supporting reasons: Identified as a swing low support, this area has provided strong support historically and may attract buying interest for a potential short-term bounce
1st resistance: 0.5957
Supporting reasons: Identified as an overlap resistance, indicating a potential area that could halt any further upward movement.
US30 (DJIA):
Potential Direction: Bearish
Overall momentum of the chart: Bullish
The price could see a short-term pullback toward the pivot before continuing its bearish move down toward the 1st support.
Pivot: 46,960.87
Supporting reasons: Identified as a pullback resistance, where selling pressures could intensify and potentially cap any upward retracement.
1st support: 45,836.29
Supporting reasons: Identified as a pullback support, suggesting a potential area where the price could stabilize once again.
1st resistance: 47,790.45
Supporting reasons: Identified as an overlap resistance, indicating a potential area that could halt any further upward movement.
DE40 (DAX):
Potential Direction: Bearish
Overall momentum of the chart: Bullish
The price has already reacted off the pivot and may continue its bearish move toward the 1st support.
Pivot: 23,287.77
Supporting reasons: Identified as an overlap resistance that aligns with the 78.6% Fibonacci retracement, where selling pressures could intensify and potentially cap any upward retracement.
1st support: 21,921.45
Supporting reasons: Identified as a swing low support, indicating a key level where the price could stabilize once more.
1st resistance: 24,291.81
Supporting reasons: Identified as a swing high resistance that aligns with the 61.8% Fibonacci retracement, indicating a potential area that could halt any further upward movement.
US500 (S&P 500):
Potential Direction: Bearish
Overall momentum of the chart: Bullish
The price has already reacted off the pivot and may continue its bearish move toward the 1st support.
Pivot: 6,669.53
Supporting reasons: Identified as a pullback resistance that aligns with the 78.6% Fibonacci retracement, where selling pressures could intensify and potentially cap any upward retracement.
1st support: 6,499.98
Supporting reasons: Identified as a pullback support, indicating a potential level where the price could stabilize once again.
1st resistance: 6,767.98
Supporting reasons: Identified as a pullback resistance, indicating a potential area that could halt any further upward movement.
BTC/USD (Bitcoin):
Potential Direction: Bearish
Overall momentum of the chart: Bearish
The price has already reacted off the pivot and may continue its bearish move toward the 1st support.
Pivot: 71,281.83
Supporting reasons: Identified as a pullback resistance, where selling pressures could intensify and potentially cap any upward retracement.
1st support: 67,363.60
Supporting reasons: Identified as an overlap support, indicating a potential level where the price could stabilize once more.
1st resistance: 73,695.04
Supporting reasons: Identified as a pullback resistance, indicating a potential area that could halt any further upward movement.
ETH/USD (Ethereum):
Potential Direction: Bearish
Overall momentum of the chart: Bullish
The price could see a short-term pullback toward the pivot before continuing its bearish move down toward the 1st support.
Pivot: 2,211.97
Supporting reasons: Identified as a pullback resistance that aligns with the 50% Fibonacci retracement, where selling pressures could intensify and potentially cap any upward retracement.
1st support: 2,041.82
Supporting reasons: Identified as an overlap support, indicating a potential level where the price could stabilize once more.
1st resistance: 2,389.45
Supporting reasons: Identified as a swing high resistance, indicating a potential area that could halt any further upward movement.
WTI/USD (Oil):
Potential Direction: Bearish
Overall momentum of the chart: Bullish
The price has already reacted off the pivot and may continue its bearish move toward the 1st support.
Pivot: 92.33
Supporting reasons: Identified as a pullback resistance, where selling pressures could intensify and potentially cap any upward retracement.
1st support: 75.12
Supporting reasons: Identified as an overlap support, indicating a key level where the price could stabilize once more.
1st resistance: 102.04
Supporting reasons: Identified as a swing high resistance, indicating a potential area that could halt any further upward movement.
XAU/USD (GOLD):
Potential Direction: Bearish
Overall momentum of the chart: Bullish
The price could see a short-term pullback toward the pivot before continuing its bearish move down toward the 1st support.
Pivot: 4,614.32
Supporting reasons: Identified as a pullback resistance that aligns with the 78.6% Fibonacci retracement, where selling pressures could intensify and potentially cap any upward retracement.
1st support: 4,106.92
Supporting reasons: Identified as a swing low support, indicating a key level where the price could stabilize once more.
1st resistance: 4,771.27
Supporting reasons: Identified as a pullback resistance, indicating a potential area that could halt any further upward movement.
The accuracy, completeness and timeliness of the information contained on this site cannot be guaranteed. IC Markets Global does not warranty, guarantee or make any representations, or assume any liability regarding financial results based on the use of the information in the site.
News, views, opinions, recommendations and other information obtained from sources outside of www.icmarkets.com, used in this site are believed to be reliable, but we cannot guarantee their accuracy or completeness. All such information is subject to change at any time without notice. IC Markets Global assumes no responsibility for the content of any linked site.
The fact that such links may exist does not indicate approval or endorsement of any material contained on any linked site. IC Markets Global is not liable for any harm caused by the transmission, through accessing the services or information on this site, of a computer virus, or other computer code or programming device that might be used to access, delete, damage, disable, disrupt or otherwise impede in any manner, the operation of the site or of any user’s software, hardware, data or property.
The post Wednesday 25th March 2026: Technical Outlook and Review first appeared on IC Your Trading Edge | Official Blog.