Articles

Wednesday 25th March 2026: Asia Markets Rally as Trump Signals Possible U.S.–Iran Talks; Oil Prices Slide
429274 April 7, 2026 14:40 ICMarkets Market News
Global Markets:
- Asian Stock Markets : Nikkei up 2.52%, Shanghai Composite up 0.88% Hang Seng up 0.12% ASX up 1.63%
- Commodities : Gold at $4,601.65 (3.77%) Silver at $73.440 (5.60%), Brent Oil at $96.26 (-3.97%), WTI Oil at $89.17 (-3.52%)
- Rates : US 10-year yield at 4.346, UK 10-year yield at 4.9560, Germany 10-year yield at 3.0135
News & Data:
- (USD) Flash Manufacturing PMI 52.5 to 51.5 expected
- (USD) Flash Services PMI 51.1 to 52.0 expected
Markets Update:
Asian markets advanced on Wednesday, led by strong gains in South Korean equities, after comments from U.S. President Donald Trump signaled possible negotiations with Iran, improving investor sentiment despite Tehran’s denial of direct talks with Washington.
Speaking from the Oval Office on Tuesday, Trump said the United States and Iran were “in negotiations right now” and suggested Tehran was interested in reaching a peace agreement. He also noted that he had stepped back from earlier threats to strike Iranian energy infrastructure due to the ongoing discussions.
South Korea’s Kospi surged 3%, while the small-cap Kosdaq climbed 3.18%. Australia’s S&P/ASX 200 rose 2%, and Japan’s Nikkei 225 gained 2.88%, with the broader Topix index advancing 2.4%. In Greater China, Hong Kong’s Hang Seng index added 1.14%, while mainland China’s CSI 300 edged up 0.67%.
Oil prices declined during early Asian trading hours, with Brent crude futures dropping about 6% to $98.31 per barrel and U.S. West Texas Intermediate futures falling 5% to $87.65 per barrel.
U.S. stock futures also moved higher Tuesday night. Futures tied to the S&P 500 and Nasdaq 100 rose 0.7% and 0.8%, respectively, while Dow Jones futures gained 318 points, or 0.7%.
Earlier, U.S. markets closed lower as investors reacted to renewed oil price volatility and the Iran conflict entering its fourth week. The S&P 500 slipped 0.37%, the Dow fell 0.18%, and the Nasdaq declined 0.84%.
Upcoming Events:
- 12:30 PM GMT – USD Current Account
The post Wednesday 25th March 2026: Asia Markets Rally as Trump Signals Possible U.S.–Iran Talks; Oil Prices Slide first appeared on IC Your Trading Edge | Official Blog.
Monday 6th April 2026: Technical Outlook and Review
429238 April 6, 2026 20:00 ICMarkets Market News
DXY (U.S. Dollar Index):
Potential Direction: Bullish
Overall momentum of the chart: Bearish
The price has already bounced off the pivot and may continue its bullish move toward the 1st resistance
Pivot: 99.49
Supporting reasons: Identified as a pullback support, where renewed buying pressure could emerge to push the price higher.
1st support: 98.01
Supporting reasons: Identified as a pullback support, indicating a potential area where the price could again stabilize.
1st resistance: 101.98
Supporting reasons: Identified as an overlap resistance that aligns with the 161.8% Fibonacci retracement, indicating a potential area that could halt any further upward movement
EUR/USD:
Potential Direction: Bearish
Overall momentum of the chart: Bullish
The price has already reacted off the pivot and may continue its bearish move toward the 1st support.
Pivot: 1.1607
Supporting reasons: Identified as an overlap resistance, where selling pressures could intensify and potentially cap any upward retracement.
1st support: 1.1279
Supporting reasons: Identified as an overlap support that aligns with the 161.8% Fibonacci retracement, indicating a potential level where the price could stabilize once again
1st resistance: 1.1808
Supporting reasons: Identified as a pullback resistance, indicating a potential level that could cap further upward movement.
EUR/JPY:
Potential Direction: Bearish
Overall momentum of the chart: Bearish
The price has already reacted off the pivot and may continue its bearish move toward the 1st support.
Pivot: 184.74
Supporting reasons: Identified as an overlap resistance, where selling pressures could intensify and potentially cap any upward retracement.
1st support: 179.93
Supporting reasons: Identified as a pullback support that aligns with the 50% Fiboancci retracement, indicating a potential area where the price could again stabilize.
1st resistance: 186.93
Supporting reasons: Identified as a swing high resistance, indicating a potential level that could cap further upward movement.
EUR/GBP:
Potential Direction: Bullish
Overall momentum of the chart: Bullish
The price could make a short-term pullback toward the pivot before rising again toward the 1st resistance
Pivot: 0.8675
Supporting reasons: Identified as a pullback support, where renewed buying pressure could emerge to push the price higher.
1st support: 0.8604
Supporting reasons: Identified as a swing low support, indicating a potential area where the price could stabilize once more.
1st resistance: 0.8788
Supporting reasons: Identified as a swing high resistance, indicating a potential level that could cap further upward movement.
GBP/USD:
Potential Direction: Bearish
Overall momentum of the chart: Bullish
The price has already reacted off the pivot and may continue its bearish move toward the 1st support.
Pivot: 1.3462
Supporting reasons: Identified as an overlap resistance, where selling pressures could intensify and potentially cap any upward retracement.
1st support: 1.3056
Supporting reasons: Identified as a swing low support that aligns with the 161.8% Fibonacci extension, indicating a potential area where the price could stabilize once more.
1st resistance: 1.3668
Supporting reasons: Identified as a swing high resistance, indicating a potential level that could halt further upward movement.
GBP/JPY:
Potential Direction: Bullish
Overall momentum of the chart: Bullish
The price has already bounced off the pivot and may continue its bullish move toward the 1st resistance
Pivot: 209.64
Supporting reasons: Identified as an overlap support, where renewed buying pressure could emerge to push the price higher.
1st support: 207.19
Supporting reasons: Identified as an overlap support, indicating a potential level where the price could stabilize once more.
1st resistance: 214.80
Supporting reasons: Identified as a swing high resistance, indicating a potential level that could halt further upward movement.
USD/CHF:
Potential Direction: Bullish
Overall momentum of the chart: Bearish
The price has already bounced off the pivot and may continue its bullish move toward the 1st resistance
Pivot: 0.7931
Supporting reasons: Identified as an overlap support, where renewed buying pressure could emerge to push the price higher.
1st support: 0.7835
Supporting reasons: Identified as an overlap support, indicating a potential level where the price could stabilize once again.
1st resistance: 0.8095
Supporting reasons: Identified as an overlap resistance, indicating a potential level that could cap further upward movement.
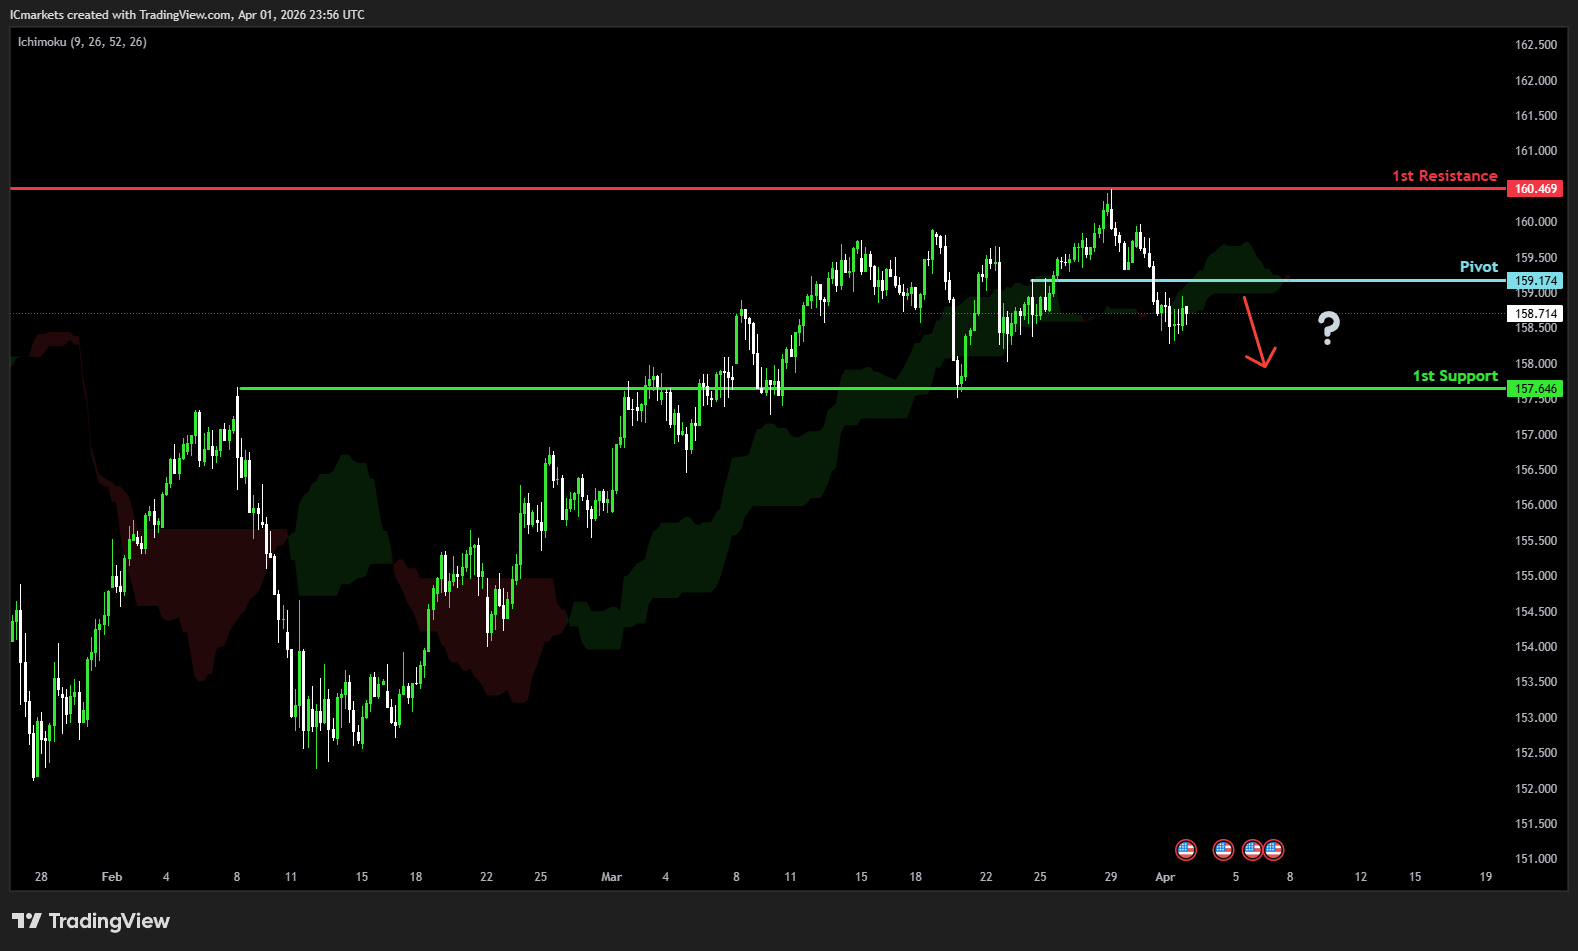
USD/JPY:
Potential Direction: Bullish
Overall momentum of the chart: Bullish
The price could make a short-term pullback toward the pivot before rising again toward the 1st resistance
Pivot: 159.87
Supporting reasons: Identified as a pullback support, where renewed buying pressure could emerge to push the price higher.
1st support: 157.58
Supporting reasons: Identified as an overlap support, indicating a strong area where buyers might return, and the price could stabilize once again.
1st resistance: 161.74
Supporting reasons: Identified as a swing high resistance. This level represents the next key area where upward movement could be capped amid increased selling pressure
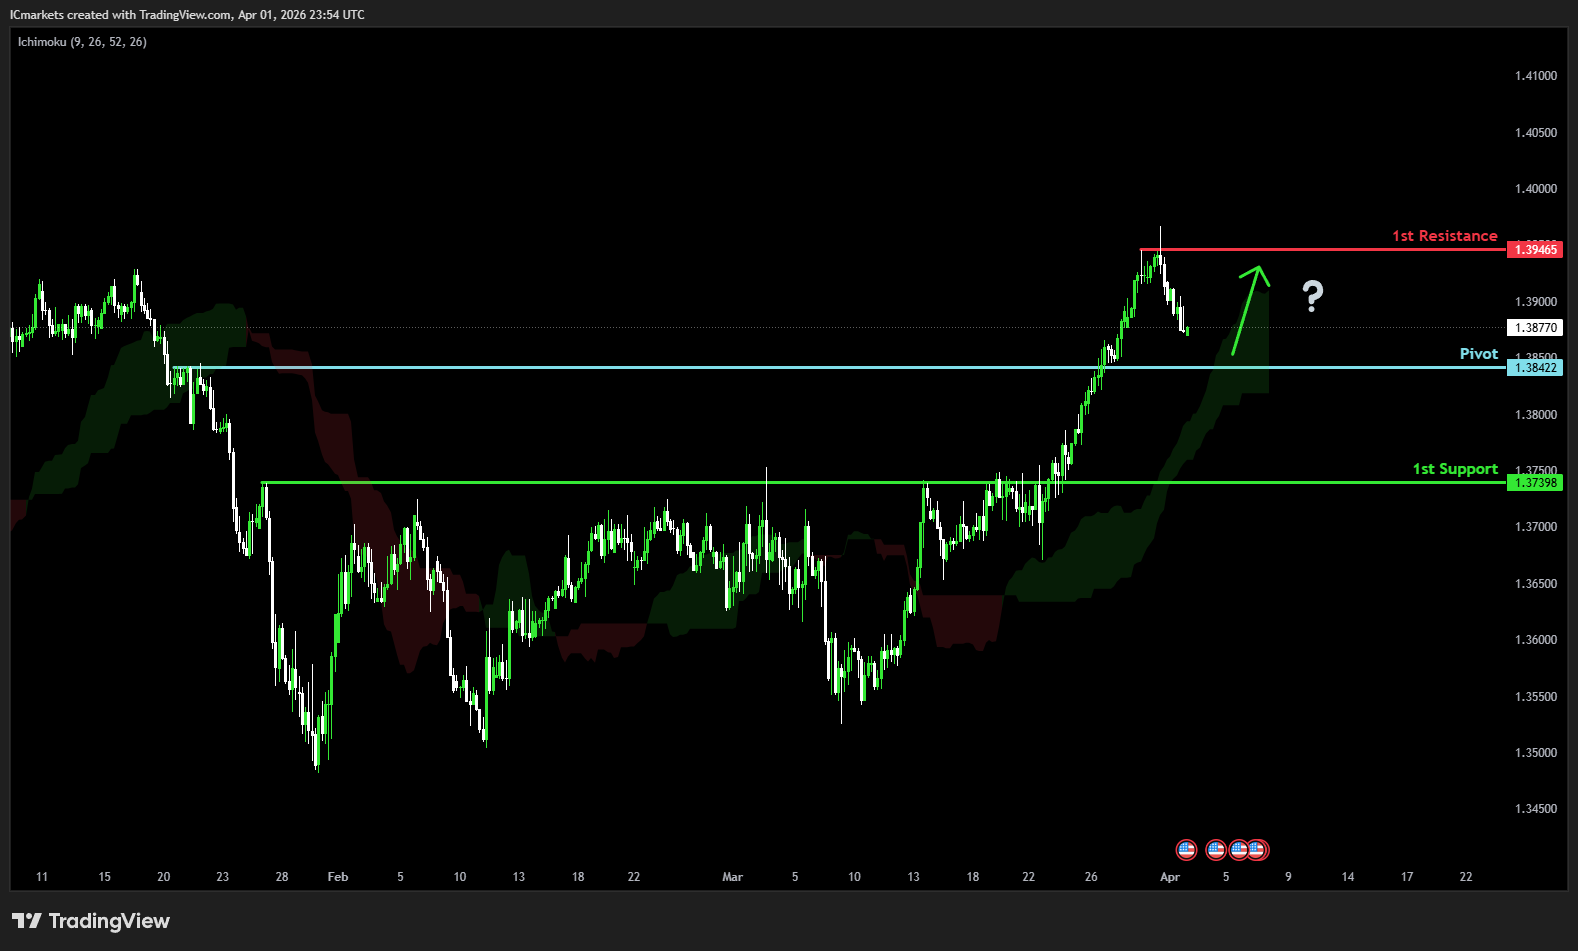
USD/CAD:
Potential Direction: Bearish
Overall momentum of the chart: Bearish
The price could see a short-term pullback toward the pivot before continuing its bearish move down toward the 1st support.
Pivot: 1.3940
Supporting reasons: Identified as an overlap resistance that aligns with the 161.8% Fibonacci projection, where selling pressures could intensify and potentially cap any upward retracement.
1st support: 1.3725
Supporting reasons: Identified as a pullback support, indicating a key level where the price could stabilize once more.
1st resistance: 1.4117
Supporting reasons: Identified as a multi swing high resistance, making it a possible target for bullish advances and a level where some sellers could return to cap gains
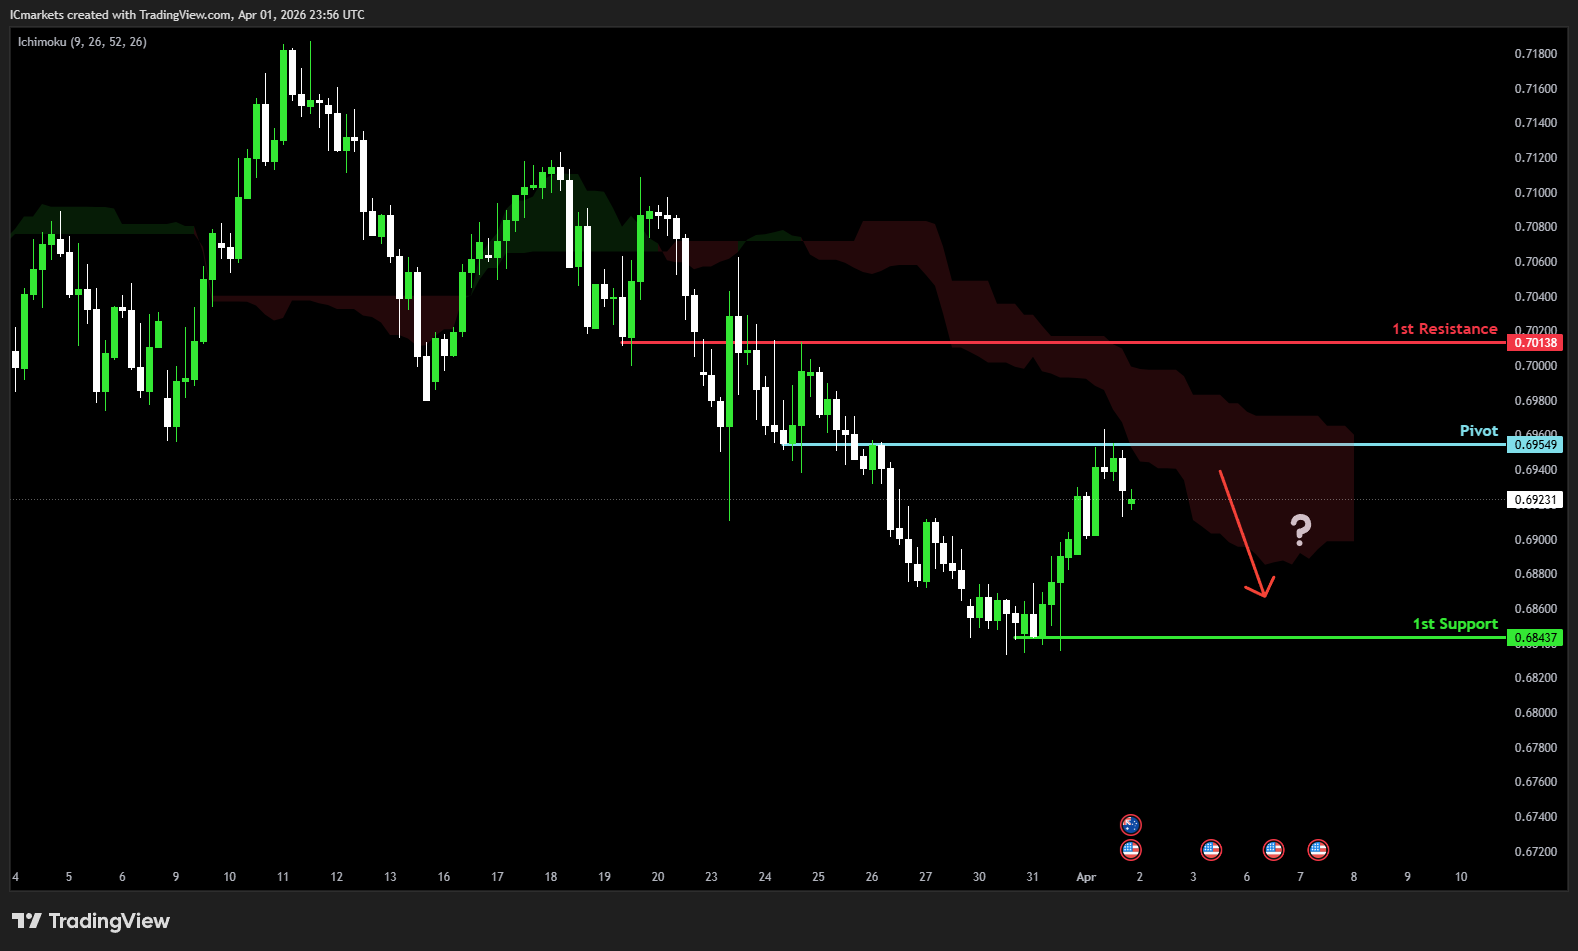
AUD/USD:
Potential Direction: Bearish
Overall momentum of the chart: Bullish
The price has already reacted off the pivot and may continue its bearish move toward the 1st support.
Pivot: 0.6928
Supporting reasons: Identified as an overlap resistance, where selling pressures could intensify and potentially cap any upward retracement.
1st support: 0.6706
Supporting reasons: Identified as a pullback support, this area has provided strong support historically and may attract buying interest for a potential short-term bounce
1st resistance: 0.7187
Supporting reasons: Identified as a swing high resistance, indicating a potential area that could halt any further upward movement.
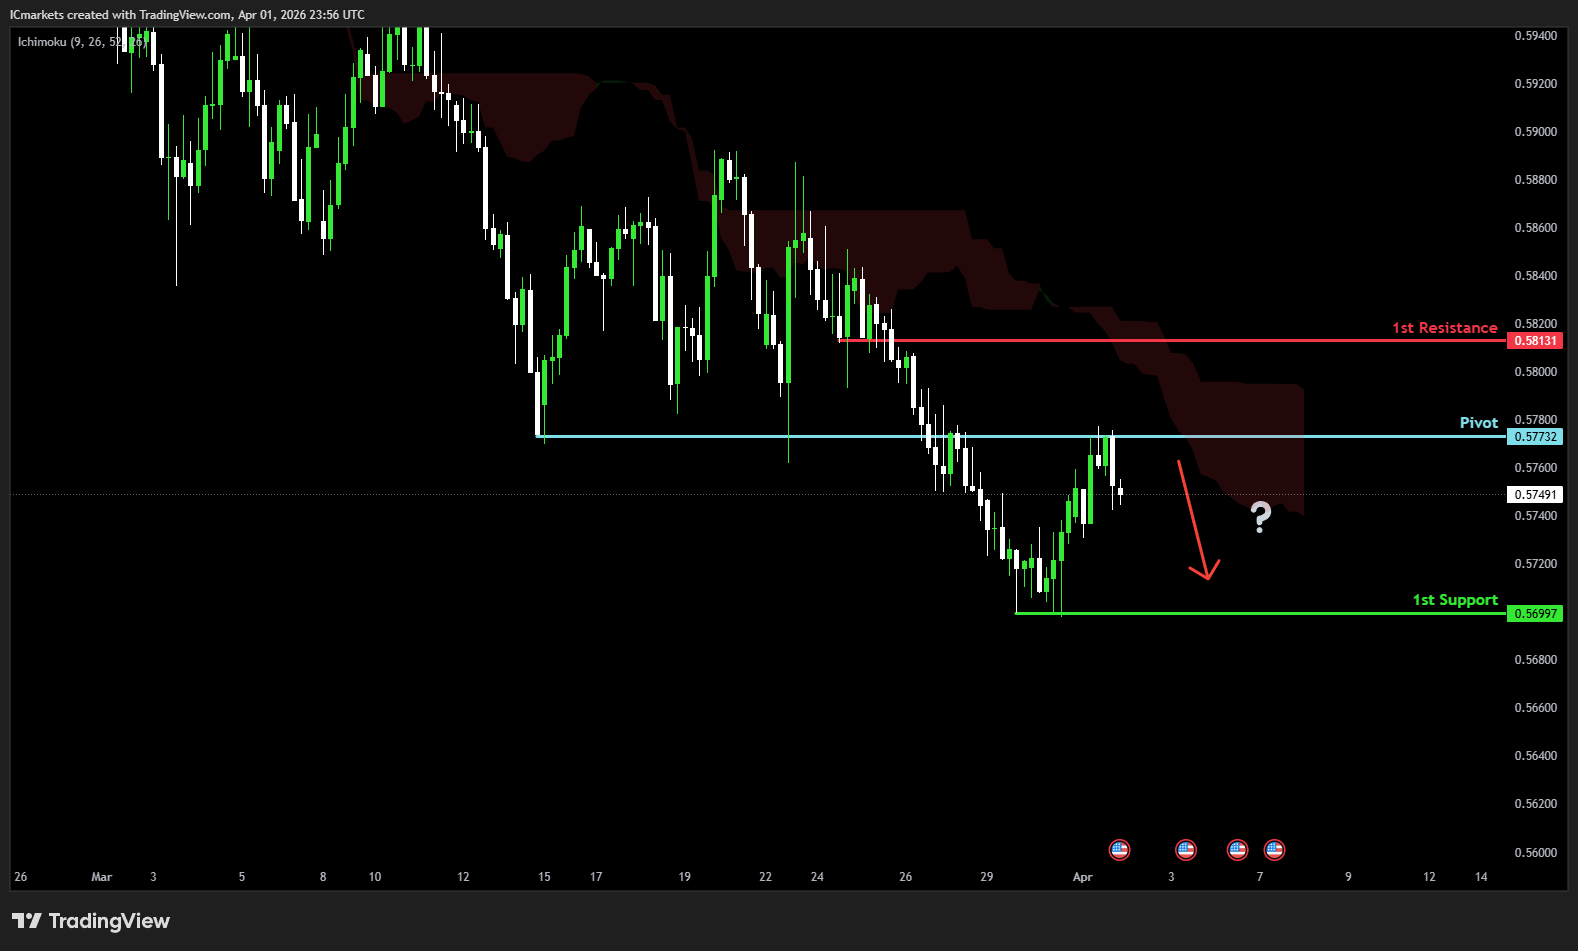
NZD/USD
Potential Direction: Bullish
Overall momentum of the chart: Bearish
The price could make a short-term pullback toward the pivot before rising again toward the 1st resistance
Pivot: 0.5675
Supporting reasons: Identified as a pullback support that aligns with the 161.8% Fibonacci extension, where renewed buying pressure could emerge to push the price higher.
1st support: 0.5581
Supporting reasons: Identified as a swing low support, this area has provided strong support historically and may attract buying interest for a potential short-term bounce
1st resistance: 0.5793
Supporting reasons: Identified as a pullback resistance, indicating a potential area that could halt any further upward movement.
US30 (DJIA):
Potential Direction: Bearish
Overall momentum of the chart: Bullish
The price could see a short-term pullback toward the pivot before continuing its bearish move down toward the 1st support.
Pivot: 47,267.88
Supporting reasons: Identified as a pullback resistance that aligns with the 38.2% Fibonacci retracement, where selling pressures could intensify and potentially cap any upward retracement.
1st support: 45,228.73
Supporting reasons: Identified as a swing low support, suggesting a potential area where the price could stabilize once again.
1st resistance: 48,285.88
Supporting reasons: Identified as a pullback resistance that aligns with the 61.8% Fibonacci retracement, indicating a potential area that could halt any further upward movement.
DE40 (DAX):
Potential Direction: Bearish
Overall momentum of the chart: Bullish
The price could see a short-term pullback toward the pivot before continuing its bearish move down toward the 1st support.
Pivot: 23,874.44
Supporting reasons: Identified as an overlap resistance, where selling pressures could intensify and potentially cap any upward retracement.
1st support: 22,894.75
Supporting reasons: Identified as a pullback support, indicating a key level where the price could stabilize once more.
1st resistance: 24,366.22
Supporting reasons: Identified as a pullback resistance, indicating a potential area that could halt any further upward movement.
US500 (S&P 500):
Potential Direction: Bearish
Overall momentum of the chart: Bullish
The price could see a short-term pullback toward the pivot before continuing its bearish move down toward the 1st support.
Pivot: 6,724.75
Supporting reasons: Identified as a pullback resistance that aligns with the 61.8% Fibonacci retracement, where selling pressures could intensify and potentially cap any upward retracement.
1st support: 6,351.43
Supporting reasons: Identified as a swing low support, indicating a potential level where the price could stabilize once again.
1st resistance: 6,992.72
Supporting reasons: Identified as a swing high resistance, indicating a potential area that could halt any further upward movement.
BTC/USD (Bitcoin):
Potential Direction: Bearish
Overall momentum of the chart: Bullish
The price has already reacted off the pivot and may continue its bearish move toward the 1st support.
Pivot: 76,476.06
Supporting reasons: Identified as a pullback resistance that aligns with the 50% Fibonacci retracement, where selling pressures could intensify and potentially cap any upward retracement.
1st support: 59,822.56
Supporting reasons: Identified as a swing low support, indicating a potential level where the price could stabilize once more.
1st resistance: 85,026.77
Supporting reasons: Identified as a pullback resistance that aligns with the 61.8% Fibonacci retracement, indicating a potential area that could halt any further upward movement.
ETH/USD (Ethereum):
Potential Direction: Bearish
Overall momentum of the chart: Bullish
The price could see a short-term pullback toward the pivot before continuing its bearish move down toward the 1st support.
Pivot: 2,618.80
Supporting reasons: Identified as a pullback resistance that aligns with the 50% Fibonacci retracement, where selling pressures could intensify and potentially cap any upward retracement.
1st support: 1,823.98
Supporting reasons: Identified as an overlap support, indicating a potential level where the price could stabilize once more.
1st resistance: 3,053.33
Supporting reasons: Identified as a swing high resistance, indicating a potential area that could halt any further upward movement.
WTI/USD (Oil):
Potential Direction: Bullish
Overall momentum of the chart: Bullish
The price has already bounced off the pivot and may continue its bullish move toward the 1st resistance
Pivot: 87.53
Supporting reasons: Identified as an overlap support, where renewed buying pressure could emerge to push the price higher.
1st support: 78.59
Supporting reasons: Identified as a pullback support, indicating a key level where the price could stabilize once more.
1st resistance: 123.24
Supporting reasons: Identified as a swing high resistance, indicating a potential area that could halt any further upward movement.
XAU/USD (GOLD):
Potential Direction: Bearish
Overall momentum of the chart: Bullish
The price could see a short-term pullback toward the pivot before continuing its bearish move down toward the 1st support.
Pivot: 4,858.96
Supporting reasons: Identified as a pullback resistance, where selling pressures could intensify and potentially cap any upward retracement.
1st support: 4,367.70
Supporting reasons: Identified as an overlap support, indicating a key level where the price could stabilize once more.
1st resistance: 5,464.42
Supporting reasons: Identified as a swing high resistance, indicating a potential area that could halt any further upward movement.
The accuracy, completeness and timeliness of the information contained on this site cannot be guaranteed. IC Markets Global does not warranty, guarantee or make any representations, or assume any liability regarding financial results based on the use of the information in the site.
News, views, opinions, recommendations and other information obtained from sources outside of www.icmarkets.com, used in this site are believed to be reliable, but we cannot guarantee their accuracy or completeness. All such information is subject to change at any time without notice. IC Markets Global assumes no responsibility for the content of any linked site.
The fact that such links may exist does not indicate approval or endorsement of any material contained on any linked site. IC Markets Global is not liable for any harm caused by the transmission, through accessing the services or information on this site, of a computer virus, or other computer code or programming device that might be used to access, delete, damage, disable, disrupt or otherwise impede in any manner, the operation of the site or of any user’s software, hardware, data or property.
The post Monday 6th April 2026: Technical Outlook and Review first appeared on IC Your Trading Edge | Official Blog.
Monday 6th April 2026: Asian Markets Rise as Oil Surges Amid U.S.–Iran Tensions and Strait of Hormuz Standoff
429237 April 6, 2026 20:00 ICMarkets Market News
Global Markets:
- Asian Stock Markets : Nikkei up 1.23%, Shanghai Composite down 1.00% Hang Seng down 0.70% ASX down 1.06%
- Commodities : Gold at $4,670.85 (-0.18%) Silver at $72.272(-0.89%), Brent Oil at $109.63 (0.60%), WTI Oil at $111.17 (-0.29%)
- Rates : US 10-year yield at 4.356, UK 10-year yield at 4.8460, Germany 10-year yield at 3.0032
News & Data:
- (USD) Non-Farm Employment Change 178K to 65K expected
Markets Update:
Asian markets showed mixed movement on Monday as investors reacted cautiously to escalating tensions in the Middle East over the weekend. Stocks in Japan and South Korea advanced, while several other regional markets remained closed for public holidays.
On Sunday, U.S. President Donald Trump warned that American forces could begin targeting Iran’s power plants and civilian infrastructure starting Tuesday unless Tehran fully reopened the Strait of Hormuz. The strategic waterway, located between Iran and the Arabian Peninsula, previously carried roughly one-fifth of global oil supplies before conflict between the U.S.-Israel alliance and Iran intensified on Feb. 28.
Trump also posted strong remarks on social media following the rescue of an American airman in Iran and later referred to a “Tuesday 8 p.m. Eastern Time” deadline. The White House clarified that the timeline relates to a proposed agreement with Iran. A military-related press conference at the Oval Office was also scheduled for Monday afternoon.
Iran rejected the ultimatum, stating the strait would reopen only after compensation for wartime damage. Meanwhile, Tehran continued strikes on economic targets in neighboring Gulf states, including Kuwait’s oil headquarters.
Oil markets reacted sharply. U.S. West Texas Intermediate rose 2.57% to $114.11 per barrel, while Brent crude gained 2.62% to $111.65. Japan’s Nikkei 225 rose 0.62%, Topix added 0.23%, and South Korea’s Kospi climbed 1.8%. However, Wall Street futures declined amid ongoing uncertainty .
Upcoming Events:
- 02:00 PM GMT – USD ISM Services PMI
The post Monday 6th April 2026: Asian Markets Rise as Oil Surges Amid U.S.–Iran Tensions and Strait of Hormuz Standoff first appeared on IC Your Trading Edge | Official Blog.
IC Markets Global – Asia Fundamental Forecast | 06 April 2026
429236 April 6, 2026 19:40 ICMarkets Market News
IC Markets Global – Asia Fundamental Forecast | 06 April 2026
What happened in the U.S. session?
The Iran war’s intensification overnight spiked oil prices over 30-40% from recent levels due to Strait of Hormuz risks, overshadowing solid March jobs data and looming hotter CPI from energy shocks, hammering equities (S&P 500 down sharply, erasing trillions), boosting oil futures, and pressuring precious metals as the dollar rebounded.
What does it mean for the Asia Session?
Asian traders entering Monday, 6 April 2026, should position for a thin, holiday‑distorted session dominated by lingering Middle‑Eastern war risk, elevated oil and energy‑linked volatility, and a still‑live “April BOJ hike” storyline that continues to drive JPY and regional tech. While US‑style risk‑on sentiment has helped lift Asian equities late in the prior week, the patchwork of Easter‑Monday closures in key markets means liquidity will be lighter, so breakouts in USD/JPY, CNH, and tech‑heavy indices should be treated with extra caution and tighter risk management until the US session arrives.
The Dollar Index (DXY)
Key news events today
ISM Services PMI (2:00 pm GMT)
What can we expect from DXY today?
The US Dollar experienced heightened volatility today amid ongoing US-Iran tensions, with President Trump’s April 6 deadline for reopening the Strait of Hormuz driving safe-haven demand and pushing the DXY index around 99.93–100.00 after an initial dip on ceasefire hopes.
Central Bank Notes:
- The Federal Open Market Committee (FOMC) is widely expected to hold the federal funds rate target range steady at 3.50%–3.75% at its March 17–18, 2026, meeting, amid rising oil prices from the US-Israel war against Iran and persistent inflation pressures, delaying any 2026 cuts potentially to September.
- The Committee continues to pursue maximum employment and 2% inflation goals, with the labor market weakening further as nonfarm payrolls declined by 92,000 in February 2026 and the unemployment rate rose to 4.4% from 4.3% in January.
- Officials face tilted risks from geopolitical tensions, elevated oil prices, and sticky inflation, with CPI steady at 2.4% year-over-year in February 2026, headline PCE at 2.8% in January, and core PCE rising to 3.1%.
- Economic activity has cooled after robust Q4 2025 growth near 5%, with the Atlanta Fed GDPNow now estimating Q1 2026 growth at around 2.1%–2.7% amid softer consumer spending and labor data.
- December 2025’s Summary of Economic Projections forecasts 2025 unemployment at a median of 4.5%, 2026 GDP growth at 2.3%, and core PCE at 2.5%, with the dot plot signaling one more cut in 2026 to a median 3.4% funds rate; March updates may reflect softer labor and inflation upticks.
- The Committee maintains its data-dependent stance amid a softening labor market, inflation above target, and new oil shocks, likely holding rates at 3.50%-3.75% with ongoing divisions and possible hawkish dissents on rate cuts.
- The FOMC continues its adjusted quantitative tightening, with Treasury rolloff caps at $5 billion per month and agency MBS at $35 billion per month to ensure ample reserves post-2025 program adjustments.
- The next meeting is scheduled for 28 to 29 April 2026.
Next 24 Hours Bias
Medium Bearish
Gold (XAU)
Key news events today
ISM Services PMI (2:00 pm GMT)
What can we expect from Gold today?
Gold prices are showing volatility as markets reopen on Monday, amid ongoing US-Iran tensions and President Trump’s extension of the deadline for potential strikes on Iranian energy facilities to today. Spot gold is trading around $4,417–$4,677 per ounce after recent declines of over 2% driven by a stronger US dollar, surging oil prices, and inflation fears from escalated conflict rhetoric.
Next 24 Hours Bias
Medium Bullish
The Australian Dollar (AUD)
Key news events today
No major news event
What can we expect from AUD today?
The Australian Dollar (AUD) saw limited specific news on Monday, amid ongoing market volatility driven by global risk sentiment and US Dollar strength. Recent trends show AUD/USD trading around 0.6870-0.6900 after a 0.54% drop to 0.6872 on April 3, reflecting a 2.87% monthly decline but a strong 13.78% yearly gain, with forecasts pointing to 0.70 by quarter-end.
Central Bank Notes:
- The Reserve Bank of Australia (RBA) is expected to hold its cash rate at 3.85% at the March 16-17, 2026 policy meeting, following the widely anticipated 25 basis point hike to 3.85% in early February after persistent inflation pressures from late 2025. While some banks like CBA, NAB, and Westpac now forecast a further 25 basis point rise to 4.10% as soon as May if inflation data remains sticky, consensus tilts toward a pause in March to assess incoming monthly CPI and labor market signals. The February hike reversed prior cuts, entering mildly restrictive territory amid capacity pressures, with the board emphasizing data dependence.
- Inflation remains elevated, with December 2025 CPI at 3.8% year-on-year and trimmed mean at 3.3%, above the 2–3% target midpoint. RBA’s February Statement revised forecasts higher, projecting trimmed-mean inflation to peak in mid-2026 above 3% and remain elevated through early 2027, driven by services, housing, and demand resilience despite some monthly cooling, such as January’s 0.2% MoM gauge. Monthly CPI data continues to highlight core stickiness beyond energy rebates, delaying the target return to late 2027 or beyond.
- January 2026 monthly indicators showed modest easing, but headline CPI risks upward surprises from housing (up recently) and services amid firm domestic demand. Trimmed mean pressures persist from wage growth and capacity constraints, with consumer expectations ticking to 5% YoY in February surveys. Enhanced monthly reporting sharpens vigilance on potential broad-based pick-up.
- The labor market shows softening, with unemployment around 4.1-4.4%, down slightly to 4.1% in December, but unit labor costs are elevated due to subdued productivity. Household spending faces higher borrowing costs post-hike, yet private demand recovery sustains capacity strains. Vulnerabilities persist amid resilient employment dynamics.
- Global growth modestly revised up but tempered by geopolitics and commodity volatility; policy now restrictive post-February, with the RBA balancing inflation against employment risks. Data from the monthly CPI and Q1 GDP will guide, amid household debt sensitivities.
- Sustained restrictive stance post-February anchors inflation return to target, upholding dual mandate with flexibility to new risks like further inflation upticks.
- Markets price a March hold at 3.85%, with big four banks split: CBA, NAB, Westpac eye May hike to 4.10% if persistence continues, while others see limited upside unless acceleration. Upcoming monthly CPI pivotal for Q2 trajectory.
- Policy vigilance counters inflation stickiness against household fragilities and global uncertainties, reaffirming adaptability under dual mandate.
- Base case favors March hold with risks tilted hawkish for further hikes if data is hot; monthly indicators key to 2026 path.
- The next meeting is on 5 to 6 May 2026.
Next 24 Hours Bias
Weak Bullish
The Kiwi Dollar (NZD)
Key news events today
No major news event
What can we expect from NZD today?
The New Zealand Dollar remains under strain near 0.57 versus the USD, hit by US rate spikes, geopolitical tensions, and weak China indicators, with NZD/USD down sharply last week. Today’s spotlight falls on Q1 CPI data, potentially signaling RBNZ tightening if inflation accelerates, though global trade worries and dollar resilience cap upside; traders anticipate a 0.57-0.58 range pending releases.
Central Bank Notes:
- The Monetary Policy Committee (MPC) left the Official Cash Rate (OCR) unchanged at 2.25% at its 18 February 2026 meeting, as widely expected, maintaining a unanimous decision and emphasizing a balance between supporting the nascent economic recovery and ensuring inflation returns sustainably to the 2% midpoint of the 1–3% target band.
- The Committee judged that the prior cumulative easing of 325 basis points provides ongoing stimulus, warranting patience amid uneven recovery signals, while noting readiness to normalize policy gradually as inflation pressures subside and activity strengthens.
- Headline CPI inflation, recently at 3.1%, is projected to dip back within the target band in the coming quarter—supported by spare capacity, modest wage growth, and declining food/fuel prices—before reaching 2.0% by mid-2027, with two-year-ahead business expectations edging up to 2.37%.
- Domestic demand shows gradual stabilization with softer household spending and a muted housing market, partially offset by easing retail rates boosting budgets, though cautious consumption, low migration, and a weak labour market continue to cap services inflation as wage moderation takes hold.
- Financial conditions remain accommodative as lower OCR flows through to borrowing costs, aiding mortgage approvals and housing sentiment, but business credit growth stays subdued amid uneven confidence and sensitivity to the recovery’s pace.
- Recent indicators point to weak but steadying GDP momentum in an early-stage rebound from 2025 lows, with high-frequency data showing gradual broadening despite persistent headwinds from elevated costs, fragile sentiment, and subdued investment.
- External risks are now viewed as balanced rather than downside-skewed, with a supportive global backdrop offsetting prior concerns over China and US trade policy, while a lower NZ dollar aids exports and tradables inflation.
- Looking to mid-2026, the MPC adopted a data-dependent stance with forecasts signaling OCR hikes likely from late 2026 or early 2027—potentially as soon as December if activity or inflation exceeds projections—while keeping policy accommodative for now if the gradual recovery aligns with expectations.
- The next meeting is on 7 April 2026.
Next 24 Hours Bias
Medium Bearish
The Japanese Yen (JPY)
Key news events today
No major news event
What can we expect from JPY today?
The Japanese yen is trading near fresh multi‑year lows against the US dollar, with USD/JPY hovering just below ¥160 after a month‑long decline of roughly 1% and a 6% drop over the past year. Tokyo has stepped up verbal threats of FX intervention and signaled that further yen falls could merit a near‑term rate hike, but markets still expect the Bank of Japan to hold policy steady at its April meeting, keeping the yen under pressure in the near term while analysts project a modest stabilization toward the mid‑150s over the next 12 months.
Central Bank Notes:
- The Policy Board of the Bank of Japan meets on 18–19 April 2026, with markets anticipating the short-term policy rate to remain at 0.75%, as the bank continues evaluating the December 2025 and prior hikes’ effects amid data-dependent normalization.
- The BOJ will target the uncollateralized overnight call rate around 0.75% and indicate future hikes hinge on impacts to lending, financing, and activity, with Governor Ueda signaling scrutiny of data for potential moves in April or later meetings.
- JGB tapering advances per plan, cutting outright purchases by ¥400 billion quarterly through Q1 2026 and slowing to ¥200 billion from April onward, targeting roughly ¥2-3 trillion monthly by mid-2026, adjustable for market stability
- Japan’s economy maintains moderate growth into Q1 2026, building on Q4 2025 rebound via exports and fiscal measures, though manufacturing sentiment holds soft amid overseas demand weakness and yen pressures.
- Core CPI (ex-fresh food) likely stays near 2.3-2.5% y/y in early 2026 Tokyo prints, off prior highs but above 2%, while core-core hovers around 2.6%, reflecting sustained but easing inflationary forces.
- Input costs ease further from import peaks, yet services inflation, 5% wage targets in shunto talks, and anchored expectations above 2% support price persistence, with upside risks from yen and geopolitics.
- Near-term real GDP may ease below trend due to tightening and external shocks like Iran tensions, but negative real rates, wage gains, and stimulus should underpin consumption and capex rebound.
- Medium-term, overseas recovery, labor shortages, and productivity lifts are set to fuel wages and core inflation near/above 2%, enabling gradual hikes toward 1% if conditions align.
- The next meeting is on 27 to 28 April 2026.
Next 24 Hours Bias
Medium Bearish
Oil
Key news events today
No major news event
What can we expect from Oil today?
Oil markets remain highly volatile amid escalating US-Iran tensions over the Strait of Hormuz, with President Trump’s deadline for Iran to reopen the strait expiring today, potentially triggering strikes on Kharg Island and pushing Brent crude toward $120+ per barrel. Brent posted its historic 51% March gain driven by geopolitical risk premiums rather than supply shortages.
Next 24 Hours Bias
Strong Bullish
The post IC Markets Global – Asia Fundamental Forecast | 06 April 2026 first appeared on IC Your Trading Edge | Official Blog.
IC Markets Global – Europe Fundamental Forecast | 06 April 2026
429235 April 6, 2026 19:40 ICMarkets Market News
IC Markets Global – Europe Fundamental Forecast | 06 April 2026
What happened in the Asia session?
Consolidation after a volatile start to the week, as markets digest the Iran‑war risk premium without fresh major escalations while positioning for upcoming China‑area inflation and activity data. Oil has stabilized in the high‑90s to low‑100s, underpinning gold and weighing on energy‑importing Asian economies.
What does it mean for the Europe & US sessions?
A mix of lingering geopolitical risk, central‑bank‑policy uncertainty, and upcoming inflation data that could sharpen the narrative around rate‑cut timing. Equities in both regions have been trading in a nervous range, supported by still‑healthy U.S. manufacturing activity (ISM PMI above 50) but frayed by soft employment and elevated price‑pressure readings.
The Dollar Index (DXY)
Key news events today
ISM Services PMI (2:00 pm GMT)
What can we expect from DXY today?
The U.S. dollar is trading on a relatively firm footing, supported by Middle‑East‑driven safe‑haven flows and a still‑restrictive Fed stance that has kept real yields elevated, even as traders debate whether the Dollar Index can break through mid‑99 resistance or roll over if conflict‑risk subsides and global‑growth worries grow.
Central Bank Notes:
- The Federal Open Market Committee (FOMC) is widely expected to hold the federal funds rate target range steady at 3.50%–3.75% at its March 17–18, 2026, meeting, amid rising oil prices from the US-Israel war against Iran and persistent inflation pressures, delaying any 2026 cuts potentially to September.
- The Committee continues to pursue maximum employment and 2% inflation goals, with the labor market weakening further as nonfarm payrolls declined by 92,000 in February 2026 and the unemployment rate rose to 4.4% from 4.3% in January.
- Officials face tilted risks from geopolitical tensions, elevated oil prices, and sticky inflation, with CPI steady at 2.4% year-over-year in February 2026, headline PCE at 2.8% in January, and core PCE rising to 3.1%.
- Economic activity has cooled after robust Q4 2025 growth of nearly 5%, with the Atlanta Fed GDPNow now estimating Q1 2026 growth at around 2.1%–2.7% amid softer consumer spending and labour data.
- December 2025’s Summary of Economic Projections forecasts 2025 unemployment at a median of 4.5%, 2026 GDP growth at 2.3%, and core PCE at 2.5%, with the dot plot signalling one more cut in 2026 to a median 3.4% funds rate; March updates may reflect softer labor and inflation upticks.
- The Committee maintains its data-dependent stance amid a softening labor market, inflation above target, and new oil shocks, likely holding rates at 3.50%-3.75% with ongoing divisions and possible hawkish dissents on rate cuts.
- The FOMC continues its adjusted quantitative tightening, with Treasury rolloff caps at $5 billion per month and agency MBS at $35 billion per month to ensure ample reserves post-2025 program adjustments.
- The next meeting is scheduled for 28 to 29 April 2026.
Next 24 Hours Bias
Medium Bullish
Gold (XAU)
Key news events today
ISM Services PMI (2:00 pm GMT)
What can we expect from Gold today?
Gold is consolidating in an elevated but narrower band after a spectacular rally earlier in the year, with prices around the 4,600–4,700‑dollar‑per‑ounce range following a pullback from record highs above 5,000; the retreat over the past month reflects reduced panic from Middle‑East tensions and some central‑bank profit‑taking.
Next 24 Hours Bias
Weak Bullish
The Euro (EUR)
Key news events today
No major news event
What can we expect from EUR today?
The euro is edging lower versus the dollar (around 1.1510 in EUR/USD), reflecting a still‑strong dollar backdrop, thin Easter‑weekend liquidity, and lingering geopolitical risks in the Middle East and eastern Europe, while euro‑zone policymakers try to manage energy‑price pressures and fiscal strains that continue to cap the currency’s upside despite some short‑term bounce‑back attempts.
Central Bank Notes:
- The Governing Council of the ECB is expected to keep the three key interest rates unchanged at its 29–30 April 2026 meeting, with the main refinancing rate at 2.15%, marginal lending facility at 2.40%, and deposit facility at 2.00%. This reflects an ongoing commitment to 2% inflation stability amid heightened uncertainties from Middle East tensions and US trade policies under President Trump. Market probabilities indicate around 58% odds of no change, though some banks now price in potential hikes due to rising inflation risks.
- Price dynamics show increasing upside pressures, with headline HICP inflation likely around 2.0-2.2% in early 2026, driven by energy costs from Middle East conflicts offsetting euro strength. Core inflation remains sticky but moderating slowly, with projections revised upward to 2.6% for 2026 overall amid hawkish signals from ECB leadership.
- Updated Eurosystem staff projections for April 2026 may forecast headline inflation at 2.1-2.2% in 2026, 1.9% in 2027, and 2.0% in 2028, with upside risks from energy and trade dominating balanced prior views. A stronger euro provides some counterbalance, but recent data revisions highlight persistent pressures.
- Euro area GDP growth holds steady, with Q2 2026 surveys suggesting 0.2-0.3% qoq growth, in line with 1.1-1.3% annual forecasts through 2027. Defence spending, infrastructure, and low unemployment support resilience against trade headwinds and softer external demand.
- The labour market remains tight, with unemployment steady near 6.4%, bolstered by wage growth and participation gains. Supportive credit conditions continue aiding investment and consumption despite global risks.
- Business sentiment is cautious amid US tariffs, geopolitical flare-ups, and supply chain easing; a somewhat weaker euro boosts exports, while fiscal measures aid domestic activity.
- The Governing Council maintains its data-dependent, meeting-by-meeting stance, scrutinizing inflation, transmission, and external shocks without pre-committing to rate paths.
- Balance sheet normalization advances smoothly, with APP/PEPP wind-downs complete and no liquidity issues; banks show ample reserves and stable funding access.
The next meeting is on 29 April 2026
Next 24 Hours Bias
Weak Bearish
The Swiss Franc (CHF)
Key news events today
No major news event
What can we expect from CHF today?
Today, the Swiss franc is consolidating after a dynamic start to 2026, with the currency slightly softer versus the dollar amid renewed U.S.‑dollar strength and the SNB’s explicit willingness to curb excessive appreciation, while still underpinned by its safe‑haven status and Switzerland’s solid external position against the euro and other majors.
Central Bank Notes:
- At its monetary policy assessment on 19 March 2026, the Swiss National Bank (SNB) is widely expected to leave the policy rate unchanged at 0%, continuing the extended pause since September 2025, as the Governing Board assesses current settings as adequate to maintain inflation near the target without resorting to negative rates.
- Inflation data since December indicate persistent weakness, with headline CPI hovering around 0% year-on-year through early 2026 and core measures subdued at roughly 0.4%, underscoring limited price pressures and lingering, though contained, deflation risks.
- The SNB’s updated conditional inflation forecast shows minimal change from December, with averages of about 0.2% in 2025 (now complete), 0.3% in 2026, and 0.6% in 2027 under a steady 0% policy rate. However, recent flat CPI readings may slightly lower near-term expectations, preserving scope for further easing if needed.
- Global conditions remain challenging, marked by U.S. tariff escalations under President Trump, subdued external demand, and uncertainties in major export markets such as Europe and the U.S., prompting the SNB to exercise caution despite resilient Swiss domestic activity.
- Sentiment in manufacturing and export sectors stays soft amid franc appreciation and weaker foreign orders, squeezing margins. Yet, overall GDP growth is expected to be around 1.5% in 2026, with unemployment edging up modestly from historic lows.
- The SNB reaffirms its readiness to intervene via rate cuts or FX operations should deflationary pressures intensify, while emphasizing clear communication through detailed meeting minutes and coordination with global partners on currency matters.
The next meeting is on 18 June 2026.
Next 24 Hours Bias
Medium Bearish
The Pound (GBP)
Key news events today
No major news event
What can we expect from GBP today?
The British pound is trading in a cautious, range‑bound environment against the US dollar, broadly around the mid‑1.31 to mid‑1.32 area on GBP/USD, after recently giving up some earlier gains and reflecting a mix of still‑tighter‑than‑expected UK rate expectations and broader risk‑off pressures from geopolitical tensions in the Middle East and US‑led military posturing.
Central Bank Notes:
- The Bank of England’s Monetary Policy Committee (MPC) met on 19 March 2026, maintaining the Bank Rate at 3.75 per cent in a unanimous decision, following the prior narrow 5–4 vote to hold at the 5 February 2026 meeting. This pause reflects a sharp reversal from earlier market expectations of a 25-basis-point cut, driven by a Middle East conflict sparking global energy and commodity price surges. The March meeting did not include a Monetary Policy Report, with the next one due in April.
- Quantitative tightening (QT) proceeds unchanged at the 2025 pace of gilt holdings reductions, maintaining gradual balance-sheet normalization attuned to liquidity conditions and supportive of a restrictive stance amid new shocks.
- Headline CPI inflation faces near-term upside from the energy shock, reversing prior disinflation trends in domestic prices and wages; pre-shock services inflation had eased but now contends with higher utility and input costs, keeping pressures above the 2 per cent target. MPC projections will update in April, but analysts see inflation at 3-4 per cent by the end of 2026.
- UK growth softens further into Q2 2026, with unemployment risks rising amid potential confidence drops, higher precautionary saving, and widening output gaps; regular pay growth had cooled pre-shock but now faces business cost pass-through.
- Global headwinds intensify via Middle East conflict, driving volatile energy/commodity prices and sterling/gilt swings; MPC deems direct shocks manageable if demand weakens sufficiently to limit second-round effects.
- Inflation risks now tilt upside from energy persistence and potential wage/cost embedding, offset by downside from demand slack and job losses; prior balance has shifted amid uncertainty on shock duration.
- The MPC adopts a wait-and-see posture post-shock, with policy deemed somewhat restrictive pre-event; all members are ready to act data-dependently for 2 per cent sustainability, eyeing April for fuller impact analysis and possible easing if disinflation resumes. Governor Bailey’s guidance stresses close monitoring without firm-cut commitments.
- The next meeting is on 30 April 2026.
Next 24 Hours Bias
Weak Bearish
The Canadian Dollar (CAD)
Key news events today
No major news event
What can we expect from GBP today?
The Canadian dollar is trading in a narrow band versus the US dollar on Monday, 6 April 2026, with USD/CAD near 1.39 as supportive oil prices offset a firmer greenback and regional geopolitical tensions. Over the past month, the loonie has eased modestly, but it remains up over the past year and is seen as range‑bound in the near term, with upcoming trade and labour‑market data likely to determine whether the balance of risks shifts more toward CAD upside or further USD‑driven pressure.
Central Bank Notes:
- The Governing Council held the overnight rate target steady at 2.25% at its 25 March 2026 meeting, aligning with consensus forecasts and extending the pause in policy adjustments amid balanced risks. The Bank emphasized persistent global uncertainties from Middle East conflicts and U.S. trade policies under President Trump, but affirmed the current stance supports ongoing disinflation without immediate shifts despite elevated energy price volatility.
- U.S. tariff threats and regional geopolitical tensions continue weighing on business sentiment, though Canadian manufacturing PMI has edged higher into expansion territory, with export orders firming on energy demand. Goods exports, led by crude oil, sustained momentum into February, offsetting cautious capex as firms prioritize resilience over aggressive growth.
- Economic growth carried into Q1 2026 at an annualized pace of around 2.2%, building on Q4 2025’s solid performance, fueled by resource exports, government outlays, and manufacturing rebound. February preliminary data points to steady expansion, though winter weather and supply chain frictions modestly curbed potential upside.
- Services sector PMI climbed further above 50, with broad gains in tech, hospitality, and business services; consumer-facing areas showed tentative improvement as real wages rose, though high service costs still restrain discretionary outlays. The Bank sees this diffusion as evidence of rebalancing toward sustainable activity.
- National housing resales ticked up in January-February alongside modest price gains, buoyed by stable rates and improved affordability in select regions, while inventory buildup in urban centers prevents excessive tightening. Officials anticipate continued moderation, aided by prudent mortgage rules amid steady household formation.
- Headline CPI eased to about 2.1% year-over-year in February 2026 estimates, staying within the control band, as core gauges like CPI-trim and median dipped to near 2.7% on softer food and durable goods pressures—despite sticky shelter costs. This reinforces the Bank’s view of inflation sustainably approaching the target.
- Policymakers reiterated that 2.25% remains well-calibrated to anchor 2% inflation and foster adjustment, with no cuts signaled barring downside surprises in growth or prices. Attention now turns to Q2 durability, core inflation persistence, and evolving trade/geopolitical clarity.
- The next meeting is on 23 April 2026.
Next 24 Hours Bias
Weak Bearish
Oil
Key news events today
No major news event
What can we expect from Oil today?
Global oil prices remain elevated as traders weigh the outcome of President Trump’s 6 April deadline for Iran to reopen the Strait of Hormuz, with the threat of strikes on Kharg Island keeping WTI near the low‑$100s and Brent on pace for its largest monthly rise in history. Record freight rates and a strained global supply chain reflect rerouting and insurance costs linked to Middle East tensions, prompting the IEA and EIA to warn of a deepening supply‑side crunch in April despite expectations that higher prices will eventually curb demand and support more supply later in 2026.
Next 24 Hours Bias
Strong Bullish
The post IC Markets Global – Europe Fundamental Forecast | 06 April 2026 first appeared on IC Your Trading Edge | Official Blog.
The Week Ahead – Week Commencing 06 April 2026
429229 April 6, 2026 19:00 ICMarkets Market News
Markets remained highly volatile in the last week as the conflict in the Middle East raged on, with a major update from President Trump midweek advising that Iran would be hit hard for another two to three weeks, knocking investor confidence that a speedy end was in sight. Key US employment data that came in much better than expected; Non-Farms beating expectations by over 100k and the Unemployment Rate dropping by 0.1%, may filter through more strongly in the first couple of days of this trading week due to holiday-affected markets. Once again, geopolitical updates are expected to dominate the market this week; however, there are some major data releases due out of the US again, with the two major inflation updates set to come on consecutive days later in the week. Traders will be closely monitoring both the PCE and CPI numbers for any impact from the Middle East conflict.
Here is our usual day-by-day breakdown of the major risk events this week:

Easter Monday holidays in several major centres are again expected to see very thin trading conditions on Monday, which could see moves exacerbated as traders react to updates over the weekend, as well as any fresh updates during the trading day. The return of US markets in the final session of the day could add to volatility as they react to recent geopolitical updates, as well as Friday’s Non-Farms update. ISM Services PMI data is also due out.

Tuesday sees the resumption of ‘normal’ trading conditions, with most centres returning to action. There is little on the calendar in both the Asian and London sessions; however, US Durable Goods data is due out early in the day in the New York time zone, as is the Canadian Ivey PMI data.

The Asian session will see a strong focus on New Zealand markets on Wednesday, with the RBNZ set to update the market on its latest interest rate decision. It’s a long wait for anything of note on the calendar for the rest of the day, with US Crude Oil Inventory numbers due out in the New York session, followed later in the day by the key FOMC Meeting Minutes release.

Again, the first two sessions of the day have little to offer on the calendar; however, key US data in the New York session will be a major focus. The Fed’s favoured inflation indicator, the Core PCE Price Index, is due out alongside the GDP data and Weekly Unemployment Claims numbers, and expect the PCE print to have the greater impact, especially if off expectations.

Another busy calendar Friday to end the week. The Asian session will see a focus on Chinese markets, with the key CPI and PPI data releases due to fall midway through the session. Again, there is very little to note during the London session, but we have key data due out once New York opens. The US CPI data is out early in the day at the same time as the Canadian Employment numbers, while later in the day, the Preliminary University of Michigan Consumer Sentiment and Inflation Expectations data will be released.
The post The Week Ahead – Week Commencing 06 April 2026 first appeared on IC Your Trading Edge | Official Blog.
General Market Analysis – 6/04/26
429228 April 6, 2026 19:00 ICMarkets Market News
Strong Non-Farms Surprises Market – DXY up 0.16%
Global financial markets closed out last week in subdued fashion, with several major financial centres offline for the Easter holiday, leading to thin liquidity and limited price action across key asset classes. With US equity markets closed, investor focus shifted toward geopolitical developments in the Middle East and the release of key US labour market data. Despite the holiday conditions, the US Non-Farm Payrolls report delivered a significant upside surprise, printing at 178k against expectations of just 65k, while the Unemployment Rate edged lower to 4.3%. The stronger data prompted a move higher in US Treasury yields, with the 2-year rising 4.3 basis points to 3.840% and the 10-year climbing 3.6 basis points to 4.341%. The US dollar also strengthened, the DXY gaining 0.16% to close at 100.19.
Oil Moves Remain the Major Focus for Traders
Oil prices have dictated most of the major moves that we have seen over the past few weeks as the war in the Middle East has escalated, and that pattern looks set to continue in the days ahead after President Trump raised the stakes again in an expletive-laden post yesterday. Oil markets have kicked off the week on the front foot today after the comments. Brent crude pushed up $2.40, or 2.2%, to $111.43 a barrel, while U.S. WTI outperformed, rallying $3.00, or 2.7%, to trade at $114.57 per barrel. The move highlights just how sensitive energy markets remain to developments in the Middle East, with supply concerns firmly back in focus and volatility expected to remain elevated in the sessions ahead. Further moves north for oil should see the recent pattern of more USD appreciation, pressure on global stocks, and downside for gold. If, however, we see a deal between the US and Iran, or this turns out to be another TACO trade, then we could see some sharp corrections in the other direction in the next few days.
Potential for Volatility in Holiday-Thinned Markets Today
Over the weekend, geopolitical tensions intensified further after President Trump issued an ultimatum to Iran, demanding the reopening of the Strait of Hormuz by Tuesday. This escalation has driven a volatile start to the new trading week, with early flows supporting both oil prices and the US dollar. Looking ahead, trading conditions are expected to remain uneven, with many global markets still closed for the Easter holiday period. However, the reopening of US markets later today is likely to inject fresh liquidity and could see more pronounced moves across asset classes. While the economic calendar is relatively light, the release of the US ISM Services PMI (exp. 54.8) will be in focus, alongside ongoing geopolitical developments which continue to dominate market sentiment.
The post General Market Analysis – 6/04/26 first appeared on IC Your Trading Edge | Official Blog.
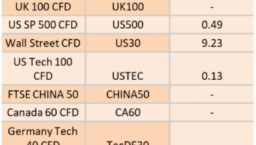
Ex-Dividend 7/04/2026
429226 April 6, 2026 18:40 ICMarkets Market News
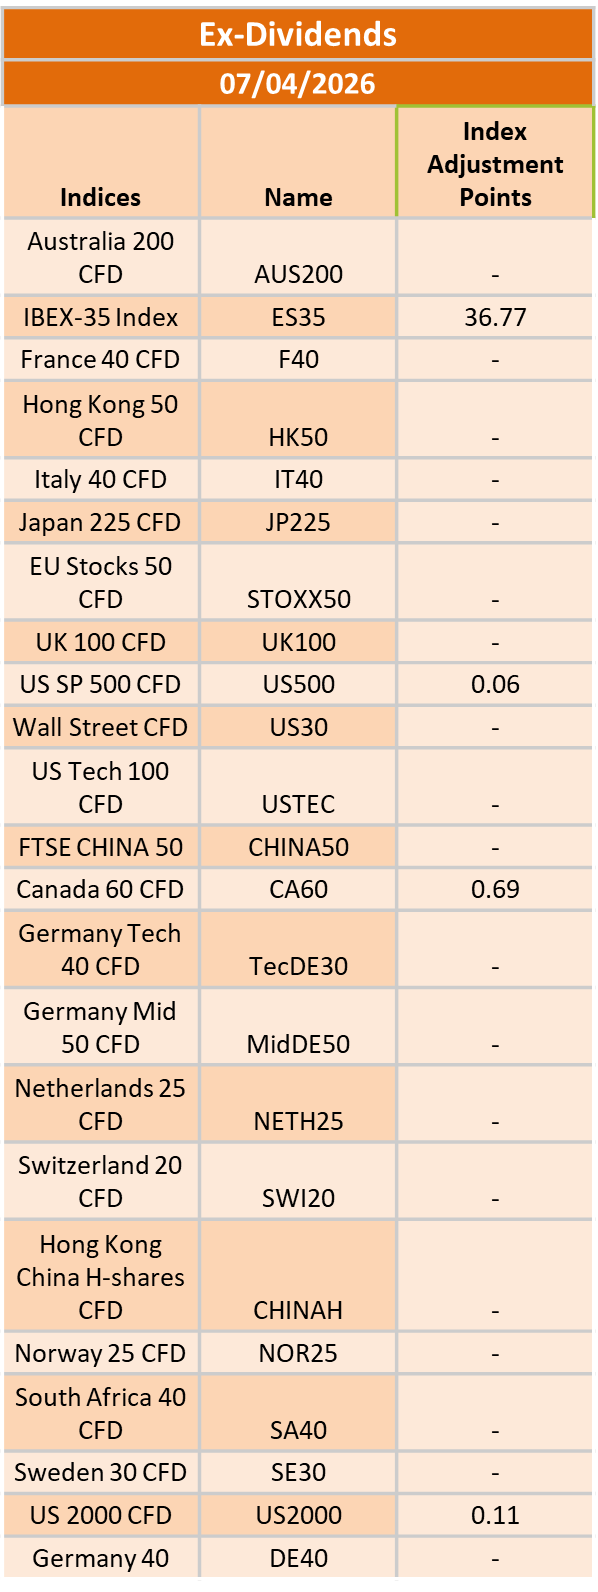
The post Ex-Dividend 7/04/2026 first appeared on IC Your Trading Edge | Official Blog.
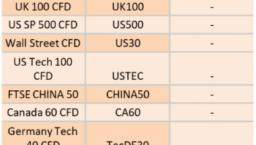
Ex-Dividend 6/04/2026
429224 April 6, 2026 18:40 ICMarkets Market News
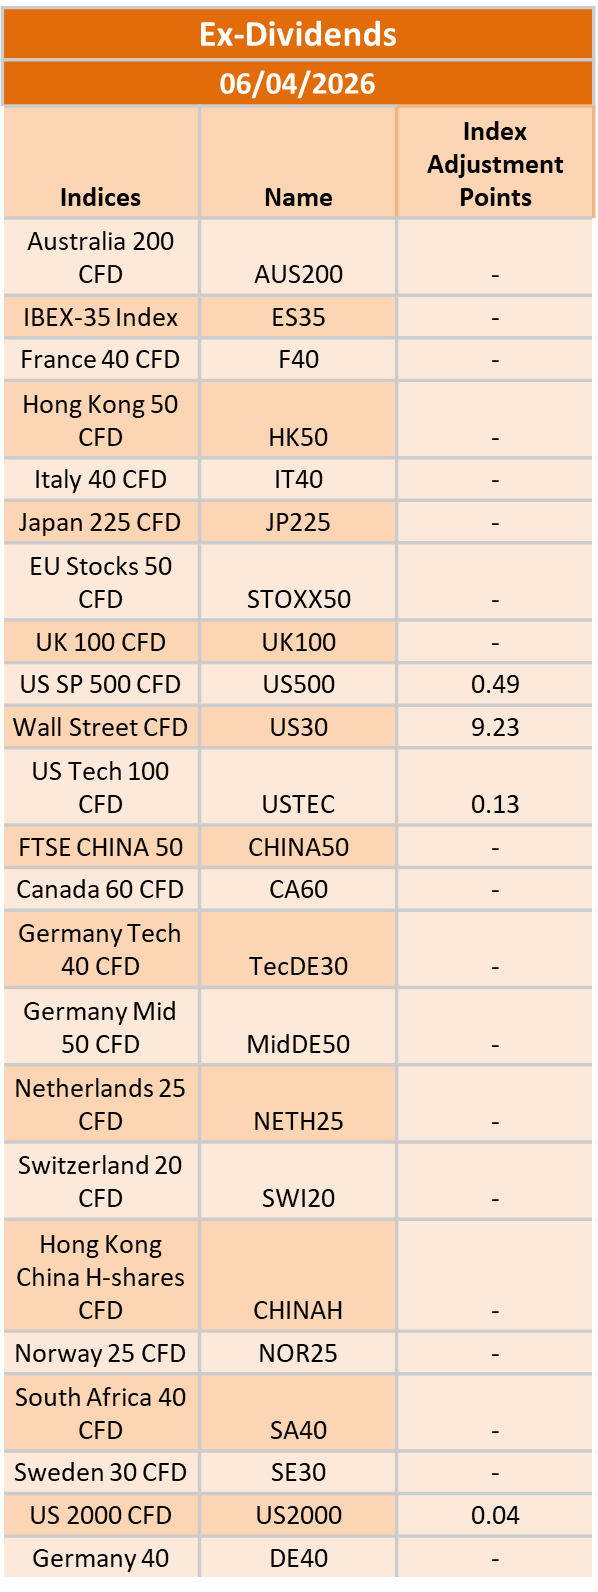
The post Ex-Dividend 6/04/2026 first appeared on IC Your Trading Edge | Official Blog.
Ex-Dividend 3/04/2026
429199 April 2, 2026 18:00 ICMarkets Market News
The post Ex-Dividend 3/04/2026 first appeared on IC Your Trading Edge | Official Blog.
Thursday 2nd April 2026: Technical Outlook and Review
429181 April 2, 2026 16:00 ICMarkets Market News
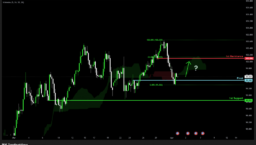
DXY (U.S. Dollar Index):
Potential Direction: Bullish
Overall momentum of the chart: Bearish
The price could see a short-term pullback toward the pivot before rising again toward the 1st resistance.
Pivot: 99.44
Supporting reasons: Identified as a pullback support, where renewed buying pressure could emerge to push the price higher.
1st support: 98.85
Supporting reasons: Identified as a pullback support, indicating a potential area where the price could again stabilize.
1st resistance: 100.09
Supporting reasons: Identified as a pullback resistance that aligns with the 61.8% Fibonacci retracement, indicating a potential area that could halt any further upward movement
EUR/USD:
Potential Direction: Bullish
Overall momentum of the chart: Bullish
The price could see a short-term pullback toward the pivot before rising again toward the 1st resistance.
Pivot: 1.1580
Supporting reasons: Identified as a pullback support, where renewed buying pressure could emerge to push the price higher.
1st support: 1.1515
Supporting reasons: Identified as a pullback support, indicating a potential level where the price could stabilize once again.
1st resistance: 1.1679
Supporting reasons: Identified as a pullback resistance that aligns with the 127.2% Fibonacci extension, indicating a potential level that could cap further upward movement.
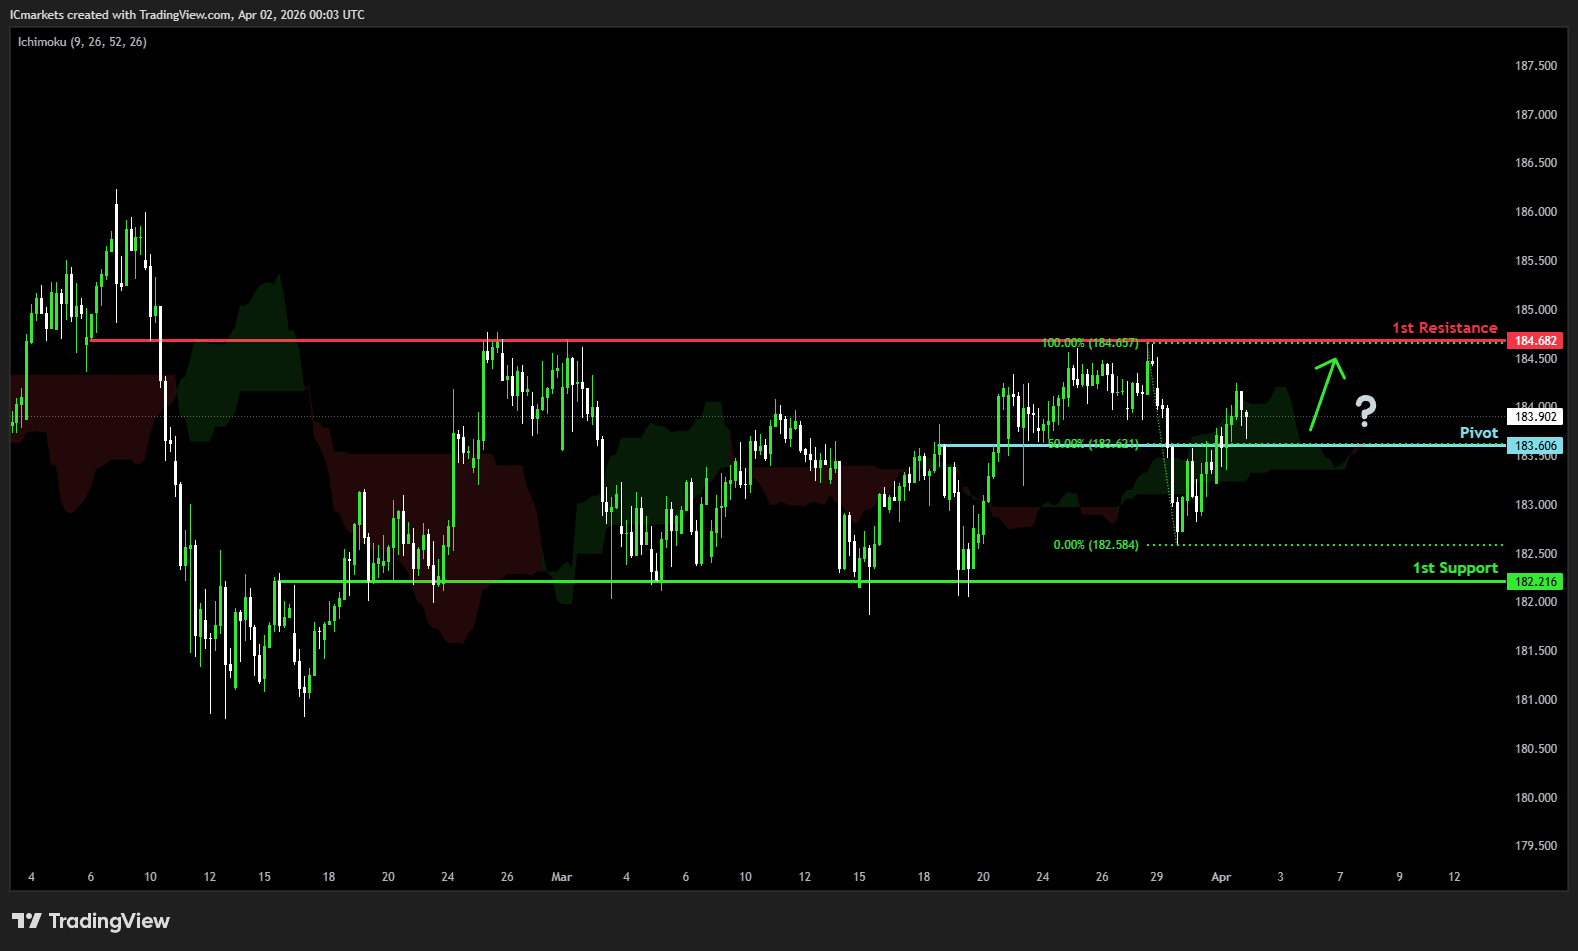
EUR/JPY:
Potential Direction: Bullish
Overall momentum of the chart: Bullish
The price could see a short-term pullback toward the pivot before rising again toward the 1st resistance.
Pivot: 183.60
Supporting reasons: Identified as a pullback support that aligns with the 50% Fibonacci retracement, where renewed buying pressure could emerge to push the price higher.
1st support: 182.21
Supporting reasons: Identified as an overlap support, indicating a potential area where the price could again stabilize.
1st resistance: 184.68
Supporting reasons: Identified as an overlap resistance, indicating a potential level that could cap further upward movement.
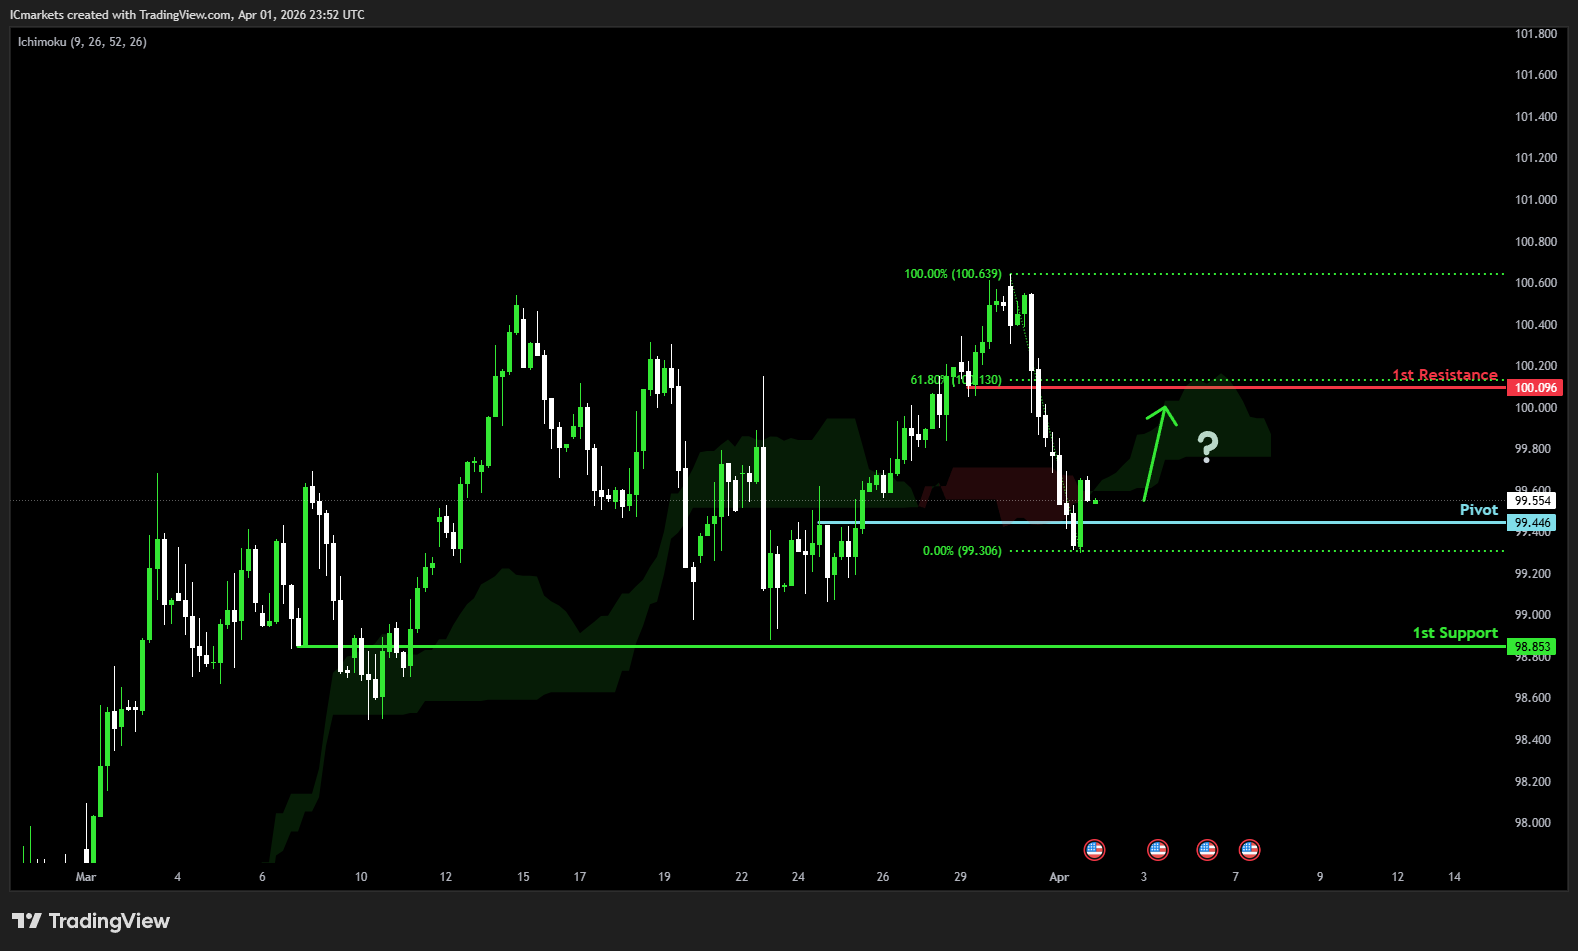
EUR/GBP:
Potential Direction: Bullish
Overall momentum of the chart: Bullish
The price could see a short-term pullback toward the pivot before rising again toward the 1st resistance.
Pivot: 0.8690
Supporting reasons: Identified as a pullback support, where renewed buying pressure could emerge to push the price higher.
1st support: 0.8660
Supporting reasons: Identified as an overlap support, indicating a potential area where the price could stabilize once more.
1st resistance: 0.8747
Supporting reasons: Identified as a pullback resistance, indicating a potential level that could cap further upward movement.
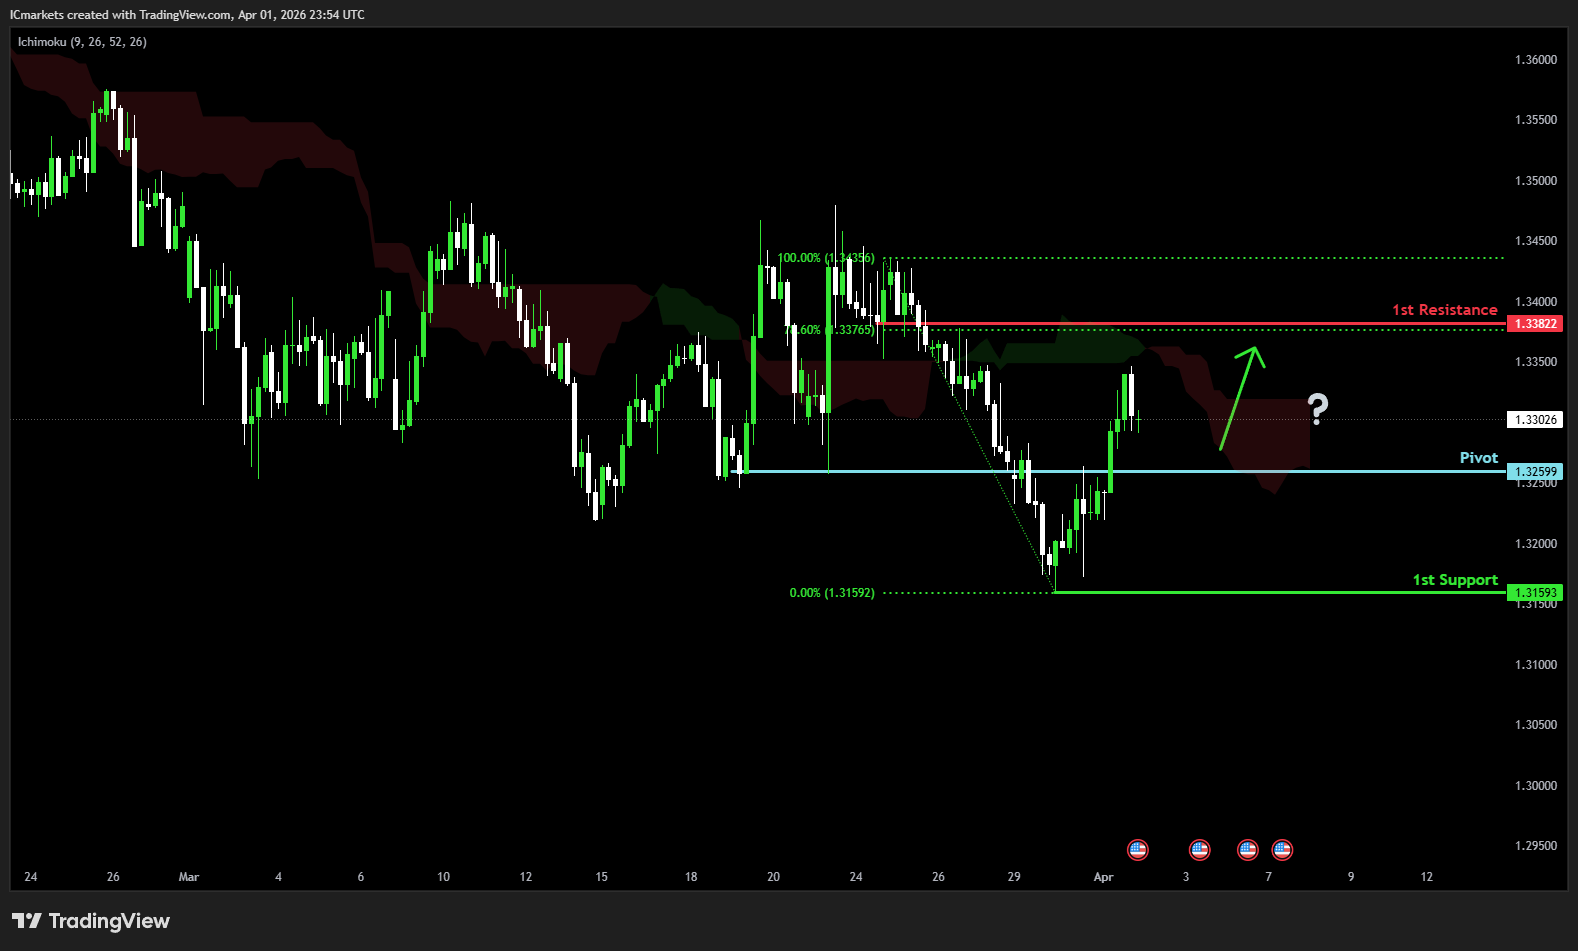
GBP/USD:
Potential Direction: Bullish
Overall momentum of the chart: Bullish
The price could see a short-term pullback toward the pivot before rising again toward the 1st resistance.
Pivot: 1.3259
Supporting reasons: Identified as a pullback support, where renewed buying pressure could emerge to push the price higher.
1st support: 1.3159
Supporting reasons: Identified as a swing low support, indicating a potential area where the price could stabilize once more.
1st resistance: 1.3382
Supporting reasons: Identified as a pullback resistance that aligns with the 78.6% Fibonacci retracement, indicating a potential level that could halt further upward movement.
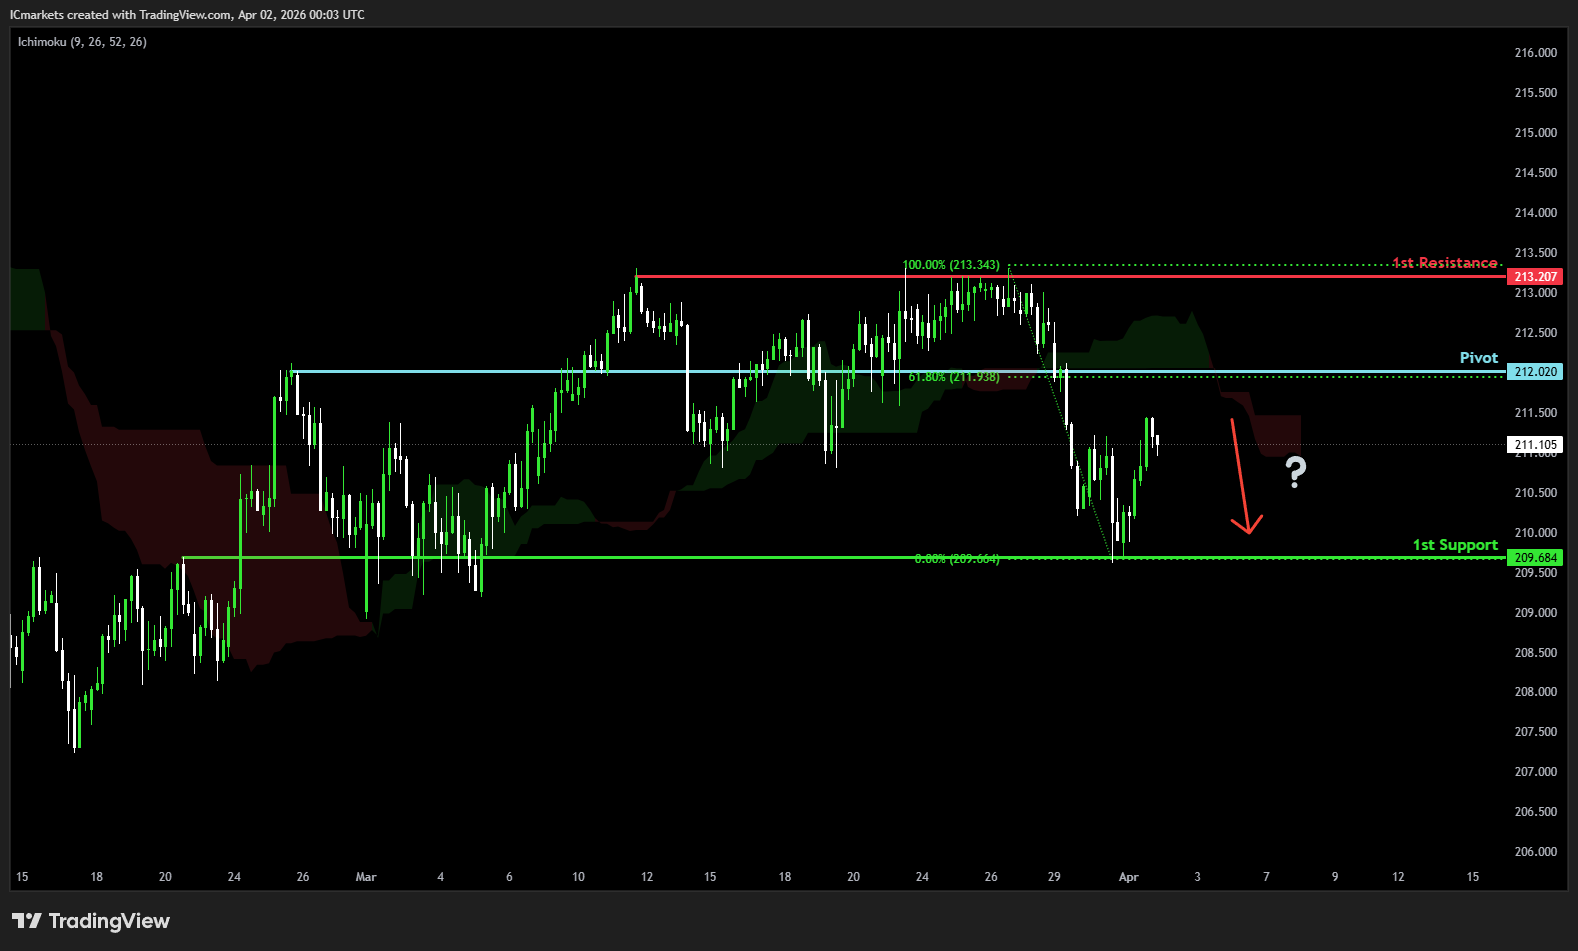
GBP/JPY:
Potential Direction: Bearish
Overall momentum of the chart: Bullish
The price could see a short-term pullback toward the pivot before rising again toward the 1st resistance.
Pivot: 211.05
Supporting reasons: Identified as an overlap resistance that aligns with the 61.8% Fibonacci retracement, where selling pressures could intensify and potentially cap any upward retracement.
1st support: 209.68
Supporting reasons: Identified as an overlap support, indicating a potential level where the price could stabilize once more.
1st resistance: 21320
Supporting reasons: Identified as a swing high resistance, indicating a potential level that could halt further upward movement.
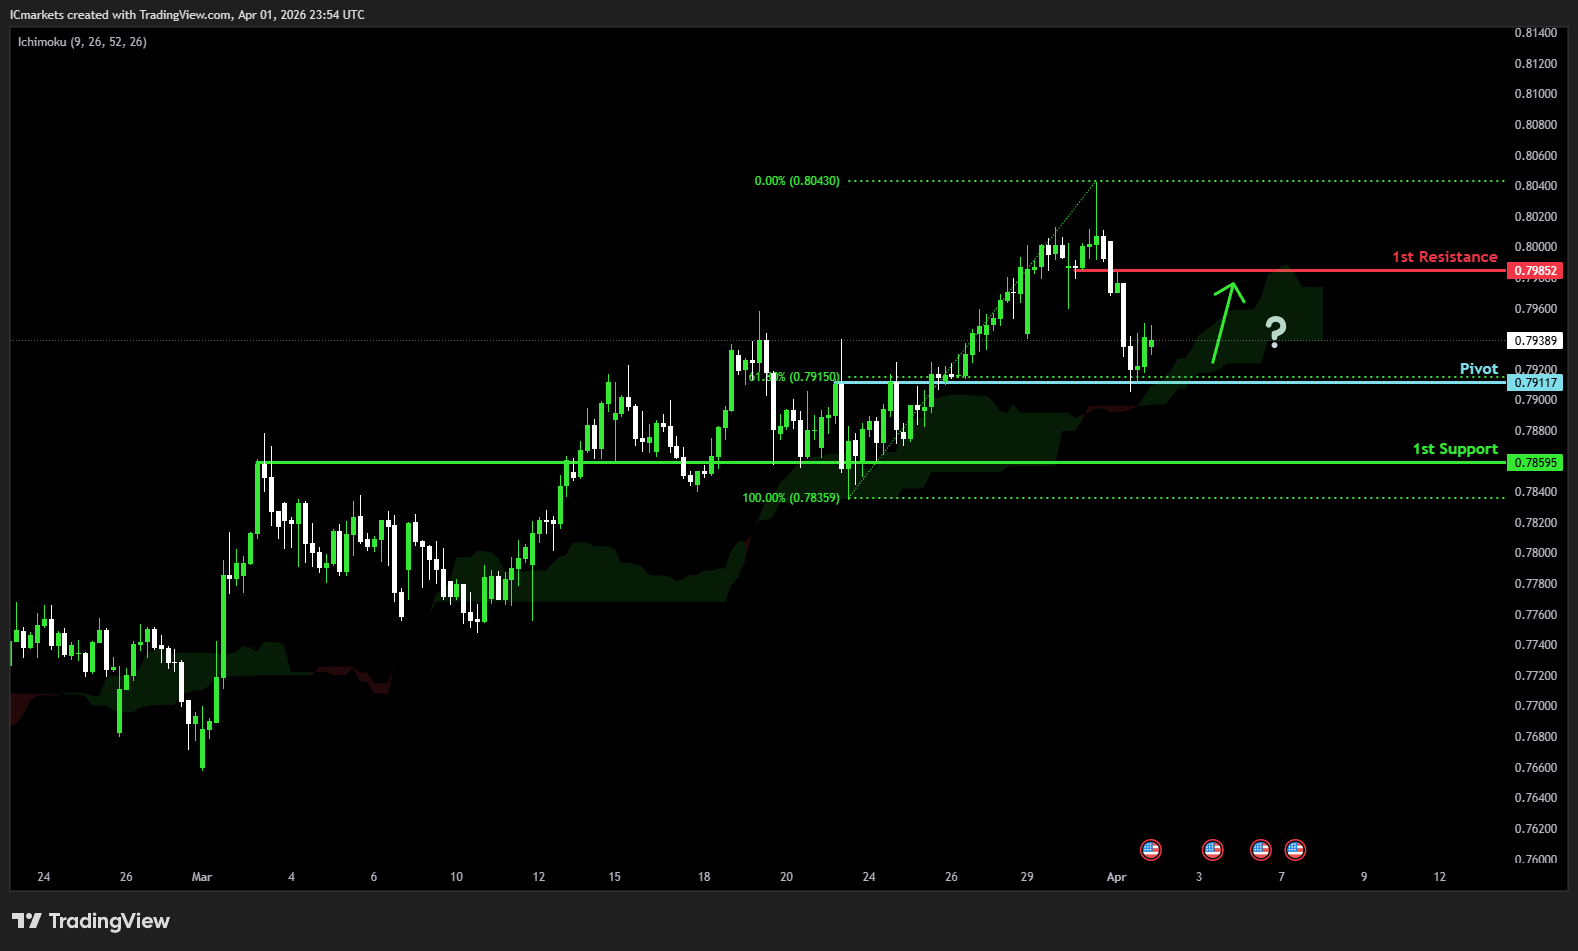
USD/CHF:
Potential Direction: Bullish
Overall momentum of the chart: Bearish
The price has already bounced off the pivot and may continue its bullish move toward the 1st resistance
Pivot: 0.7911
Supporting reasons: Identified as an overlap support that aligns with the 61.8% Fibonacci retracement, where renewed buying pressure could emerge to push the price higher.
1st support: 0.7859
Supporting reasons: Identified as an overlap support, indicating a potential level where the price could stabilize once again.
1st resistance: 0.7985
Supporting reasons: Identified as a pullback resistance, indicating a potential level that could cap further upward movement.
USD/JPY:
Potential Direction: Bearish
Overall momentum of the chart: Bullish
The price could see a short-term pullback toward the pivot before rising again toward the 1st resistance.
Pivot: 159.17
Supporting reasons: Identified as a pullback resistance, where selling pressures could intensify and potentially cap any upward retracement.
1st support: 157.64
Supporting reasons: Identified as an overlap support, indicating a strong area where buyers might return, and the price could stabilize once again.
1st resistance: 160.46
Supporting reasons: Identified as an overlap resistance. This level represents the next key area where upward movement could be capped amid increased selling pressure
USD/CAD:
Potential Direction: Bullish
Overall momentum of the chart: Bullish
The price could see a short-term pullback toward the pivot before rising again toward the 1st resistance.
Pivot: 1.3842
Supporting reasons: Identified as an overlap support, where renewed buying pressure could emerge to push the price higher.
1st support: 1.3739
Supporting reasons: Identified as a pullback support, indicating a key level where the price could stabilize once more.
1st resistance: 1.3946
Supporting reasons: Identified as a swing high resistance, making it a possible target for bullish advances and a level where some sellers could return to cap gains
AUD/USD:
Potential Direction: Bearish
Overall momentum of the chart: Bullish
The price has already reacted off the pivot and may continue its bearish move toward the 1st support.
Pivot: 0.6954
Supporting reasons: Identified as an overlap resistance, where selling pressures could intensify and potentially cap any upward retracement.
1st support: 0.6843
Supporting reasons: Identified as a multi-swing low support, this area has provided strong support historically and may attract buying interest for a potential short-term bounce
1st resistance: 0.7013
Supporting reasons: Identified as an overlap resistance, indicating a potential area that could halt any further upward movement.
NZD/USD
Potential Direction: Bearish
Overall momentum of the chart: Bullish
The price has already reacted off the pivot and may continue its bearish move toward the 1st support.
Pivot: 0.5773
Supporting reasons: Identified as an overlap resistance, where selling pressures could intensify and potentially cap any upward retracement.
1st support: 0.5699
Supporting reasons: Identified as a multi-swing low support, this area has provided strong support historically and may attract buying interest for a potential short-term bounce
1st resistance: 0.5813
Supporting reasons: Identified as a pullback resistance, indicating a potential area that could halt any further upward movement.
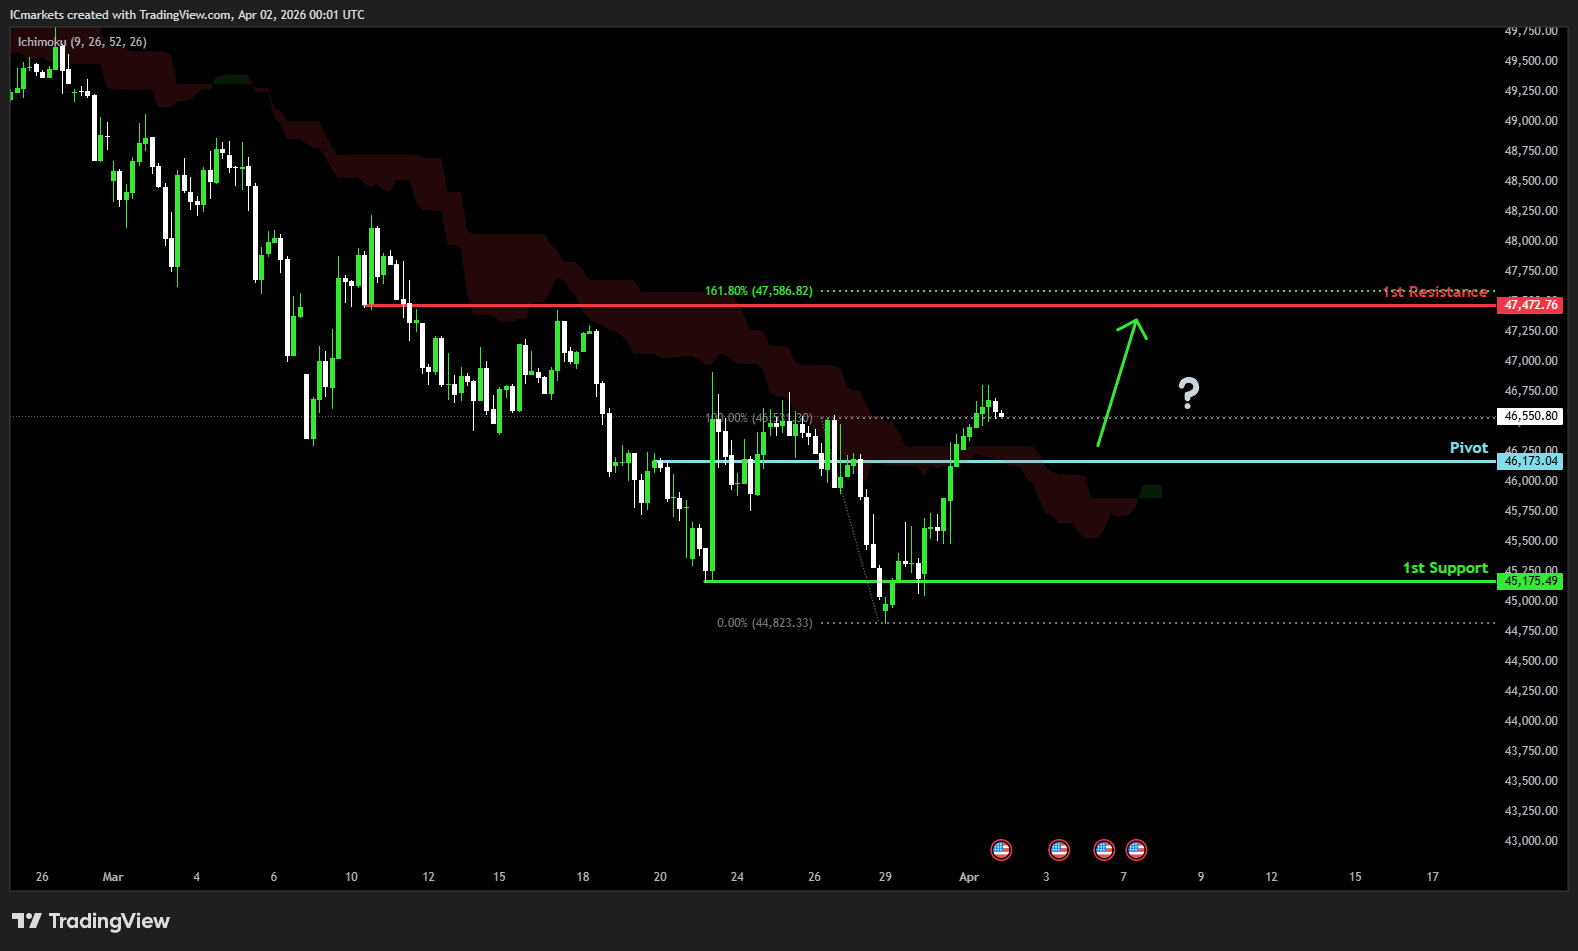
US30 (DJIA):
Potential Direction: Bullish
Overall momentum of the chart: Bullish
The price could see a short-term pullback toward the pivot before rising again toward the 1st resistance.
Pivot: 46,173.04
Supporting reasons: Identified as a pullback support, where renewed buying pressure could emerge to push the price higher.
1st support: 45,175.49
Supporting reasons: Identified as a pullback support, suggesting a potential area where the price could stabilize once again.
1st resistance: 47,472.76
Supporting reasons: Identified as an overlap resistance, indicating a potential area that could halt any further upward movement.
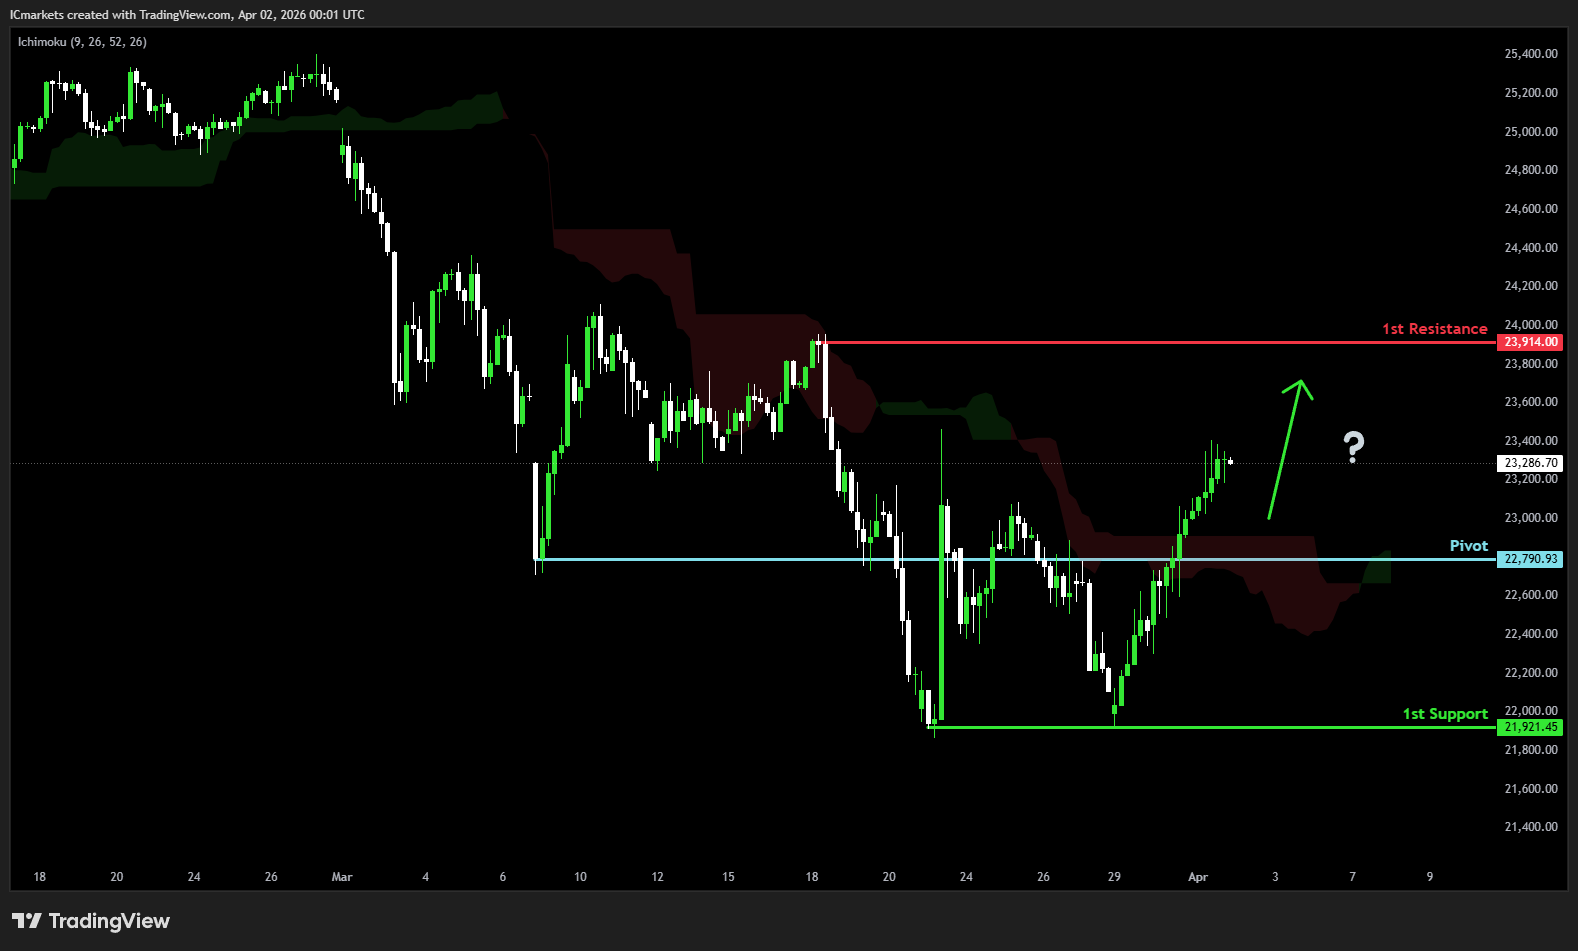
DE40 (DAX):
Potential Direction: Bullish
Overall momentum of the chart: Bullish
The price could see a short-term pullback toward the pivot before rising again toward the 1st resistance.
Pivot: 22,790.93
Supporting reasons: Identified as a pullback support, where renewed buying pressure could emerge to push the price higher.
1st support: 21,921.45
Supporting reasons: Identified as a swing low support, indicating a key level where the price could stabilize once more.
1st resistance: 23,914.00
Supporting reasons: Identified as a swing high resistance, indicating a potential area that could halt any further upward movement.
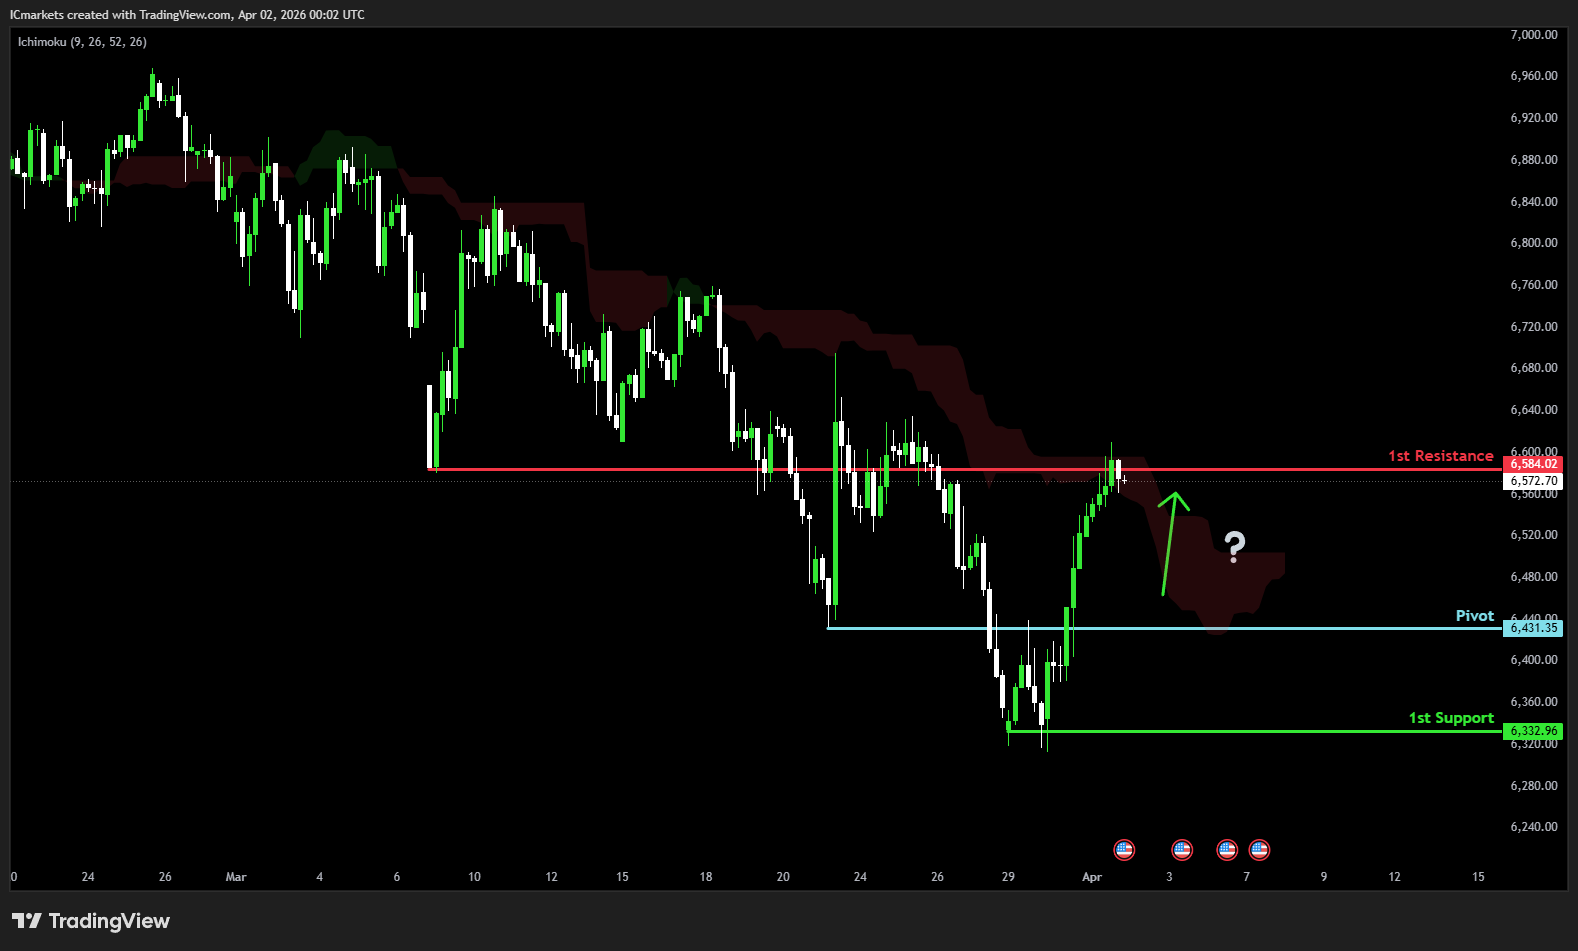
US500 (S&P 500):
Potential Direction: Bullish
Overall momentum of the chart: Bullish
The price could see a short-term pullback toward the pivot before rising again toward the 1st resistance.
Pivot: 6,431.35
Supporting reasons: Identified as a pullback support, where renewed buying pressure could emerge to push the price higher.
1st support: 6,332.96
Supporting reasons: Identified as a swing high support, indicating a potential level where the price could stabilize once again.
1st resistance: 6,584.02
Supporting reasons: Identified as a pullback resistance, indicating a potential area that could halt any further upward movement.
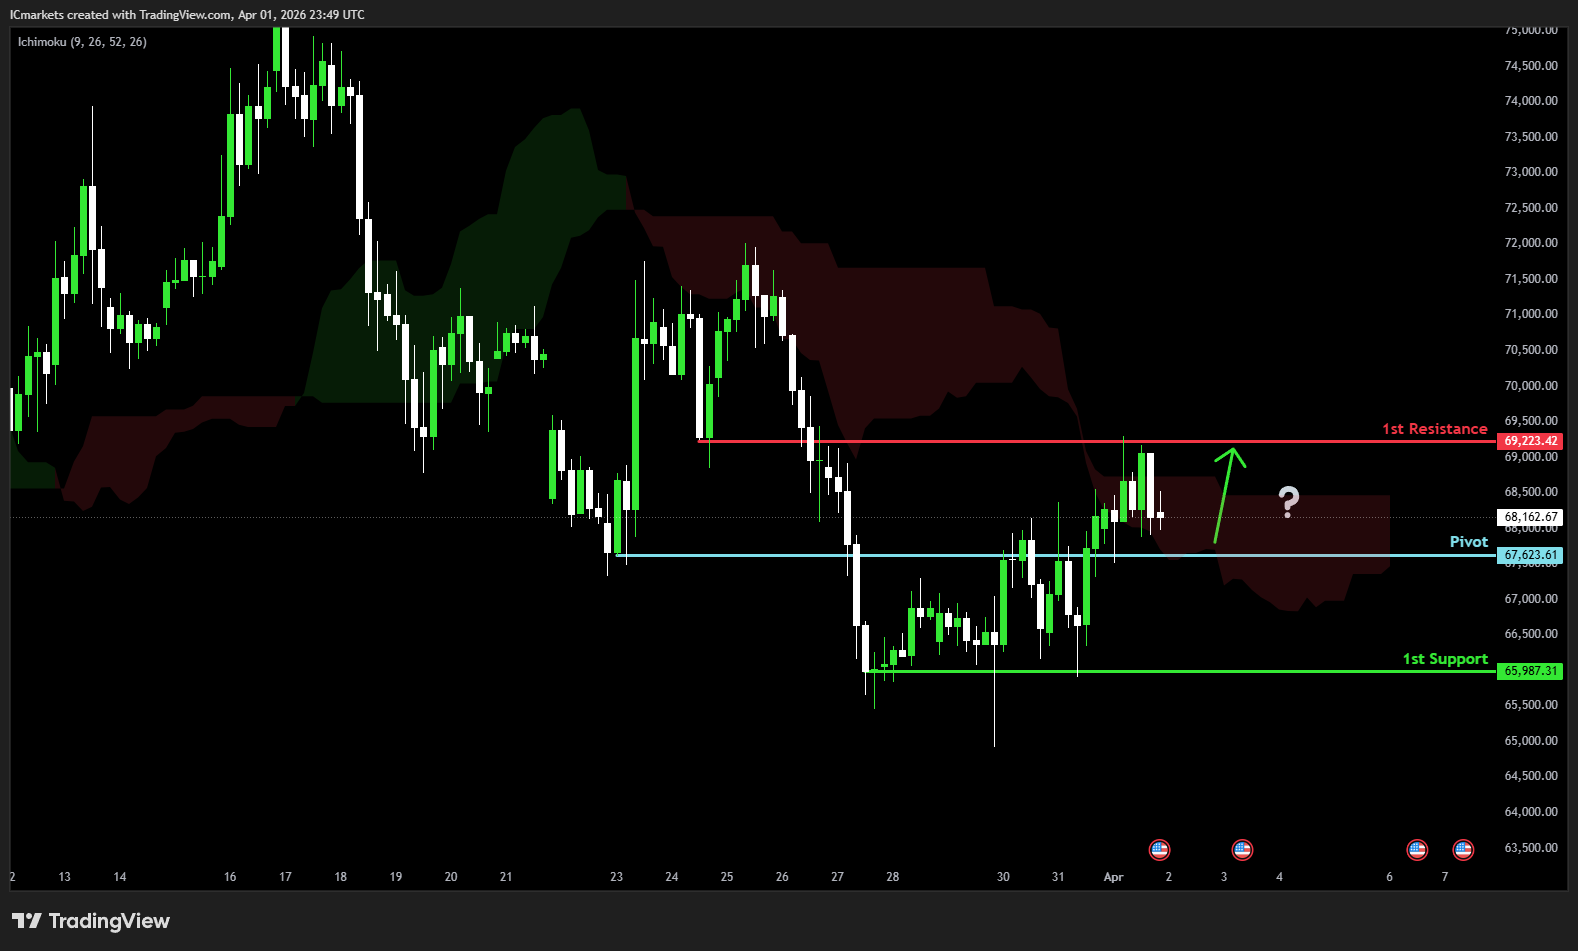
BTC/USD (Bitcoin):
Potential Direction: Bullish
Overall momentum of the chart: Bearish
The price could see a short-term pullback toward the pivot before rising again toward the 1st resistance.
Pivot: 67,623.61
Supporting reasons: Identified as a pullback support, where renewed buying pressure could emerge to push the price higher.
1st support: 65,987.31
Supporting reasons: Identified as a multi-swing low support, indicating a potential level where the price could stabilize once more.
1st resistance: 69,223.42
Supporting reasons: Identified as a pullback resistance, indicating a potential area that could halt any further upward movement.
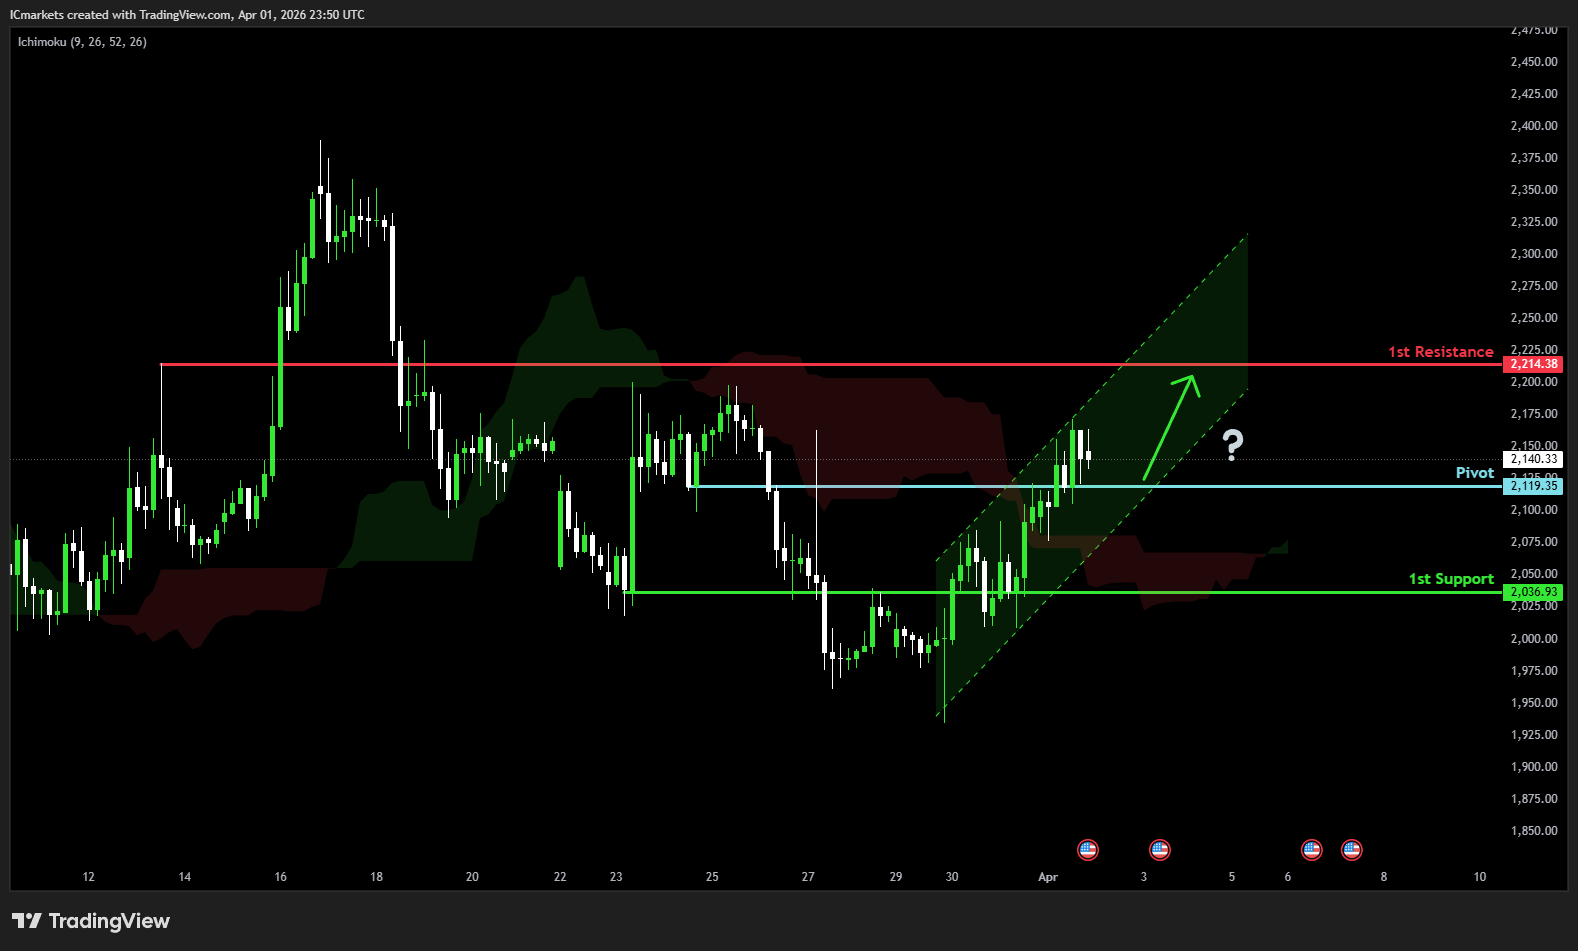
ETH/USD (Ethereum):
Potential Direction: Bullish
Overall momentum of the chart: Bullish
The price could see a short-term pullback toward the pivot before rising again toward the 1st resistance.
Pivot: 2,119.35
Supporting reasons: Identified as a pullback support, where renewed buying pressure could emerge to push the price higher.
1st support: 2,036.93
Supporting reasons: Identified as a pullback support, indicating a potential level where the price could stabilize once more.
1st resistance: 2,214.38
Supporting reasons: Identified as a pullback resistance, indicating a potential area that could halt any further upward movement.
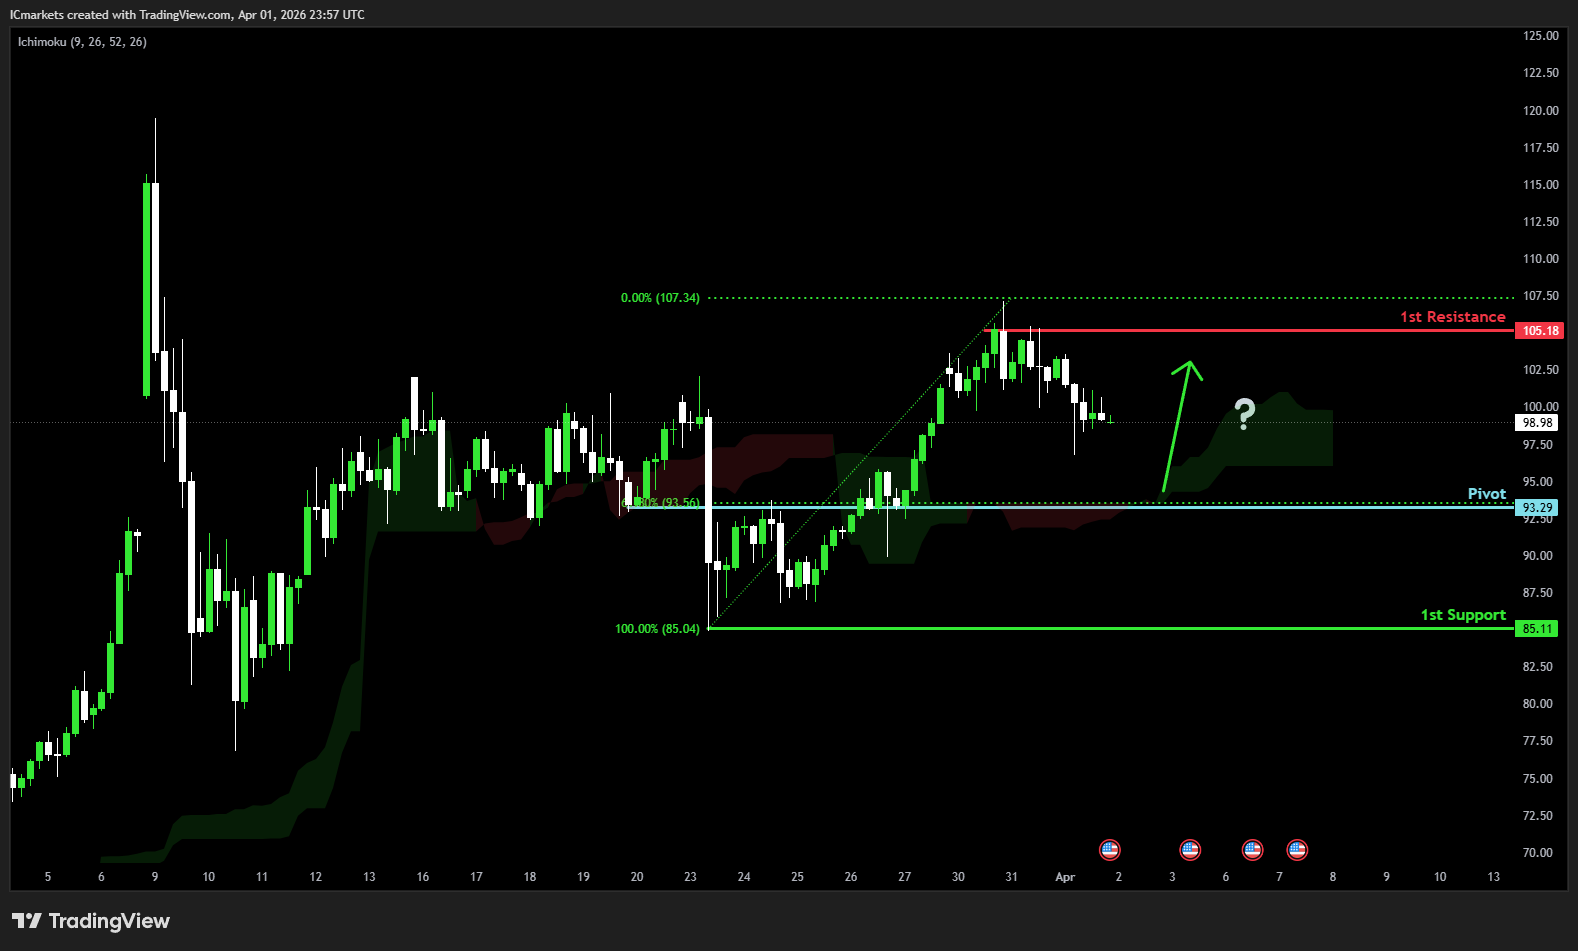
WTI/USD (Oil):
Potential Direction: Bullish
Overall momentum of the chart: Bullish
The price could see a short-term pullback toward the pivot before rising again toward the 1st resistance.
Pivot: 93.29
Supporting reasons: Identified as a pullback support that aligns with the 61.8% Fibonacci retracement, where renewed buying pressure could emerge to push the price higher.
1st support: 85.11
Supporting reasons: Identified as a swing low support, indicating a key level where the price could stabilize once more.
1st resistance: 105.18
Supporting reasons: Identified as a swing high resistance, indicating a potential area that could halt any further upward movement.
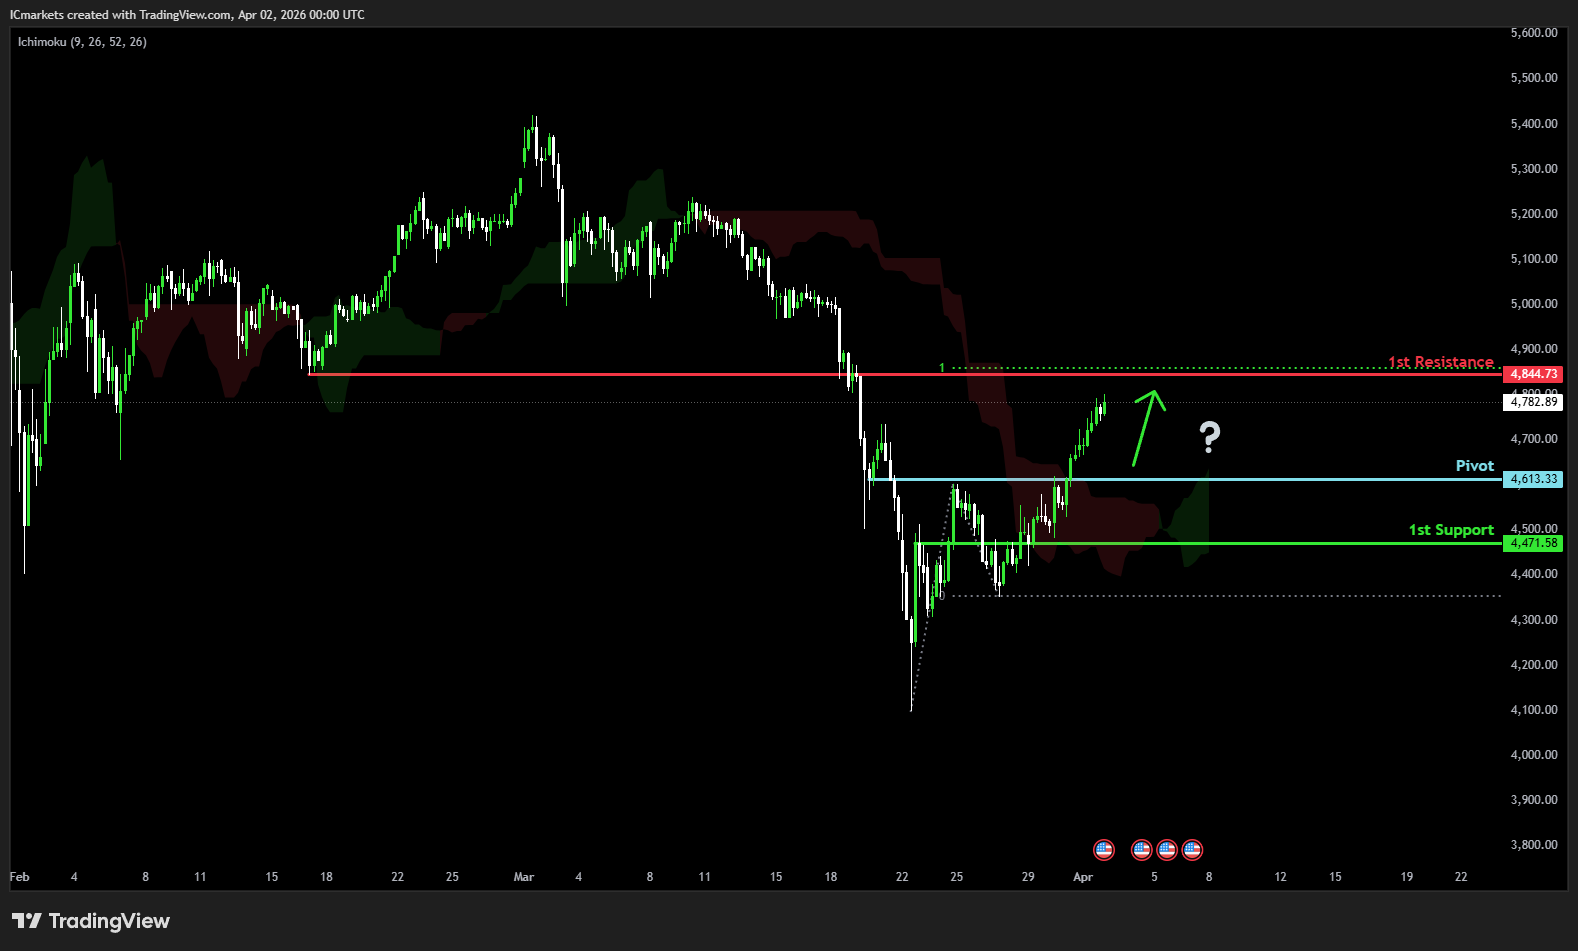
XAU/USD (GOLD):
Potential Direction: Bullish
Overall momentum of the chart: Bullish
The price could see a short-term pullback toward the pivot before rising again toward the 1st resistance.
Pivot: 4,613.33
Supporting reasons: Identified as a pullback support, where renewed buying pressure could emerge to push the price higher.
1st support: 4,471.58
Supporting reasons: Identified as a pullback support, indicating a key level where the price could stabilize once more.
1st resistance: 4,7844.73
Supporting reasons: Identified as a pullback resistance that aligns with the 100% Fibonacci projection, indicating a potential area that could halt any further upward movement.
The accuracy, completeness and timeliness of the information contained on this site cannot be guaranteed. IC Markets Global does not warranty, guarantee or make any representations, or assume any liability regarding financial results based on the use of the information in the site.
News, views, opinions, recommendations and other information obtained from sources outside of www.icmarkets.com, used in this site are believed to be reliable, but we cannot guarantee their accuracy or completeness. All such information is subject to change at any time without notice. IC Markets Gloabl assumes no responsibility for the content of any linked site.
The fact that such links may exist does not indicate approval or endorsement of any material contained on any linked site. IC Markets Global is not liable for any harm caused by the transmission, through accessing the services or information on this site, of a computer virus, or other computer code or programming device that might be used to access, delete, damage, disable, disrupt or otherwise impede in any manner, the operation of the site or of any user’s software, hardware, data or property.
The post Thursday 2nd April 2026: Technical Outlook and Review first appeared on IC Your Trading Edge | Official Blog.
IC Markets Global – Asia Fundamental Forecast | 02 April 2026
429180 April 2, 2026 15:40 ICMarkets Market News
IC Markets Global – Asia Fundamental Forecast | 02 April 2026
What happened in the U.S. session?
Markets were primarily driven by renewed optimism that the U.S.–Iran conflict is nearing a de‑escalation phase, as President Trump signaled a near‑term withdrawal of forces and a possible “Hormuz‑off‑ramp,” which triggered a broad risk‑on move and pulled oil prices off their recent highs. This helped U.S. equities (especially the S&P 500 and Nasdaq) extend their strong rally, pushed Treasury yields lower amid rebuilt rate‑cut expectations, and most noticeably impacted oil futures and energy‑sensitive assets.
What does it mean for the Asia Session?
Renewed volatility around the Strait of Hormuz and energy markets, mixed China PMI data with higher cost pressures, and a still‑hawkish‑leaning BOJ‑April‑hike narrative, all against a backdrop of elevated crude prices and a fresh South Korean energy‑support budget; together, these themes are likely to keep FX, energy‑linked equities, and Japanese‑ and Korean‑listed tech styles in the spotlight at the start of the Asian session.
The Dollar Index (DXY)
Key news events today
President Trump Speaks (1:00 am GMT)
Unemployment Claims (12:30 pm GMT)
What can we expect from DXY today?
The US Dollar showed mixed performance amid ongoing geopolitical tensions and anticipation of key policy announcements. Reports indicate the Dollar Index (DXY) held around the 100 level after reclaiming it late March, bolstered by rising energy prices from the Iran conflict, which benefits the US as an oil exporter, and the Fed’s policy rate range of 3.50%-3.75% appearing more persistent.
Central Bank Notes:
- The Federal Open Market Committee (FOMC) is widely expected to hold the federal funds rate target range steady at 3.50%–3.75% at its March 17–18, 2026, meeting, amid rising oil prices from the US-Israel war against Iran and persistent inflation pressures, delaying any 2026 cuts potentially to September.
- The Committee continues to pursue maximum employment and 2% inflation goals, with the labor market weakening further as nonfarm payrolls declined by 92,000 in February 2026 and the unemployment rate rose to 4.4% from 4.3% in January.
- Officials face tilted risks from geopolitical tensions, elevated oil prices, and sticky inflation, with CPI steady at 2.4% year-over-year in February 2026, headline PCE at 2.8% in January, and core PCE rising to 3.1%.
- Economic activity has cooled after robust Q4 2025 growth near 5%, with the Atlanta Fed GDPNow now estimating Q1 2026 growth at around 2.1%–2.7% amid softer consumer spending and labor data.
- December 2025’s Summary of Economic Projections forecasts 2025 unemployment at a median of 4.5%, 2026 GDP growth at 2.3%, and core PCE at 2.5%, with the dot plot signaling one more cut in 2026 to a median 3.4% funds rate; March updates may reflect softer labor and inflation upticks.
- The Committee maintains its data-dependent stance amid a softening labor market, inflation above target, and new oil shocks, likely holding rates at 3.50%-3.75% with ongoing divisions and possible hawkish dissents on rate cuts.
- The FOMC continues its adjusted quantitative tightening, with Treasury rolloff caps at $5 billion per month and agency MBS at $35 billion per month to ensure ample reserves post-2025 program adjustments.
- The next meeting is scheduled for 28 to 29 April 2026.
Next 24 Hours Bias
Medium Bearish
Gold (XAU)
Key news events today
President Trump Speaks (1:00 am GMT)
Unemployment Claims (12:30 pm GMT)
What can we expect from Gold today?
Gold is moving modestly higher on Thursday, as renewed geopolitical strains with Iran and dovish central‑bank expectations keep safe‑haven demand solid, even as the metal consolidates after a sharp rally into early‑year record highs above $4,800 per ounce. April‑2026 futures are trading in the mid‑4,600s, reflecting a bullish but increasingly range‑bound technical picture where traders are watching for a breakout above the 5,100–5,200 resistance zone or a drop back toward 4,600 support.
Next 24 Hours Bias
Medium Bullish
The Australian Dollar (AUD)
Key news events today
No major news event
What can we expect from AUD today?
The Australian Dollar (AUD) saw modest gains against the US Dollar, with AUD/USD rising to around 0.6936, up 0.52% from the prior session amid a risk-on market mood and US Dollar selling pressure. However, it had weakened significantly earlier in the week to about 0.685, its lowest since January 23, driven by Middle East tensions boosting energy prices and safe-haven demand for the USD.
Central Bank Notes:
- The Reserve Bank of Australia (RBA) is expected to hold its cash rate at 3.85% at the March 16-17, 2026 policy meeting, following the widely anticipated 25 basis point hike to 3.85% in early February after persistent inflation pressures from late 2025. While some banks like CBA, NAB, and Westpac now forecast a further 25 basis point rise to 4.10% as soon as May if inflation data remains sticky, consensus tilts toward a pause in March to assess incoming monthly CPI and labor market signals. The February hike reversed prior cuts, entering mildly restrictive territory amid capacity pressures, with the board emphasizing data dependence.
- Inflation remains elevated, with December 2025 CPI at 3.8% year-on-year and trimmed mean at 3.3%, above the 2–3% target midpoint. RBA’s February Statement revised forecasts higher, projecting trimmed-mean inflation to peak in mid-2026 above 3% and remain elevated through early 2027, driven by services, housing, and demand resilience despite some monthly cooling, such as January’s 0.2% MoM gauge. Monthly CPI data continues to highlight core stickiness beyond energy rebates, delaying the target return to late 2027 or beyond.
- January 2026 monthly indicators showed modest easing, but headline CPI risks upward surprises from housing (up recently) and services amid firm domestic demand. Trimmed mean pressures persist from wage growth and capacity constraints, with consumer expectations ticking to 5% YoY in February surveys. Enhanced monthly reporting sharpens vigilance on potential broad-based pick-up.
- The labor market shows softening, with unemployment around 4.1-4.4%, down slightly to 4.1% in December, but unit labor costs are elevated due to subdued productivity. Household spending faces higher borrowing costs post-hike, yet private demand recovery sustains capacity strains. Vulnerabilities persist amid resilient employment dynamics.
- Global growth modestly revised up but tempered by geopolitics and commodity volatility; policy now restrictive post-February, with the RBA balancing inflation against employment risks. Data from the monthly CPI and Q1 GDP will guide, amid household debt sensitivities.
- Sustained restrictive stance post-February anchors inflation return to target, upholding dual mandate with flexibility to new risks like further inflation upticks.
- Markets price a March hold at 3.85%, with big four banks split: CBA, NAB, Westpac eye May hike to 4.10% if persistence continues, while others see limited upside unless acceleration. Upcoming monthly CPI pivotal for Q2 trajectory.
- Policy vigilance counters inflation stickiness against household fragilities and global uncertainties, reaffirming adaptability under dual mandate.
- Base case favors March hold with risks tilted hawkish for further hikes if data is hot; monthly indicators key to 2026 path.
- The next meeting is on 5 to 6 May 2026.
Next 24 Hours Bias
Medium Bearish
The Kiwi Dollar (NZD)
Key news events today
No major news event
What can we expect from NZD today?
The New Zealand Dollar (NZD) has seen limited specific updates for April 2, 2026, based on available recent market data up to late March, with no confirmed intraday developments reported as of early evening BST. Recent trends show the NZD trading around the $0.580 level against the USD, holding declines amid Reserve Bank of New Zealand (RBNZ) comments on looking through temporary energy-driven inflation while remaining open to rate hikes if pressures persist.
Central Bank Notes:
- The Monetary Policy Committee (MPC) left the Official Cash Rate (OCR) unchanged at 2.25% at its 18 February 2026 meeting, as widely expected, maintaining a unanimous decision and emphasizing a balance between supporting the nascent economic recovery and ensuring inflation returns sustainably to the 2% midpoint of the 1–3% target band.
- The Committee judged that the prior cumulative easing of 325 basis points provides ongoing stimulus, warranting patience amid uneven recovery signals, while noting readiness to normalize policy gradually as inflation pressures subside and activity strengthens.
- Headline CPI inflation, recently at 3.1%, is projected to dip back within the target band in the coming quarter—supported by spare capacity, modest wage growth, and declining food/fuel prices—before reaching 2.0% by mid-2027, with two-year-ahead business expectations edging up to 2.37%.
- Domestic demand shows gradual stabilization with softer household spending and a muted housing market, partially offset by easing retail rates boosting budgets, though cautious consumption, low migration, and a weak labour market continue to cap services inflation as wage moderation takes hold.
- Financial conditions remain accommodative as lower OCR flows through to borrowing costs, aiding mortgage approvals and housing sentiment, but business credit growth stays subdued amid uneven confidence and sensitivity to the recovery’s pace.
- Recent indicators point to weak but steadying GDP momentum in an early-stage rebound from 2025 lows, with high-frequency data showing gradual broadening despite persistent headwinds from elevated costs, fragile sentiment, and subdued investment.
- External risks are now viewed as balanced rather than downside-skewed, with a supportive global backdrop offsetting prior concerns over China and US trade policy, while a lower NZ dollar aids exports and tradables inflation.
- Looking to mid-2026, the MPC adopted a data-dependent stance with forecasts signaling OCR hikes likely from late 2026 or early 2027—potentially as soon as December if activity or inflation exceeds projections—while keeping policy accommodative for now if the gradual recovery aligns with expectations.
- The next meeting is on 7 April 2026.
Next 24 Hours Bias
Medium Bearish
The Japanese Yen (JPY)
Key news events today
No major news event
What can we expect from JPY today?
The Japanese Yen remained range-bound amid a lack of major catalysts, building on February-March volatility where it reclaimed ground to 155-156 USD/JPY following BoJ’s open door to near-term hikes despite CPI shortfalls and political headwinds from PM Takaichi’s low-rate stance.
Central Bank Notes:
- The Policy Board of the Bank of Japan meets on 18–19 April 2026, with markets anticipating the short-term policy rate to remain at 0.75%, as the bank continues evaluating the December 2025 and prior hikes’ effects amid data-dependent normalization.
- The BOJ will target the uncollateralized overnight call rate around 0.75% and indicate future hikes hinge on impacts to lending, financing, and activity, with Governor Ueda signaling scrutiny of data for potential moves in April or later meetings.
- JGB tapering advances per plan, cutting outright purchases by ¥400 billion quarterly through Q1 2026 and slowing to ¥200 billion from April onward, targeting roughly ¥2-3 trillion monthly by mid-2026, adjustable for market stability
- Japan’s economy maintains moderate growth into Q1 2026, building on Q4 2025 rebound via exports and fiscal measures, though manufacturing sentiment holds soft amid overseas demand weakness and yen pressures.
- Core CPI (ex-fresh food) likely stays near 2.3-2.5% y/y in early 2026 Tokyo prints, off prior highs but above 2%, while core-core hovers around 2.6%, reflecting sustained but easing inflationary forces.
- Input costs ease further from import peaks, yet services inflation, 5% wage targets in shunto talks, and anchored expectations above 2% support price persistence, with upside risks from yen and geopolitics.
- Near-term real GDP may ease below trend due to tightening and external shocks like Iran tensions, but negative real rates, wage gains, and stimulus should underpin consumption and capex rebound.
- Medium-term, overseas recovery, labor shortages, and productivity lifts are set to fuel wages and core inflation near/above 2%, enabling gradual hikes toward 1% if conditions align.
- The next meeting is on 27 to 28 April 2026.
Next 24 Hours Bias
Strong Bearish
Oil
Key news events today
No major news event
What can we expect from Oil today?
Oil markets show continued volatility amid geopolitical tensions and supply adjustments. Brent crude hovered around $101 per barrel, down slightly due to easing concerns over Strait of Hormuz disruptions, while WTI traded near $100, supported by low inventories but pressured by forecasts of growing global supply surpluses.
Next 24 Hours Bias
Medium Bullish
The post IC Markets Global – Asia Fundamental Forecast | 02 April 2026 first appeared on IC Your Trading Edge | Official Blog.