Articles

IC Markets Global – Europe Fundamental Forecast | 02 April 2026
429179 April 2, 2026 15:40 ICMarkets Market News
IC Markets Global – Europe Fundamental Forecast | 02 April 2026
What happened in the Asia session?
Today’s Asia‑session move centered on fading but still fragile US‑Iran escalation fears, which lifted regional equities after several days of war‑risk‑driven selling, while domestic macro signals, especially Japan’s tightening‑biased Tankan‑area narrative, kept the yen firm and curbed aggressive risk‑taking.
What does it mean for the Europe & US sessions?
Today’s actionable backdrop for traders is a mix of elevated macro riskdriven by Iran‑linked oil prices and “mild stagflation” warnings alongside still‑bullish but fragile European equity positioning and a U.S. market that is cautiously pricing slower‑than‑hoped rate cuts as inflation and growth data stay sticky; as the European and U.S. sessions overlap, any sharp moves in Treasuries, oil, or headline risk‑off events will likely dominate flow over any single medium‑tier data release.
The Dollar Index (DXY)
Key news events today
President Trump Speaks (1:00 am GMT)
Unemployment Claims (12:30 pm GMT)
What can we expect from DXY today?
The dollar is trading steadier‑to‑firmer, as the DXY hovers around 100 amid lingering risk‑off positioning and elevated US policy rates, while optimism about a potential Middle East ceasefire has tempered some of its recent safe‑haven gains. Markets remain focused on upcoming US labor‑market data this week, which could reinforce expectations of Fed tightening later in 2026 and keep the dollar on a relatively strong footing versus other major currencies.
Central Bank Notes:
- The Federal Open Market Committee (FOMC) is widely expected to hold the federal funds rate target range steady at 3.50%–3.75% at its March 17–18, 2026, meeting, amid rising oil prices from the US-Israel war against Iran and persistent inflation pressures, delaying any 2026 cuts potentially to September.
- The Committee continues to pursue maximum employment and 2% inflation goals, with the labor market weakening further as nonfarm payrolls declined by 92,000 in February 2026 and the unemployment rate rose to 4.4% from 4.3% in January.
- Officials face tilted risks from geopolitical tensions, elevated oil prices, and sticky inflation, with CPI steady at 2.4% year-over-year in February 2026, headline PCE at 2.8% in January, and core PCE rising to 3.1%.
- Economic activity has cooled after robust Q4 2025 growth of nearly 5%, with the Atlanta Fed GDPNow now estimating Q1 2026 growth at around 2.1%–2.7% amid softer consumer spending and labour data.
- December 2025’s Summary of Economic Projections forecasts 2025 unemployment at a median of 4.5%, 2026 GDP growth at 2.3%, and core PCE at 2.5%, with the dot plot signalling one more cut in 2026 to a median 3.4% funds rate; March updates may reflect softer labor and inflation upticks.
- The Committee maintains its data-dependent stance amid a softening labor market, inflation above target, and new oil shocks, likely holding rates at 3.50%-3.75% with ongoing divisions and possible hawkish dissents on rate cuts.
- The FOMC continues its adjusted quantitative tightening, with Treasury rolloff caps at $5 billion per month and agency MBS at $35 billion per month to ensure ample reserves post-2025 program adjustments.
- The next meeting is scheduled for 28 to 29 April 2026.
Next 24 Hours Bias
Medium Bearish
Gold (XAU)
Key news events today
President Trump Speaks (1:00 am GMT)
Unemployment Claims (12:30 pm GMT)
What can we expect from Gold today?
Gold is trading in a firmly bullish pocket, with spot prices around the mid‑4,700s per ounce as a weaker dollar, softer yields, and lingering Middle East tensions boost safe‑haven flows; the metal is holding above key support near 4,600 dollars and probing toward the 4,800‑dollar zone.
Next 24 Hours Bias
Weak Bearish
The Euro (EUR)
Key news events today
No major news event
What can we expect from EUR today?
The euro is holding broadly firmer versus the dollar and other major currencies, supported by a softer greenback and market expectations that the ECB will keep policy relatively restrictive while signaling a cautious path for future rate cuts. At the same time, geopolitical shocks, high energy prices, and internal EU political wrangling around Ukraine funding and sanctions are keeping a cap on the euro’s upside, producing a sideways‑to‑modestly‑bullish tone that reflects mixed growth and risk‑sentiment signals for the eurozone.
Central Bank Notes:
- The Governing Council of the ECB is expected to keep the three key interest rates unchanged at its 29–30 April 2026 meeting, with the main refinancing rate at 2.15%, marginal lending facility at 2.40%, and deposit facility at 2.00%. This reflects an ongoing commitment to 2% inflation stability amid heightened uncertainties from Middle East tensions and US trade policies under President Trump. Market probabilities indicate around 58% odds of no change, though some banks now price in potential hikes due to rising inflation risks.
- Price dynamics show increasing upside pressures, with headline HICP inflation likely around 2.0-2.2% in early 2026, driven by energy costs from Middle East conflicts offsetting euro strength. Core inflation remains sticky but moderating slowly, with projections revised upward to 2.6% for 2026 overall amid hawkish signals from ECB leadership.
- Updated Eurosystem staff projections for April 2026 may forecast headline inflation at 2.1-2.2% in 2026, 1.9% in 2027, and 2.0% in 2028, with upside risks from energy and trade dominating balanced prior views. A stronger euro provides some counterbalance, but recent data revisions highlight persistent pressures.
- Euro area GDP growth holds steady, with Q2 2026 surveys suggesting 0.2-0.3% qoq growth, in line with 1.1-1.3% annual forecasts through 2027. Defence spending, infrastructure, and low unemployment support resilience against trade headwinds and softer external demand.
- The labour market remains tight, with unemployment steady near 6.4%, bolstered by wage growth and participation gains. Supportive credit conditions continue aiding investment and consumption despite global risks.
- Business sentiment is cautious amid US tariffs, geopolitical flare-ups, and supply chain easing; a somewhat weaker euro boosts exports, while fiscal measures aid domestic activity.
- The Governing Council maintains its data-dependent, meeting-by-meeting stance, scrutinizing inflation, transmission, and external shocks without pre-committing to rate paths.
- Balance sheet normalization advances smoothly, with APP/PEPP wind-downs complete and no liquidity issues; banks show ample reserves and stable funding access.
The next meeting is on 29 April 2026
Next 24 Hours Bias
Medium Bearish
The Swiss Franc (CHF)
Key news events today
CPI m/m (6:30 am GMT)
What can we expect from CHF today?
The Swiss franc is trading in a relatively narrow band against the US dollar, with USD/CHF hovering around 0.79 after a modest decline on 1 April, as dollar weakness linked to easing Middle‑East tensions briefly supports the Swissie. Over longer horizons, the franc remains stronger than a year ago versus the greenback and is broadly expected to stay firm in 2026 due to global uncertainties and safe‑haven demand.
Central Bank Notes:
- At its monetary policy assessment on 19 March 2026, the Swiss National Bank (SNB) is widely expected to leave the policy rate unchanged at 0%, continuing the extended pause since September 2025, as the Governing Board assesses current settings as adequate to maintain inflation near the target without resorting to negative rates.
- Inflation data since December indicate persistent weakness, with headline CPI hovering around 0% year-on-year through early 2026 and core measures subdued at roughly 0.4%, underscoring limited price pressures and lingering, though contained, deflation risks.
- The SNB’s updated conditional inflation forecast shows minimal change from December, with averages of about 0.2% in 2025 (now complete), 0.3% in 2026, and 0.6% in 2027 under a steady 0% policy rate. However, recent flat CPI readings may slightly lower near-term expectations, preserving scope for further easing if needed.
- Global conditions remain challenging, marked by U.S. tariff escalations under President Trump, subdued external demand, and uncertainties in major export markets such as Europe and the U.S., prompting the SNB to exercise caution despite resilient Swiss domestic activity.
- Sentiment in manufacturing and export sectors stays soft amid franc appreciation and weaker foreign orders, squeezing margins. Yet, overall GDP growth is expected to be around 1.5% in 2026, with unemployment edging up modestly from historic lows.
- The SNB reaffirms its readiness to intervene via rate cuts or FX operations should deflationary pressures intensify, while emphasizing clear communication through detailed meeting minutes and coordination with global partners on currency matters.
The next meeting is on 18 June 2026.
Next 24 Hours Bias
Medium Bullish
The Pound (GBP)
Key news events today
No major news event
What can we expect from GBP today?
The pound is steadier‑to‑firmer versus the dollar and euro, supported by easing geopolitical risk, a softer greenback, and a relatively hawkish‑leaning Bank of England that is keeping UK rates relatively high compared with the US. Sterling has recouped much of the late‑March underperformance, with GBP/USD trading near the mid‑1.33 area as traders balance sticky UK inflation and fiscal‑policy uncertainty against a more dovish‑leaning Fed outlook.
Central Bank Notes:
- The Bank of England’s Monetary Policy Committee (MPC) met on 19 March 2026, maintaining the Bank Rate at 3.75 per cent in a unanimous decision, following the prior narrow 5–4 vote to hold at the 5 February 2026 meeting. This pause reflects a sharp reversal from earlier market expectations of a 25-basis-point cut, driven by a Middle East conflict sparking global energy and commodity price surges. The March meeting did not include a Monetary Policy Report, with the next one due in April.
- Quantitative tightening (QT) proceeds unchanged at the 2025 pace of gilt holdings reductions, maintaining gradual balance-sheet normalization attuned to liquidity conditions and supportive of a restrictive stance amid new shocks.
- Headline CPI inflation faces near-term upside from the energy shock, reversing prior disinflation trends in domestic prices and wages; pre-shock services inflation had eased but now contends with higher utility and input costs, keeping pressures above the 2 per cent target. MPC projections will update in April, but analysts see inflation at 3-4 per cent by the end of 2026.
- UK growth softens further into Q2 2026, with unemployment risks rising amid potential confidence drops, higher precautionary saving, and widening output gaps; regular pay growth had cooled pre-shock but now faces business cost pass-through.
- Global headwinds intensify via Middle East conflict, driving volatile energy/commodity prices and sterling/gilt swings; MPC deems direct shocks manageable if demand weakens sufficiently to limit second-round effects.
- Inflation risks now tilt upside from energy persistence and potential wage/cost embedding, offset by downside from demand slack and job losses; prior balance has shifted amid uncertainty on shock duration.
- The MPC adopts a wait-and-see posture post-shock, with policy deemed somewhat restrictive pre-event; all members are ready to act data-dependently for 2 per cent sustainability, eyeing April for fuller impact analysis and possible easing if disinflation resumes. Governor Bailey’s guidance stresses close monitoring without firm-cut commitments.
- The next meeting is on 30 April 2026.
Next 24 Hours Bias
Medium Bearish
The Canadian Dollar (CAD)
Key news events today
No major news event
What can we expect from GBP today?
The Canadian dollar is broadly range‑bound and slightly softer versus the US dollar, with USD/CAD lingering near recent highs as geopolitical risk and a relatively resilient US economy keep the greenback well‑bid. While elevated oil prices cap downward pressure on the loonie, weaker‑than‑hoped Canadian growth data and expectations of a prolonged Bank of Canada pause have limited CAD upside, leaving the currency vulnerable to any further risk‑off moves or renewed US‑dollar strength.
Central Bank Notes:
- The Governing Council held the overnight rate target steady at 2.25% at its 25 March 2026 meeting, aligning with consensus forecasts and extending the pause in policy adjustments amid balanced risks. The Bank emphasized persistent global uncertainties from Middle East conflicts and U.S. trade policies under President Trump, but affirmed the current stance supports ongoing disinflation without immediate shifts despite elevated energy price volatility.
- U.S. tariff threats and regional geopolitical tensions continue weighing on business sentiment, though Canadian manufacturing PMI has edged higher into expansion territory, with export orders firming on energy demand. Goods exports, led by crude oil, sustained momentum into February, offsetting cautious capex as firms prioritize resilience over aggressive growth.
- Economic growth carried into Q1 2026 at an annualized pace of around 2.2%, building on Q4 2025’s solid performance, fueled by resource exports, government outlays, and manufacturing rebound. February preliminary data points to steady expansion, though winter weather and supply chain frictions modestly curbed potential upside.
- Services sector PMI climbed further above 50, with broad gains in tech, hospitality, and business services; consumer-facing areas showed tentative improvement as real wages rose, though high service costs still restrain discretionary outlays. The Bank sees this diffusion as evidence of rebalancing toward sustainable activity.
- National housing resales ticked up in January-February alongside modest price gains, buoyed by stable rates and improved affordability in select regions, while inventory buildup in urban centers prevents excessive tightening. Officials anticipate continued moderation, aided by prudent mortgage rules amid steady household formation.
- Headline CPI eased to about 2.1% year-over-year in February 2026 estimates, staying within the control band, as core gauges like CPI-trim and median dipped to near 2.7% on softer food and durable goods pressures—despite sticky shelter costs. This reinforces the Bank’s view of inflation sustainably approaching the target.
- Policymakers reiterated that 2.25% remains well-calibrated to anchor 2% inflation and foster adjustment, with no cuts signaled barring downside surprises in growth or prices. Attention now turns to Q2 durability, core inflation persistence, and evolving trade/geopolitical clarity.
- The next meeting is on 23 April 2026.
Next 24 Hours Bias
Medium Bearish
Oil
Key news events today
No major news event
What can we expect from Oil today?
Oil trades in the low‑to‑mid‑$100s per barrel, still elevated after the Iran–US–Israeli conflict pushed benchmark prices toward $120 in late March, with OPEC+ beginning a measured rollout of 206,000 barrels per day in additional supply from April while keeping the option to reinstate cuts if disruptions or risk escalate; the Strait of Hormuz remains a major flashpoint, feeding a risk premium that keeps both the EIA and regional analysts expecting strong but volatile prices through the second quarter of 2026.
Next 24 Hours Bias
Medium Bullish
The post IC Markets Global – Europe Fundamental Forecast | 02 April 2026 first appeared on IC Your Trading Edge | Official Blog.
General Market Analysis – 2/04/26
429178 April 2, 2026 15:00 ICMarkets Market News
Markets Rally on Peace Hopes – Nasdaq up 1.16%
US equity markets pushed higher again in the latest session, extending the recent rally as optimism continued to build that the conflict in the Middle East may be approaching a resolution. The Dow Jones rose 0.48% to close at 46,565, while the S&P 500 gained 0.72% to finish at 6,575. The tech-heavy Nasdaqoutperformed, climbing 1.16% to settle at 21,840. In fixed income markets, US Treasury yields edged higher following stronger-than-expected ISM PMI data, which printed at its highest level since August 2022, highlighting ongoing resilience in the US economy. The 2-year yield rose 0.7 basis points to 3.800%, while the 10-year yield added 0.2 basis points to 4.319%. In currency markets, the US dollar remained under pressure, with the DXY falling 0.40% to 99.56 as traders continued to rotate into risk-sensitive assets amid improving sentiment. Commodity markets saw a divergence in performance. Oil prices moved lower as easing geopolitical tensions reduced supply concerns, with Brent falling 3.23% to $104.18 per barrel and WTI declining 2.12% to $99.35. In contrast, gold rallied strongly, gaining 1.94% to $4,758.57, supported by the weaker dollar and ongoing demand for defensive assets.
Oil Prices Falling on Peace Hopes
Oil prices moved lower yesterday as growing optimism around a potential de-escalation in the Middle East conflict weighed on energy markets. Sentiment shifted after U.S. President Donald Trump indicated that the United States could bring its conflict with Iran to an end relatively quickly. Comments suggesting the war could conclude shortly — even without a formal agreement — had already triggered a sharp sell-off in the previous session, with oil falling more than $3 a barrel. Markets are increasingly pricing in a shorter-lived disruption to global supply, with analysts noting that the U.S. is unlikely to allow the conflict to drag on into mid-May, when domestic gasoline demand typically peaks. However, while the prospect of a ceasefire is easing immediate supply concerns and dragging oil prices lower, traders are aware that a full recovery in energy flows through the Strait of Hormuz may take time, even if hostilities come to an end.
Geopolitics to Again Dominate in Trading today
Looking ahead, the macroeconomic calendar is relatively light today, however traders are not expecting a quiet day. The Asian session is set to open on the front foot after another positive day on Wall Street yesterday. President Trump is due to address the nation (and world) during the session though and that should provide plenty of volatility with any confirmation of the US pulling out of the Middle East likely to lead to more risk on moves. The London session will see an early focus on Swiss markets with the key CPI (exp +0.5%m/m) due out early in the day. It’s a quieter day in the New York session today, although there are more jobs numbers out with the usual US Weekly Unemployment Claims data release (exp 212k). We also hear from Fed members Logan and Bowman, but again traders are expecting moves to be dominated by updates on the conflict in the Middle East.
Explore all upcoming market events in the Economic Calendar.
The post General Market Analysis – 2/04/26 first appeared on IC Your Trading Edge | Official Blog.
Thursday 2nd April 2026: Asia-Pacific Shares Decline Amid Renewed U.S.–Iran Tensions
429177 April 2, 2026 15:00 ICMarkets Market News
Global Markets:
- Asian Stock Markets : Nikkei down 2.14%, Shanghai Composite down 0.53% Hang Seng down 1.02% ASX down 1.03%
- Commodities : Gold at $4,719.51 (-2.20%) Silver at $72.145 (-5.50%), Brent Oil at $106.71 (4.26%), WTI Oil at $104.57 (4.92%)
- Rates : US 10-year yield at 4.368, UK 10-year yield at 4.8340, Germany 10-year yield at 2.996
News & Data:
- (USD) ADP Non-Farm Employment Change 62K to 41K expected
Markets Update:
Asia-Pacific markets erased early gains on Thursday as investors reacted to fresh remarks from Donald Trump regarding the ongoing conflict with Iran.
In his address, Trump said U.S. objectives in Iran were close to being achieved and emphasized that Washington “has all the cards” in the situation. He also warned that the United States could intensify its response against Iran over the next two to three weeks if conditions did not improve.
Earlier, Trump claimed that Iran’s “new regime president” had approached the U.S. seeking a ceasefire, although Tehran denied the statement. He added on Truth Social that Washington would consider any such request only after the Strait of Hormuz was fully reopened and safe for passage. This appeared to contrast with earlier reports suggesting the U.S. might end its campaign even if the strategic waterway remained restricted.
Following the remarks, Japan’s Nikkei 225 declined 1.4%, while the Topix slipped 0.94%. South Korea’s Kospi dropped 2.82%, and the Kosdaq fell about 3%. Australia’s S&P/ASX 200 also reversed early gains to trade 0.48% lower. Hong Kong’s Hang Seng opened 0.5% down, while mainland China’s CSI 300 remained largely unchanged.
U.S. stock futures were mostly flat, though Wall Street closed higher overnight, with gains across major indices.
Upcoming Events:
- 12:30 PM GMT – USD Unemployment Claims
The post Thursday 2nd April 2026: Asia-Pacific Shares Decline Amid Renewed U.S.–Iran Tensions first appeared on IC Your Trading Edge | Official Blog.
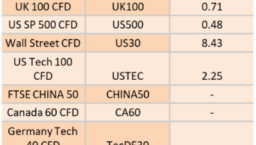
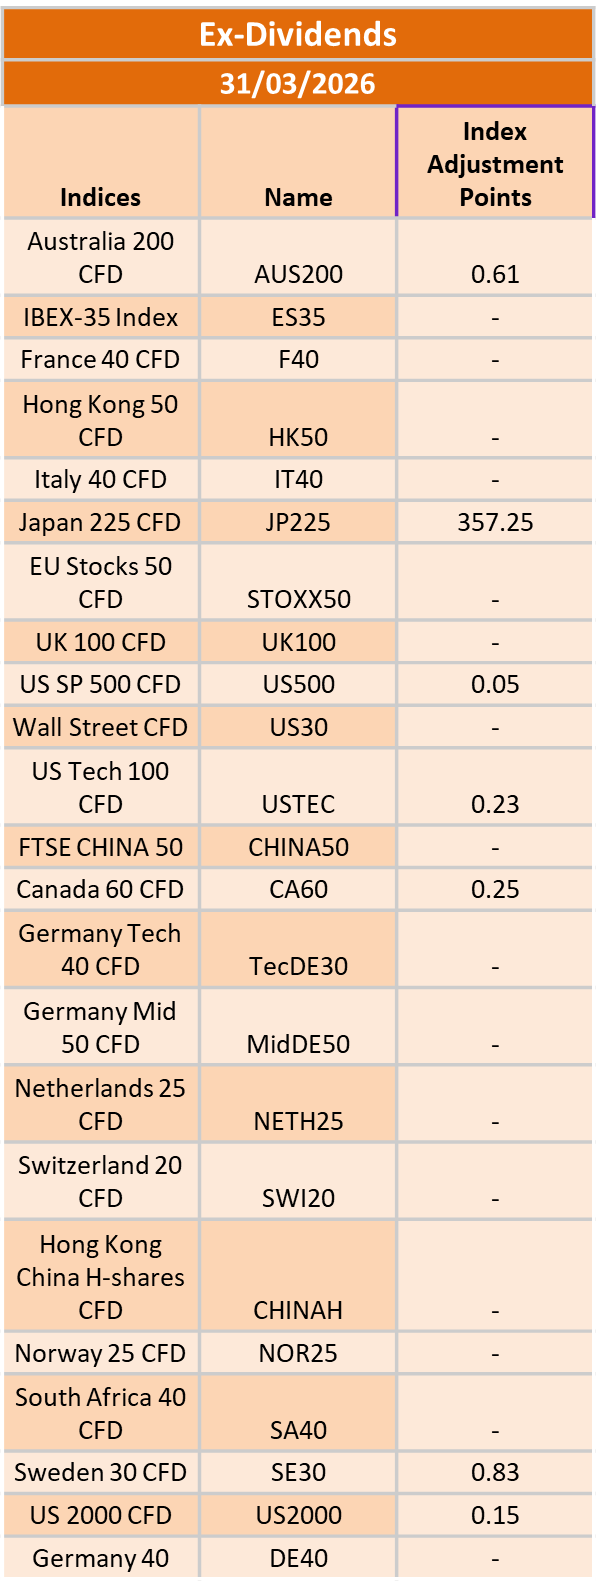
Ex-Dividend 2/04/2026
429154 April 1, 2026 21:00 ICMarkets Market News
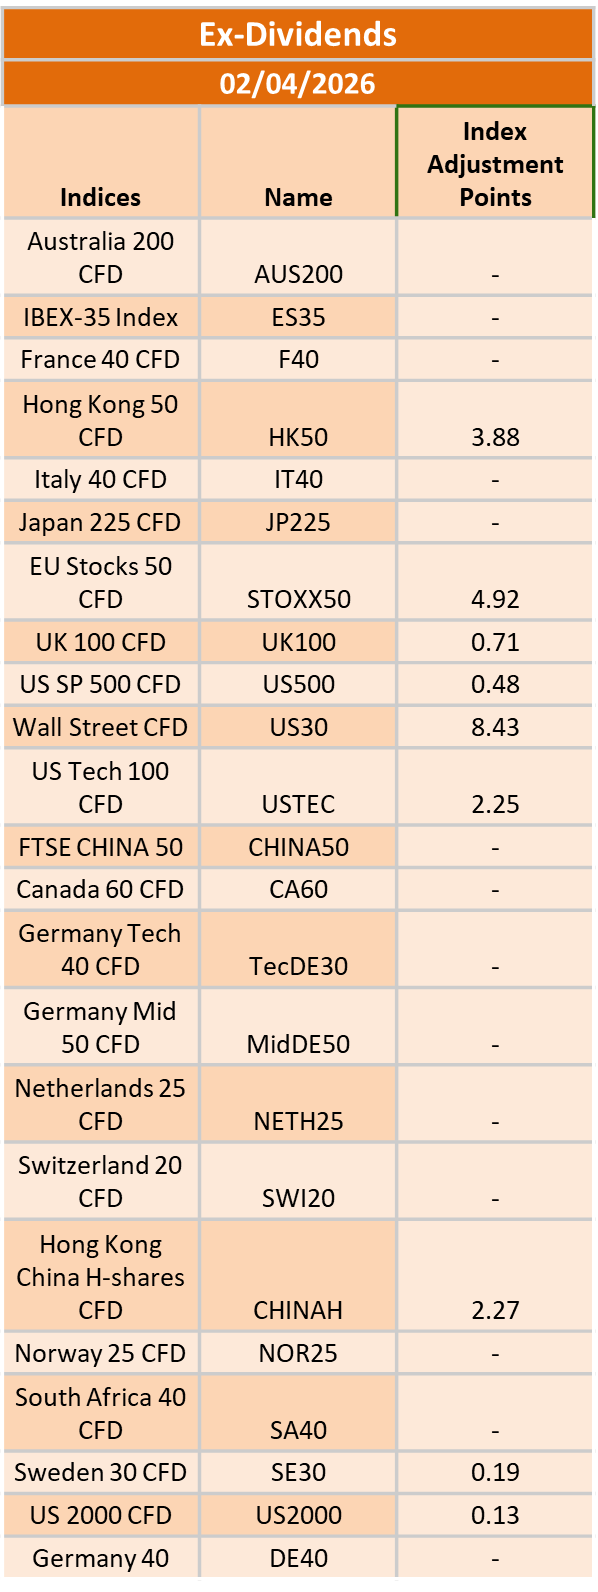
The post Ex-Dividend 2/04/2026 first appeared on IC Your Trading Edge | Official Blog.
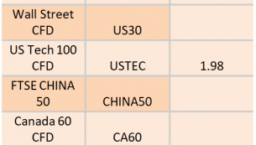
Ex-Dividend 1/04/2026
429150 April 1, 2026 20:40 ICMarkets Market News
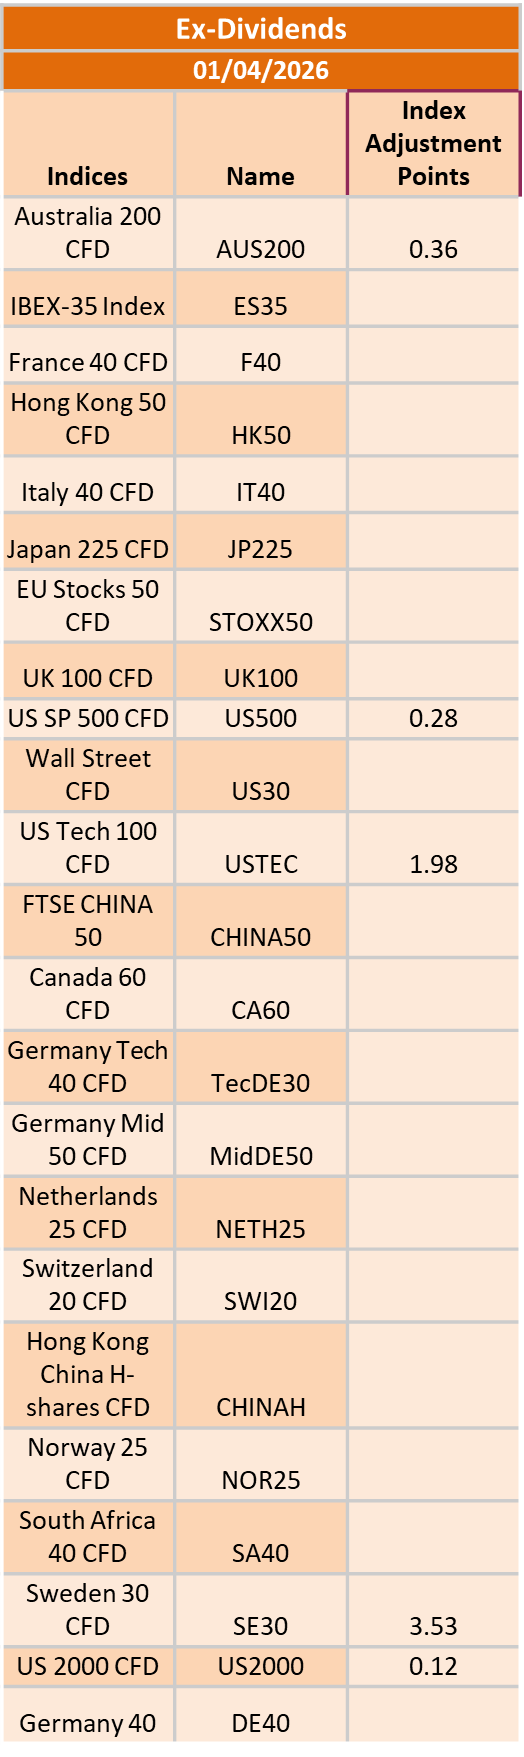
The post Ex-Dividend 1/04/2026 first appeared on IC Your Trading Edge | Official Blog.
Tuesday 31st March 2026: Asia-Pacific Markets Volatile as Oil Prices Fall on Signs of U.S. De-Escalation With Iran
429113 March 31, 2026 15:40 ICMarkets Market News
Global Markets:
- Asian Stock Markets : Nikkei down 1.14%, Shanghai Composite down 0.3% Hang Seng down 0.52% ASX up 0.63%
- Commodities : Gold at $4,584.51 (0.20%) Silver at $72.145 (2.50%), Brent Oil at $107.71 (0.26%), WTI Oil at $103.57 (0.92%)
- Rates : US 10-year yield at 4.324, UK 10-year yield at 4.9340, Germany 10-year yield at 3.039
News & Data:
- (GBP) M4 Money Supply m/m 0.6% to 0.1% expected
Markets Update:
Asia-Pacific markets swung sharply on Tuesday as oil prices reversed earlier gains after reports suggested President Donald Trump was seeking to avoid a prolonged Middle East conflict. Investors reacted quickly to signals that Washington may scale back military objectives, easing immediate supply fears.
The Wall Street Journal reported that Trump told aides he was prepared to end U.S. hostilities against Iran even if the Strait of Hormuz remained largely closed. Oil futures responded by retreating, with West Texas Intermediate falling 0.72% to $102.14 per barrel and Brent crude slipping 1% to $111.55. Shipping through the vital Hormuz corridor, once responsible for about one-fifth of global seaborne oil flows, has slowed sharply since strikes began in late February.
Analysts said attempts to reopen the strategic waterway could extend the conflict beyond the expected six-week timeline. Strategist Ben Emons noted that easing tensions could help contain fuel costs and inflation pressures, while the evolving conflict increasingly favors de-escalation from the U.S. perspective.
Regional markets reflected the uncertainty. South Korea’s Kospi fell 2.2%, the Kosdaq dropped 1.9%, and the won weakened near multi-year lows. Japan’s Nikkei slipped slightly, while Australia’s benchmark rose 0.9%. Hong Kong’s Hang Seng edged lower, and mainland China’s CSI 300 remained largely steady.
Overnight, U.S. equities were mixed, though futures edged higher as investors watched policy signals closely
Upcoming Events:
- 12:30 PM GMT – CAD GDP m/m
The post Tuesday 31st March 2026: Asia-Pacific Markets Volatile as Oil Prices Fall on Signs of U.S. De-Escalation With Iran first appeared on IC Your Trading Edge | Official Blog.
Tuesday 31st March 2026: Technical Outlook and Review
429095 March 31, 2026 15:40 ICMarkets Market News
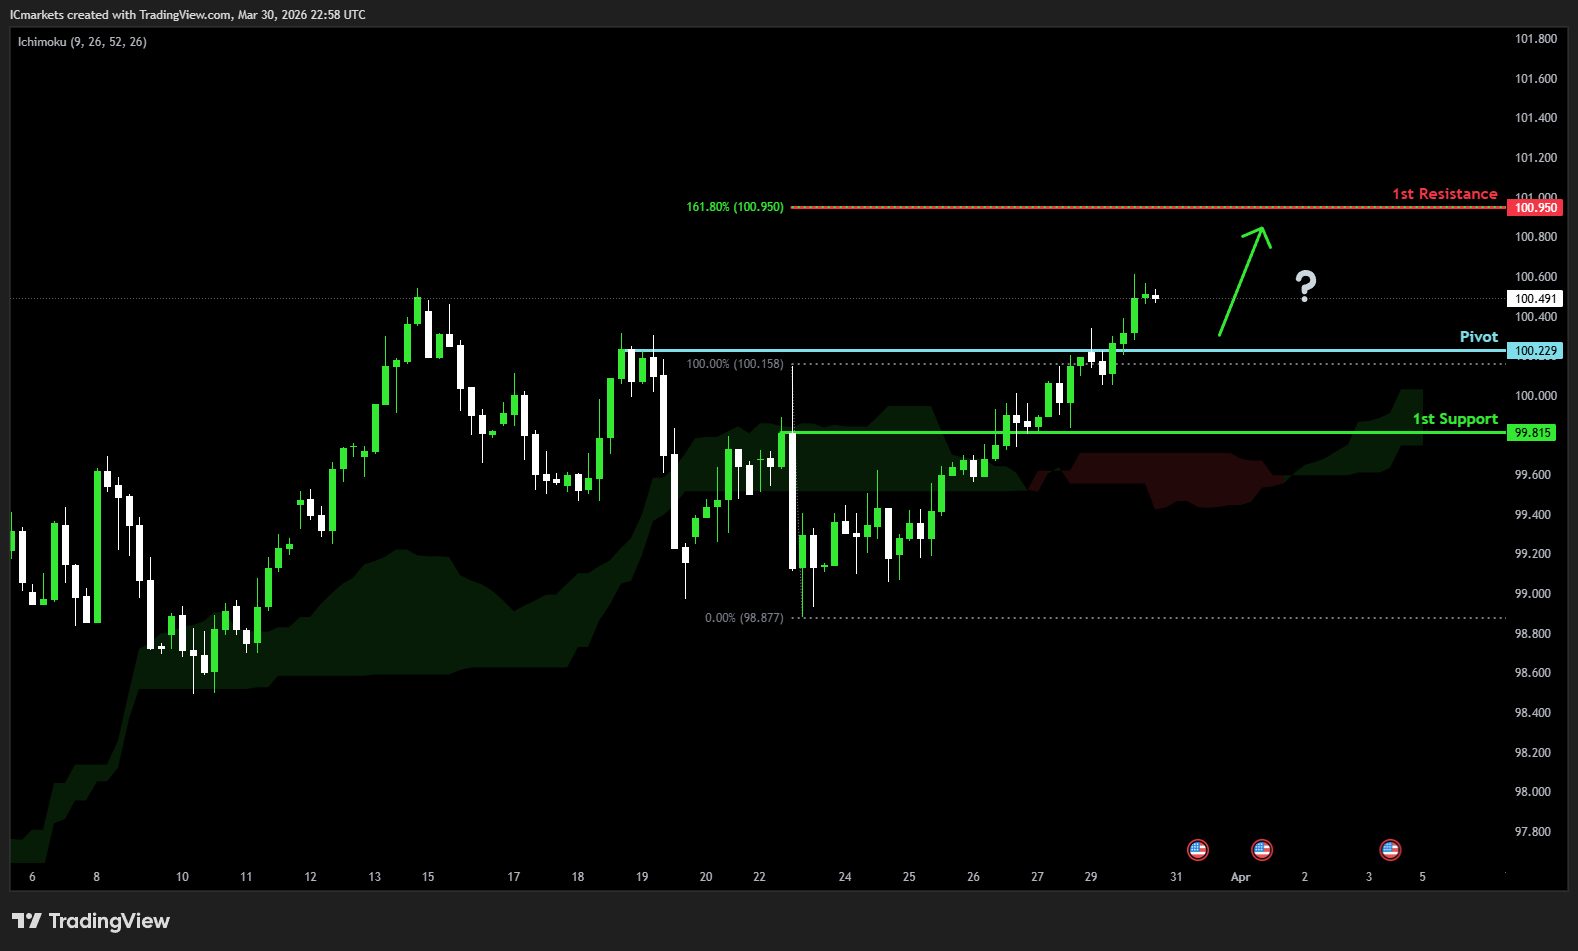
DXY (U.S. Dollar Index):
Potential Direction: Bullish
Overall momentum of the chart: Bearish
The price could see a short-term pullback toward the pivot before rising again toward the 1st resistance.
Pivot: 100.22
Supporting reasons: Identified as a pullback support, where renewed buying pressure could emerge to push the price higher.
1st support: 99.81
Supporting reasons: Identified as an overlap support, indicating a potential area where the price could again stabilize.
1st resistance: 100.95
Supporting reasons: Identified as a resistance that aligns with the 161.8% Fibonacci extension, indicating a potential area that could halt any further upward movement
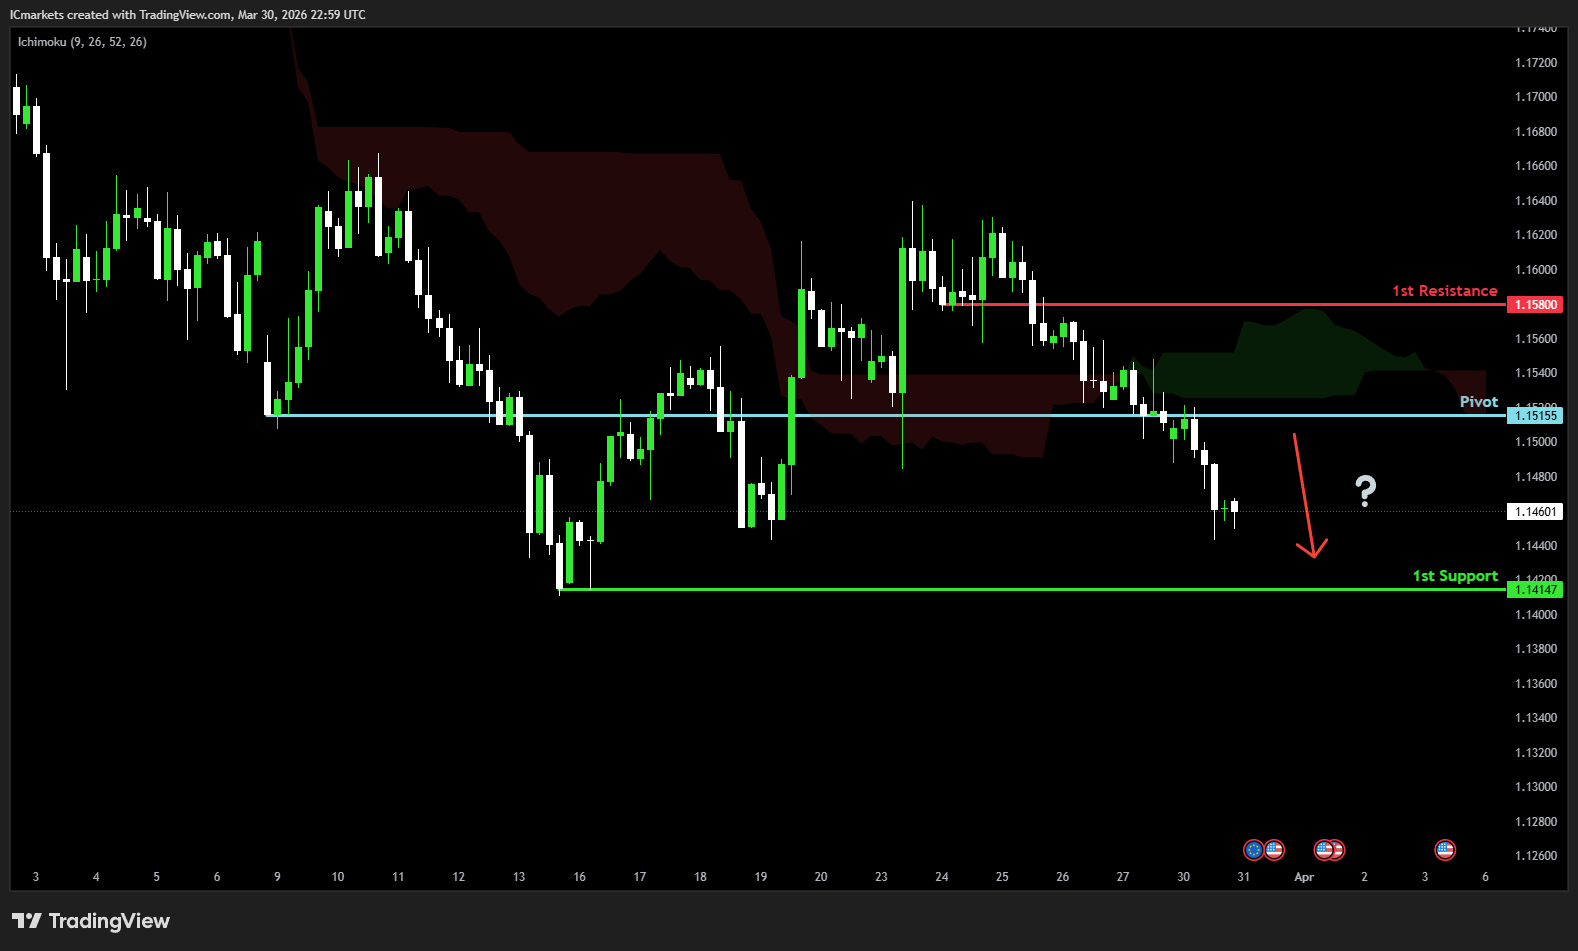
EUR/USD:
Potential Direction: Bearish
Overall momentum of the chart: Bullish
The price could see a short-term pullback toward the pivot before continuing its bearish move down toward the 1st support.
Pivot: 1.1515
Supporting reasons: Identified as a pullback resistance, where selling pressures could intensify and potentially cap any upward retracement.
1st support: 1.1414
Supporting reasons: Identified as a swing low support, indicating a potential level where the price could stabilize once again.
1st resistance: 1.1580
Supporting reasons: Identified as a pullback resistance, indicating a potential level that could cap further upward movement.
EUR/JPY:
Potential Direction: Bearish
Overall momentum of the chart: Bullish
The price could see a short-term pullback toward the pivot before continuing its bearish move down toward the 1st support.
Pivot: 183.60
Supporting reasons: Identified as a pullback resistance that aligns with the 50% Fibonacci retracement, where selling pressures could intensify and potentially cap any upward retracement.
1st support: 182.21
Supporting reasons: Identified as an overlap support, indicating a potential area where the price could again stabilize.
1st resistance: 184.68
Supporting reasons: Identified as an overlap resistance, indicating a potential level that could cap further upward movement.
EUR/GBP:
Potential Direction: Bullish
Overall momentum of the chart: Bullish
The price could see a short-term pullback toward the pivot before rising again toward the 1st resistance.
Pivot: 0.8676
Supporting reasons: Identified as a pullback support, where renewed buying pressure could emerge to push the price higher.
1st support: 0.8648
Supporting reasons: Identified as an overlap support, indicating a potential area where the price could stabilize once more.
1st resistance: 0.8708
Supporting reasons: Identified as an overlap resistance, indicating a potential level that could cap further upward movement.
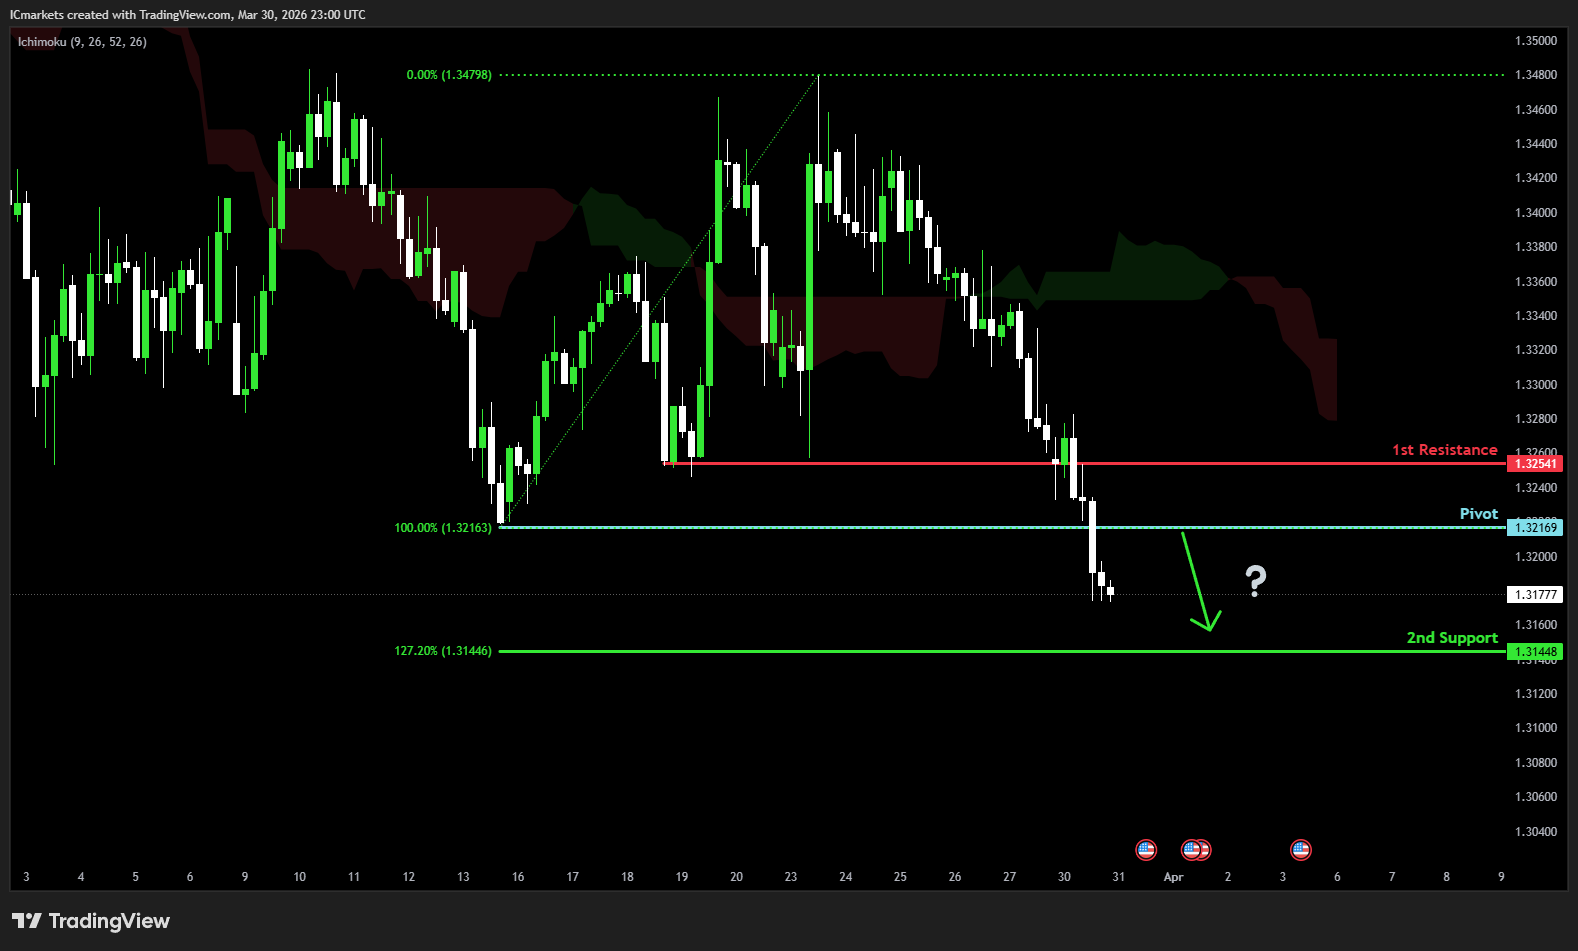
GBP/USD:
Potential Direction: Bearish
Overall momentum of the chart: Bullish
The price could see a short-term pullback toward the pivot before continuing its bearish move down toward the 1st support.
Pivot: 1.3216
Supporting reasons: Identified as a pullback resistance, where selling pressures could intensify and potentially cap any upward retracement.
1st support: 1.3144
Supporting reasons: Identified as a support that aligns with the 127.2% Fibonacci extension, indicating a potential area where the price could stabilize once more.
1st resistance: 1.3254
Supporting reasons: Identified as a pullback resistance, indicating a potential level that could halt further upward movement.
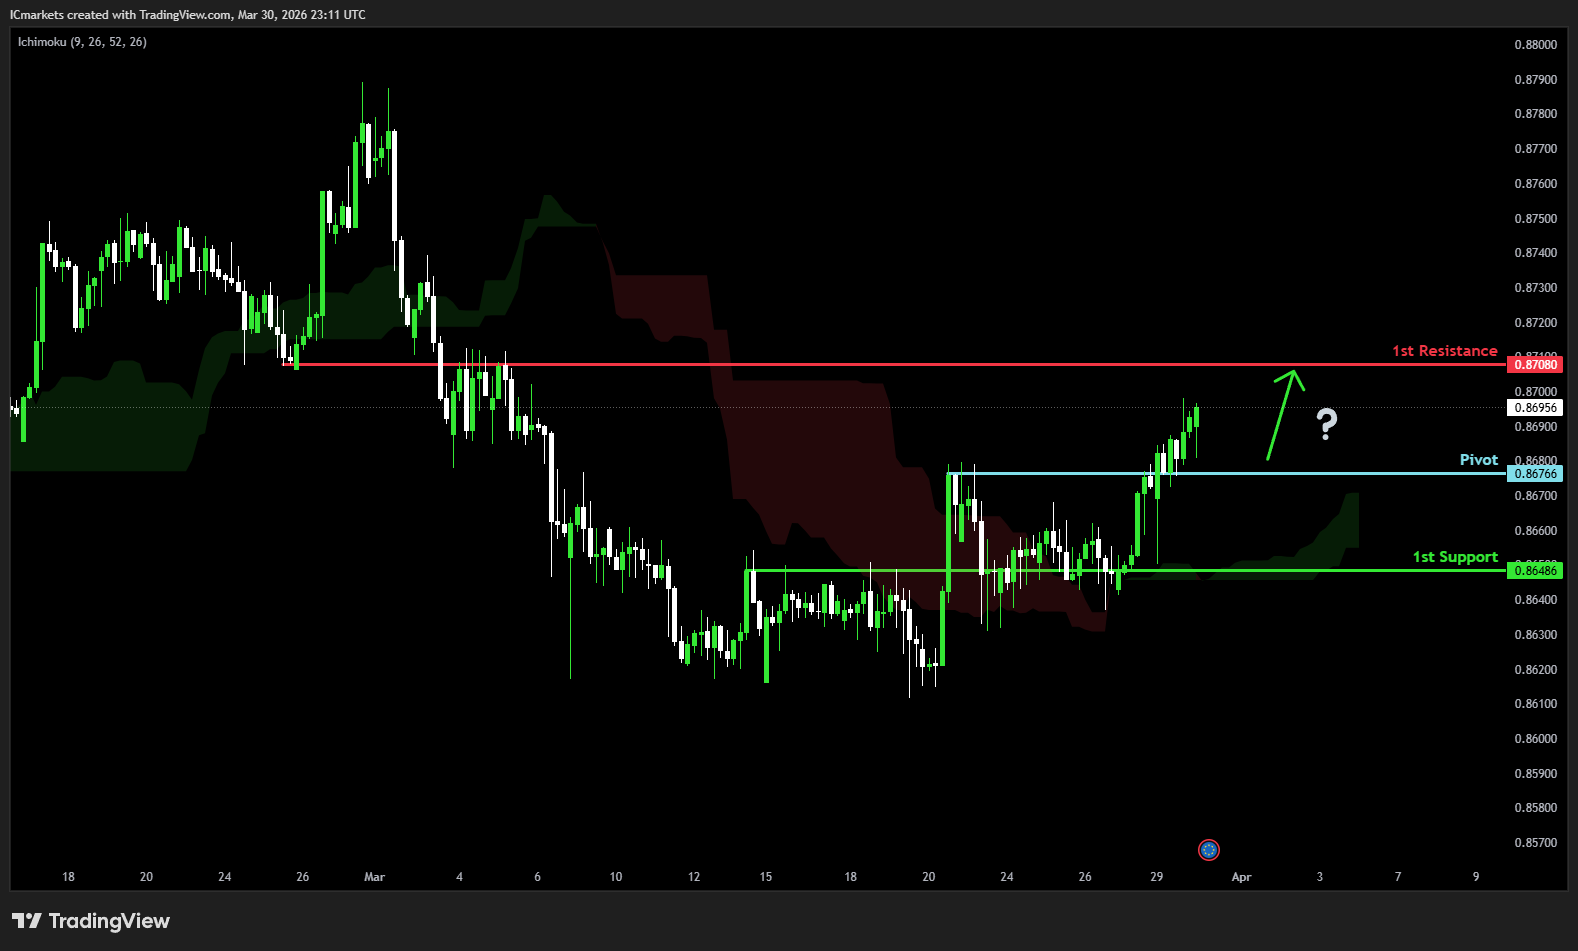
GBP/JPY:
Potential Direction: Bearish
Overall momentum of the chart: Bullish
The price could see a short-term pullback toward the pivot before continuing its bearish move down toward the 1st support.
Pivot: 211.15
Supporting reasons: Identified as a pullback resistance, where selling pressures could intensify and potentially cap any upward retracement.
1st support: 209.24
Supporting reasons: Identified as a swing low support, indicating a potential level where the price could stabilize once more.
1st resistance: 212.15
Supporting reasons: Identified as a pullback resistance, indicating a potential level that could halt further upward movement.
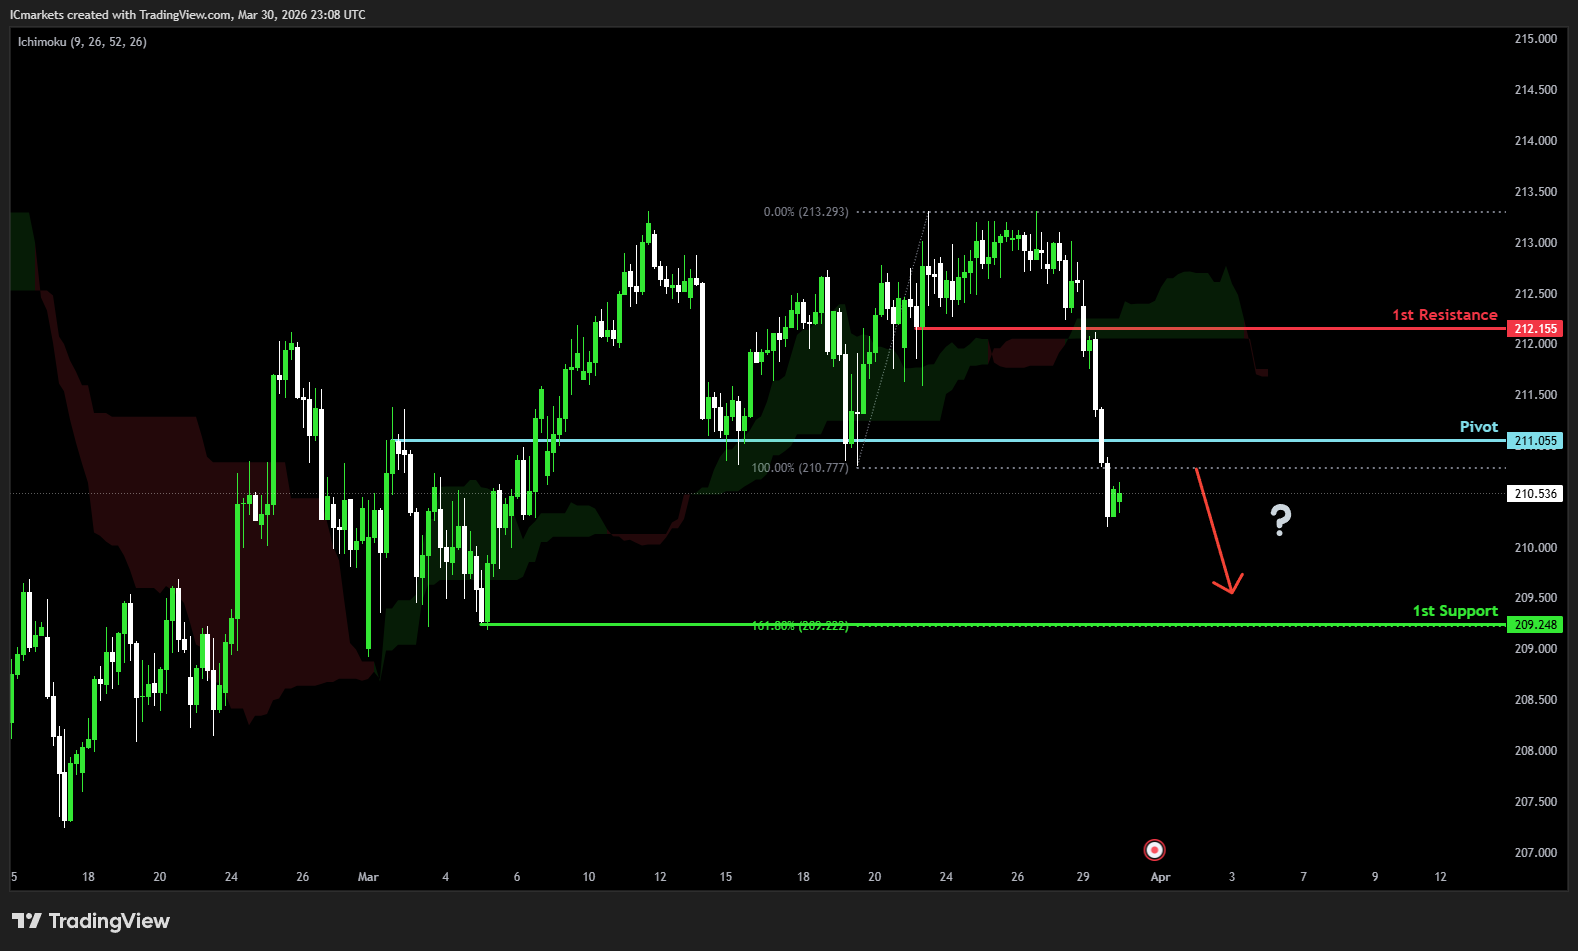
USD/CHF:
Potential Direction: Bullish
Overall momentum of the chart: Bearish
The price could see a short-term pullback toward the pivot before rising again toward the 1st resistance.
Pivot: 0.7956
Supporting reasons: Identified as a pullback support, where renewed buying pressure could emerge to push the price higher.
1st support: 0.7911
Supporting reasons: Identified as a pullback support, indicating a potential level where the price could stabilize once again.
1st resistance: 0.8036
Supporting reasons: Identified as a resistance that aligns with the 161.8% Fibonacci extension, indicating a potential level that could cap further upward movement.
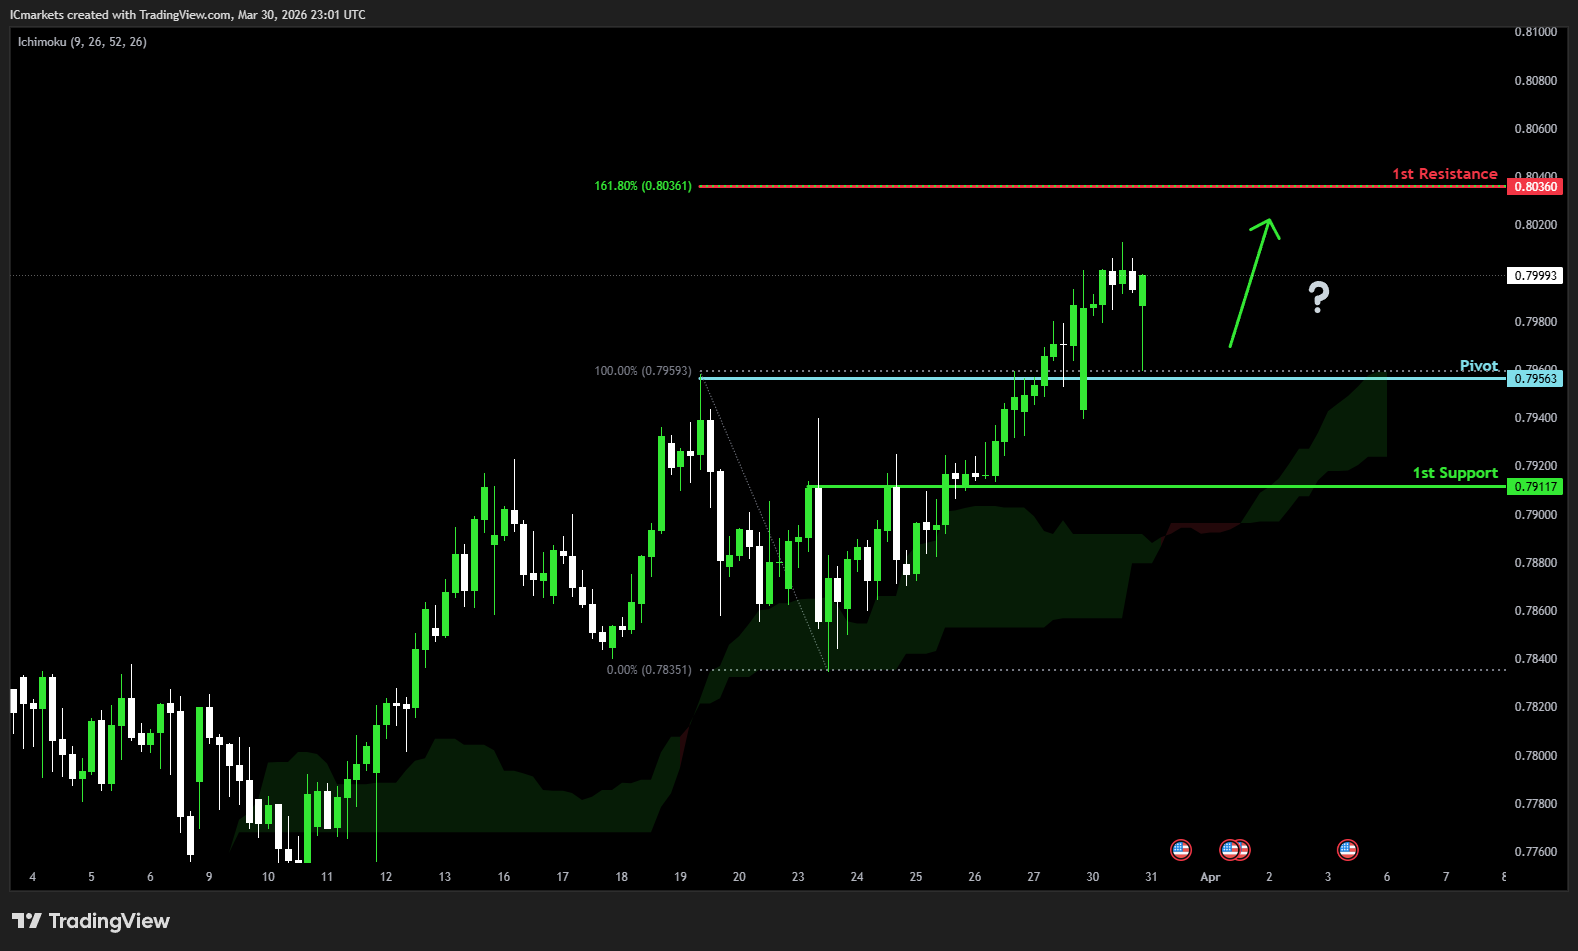
USD/JPY:
Potential Direction: Bullish
Overall momentum of the chart: Bullish
The price could see a short-term pullback toward the pivot before rising again toward the 1st resistance.
Pivot: 158.79
Supporting reasons: Identified as a pullback support, where renewed buying pressure could emerge to push the price higher.
1st support: 157.85
Supporting reasons: Identified as an overlap support, indicating a strong area where buyers might return, and the price could stabilize once again.
1st resistance: 160.45
Supporting reasons: Identified as an overlap resistance. This level represents the next key area where upward movement could be capped amid increased selling pressure
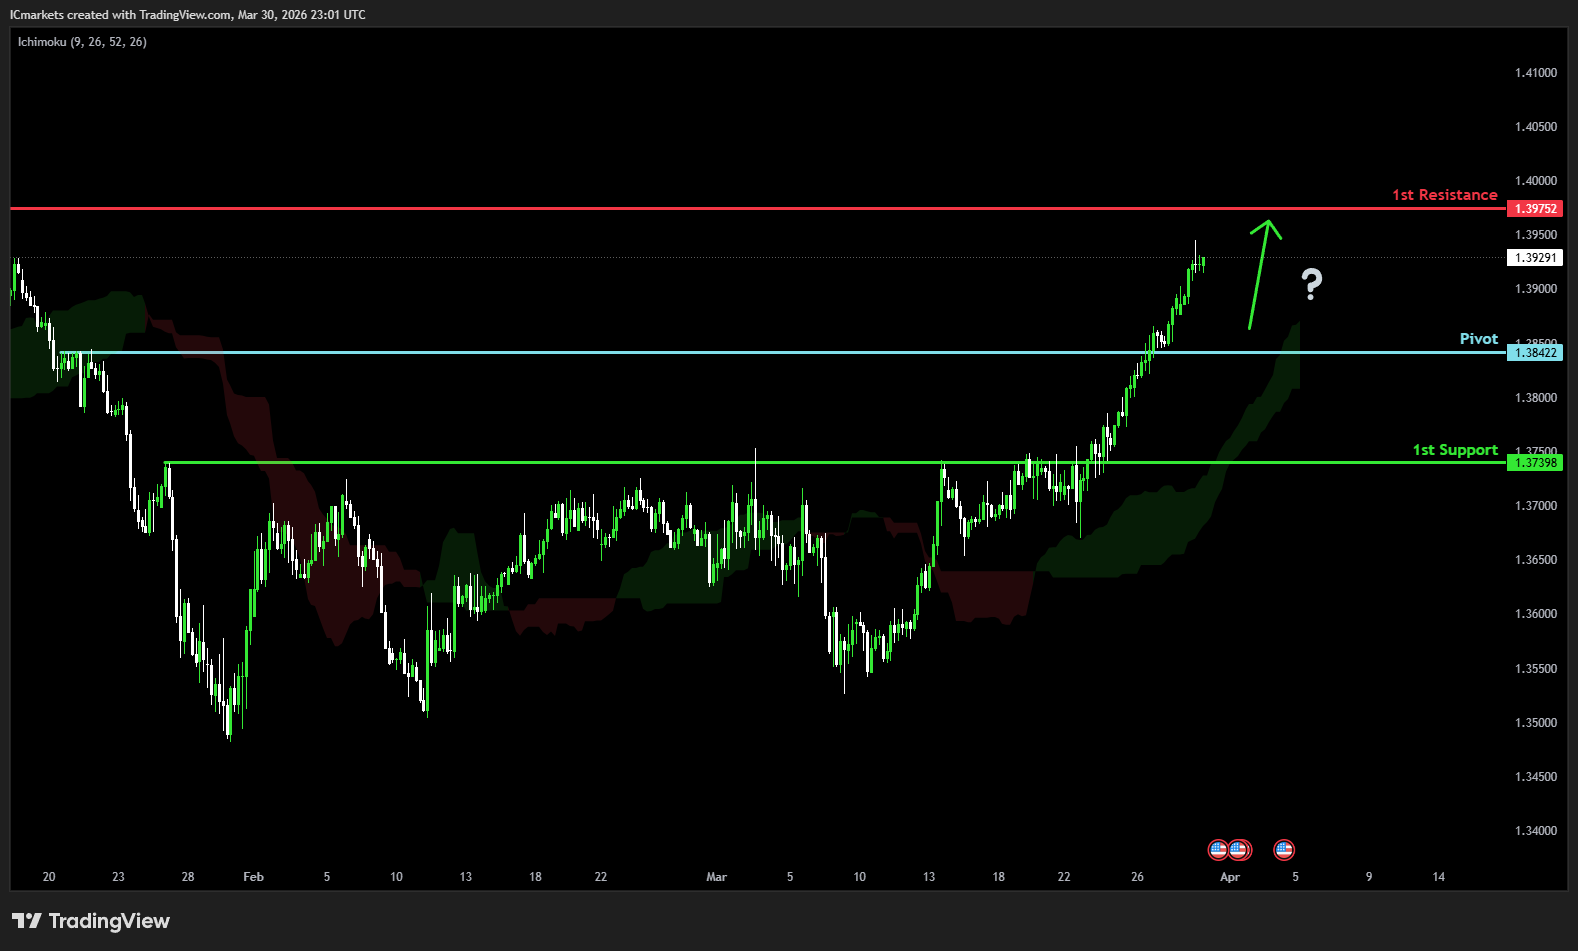
USD/CAD:
Potential Direction: Bullish
Overall momentum of the chart: Bullish
The price could see a short-term pullback toward the pivot before rising again toward the 1st resistance.
Pivot: 1.3842
Supporting reasons: Identified as an overlap support, where renewed buying pressure could emerge to push the price higher.
1st support: 1.3739
Supporting reasons: Identified as a pullback support, indicating a key level where the price could stabilize once more.
1st resistance: 1.3975
Supporting reasons: Identified as a pullback resistance, making it a possible target for bullish advances and a level where some sellers could return to cap gains
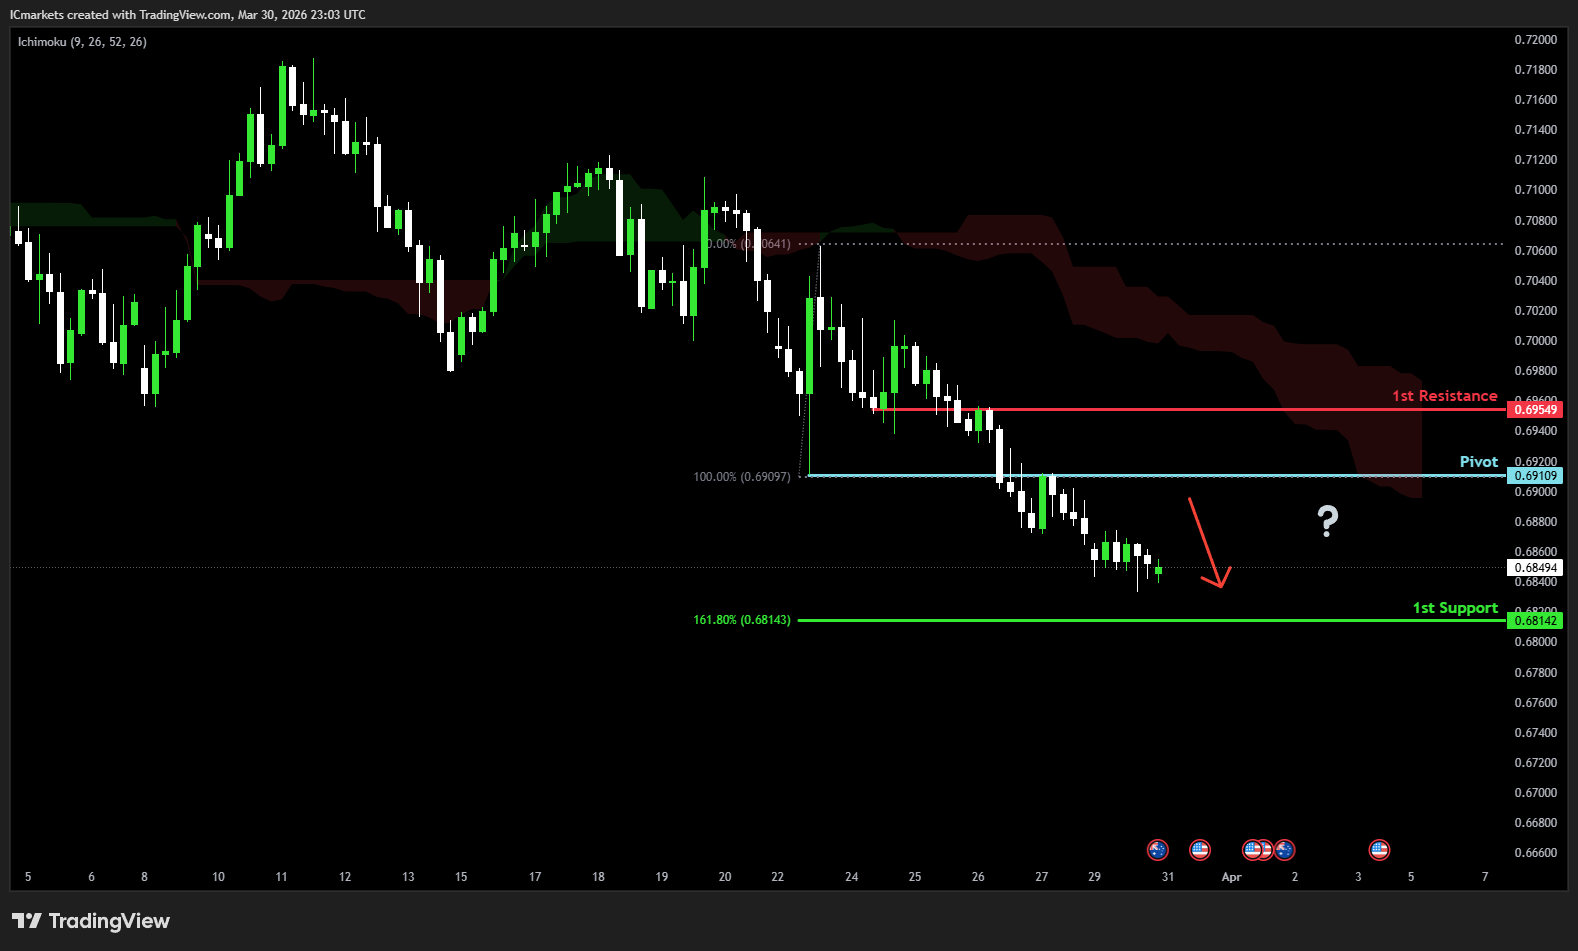
AUD/USD:
Potential Direction: Bearish
Overall momentum of the chart: Bullish
The price could see a short-term pullback toward the pivot before continuing its bearish move down toward the 1st support.
Pivot: 0.6910
Supporting reasons: Identified as a pullback resistance, where selling pressures could intensify and potentially cap any upward retracement.
1st support: 0.6814
Supporting reasons: Identified as a support that aligns with the 161.8% Fibonacci extension, this area has provided strong support historically and may attract buying interest for a potential short-term bounce
1st resistance: 0.6954
Supporting reasons: Identified as an overlap resistance, indicating a potential area that could halt any further upward movement.
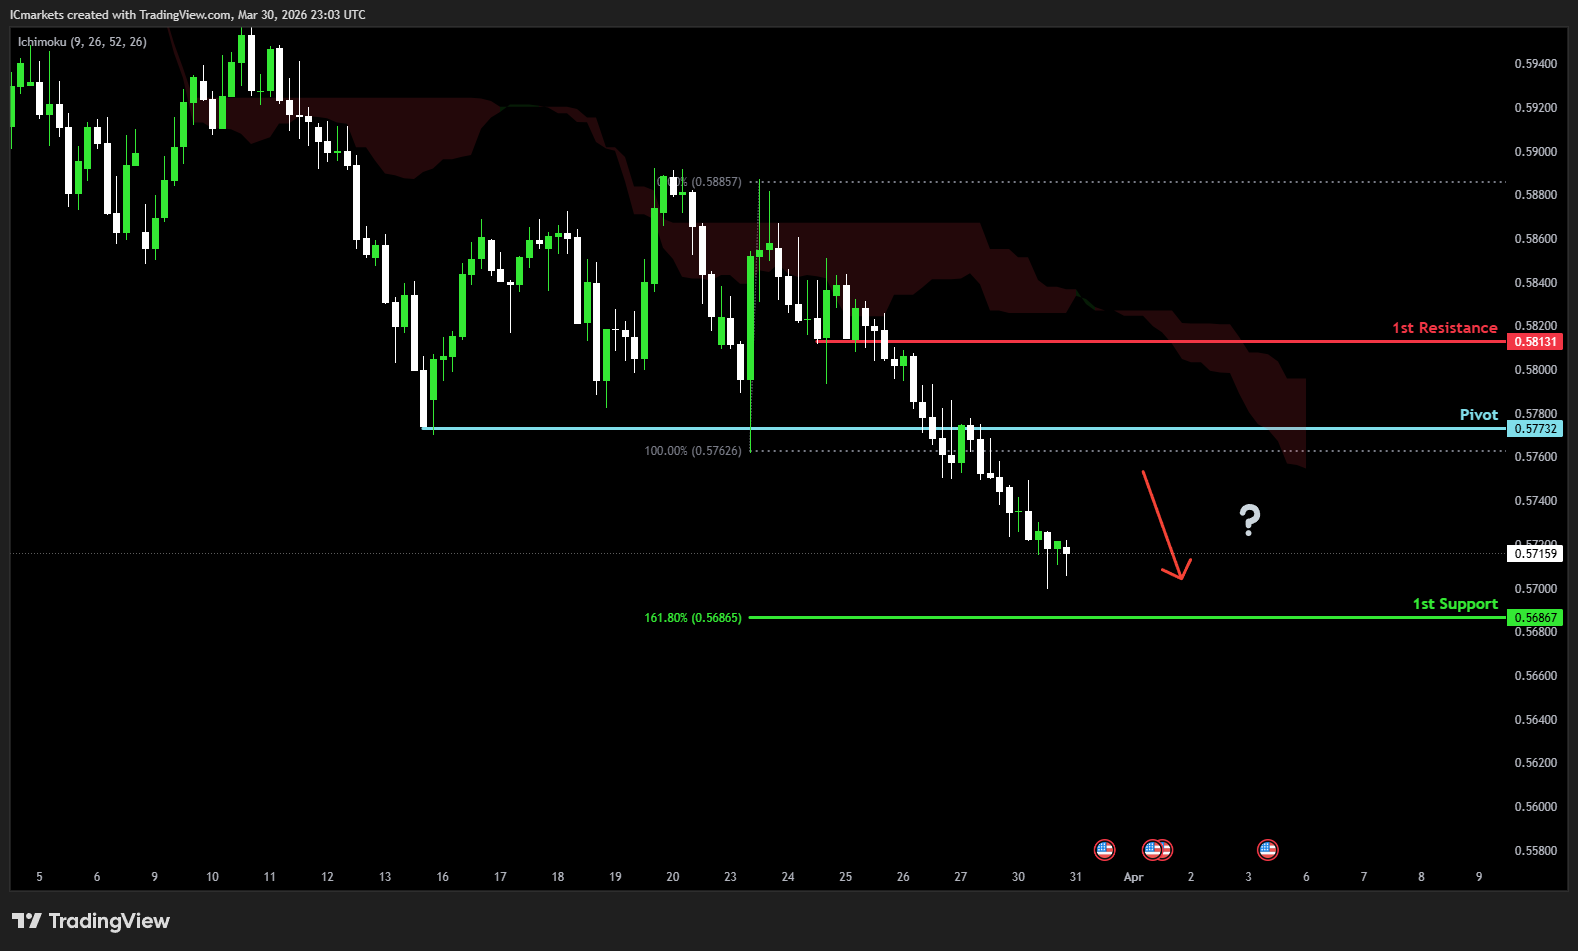
NZD/USD
Potential Direction: Bearish
Overall momentum of the chart: Bullish
The price has already reacted off the pivot and may continue its bearish move toward the 1st support.
Pivot: 0.5773
Supporting reasons: Identified as an overlap resistance, where selling pressures could intensify and potentially cap any upward retracement.
1st support: 0.5686
Supporting reasons: Identified as a support that aligns with the 161.8% Fibonacci extension, this area has provided strong support historically and may attract buying interest for a potential short-term bounce
1st resistance: 0.5813
Supporting reasons: Identified as a pullback resistance, indicating a potential area that could halt any further upward movement.
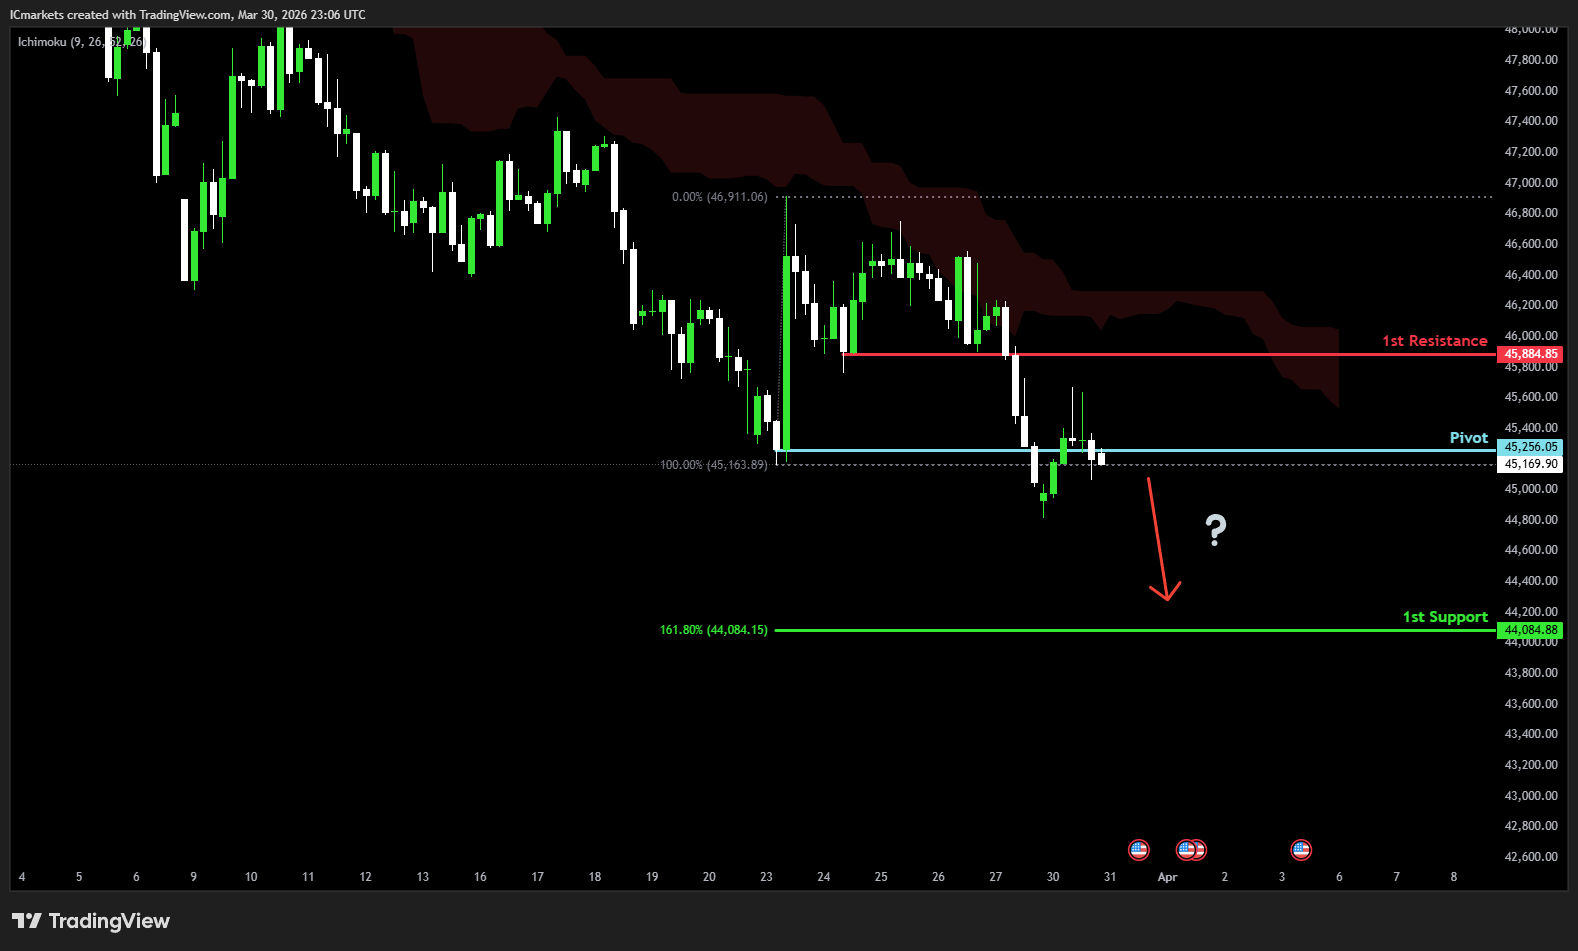
US30 (DJIA):
Potential Direction: Bearish
Overall momentum of the chart: Bullish
The price has already reacted off the pivot and may continue its bearish move toward the 1st support.
Pivot: 45,256.05
Supporting reasons: Identified as an overlap resistance, where selling pressures could intensify and potentially cap any upward retracement.
1st support: 44,084.88
Supporting reasons: Identified as a support that aligns with the 161.8% Fibonacci extension, suggesting a potential area where the price could stabilize once again.
1st resistance: 45,884.85
Supporting reasons: Identified as a pullback resistance, indicating a potential area that could halt any further upward movement.
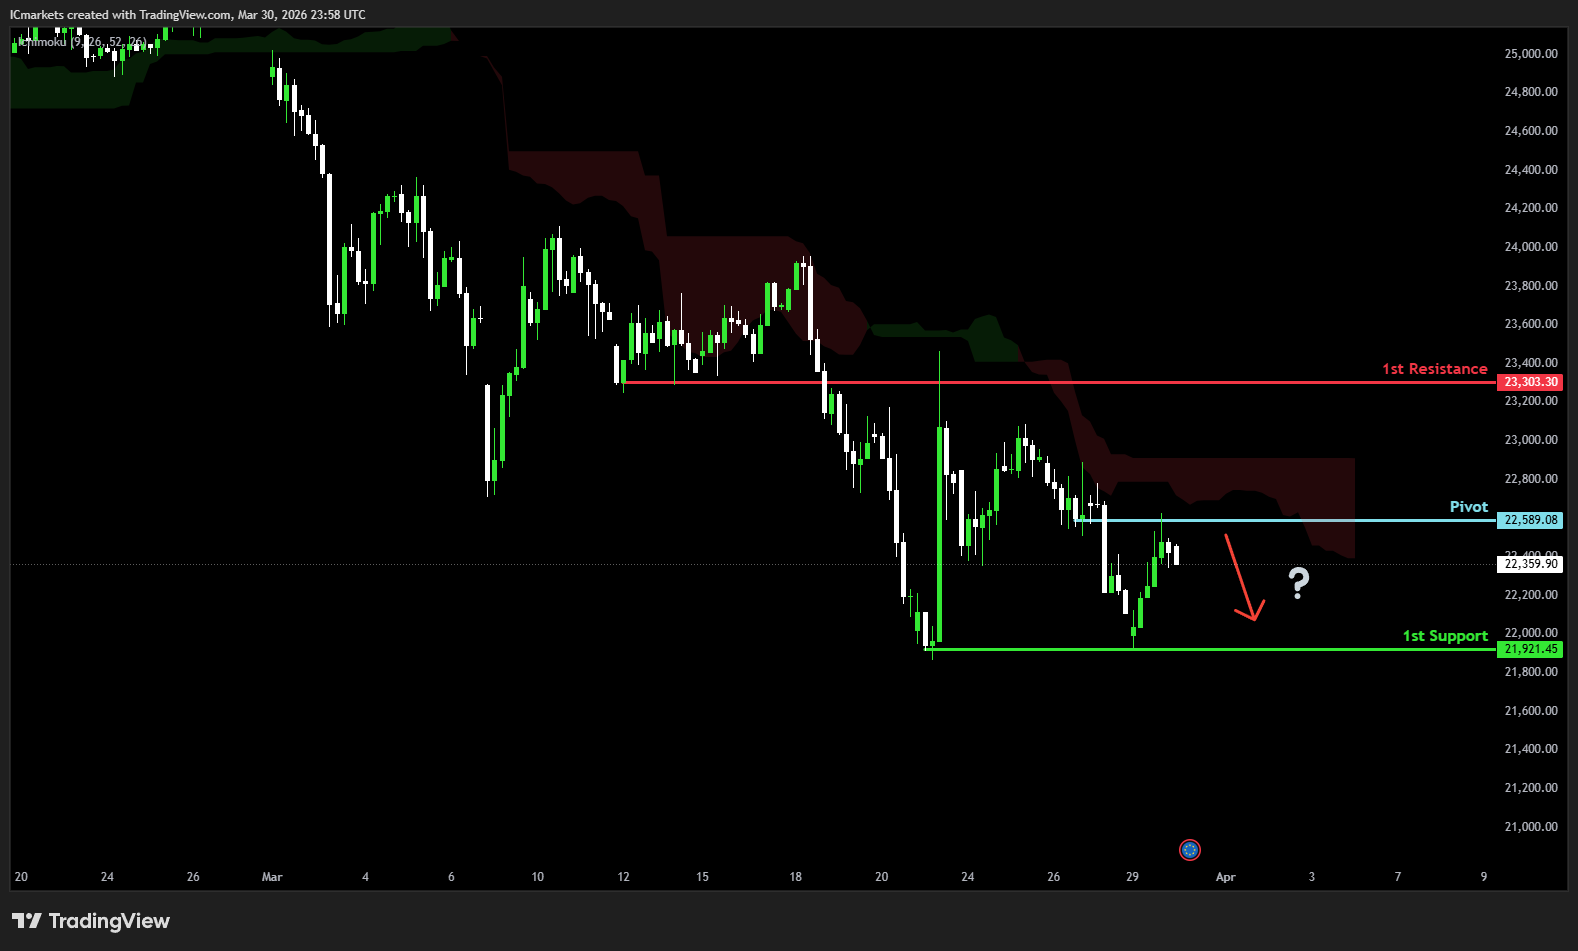
DE40 (DAX):
Potential Direction: Bearish
Overall momentum of the chart: Bullish
The price has already reacted off the pivot and may continue its bearish move toward the 1st support.
Pivot: 22,589.08
Supporting reasons: Identified as an overlap resistance, where selling pressures could intensify and potentially cap any upward retracement.
1st support: 21,921.45
Supporting reasons: Identified as a swing low support, indicating a key level where the price could stabilize once more.
1st resistance: 23.303.30
Supporting reasons: Identified as an overlap resistance, indicating a potential area that could halt any further upward movement.
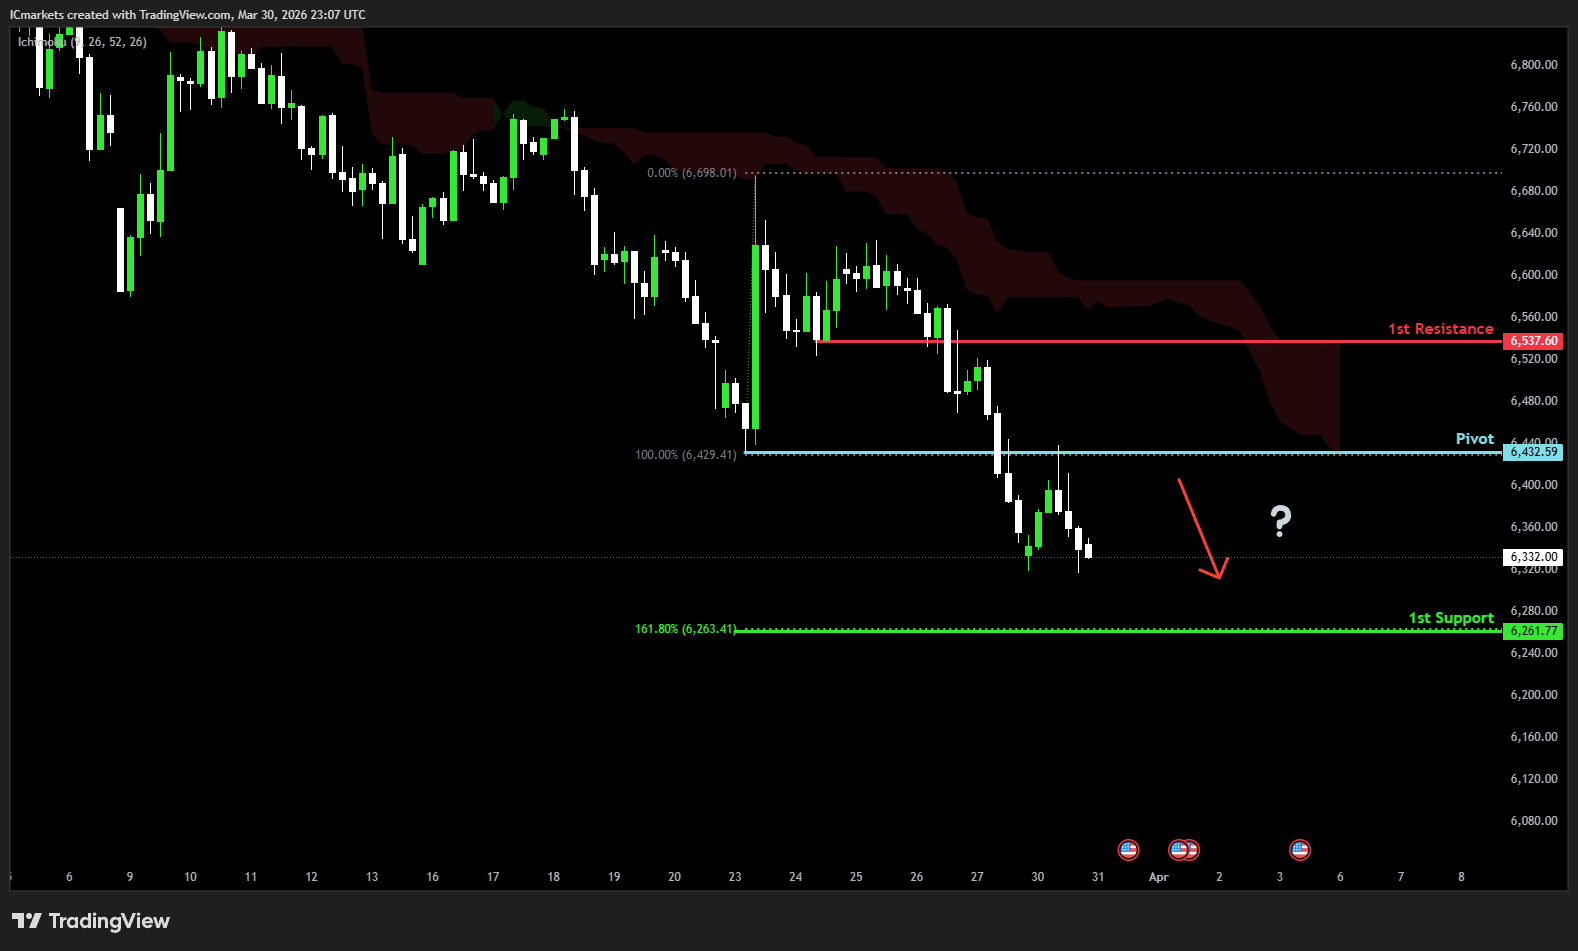
US500 (S&P 500):
Potential Direction: Bearish
Overall momentum of the chart: Bullish
The price has already reacted off the pivot and may continue its bearish move toward the 1st support.
Pivot: 6,432.59
Supporting reasons: Identified as an overlap resistance, where selling pressures could intensify and potentially cap any upward retracement.
1st support: 6,432.59
Supporting reasons: Identified as a support that aligns with the 161.8% Fibonacci extension, indicating a potential level where the price could stabilize once again.
1st resistance: 6,537.60
Supporting reasons: Identified as a pullback resistance, indicating a potential area that could halt any further upward movement.
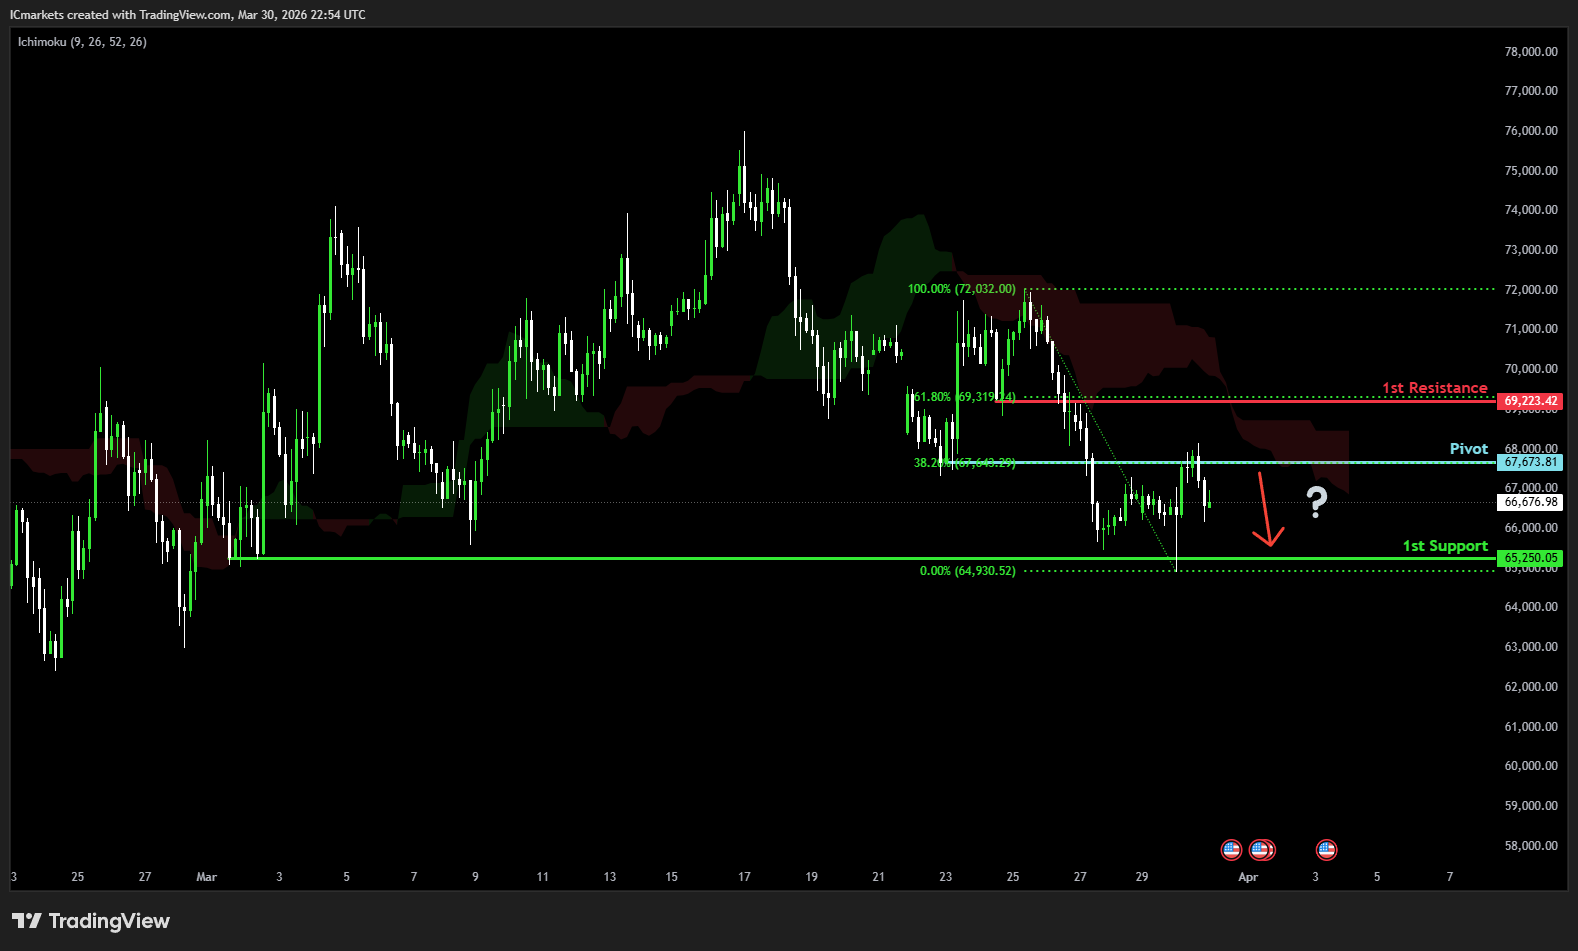
BTC/USD (Bitcoin):
Potential Direction: Bearish
Overall momentum of the chart: Bearish
The price could see a short-term pullback toward the pivot before continuing its bearish move down toward the 1st support.
Pivot: 67,673.42
Supporting reasons: Identified as a pullback resistance that aligns with the 38.2% Fibonacci retracement, where selling pressures could intensify and potentially cap any upward retracement.
1st support: 65,250.42
Supporting reasons: Identified as a swing low support, indicating a potential level where the price could stabilize once more.
1st resistance: 69,223.42
Supporting reasons: Identified as a pullback resistance that aligns with the 61.8% Fibonacci retracement, indicating a potential area that could halt any further upward movement.
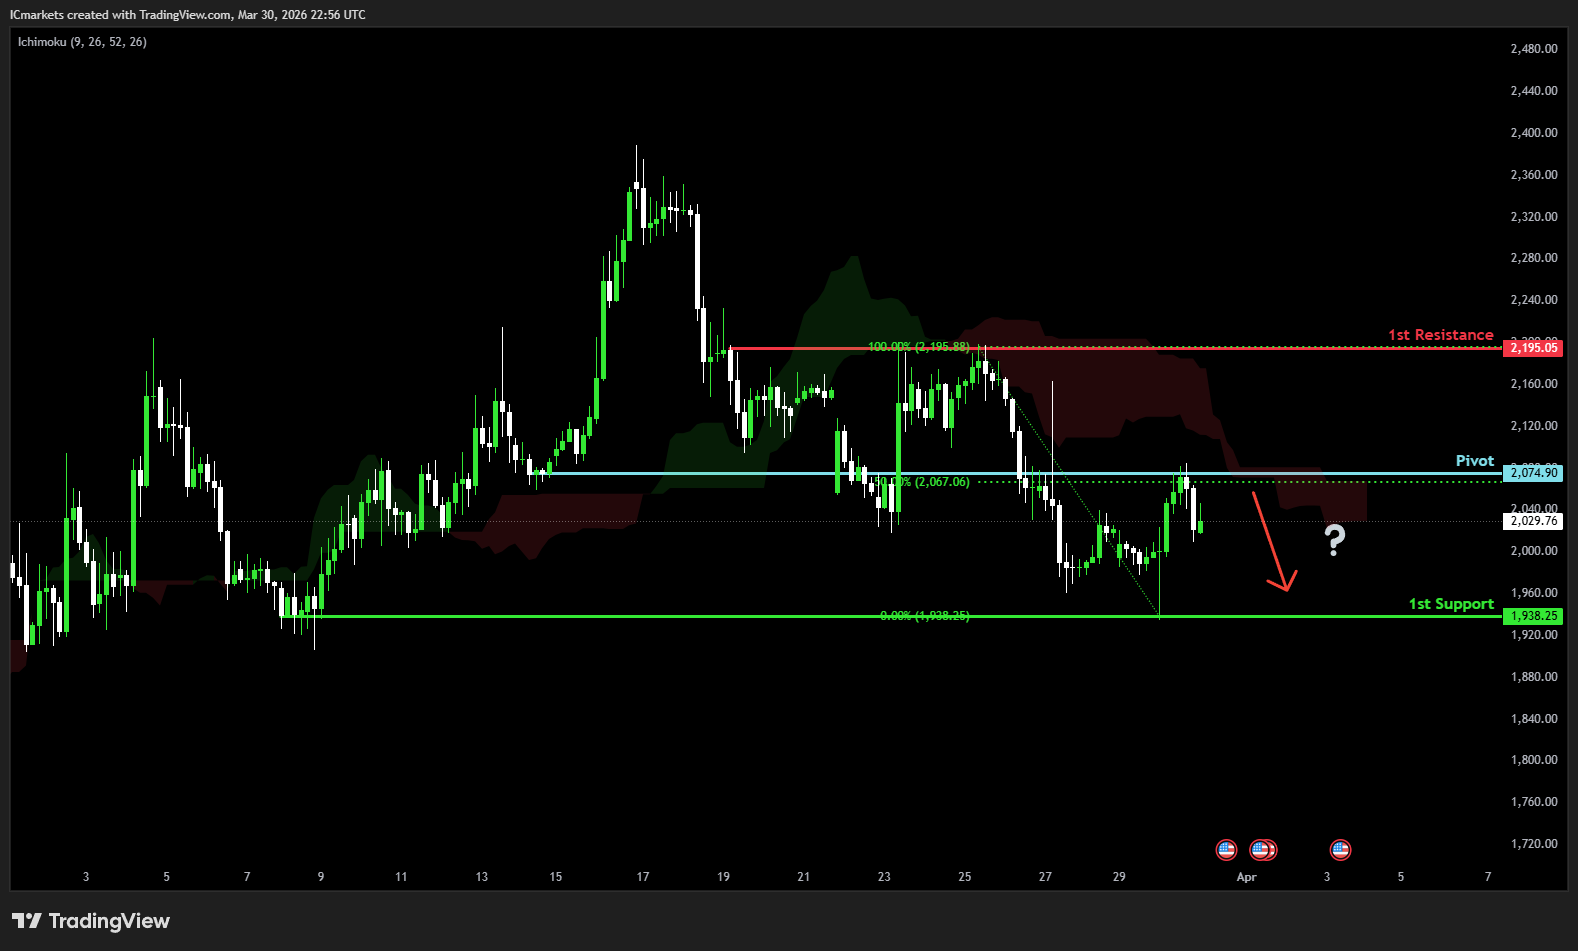
ETH/USD (Ethereum):
Potential Direction: Bearish
Overall momentum of the chart: Bullish
The price has already reacted off the pivot and may continue its bearish move toward the 1st support.
Pivot: 2,074.90
Supporting reasons: Identified as an overlap resistance that aligns with the 50% Fibonacci retracement, where selling pressures could intensify and potentially cap any upward retracement.
1st support: 1,938.25
Supporting reasons: Identified as a multi-swing low support, indicating a potential level where the price could stabilize once more.
1st resistance: 2,195.05
Supporting reasons: Identified as a swing high resistance, indicating a potential area that could halt any further upward movement.
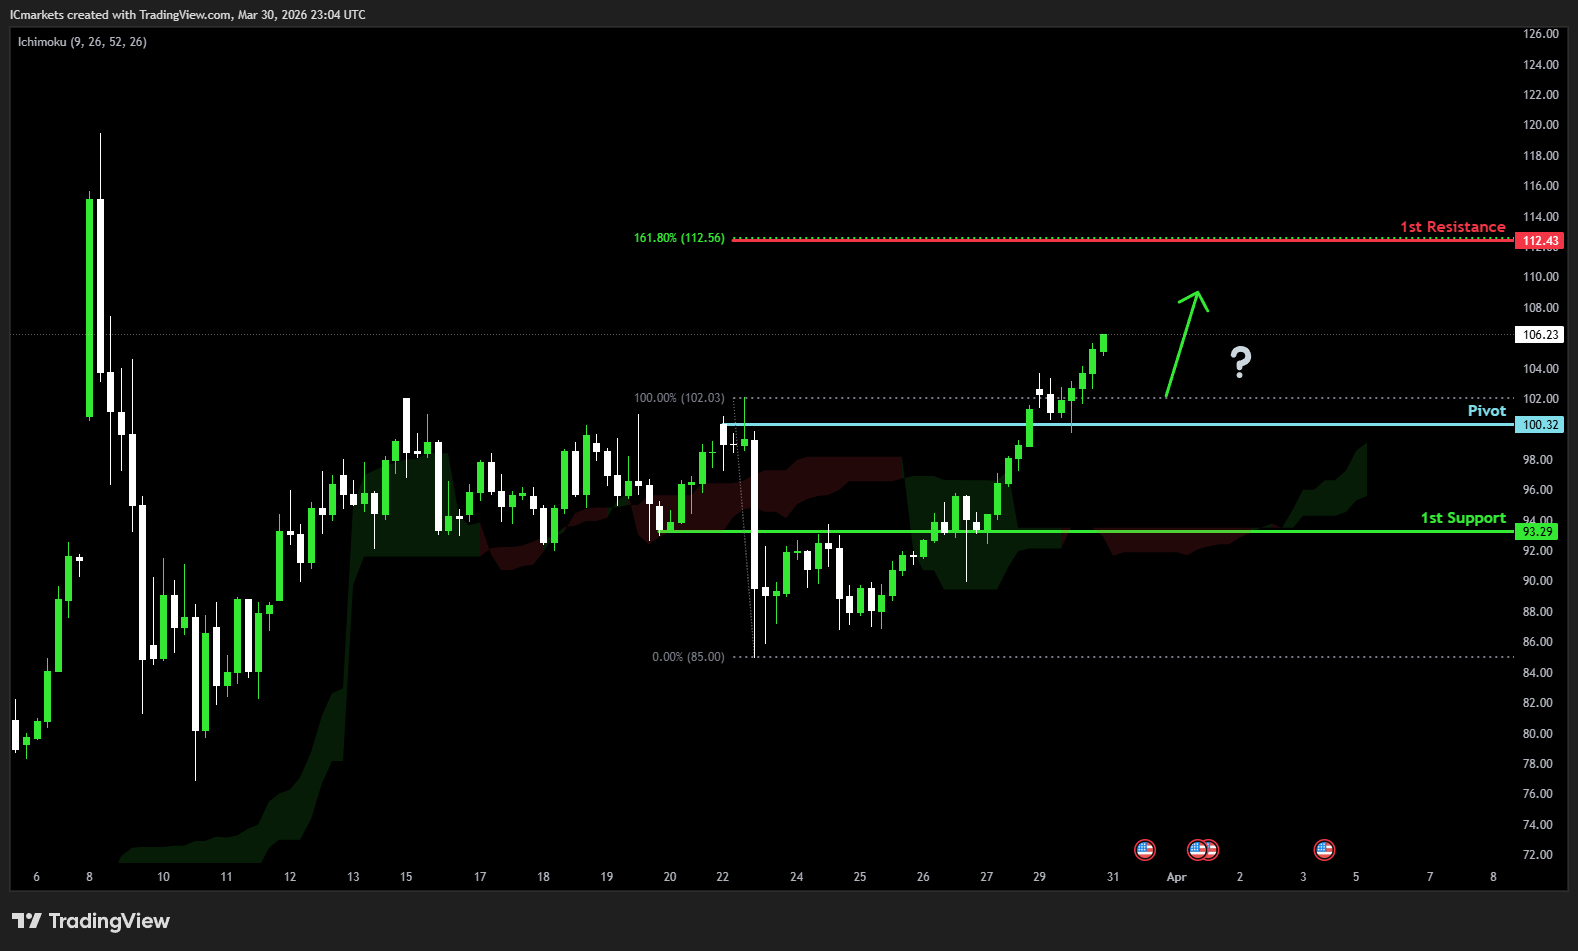
WTI/USD (Oil):
Potential Direction: Bullish
Overall momentum of the chart: Bullish
The price could see a short-term pullback toward the pivot before rising again toward the 1st resistance.
Pivot: 100.32
Supporting reasons: Identified as a pullback support, where renewed buying pressure could emerge to push the price higher.
1st support: 93.29
Supporting reasons: Identified as an overlap support, indicating a key level where the price could stabilize once more.
1st resistance: 112.43
Supporting reasons: Identified as a resistance that aligns with the 161.8% Fibonacci extension, indicating a potential area that could halt any further upward movement.
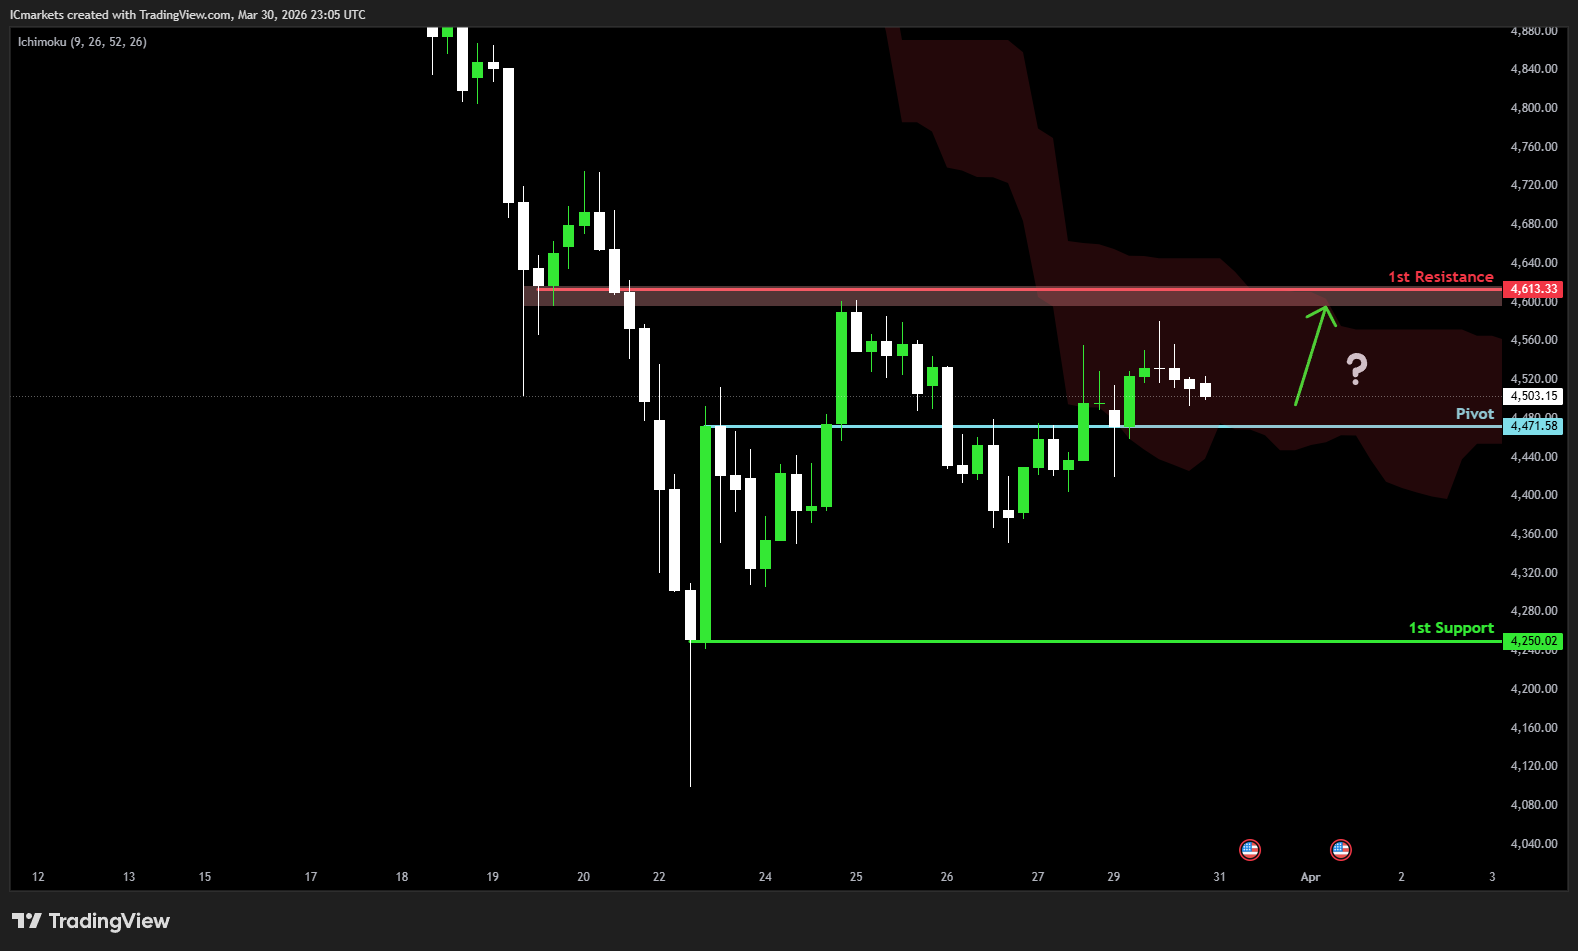
XAU/USD (GOLD):
Potential Direction: Bullish
Overall momentum of the chart: Bullish
The price could see a short-term pullback toward the pivot before rising again toward the 1st resistance.
Pivot: 4,471.58
Supporting reasons: Identified as a pullback support, where renewed buying pressure could emerge to push the price higher.
1st support: 4,250.02
Supporting reasons: Identified as a swing low support, indicating a key level where the price could stabilize once more.
1st resistance: 4,613.33
Supporting reasons: Identified as an overlap resistance, indicating a potential area that could halt any further upward movement.
The accuracy, completeness and timeliness of the information contained on this site cannot be guaranteed. IC Markets Global does not warranty, guarantee or make any representations, or assume any liability regarding financial results based on the use of the information in the site.
News, views, opinions, recommendations and other information obtained from sources outside of www.icmarkets.com, used in this site are believed to be reliable, but we cannot guarantee their accuracy or completeness. All such information is subject to change at any time without notice. IC Markets Global assumes no responsibility for the content of any linked site.
The fact that such links may exist does not indicate approval or endorsement of any material contained on any linked site. IC Markets Global is not liable for any harm caused by the transmission, through accessing the services or information on this site, of a computer virus, or other computer code or programming device that might be used to access, delete, damage, disable, disrupt or otherwise impede in any manner, the operation of the site or of any user’s software, hardware, data or property.
The post Tuesday 31st March 2026: Technical Outlook and Review first appeared on IC Your Trading Edge | Official Blog.
IC Markets – Asia Fundamental Forecast | 31 March 2026
429092 March 31, 2026 15:00 ICMarkets Market News
IC Markets – Asia Fundamental Forecast | 31 March 2026
What happened in the U.S. session?
The U.S. session overnight saw no fresh macro data but intense focus on the escalating U.S.-Iran war, pushing oil past $115/barrel amid Strait of Hormuz disruptions and reigniting inflation via prior 1.3% import price surges, driving Treasury yields to 4.44%+ and equities deeper into corrections (Nasdaq/Dow down >10% from peaks); crude oil, stocks, and bonds bore the brunt, while gold stabilized post-plunge and USD gained on Fed hawkishness.
What does it mean for the Asia Session?
Escalating Iran‑Gulf tensions, which are underpinning oil volatility and safe‑haven demand, while keeping a close eye on USD/JPY near intervention‑watch levels and the yen’s reaction to any verbal or policy signals from Tokyo; equities in Japan, Korea, and China will balance domestic fundamentals against renewed global risk‑off shocks, so open‑price gaps and intraday flows in tech and energy‑linked sectors will be crucial markers for positioning into the global session.
The Dollar Index (DXY)
Key news events today
JOLTS Job Openings(2:00 pm GMT)
CB Consumer Confidence (2:00 pm GMT)
What can we expect from DXY today?
The US Dollar has experienced a mixed performance leading into March 31, 2026, with its recent rally stalling amid a pivotal central bank week, ongoing Middle East tensions, and hawkish signals from the Federal Reserve. Influenced by elevated oil prices, geopolitical risks boosting safe-haven demand, and revised expectations for fewer Fed rate cuts (with probabilities shifting toward steady rates through 2026).
Central Bank Notes:
- The Federal Open Market Committee (FOMC) is widely expected to hold the federal funds rate target range steady at 3.50%–3.75% at its March 17–18, 2026, meeting, amid rising oil prices from the US-Israel war against Iran and persistent inflation pressures, delaying any 2026 cuts potentially to September.
- The Committee continues to pursue maximum employment and 2% inflation goals, with the labor market weakening further as nonfarm payrolls declined by 92,000 in February 2026 and the unemployment rate rose to 4.4% from 4.3% in January.
- Officials face tilted risks from geopolitical tensions, elevated oil prices, and sticky inflation, with CPI steady at 2.4% year-over-year in February 2026, headline PCE at 2.8% in January, and core PCE rising to 3.1%.
- Economic activity has cooled after robust Q4 2025 growth near 5%, with the Atlanta Fed GDPNow now estimating Q1 2026 growth at around 2.1%–2.7% amid softer consumer spending and labor data.
- December 2025’s Summary of Economic Projections forecasts 2025 unemployment at a median of 4.5%, 2026 GDP growth at 2.3%, and core PCE at 2.5%, with the dot plot signaling one more cut in 2026 to a median 3.4% funds rate; March updates may reflect softer labor and inflation upticks.
- The Committee maintains its data-dependent stance amid a softening labor market, inflation above target, and new oil shocks, likely holding rates at 3.50%-3.75% with ongoing divisions and possible hawkish dissents on rate cuts.
- The FOMC continues its adjusted quantitative tightening, with Treasury rolloff caps at $5 billion per month and agency MBS at $35 billion per month to ensure ample reserves post-2025 program adjustments.
- The next meeting is scheduled for 28 to 29 April 2026.
Next 24 Hours Bias
Medium Bullish
Gold (XAU)
Key news events today
JOLTS Job Openings(2:00 pm GMT)
CB Consumer Confidence (2:00 pm GMT)
What can we expect from Gold today?
Gold steadied around $4,493 per ounce after a brutal March correction exceeding 10%, triggered by a robust US dollar, elevated yields, and deleveraging post-US-Iran war spikes that hit $5,600 highs. While short-term forecasts eye $4,376-$4,577 ranges amid uncertainty, analysts anticipate rebounds fueled by persistent geopolitics and easing expectations, tempering the decline as tactical rather than structural.
Next 24 Hours Bias
Weak Bearish
The Australian Dollar (AUD)
Key news events today
No major news event
What can we expect from AUD today?
The Australian dollar is consolidating in the mid‑0.60s to low‑0.70s versus the US dollar after a strong early‑year rally, as the RBA’s back‑to‑back rate hikes to 4.10% and a market‑priced path toward 4.35% by mid‑2026 provide structural support, while Middle‑East‑related oil‑shock risks, US–Iran tensions, and intermittent safe‑haven demand for the greenback and yen keep upside capped and AUD mildly softer over the past month despite a solid 12‑month gain.
Central Bank Notes:
- The Reserve Bank of Australia (RBA) is expected to hold its cash rate at 3.85% at the March 16-17, 2026 policy meeting, following the widely anticipated 25 basis point hike to 3.85% in early February after persistent inflation pressures from late 2025. While some banks like CBA, NAB, and Westpac now forecast a further 25 basis point rise to 4.10% as soon as May if inflation data remains sticky, consensus tilts toward a pause in March to assess incoming monthly CPI and labor market signals. The February hike reversed prior cuts, entering mildly restrictive territory amid capacity pressures, with the board emphasizing data dependence.
- Inflation remains elevated, with December 2025 CPI at 3.8% year-on-year and trimmed mean at 3.3%, above the 2–3% target midpoint. RBA’s February Statement revised forecasts higher, projecting trimmed-mean inflation to peak in mid-2026 above 3% and remain elevated through early 2027, driven by services, housing, and demand resilience despite some monthly cooling, such as January’s 0.2% MoM gauge. Monthly CPI data continues to highlight core stickiness beyond energy rebates, delaying the target return to late 2027 or beyond.
- January 2026 monthly indicators showed modest easing, but headline CPI risks upward surprises from housing (up recently) and services amid firm domestic demand. Trimmed mean pressures persist from wage growth and capacity constraints, with consumer expectations ticking to 5% YoY in February surveys. Enhanced monthly reporting sharpens vigilance on potential broad-based pick-up.
- The labor market shows softening, with unemployment around 4.1-4.4%, down slightly to 4.1% in December, but unit labor costs are elevated due to subdued productivity. Household spending faces higher borrowing costs post-hike, yet private demand recovery sustains capacity strains. Vulnerabilities persist amid resilient employment dynamics.
- Global growth modestly revised up but tempered by geopolitics and commodity volatility; policy now restrictive post-February, with the RBA balancing inflation against employment risks. Data from the monthly CPI and Q1 GDP will guide, amid household debt sensitivities.
- Sustained restrictive stance post-February anchors inflation return to target, upholding dual mandate with flexibility to new risks like further inflation upticks.
- Markets price a March hold at 3.85%, with big four banks split: CBA, NAB, Westpac eye May hike to 4.10% if persistence continues, while others see limited upside unless acceleration. Upcoming monthly CPI pivotal for Q2 trajectory.
- Policy vigilance counters inflation stickiness against household fragilities and global uncertainties, reaffirming adaptability under dual mandate.
- Base case favors March hold with risks tilted hawkish for further hikes if data is hot; monthly indicators key to 2026 path.
- The next meeting is on 5 to 6 May 2026.
Next 24 Hours Bias
Medium Bearish
The Kiwi Dollar (NZD)
Key news events today
No major news event
What can we expect from NZD today?
The New Zealand dollar has edged lower, consolidating around NZD/USD 0.573–0.584 after a volatile run through March, with the kiwi struggling to sustain breaks above 0.59 as a firm US dollar and Middle‑East‑related risk‑off flows weigh on risk‑sensitive currencies. Underlying fundamentals remain mixed: the RBNZ is holding rates at 2.25%, but markets still price in a potential hike later this year.
Central Bank Notes:
- The Monetary Policy Committee (MPC) left the Official Cash Rate (OCR) unchanged at 2.25% at its 18 February 2026 meeting, as widely expected, maintaining a unanimous decision and emphasizing a balance between supporting the nascent economic recovery and ensuring inflation returns sustainably to the 2% midpoint of the 1–3% target band.
- The Committee judged that the prior cumulative easing of 325 basis points provides ongoing stimulus, warranting patience amid uneven recovery signals, while noting readiness to normalize policy gradually as inflation pressures subside and activity strengthens.
- Headline CPI inflation, recently at 3.1%, is projected to dip back within the target band in the coming quarter—supported by spare capacity, modest wage growth, and declining food/fuel prices—before reaching 2.0% by mid-2027, with two-year-ahead business expectations edging up to 2.37%.
- Domestic demand shows gradual stabilization with softer household spending and a muted housing market, partially offset by easing retail rates boosting budgets, though cautious consumption, low migration, and a weak labour market continue to cap services inflation as wage moderation takes hold.
- Financial conditions remain accommodative as lower OCR flows through to borrowing costs, aiding mortgage approvals and housing sentiment, but business credit growth stays subdued amid uneven confidence and sensitivity to the recovery’s pace.
- Recent indicators point to weak but steadying GDP momentum in an early-stage rebound from 2025 lows, with high-frequency data showing gradual broadening despite persistent headwinds from elevated costs, fragile sentiment, and subdued investment.
- External risks are now viewed as balanced rather than downside-skewed, with a supportive global backdrop offsetting prior concerns over China and US trade policy, while a lower NZ dollar aids exports and tradables inflation.
- Looking to mid-2026, the MPC adopted a data-dependent stance with forecasts signaling OCR hikes likely from late 2026 or early 2027—potentially as soon as December if activity or inflation exceeds projections—while keeping policy accommodative for now if the gradual recovery aligns with expectations.
- The next meeting is on 7 April 2026.
Next 24 Hours Bias
Weak Bearish
The Japanese Yen (JPY)
Key news events today
No major news event
What can we expect from JPY today?
The Japanese Yen faced persistent downward pressure, with USD/JPY near 160 amid policy-driven volatility, oil shocks, and USD resilience. Traders eyed intervention risks and technical buys for near-term direction, against a backdrop of the yen weakening 1.78% monthly.
Central Bank Notes:
- The Policy Board of the Bank of Japan meets on 18–19 April 2026, with markets anticipating the short-term policy rate to remain at 0.75%, as the bank continues evaluating the December 2025 and prior hikes’ effects amid data-dependent normalization.
- The BOJ will target the uncollateralized overnight call rate around 0.75% and indicate future hikes hinge on impacts to lending, financing, and activity, with Governor Ueda signaling scrutiny of data for potential moves in April or later meetings.
- JGB tapering advances per plan, cutting outright purchases by ¥400 billion quarterly through Q1 2026 and slowing to ¥200 billion from April onward, targeting roughly ¥2-3 trillion monthly by mid-2026, adjustable for market stability
- Japan’s economy maintains moderate growth into Q1 2026, building on Q4 2025 rebound via exports and fiscal measures, though manufacturing sentiment holds soft amid overseas demand weakness and yen pressures.
- Core CPI (ex-fresh food) likely stays near 2.3-2.5% y/y in early 2026 Tokyo prints, off prior highs but above 2%, while core-core hovers around 2.6%, reflecting sustained but easing inflationary forces.
- Input costs ease further from import peaks, yet services inflation, 5% wage targets in shunto talks, and anchored expectations above 2% support price persistence, with upside risks from yen and geopolitics.
- Near-term real GDP may ease below trend due to tightening and external shocks like Iran tensions, but negative real rates, wage gains, and stimulus should underpin consumption and capex rebound.
- Medium-term, overseas recovery, labor shortages, and productivity lifts are set to fuel wages and core inflation near/above 2%, enabling gradual hikes toward 1% if conditions align.
- The next meeting is on 27 to 28 April 2026.
Next 24 Hours Bias
Weak Bearish
Oil
Key news events today
API Crude Oil Stock (8:30 pm GMT)
What can we expect from Oil today?
Oil prices remain elevated amid persistent Middle East conflict risk, with Brent near 105–110 USD per barrel and WTI above 90 USD, supported by disruptions around the Strait of Hormuz and mixed signals on US–Iran ceasefire negotiations. OPEC’s planned modest output hikes and the release of strategic reserves by some G7 countries have done little to fully offset the geopolitical risk premium.
Next 24 Hours Bias
Strong Bullish
The post IC Markets – Asia Fundamental Forecast | 31 March 2026 first appeared on IC Your Trading Edge | Official Blog.
IC Markets – Europe Fundamental Forecast | 31 March 2026
429091 March 31, 2026 15:00 ICMarkets Market News
IC Markets – Europe Fundamental Forecast | 31 March 2026
What happened in the Asia session?
Risk-off backdrop tied to the broader Middle‑East conflict and elevated oil prices, overlaid with softer‑than‑expected Tokyo CPI (which capped the yen rally) and mildly constructive but still vulnerable Chinese PMI prints, leading to a clear underperformance in JPY‑crosses such as USD/JPY near intervention‑watch levels, pressure on commodity‑linked AUD, and downside bias in regional equities, especially Japan and Korea, while oil and energy‑linked instruments remained well bid.
What does it mean for the Europe & US sessions?
Persistent growth fears and elevated oil prices are anchoring global risk‑off positioning, with the S&P 500 and Nasdaq near seven‑month lows and bond yields under pressure ahead of key U.S. labor and consumer‑confidence data. In Europe, traders are watching early‑session macro prints and EUR‑denominated bond flows for signals on how the ECB’s policy stance is balancing inflation control against slowing growth, all within a broader environment of heightened geopolitical risk.
The Dollar Index (DXY)
Key news events today
JOLTS Job Openings(2:00 pm GMT)
CB Consumer Confidence (2:00 pm GMT)
What can we expect from DXY today?
The US dollar is trading near multi‑month highs versus most major currencies, buoyed by month‑ and quarter‑end portfolio rebalancing, elevated Middle East war risk, and diminished hopes for early Fed rate cuts. The greenback is on track for its largest monthly gain since July, outperforming the yen, euro, and several commodity‑linked currencies, while gold and other risk‑sensitive assets struggle under the same higher‑for‑longer US rate backdrop.
Central Bank Notes:
- The Federal Open Market Committee (FOMC) is widely expected to hold the federal funds rate target range steady at 3.50%–3.75% at its March 17–18, 2026, meeting, amid rising oil prices from the US-Israel war against Iran and persistent inflation pressures, delaying any 2026 cuts potentially to September.
- The Committee continues to pursue maximum employment and 2% inflation goals, with the labor market weakening further as nonfarm payrolls declined by 92,000 in February 2026 and the unemployment rate rose to 4.4% from 4.3% in January.
- Officials face tilted risks from geopolitical tensions, elevated oil prices, and sticky inflation, with CPI steady at 2.4% year-over-year in February 2026, headline PCE at 2.8% in January, and core PCE rising to 3.1%.
- Economic activity has cooled after robust Q4 2025 growth of nearly 5%, with the Atlanta Fed GDPNow now estimating Q1 2026 growth at around 2.1%–2.7% amid softer consumer spending and labour data.
- December 2025’s Summary of Economic Projections forecasts 2025 unemployment at a median of 4.5%, 2026 GDP growth at 2.3%, and core PCE at 2.5%, with the dot plot signalling one more cut in 2026 to a median 3.4% funds rate; March updates may reflect softer labor and inflation upticks.
- The Committee maintains its data-dependent stance amid a softening labor market, inflation above target, and new oil shocks, likely holding rates at 3.50%-3.75% with ongoing divisions and possible hawkish dissents on rate cuts.
- The FOMC continues its adjusted quantitative tightening, with Treasury rolloff caps at $5 billion per month and agency MBS at $35 billion per month to ensure ample reserves post-2025 program adjustments.
- The next meeting is scheduled for 28 to 29 April 2026.
Next 24 Hours Bias
Weak Bullish
Gold (XAU)
Key news events today
JOLTS Job Openings(2:00 pm GMT)
CB Consumer Confidence (2:00 pm GMT)
What can we expect from Gold today?
Gold prices are up about 1–1.5% day‑on‑day, trading near 4,570–4,580 USD per troy ounce as investors seek safe‑haven exposure amid renewed Middle East tensions, even though the strong U.S. dollar and dwindling hopes for near‑term Fed rate cuts have kept the metal in a volatile, correction‑heavy environment over March. Despite this bounce, gold is on track for its worst monthly performance in over 17 years, with prices down roughly 13–15% in March even though they remain well above year‑ago levels, while silver and some regional benchmarks show more mixed or modestly positive moves.
Next 24 Hours Bias
Weak Bearish
The Euro (EUR)
Key news events today
Core CPI Flash Estimate y/y (9:00 am GMT)
CPI Flash Estimate y/y (9:00 am GMT)
What can we expect from EUR today?
Today, the euro remains under pressure around 1.15 versus the dollar, heading for a more than 2% monthly loss as Middle‑East‑driven risk‑aversion and a hawkish tilt in ECB‑rate‑hike expectations keep the single currency weak, despite some technical signs of a looming corrective bounce within a broader uptrend.
Central Bank Notes:
- The Governing Council of the ECB is expected to keep the three key interest rates unchanged at its 29–30 April 2026 meeting, with the main refinancing rate at 2.15%, marginal lending facility at 2.40%, and deposit facility at 2.00%. This reflects an ongoing commitment to 2% inflation stability amid heightened uncertainties from Middle East tensions and US trade policies under President Trump. Market probabilities indicate around 58% odds of no change, though some banks now price in potential hikes due to rising inflation risks.
- Price dynamics show increasing upside pressures, with headline HICP inflation likely around 2.0-2.2% in early 2026, driven by energy costs from Middle East conflicts offsetting euro strength. Core inflation remains sticky but moderating slowly, with projections revised upward to 2.6% for 2026 overall amid hawkish signals from ECB leadership.
- Updated Eurosystem staff projections for April 2026 may forecast headline inflation at 2.1-2.2% in 2026, 1.9% in 2027, and 2.0% in 2028, with upside risks from energy and trade dominating balanced prior views. A stronger euro provides some counterbalance, but recent data revisions highlight persistent pressures.
- Euro area GDP growth holds steady, with Q2 2026 surveys suggesting 0.2-0.3% qoq growth, in line with 1.1-1.3% annual forecasts through 2027. Defence spending, infrastructure, and low unemployment support resilience against trade headwinds and softer external demand.
- The labour market remains tight, with unemployment steady near 6.4%, bolstered by wage growth and participation gains. Supportive credit conditions continue aiding investment and consumption despite global risks.
- Business sentiment is cautious amid US tariffs, geopolitical flare-ups, and supply chain easing; a somewhat weaker euro boosts exports, while fiscal measures aid domestic activity.
- The Governing Council maintains its data-dependent, meeting-by-meeting stance, scrutinizing inflation, transmission, and external shocks without pre-committing to rate paths.
- Balance sheet normalization advances smoothly, with APP/PEPP wind-downs complete and no liquidity issues; banks show ample reserves and stable funding access.
The next meeting is on 29 April 2026
Next 24 Hours Bias
Weak Bearish
The Swiss Franc (CHF)
Key news events today
No major news event
What can we expect from CHF today?
The Swiss franc is trading in a tight, risk‑off environment where its safe‑haven status keeps it relatively strong, especially versus the euro and dollar, even as the SNB hints at expanded FX intervention and keeps rates at 0% to protect exporters and financial stability through 2026. The combination of low yields, geopolitical frictions, and corporate worry about over‑valuation is keeping the franc in focus as a “collateral” beneficiary of market stress, but also one that domestic authorities are prepared to actively manage.
Central Bank Notes:
- At its monetary policy assessment on 19 March 2026, the Swiss National Bank (SNB) is widely expected to leave the policy rate unchanged at 0%, continuing the extended pause since September 2025, as the Governing Board assesses current settings as adequate to maintain inflation near the target without resorting to negative rates.
- Inflation data since December indicate persistent weakness, with headline CPI hovering around 0% year-on-year through early 2026 and core measures subdued at roughly 0.4%, underscoring limited price pressures and lingering, though contained, deflation risks.
- The SNB’s updated conditional inflation forecast shows minimal change from December, with averages of about 0.2% in 2025 (now complete), 0.3% in 2026, and 0.6% in 2027 under a steady 0% policy rate. However, recent flat CPI readings may slightly lower near-term expectations, preserving scope for further easing if needed.
- Global conditions remain challenging, marked by U.S. tariff escalations under President Trump, subdued external demand, and uncertainties in major export markets such as Europe and the U.S., prompting the SNB to exercise caution despite resilient Swiss domestic activity.
- Sentiment in manufacturing and export sectors stays soft amid franc appreciation and weaker foreign orders, squeezing margins. Yet, overall GDP growth is expected to be around 1.5% in 2026, with unemployment edging up modestly from historic lows.
- The SNB reaffirms its readiness to intervene via rate cuts or FX operations should deflationary pressures intensify, while emphasizing clear communication through detailed meeting minutes and coordination with global partners on currency matters.
The next meeting is on 18 June 2026.
Next 24 Hours Bias
Medium Bearish
The Pound (GBP)
Key news events today
No major news event
What can we expect from GBP today?
The pound is trading on the softer side versus the dollar, slipping into the low‑1.32s after recent losses and sitting within a short‑term downtrend channel, even as the medium‑term outlook remains mildly constructive with analysts penciling in a gradual recovery back toward the low‑1.30s by quarter‑end and higher levels over the next year.
Central Bank Notes:
- The Bank of England’s Monetary Policy Committee (MPC) met on 19 March 2026, maintaining the Bank Rate at 3.75 per cent in a unanimous decision, following the prior narrow 5–4 vote to hold at the 5 February 2026 meeting. This pause reflects a sharp reversal from earlier market expectations of a 25-basis-point cut, driven by a Middle East conflict sparking global energy and commodity price surges. The March meeting did not include a Monetary Policy Report, with the next one due in April.
- Quantitative tightening (QT) proceeds unchanged at the 2025 pace of gilt holdings reductions, maintaining gradual balance-sheet normalization attuned to liquidity conditions and supportive of a restrictive stance amid new shocks.
- Headline CPI inflation faces near-term upside from the energy shock, reversing prior disinflation trends in domestic prices and wages; pre-shock services inflation had eased but now contends with higher utility and input costs, keeping pressures above the 2 per cent target. MPC projections will update in April, but analysts see inflation at 3-4 per cent by the end of 2026.
- UK growth softens further into Q2 2026, with unemployment risks rising amid potential confidence drops, higher precautionary saving, and widening output gaps; regular pay growth had cooled pre-shock but now faces business cost pass-through.
- Global headwinds intensify via Middle East conflict, driving volatile energy/commodity prices and sterling/gilt swings; MPC deems direct shocks manageable if demand weakens sufficiently to limit second-round effects.
- Inflation risks now tilt upside from energy persistence and potential wage/cost embedding, offset by downside from demand slack and job losses; prior balance has shifted amid uncertainty on shock duration.
- The MPC adopts a wait-and-see posture post-shock, with policy deemed somewhat restrictive pre-event; all members are ready to act data-dependently for 2 per cent sustainability, eyeing April for fuller impact analysis and possible easing if disinflation resumes. Governor Bailey’s guidance stresses close monitoring without firm-cut commitments.
- The next meeting is on 30 April 2026.
Next 24 Hours Bias
Medium Bearish
The Canadian Dollar (CAD)
Key news events today
GDP m/m (12:30 pm GMT)
What can we expect from GBP today?
The Canadian dollar is trading slightly weaker against the U.S. dollar around USD/CAD 1.39, having given up recent gains after touching near two-month lows earlier in March amid Middle‑East‑related oil and risk‑sentiment swings. The loonie remains supported by relatively strong oil prices and expectations of a narrowing U.S.–Canada rate differential later in 2026.
Central Bank Notes:
- The Governing Council held the overnight rate target steady at 2.25% at its 25 March 2026 meeting, aligning with consensus forecasts and extending the pause in policy adjustments amid balanced risks. The Bank emphasized persistent global uncertainties from Middle East conflicts and U.S. trade policies under President Trump, but affirmed the current stance supports ongoing disinflation without immediate shifts despite elevated energy price volatility.
- U.S. tariff threats and regional geopolitical tensions continue weighing on business sentiment, though Canadian manufacturing PMI has edged higher into expansion territory, with export orders firming on energy demand. Goods exports, led by crude oil, sustained momentum into February, offsetting cautious capex as firms prioritize resilience over aggressive growth.
- Economic growth carried into Q1 2026 at an annualized pace of around 2.2%, building on Q4 2025’s solid performance, fueled by resource exports, government outlays, and manufacturing rebound. February preliminary data points to steady expansion, though winter weather and supply chain frictions modestly curbed potential upside.
- Services sector PMI climbed further above 50, with broad gains in tech, hospitality, and business services; consumer-facing areas showed tentative improvement as real wages rose, though high service costs still restrain discretionary outlays. The Bank sees this diffusion as evidence of rebalancing toward sustainable activity.
- National housing resales ticked up in January-February alongside modest price gains, buoyed by stable rates and improved affordability in select regions, while inventory buildup in urban centers prevents excessive tightening. Officials anticipate continued moderation, aided by prudent mortgage rules amid steady household formation.
- Headline CPI eased to about 2.1% year-over-year in February 2026 estimates, staying within the control band, as core gauges like CPI-trim and median dipped to near 2.7% on softer food and durable goods pressures—despite sticky shelter costs. This reinforces the Bank’s view of inflation sustainably approaching the target.
- Policymakers reiterated that 2.25% remains well-calibrated to anchor 2% inflation and foster adjustment, with no cuts signaled barring downside surprises in growth or prices. Attention now turns to Q2 durability, core inflation persistence, and evolving trade/geopolitical clarity.
- The next meeting is on 23 April 2026.
Next 24 Hours Bias
Weak Bearish
Oil
Key news events today
API Crude Oil Stock (8:30 pm GMT)
What can we expect from Oil today?
Oil prices jumped again on Tuesday, as renewed tanker attacks in the Persian Gulf and heightened U.S.–Iran tensions kept Brent crude above 110 dollars per barrel and WTI near 105 dollars, adding to a roughly 50 percent monthly surge in March. The spike reflects a large geopolitical risk premium and supply‑disruption fears centered on the Strait of Hormuz, with governments worldwide bracing for higher domestic fuel prices and markets watching closely for any shift in peace‑talk rhetoric from Washington and Tehran.
Next 24 Hours Bias
Strong Bullish
The post IC Markets – Europe Fundamental Forecast | 31 March 2026 first appeared on IC Your Trading Edge | Official Blog.
Ex-Dividend 31/03/2026
429062 March 30, 2026 17:40 ICMarkets Market News
The post Ex-Dividend 31/03/2026 first appeared on IC Your Trading Edge | Official Blog.
Easter Holidays Trading Schedule 2026
429051 March 30, 2026 17:00 ICMarkets Market News
Dear Client,
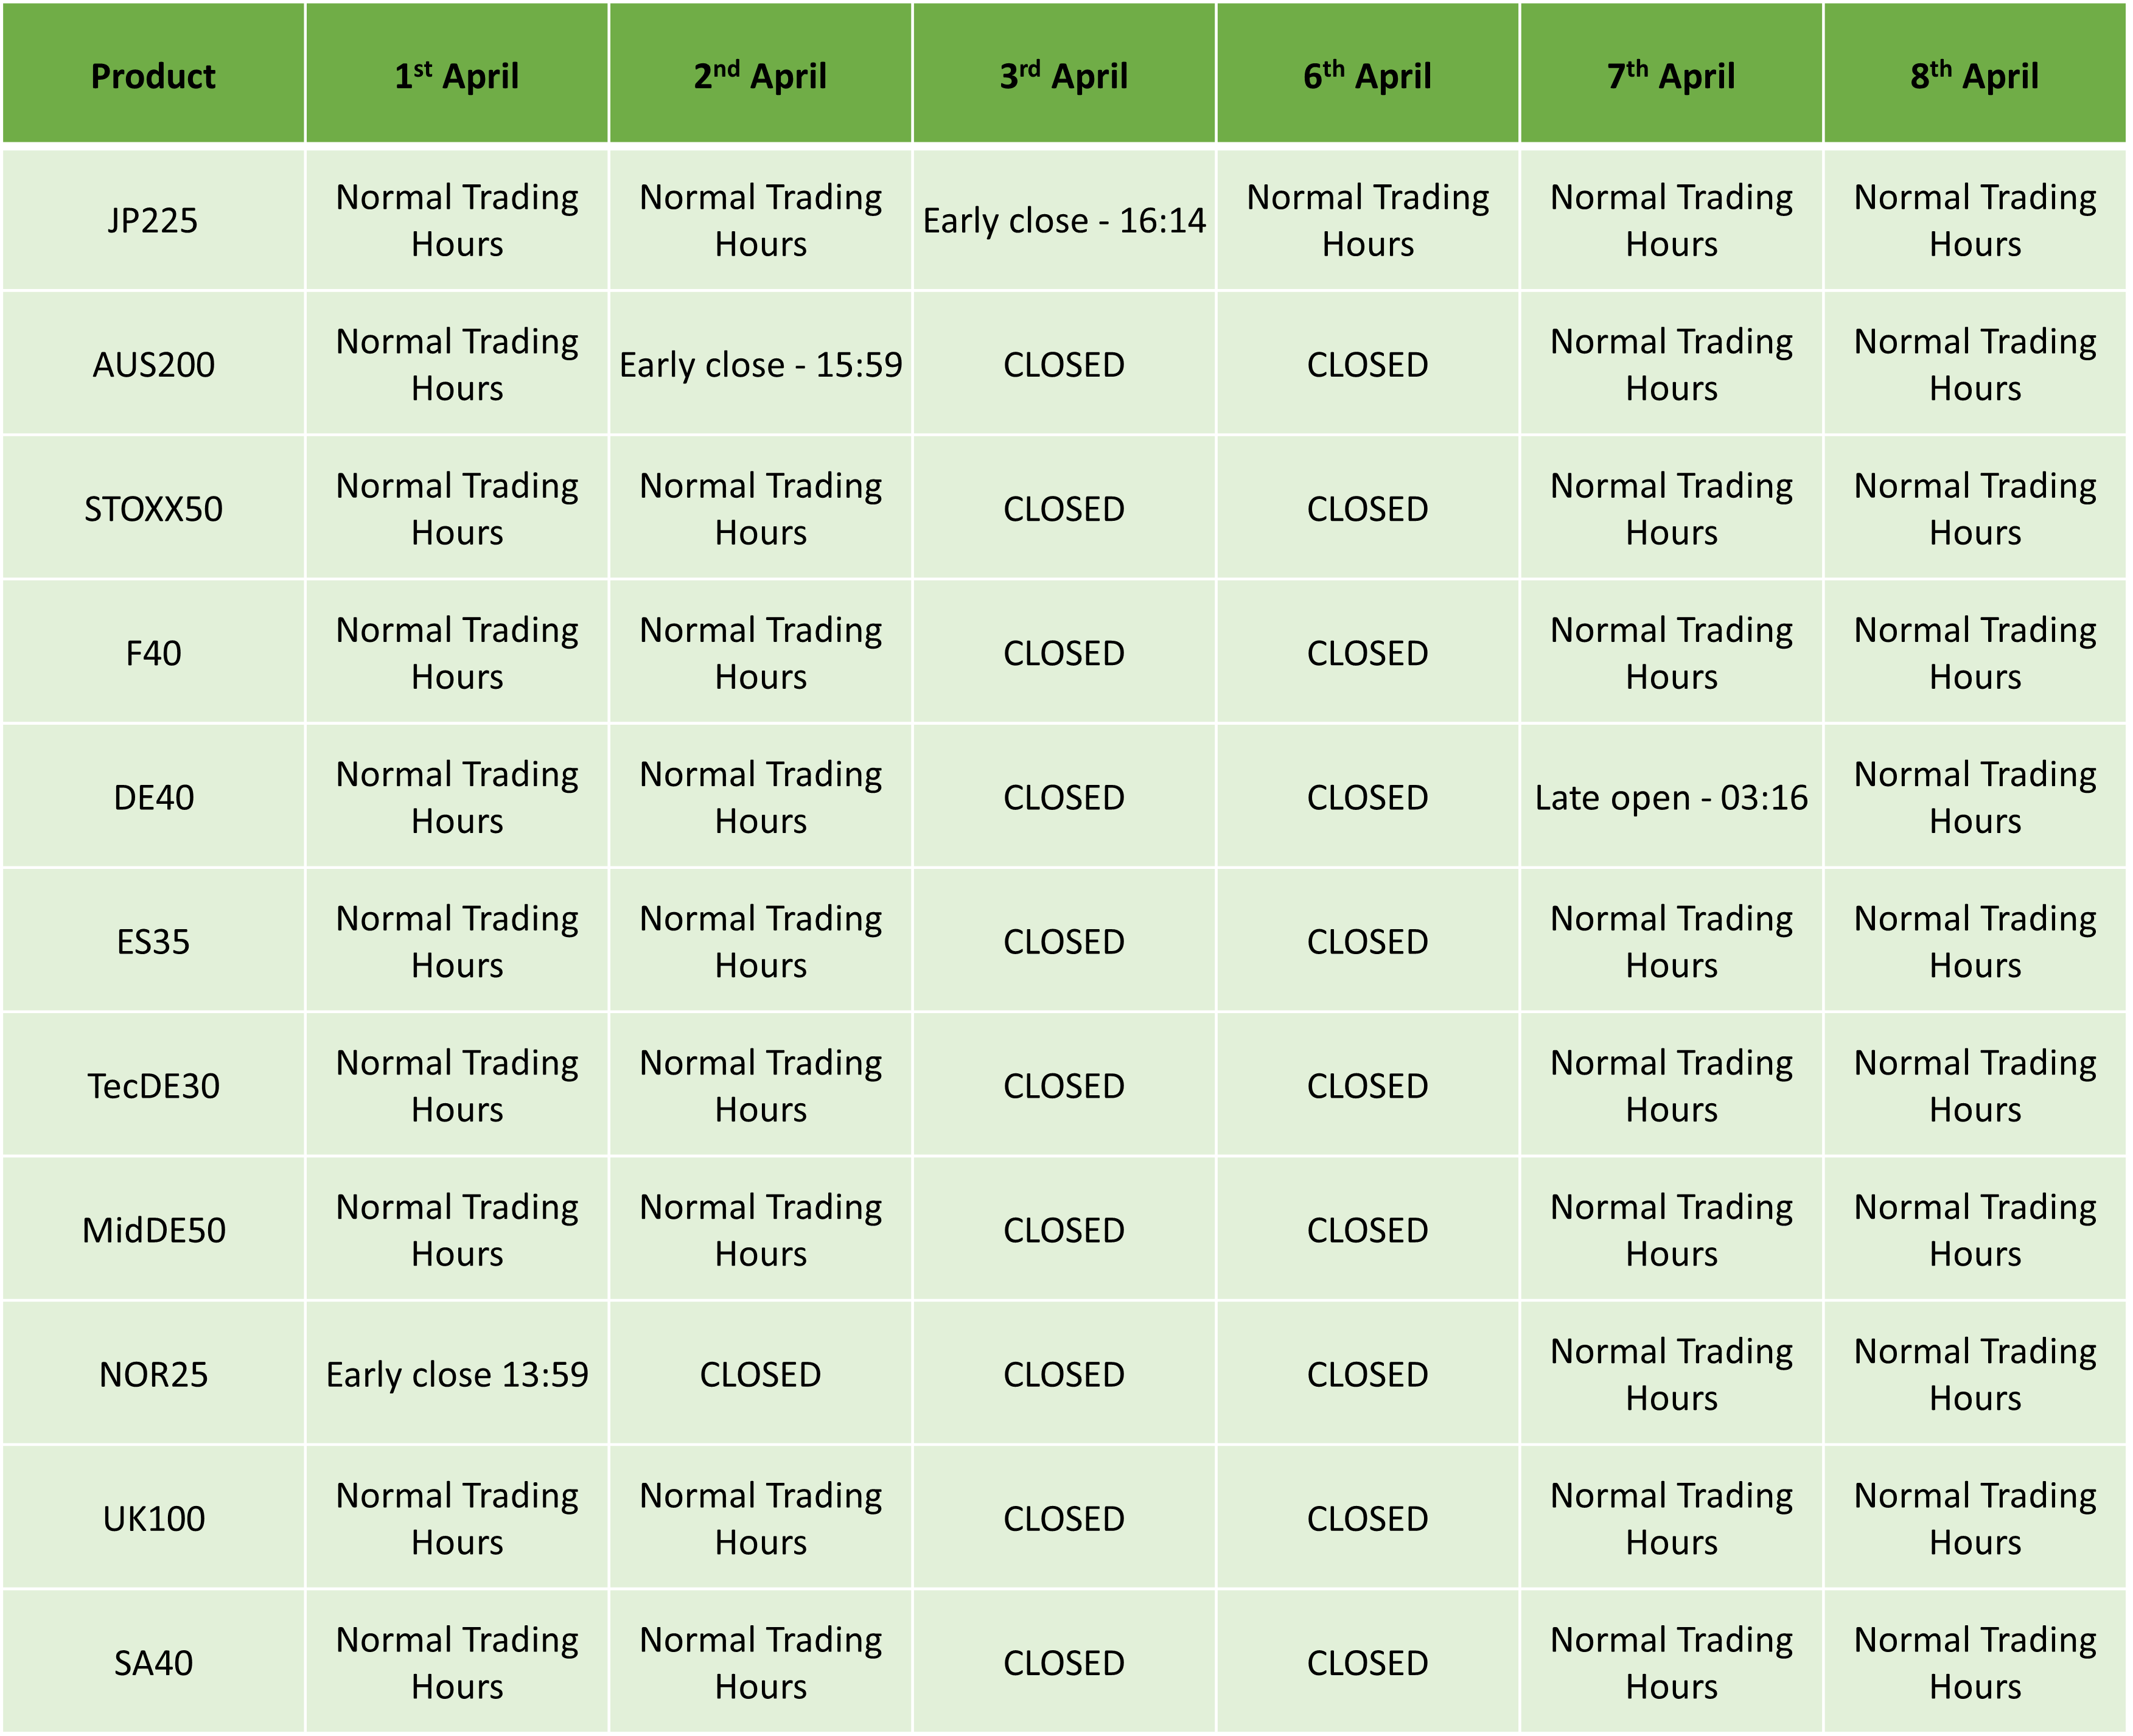
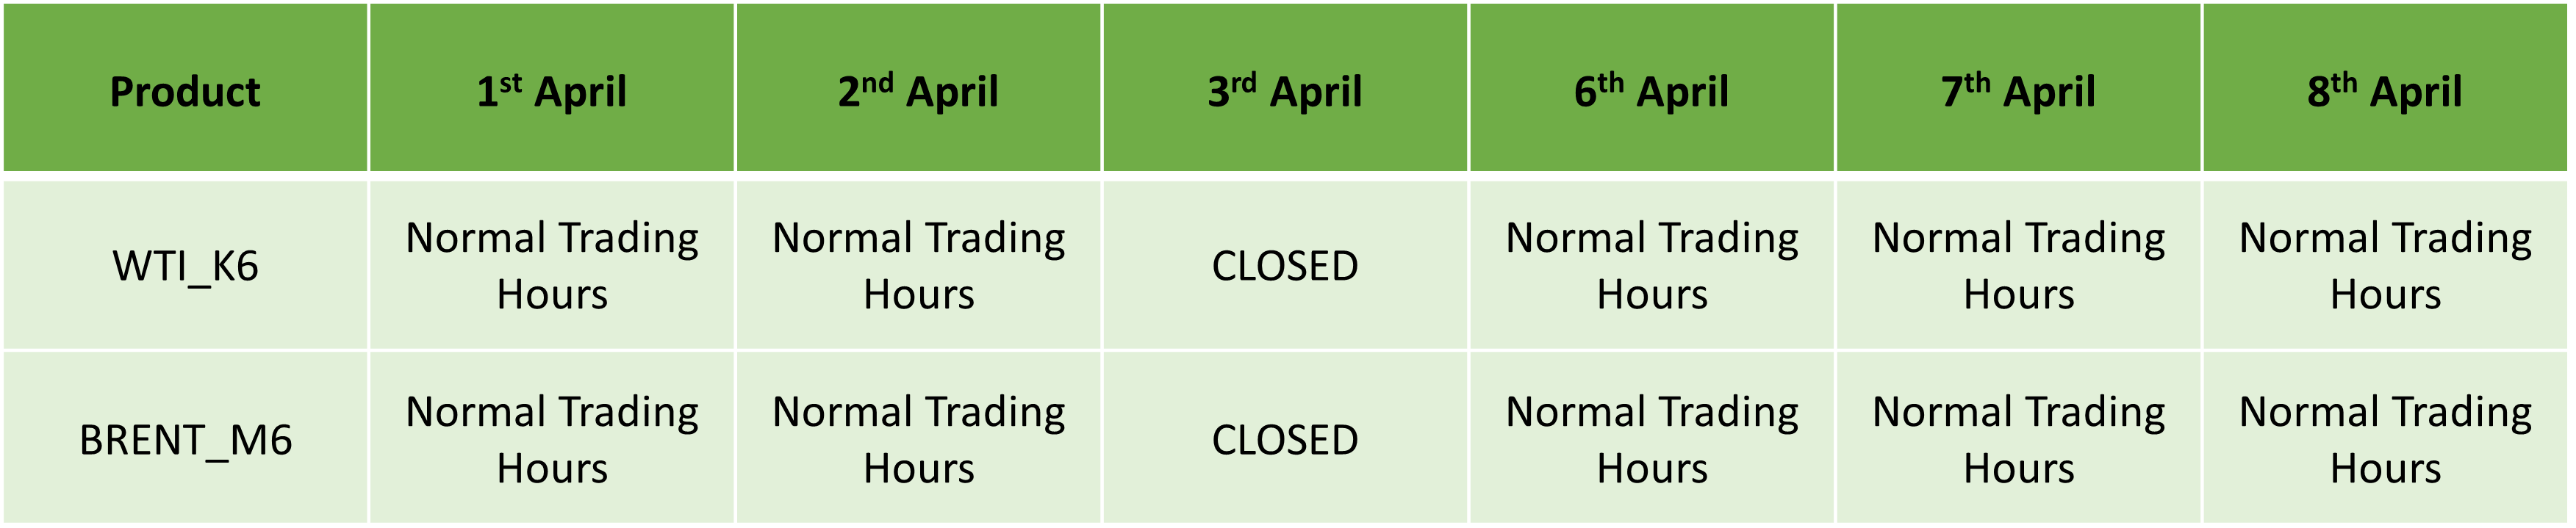
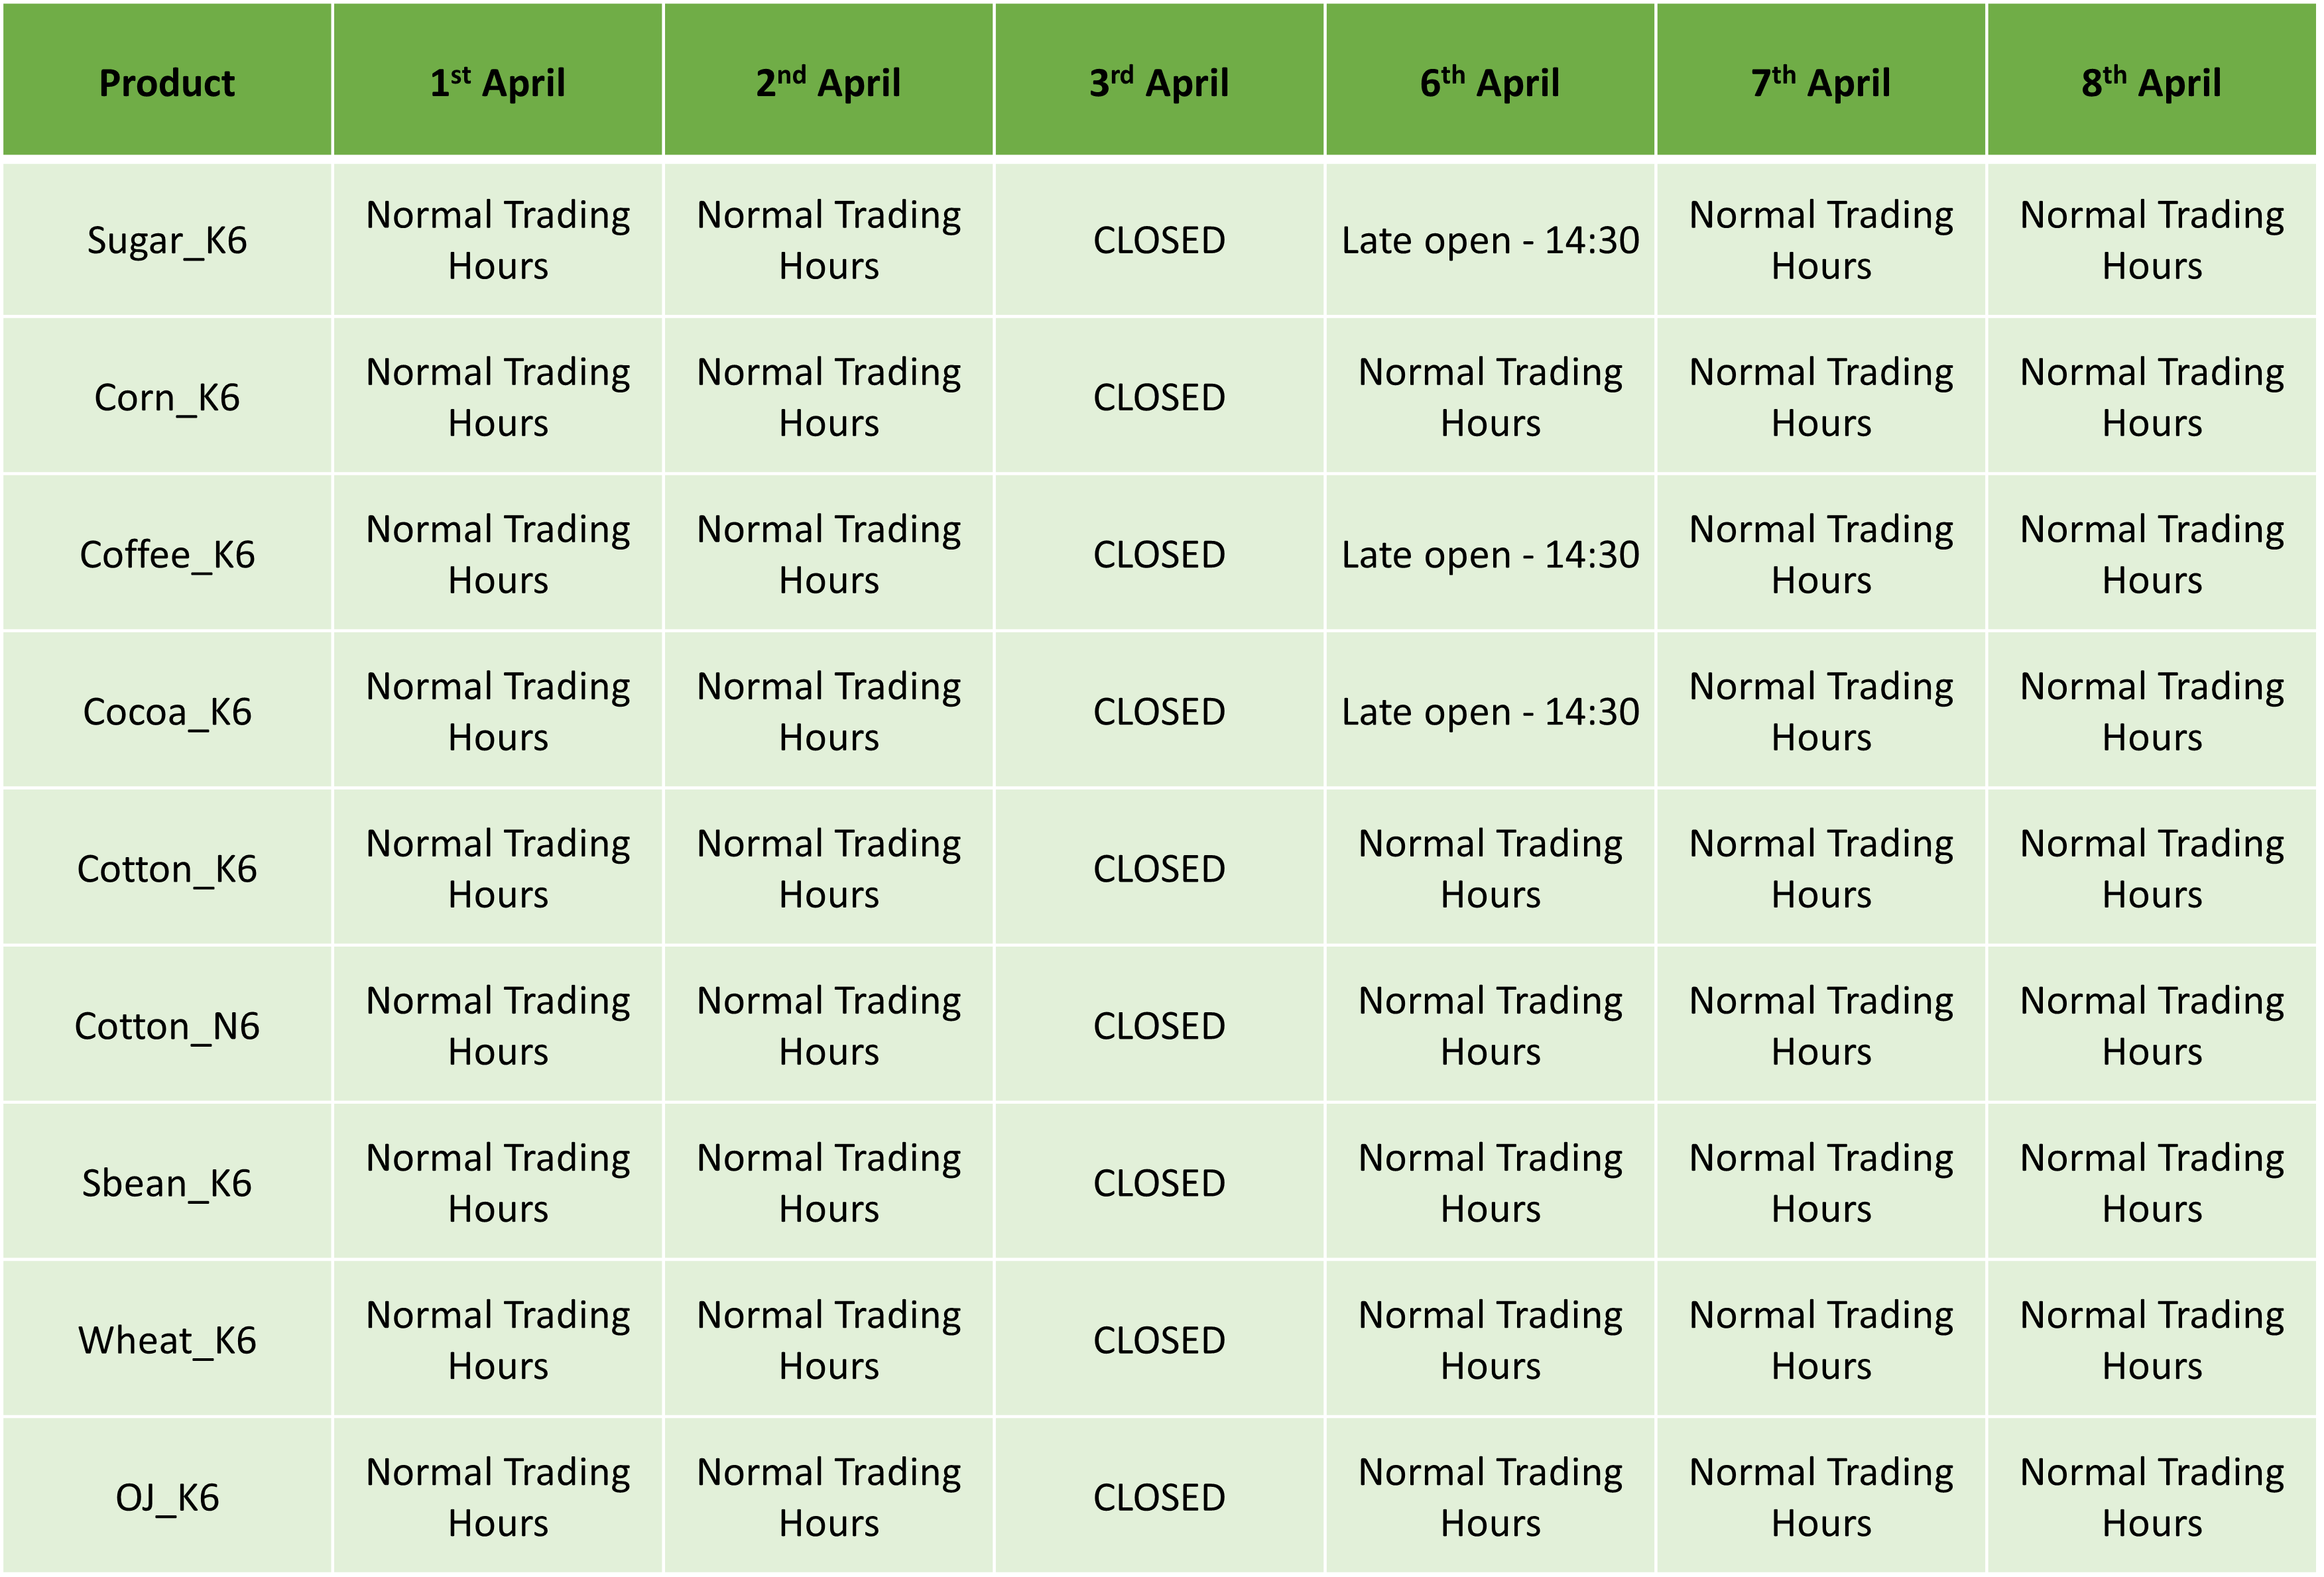
Please find our updated Trading schedule and general information related to the Easter Holidays Starting on Wednesday, 1 April, 2026.
Liquidity over the holidays is expected to be particularly thin so please take the necessary precaution to ensure that you are not affected by increased volatility, spreads and intermittent pricing.
All times mentioned below are Platform time (GMT +3).
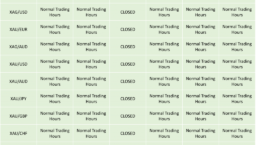
Precious Metals:
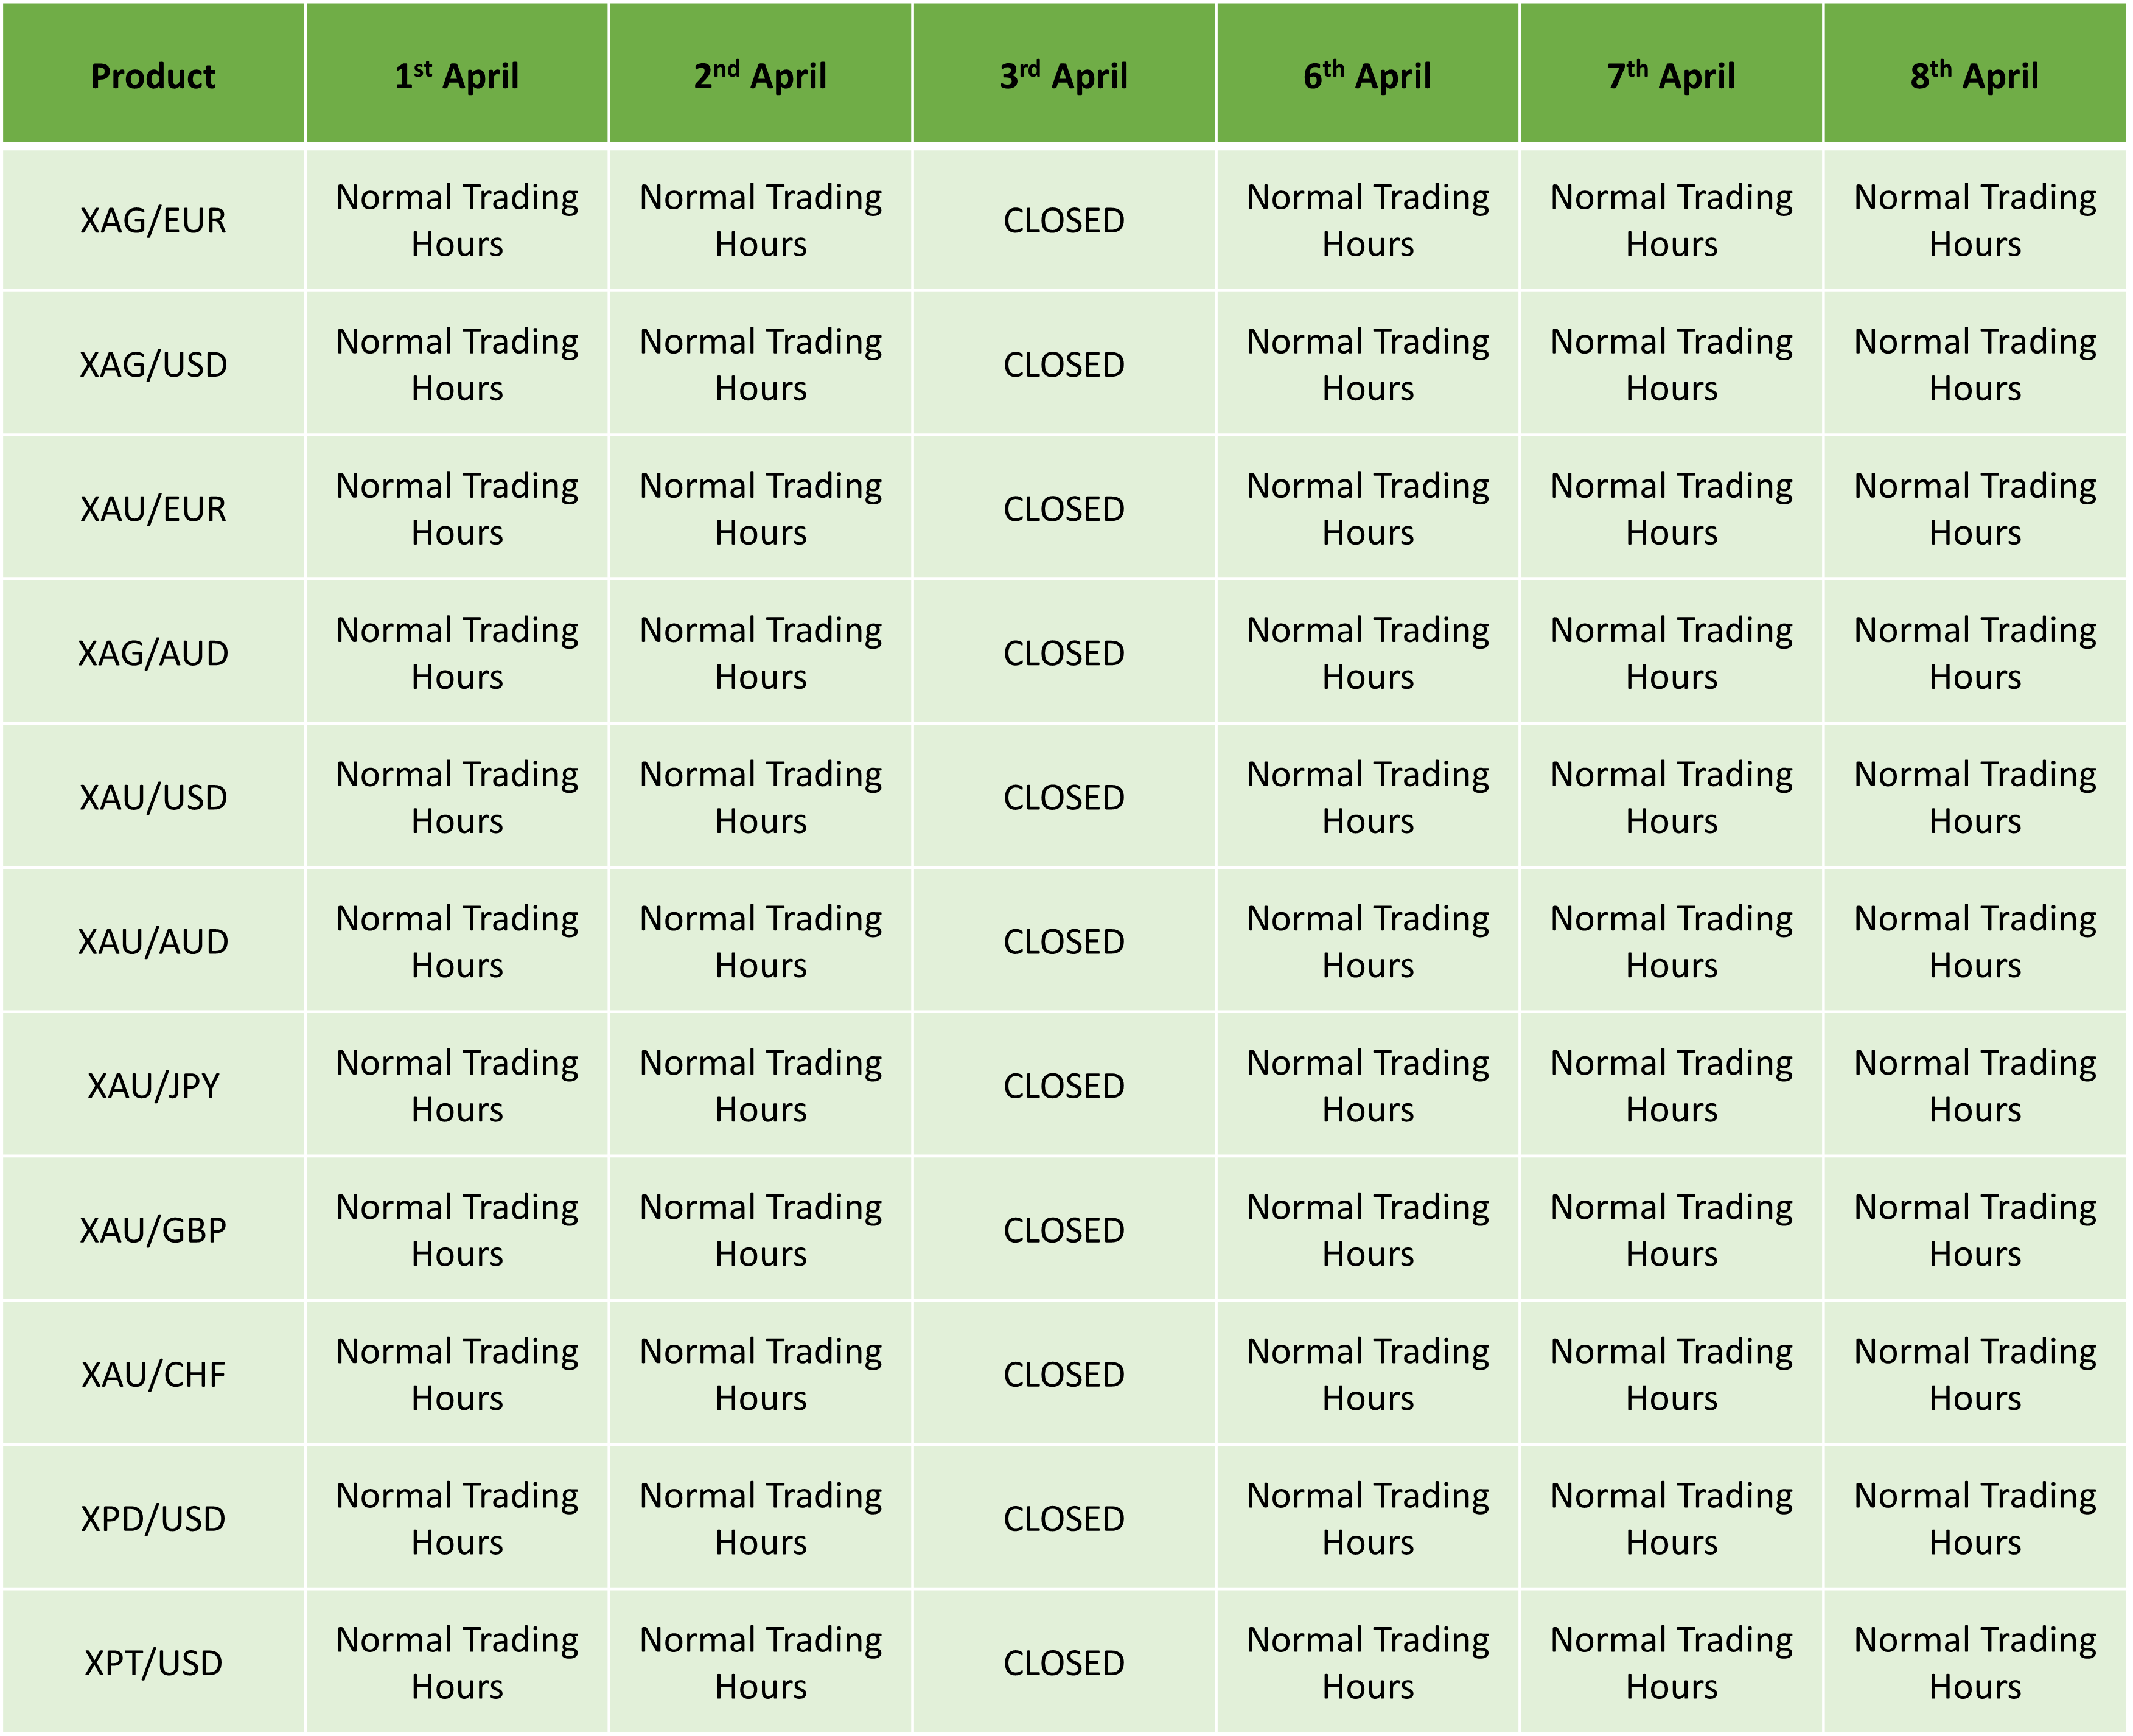
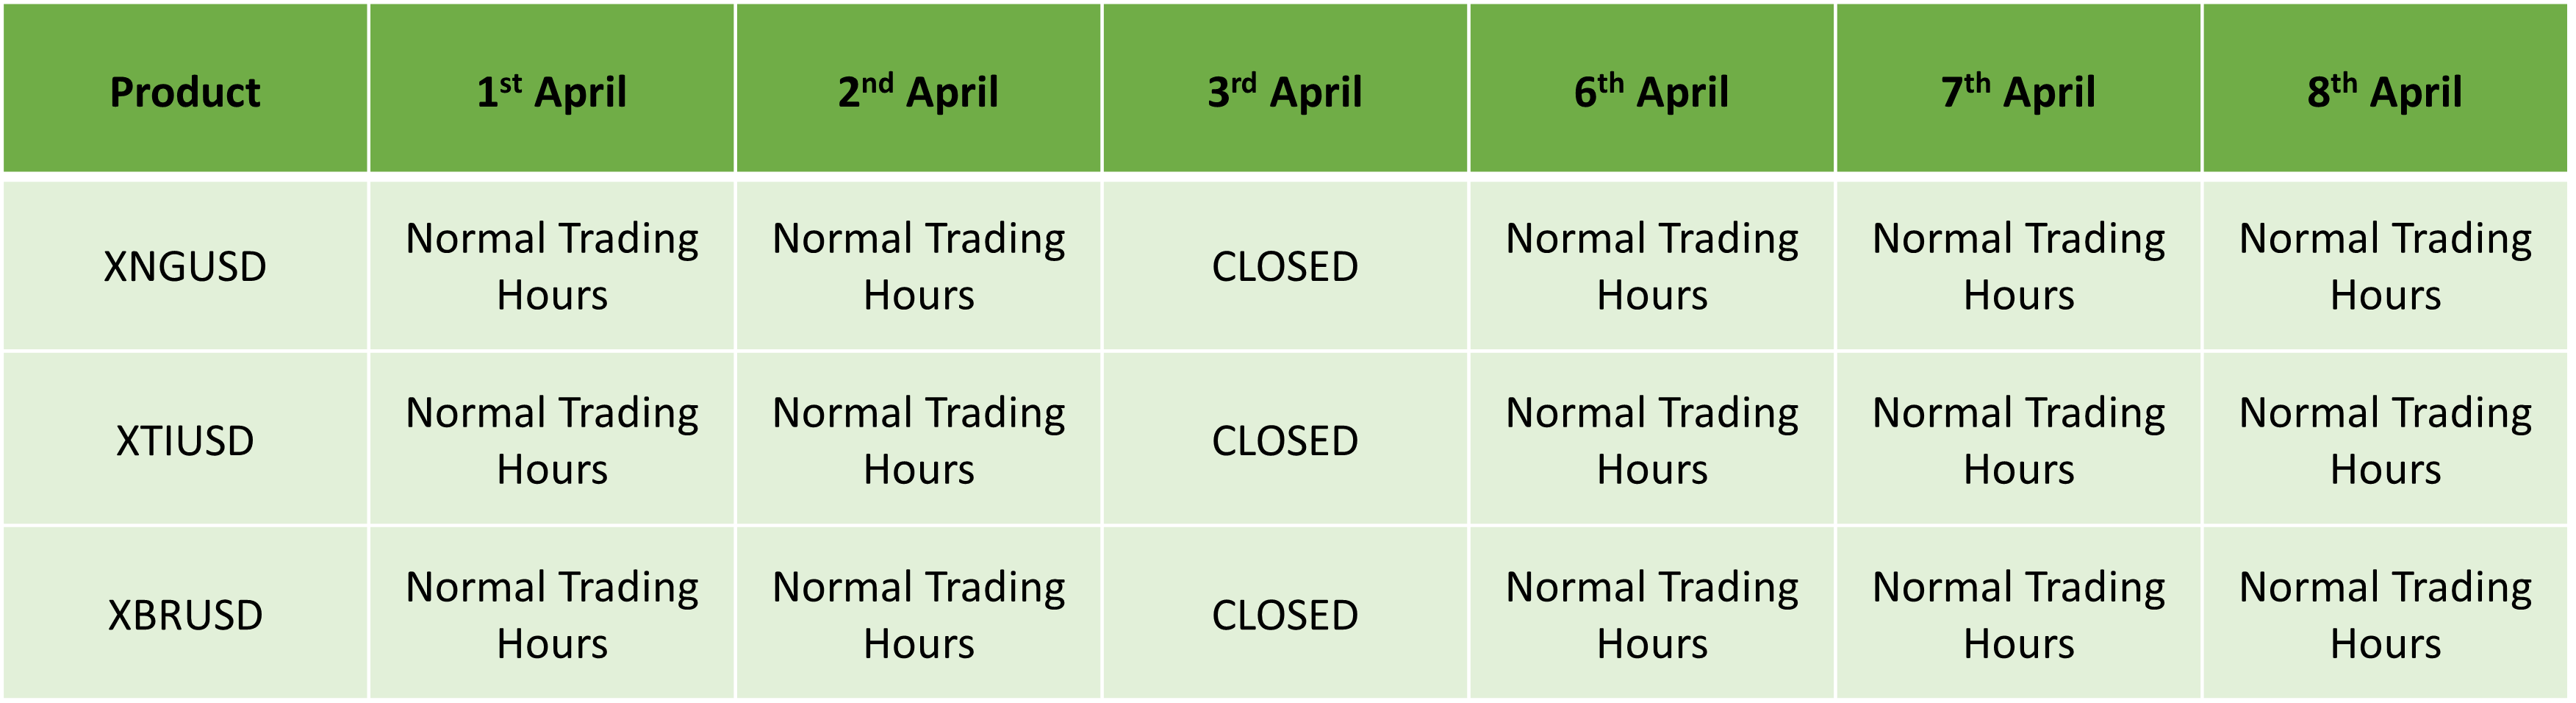
Spot Energies:
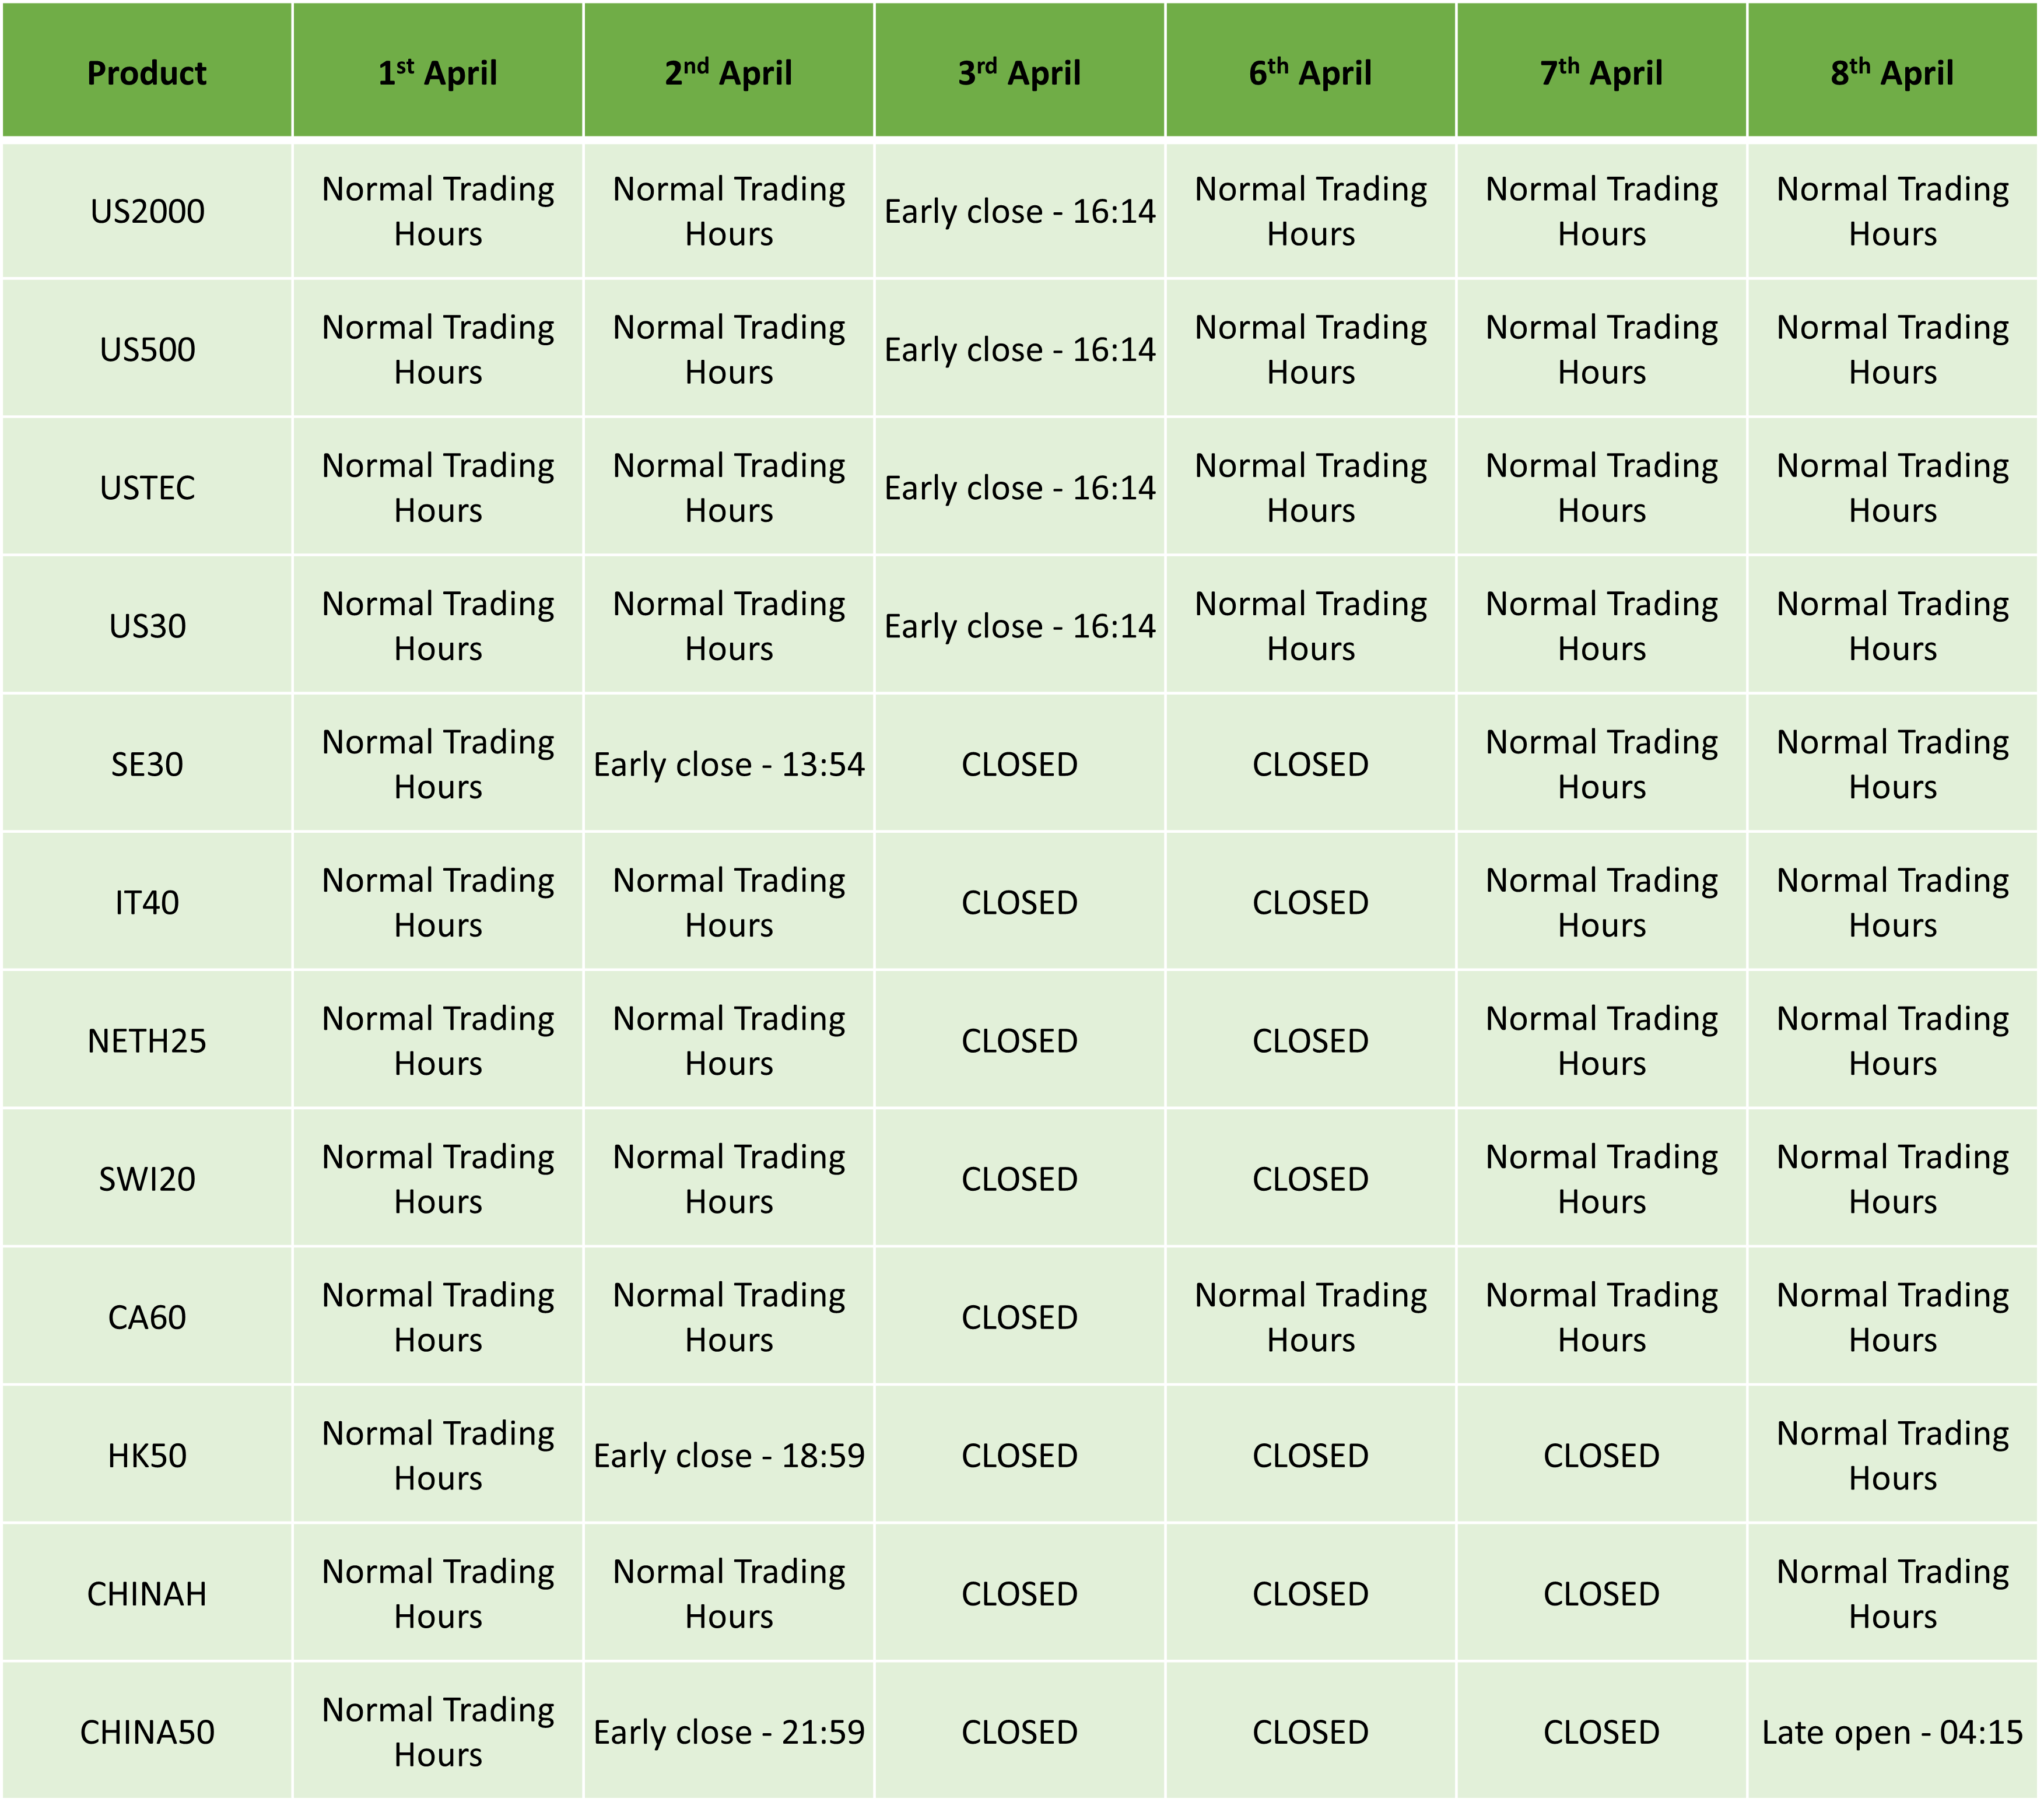
Indices:
Metal Futures:
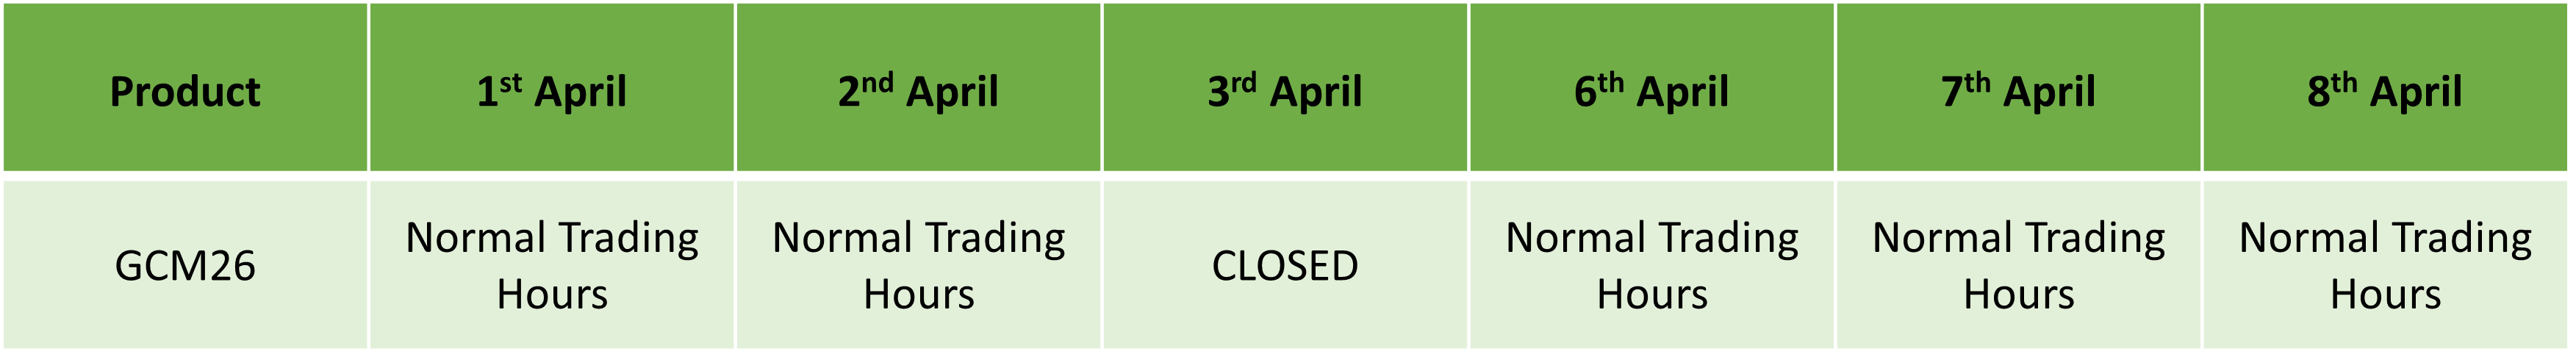
Energy Futures:
Soft Commodities Futures:
Indices Futures:
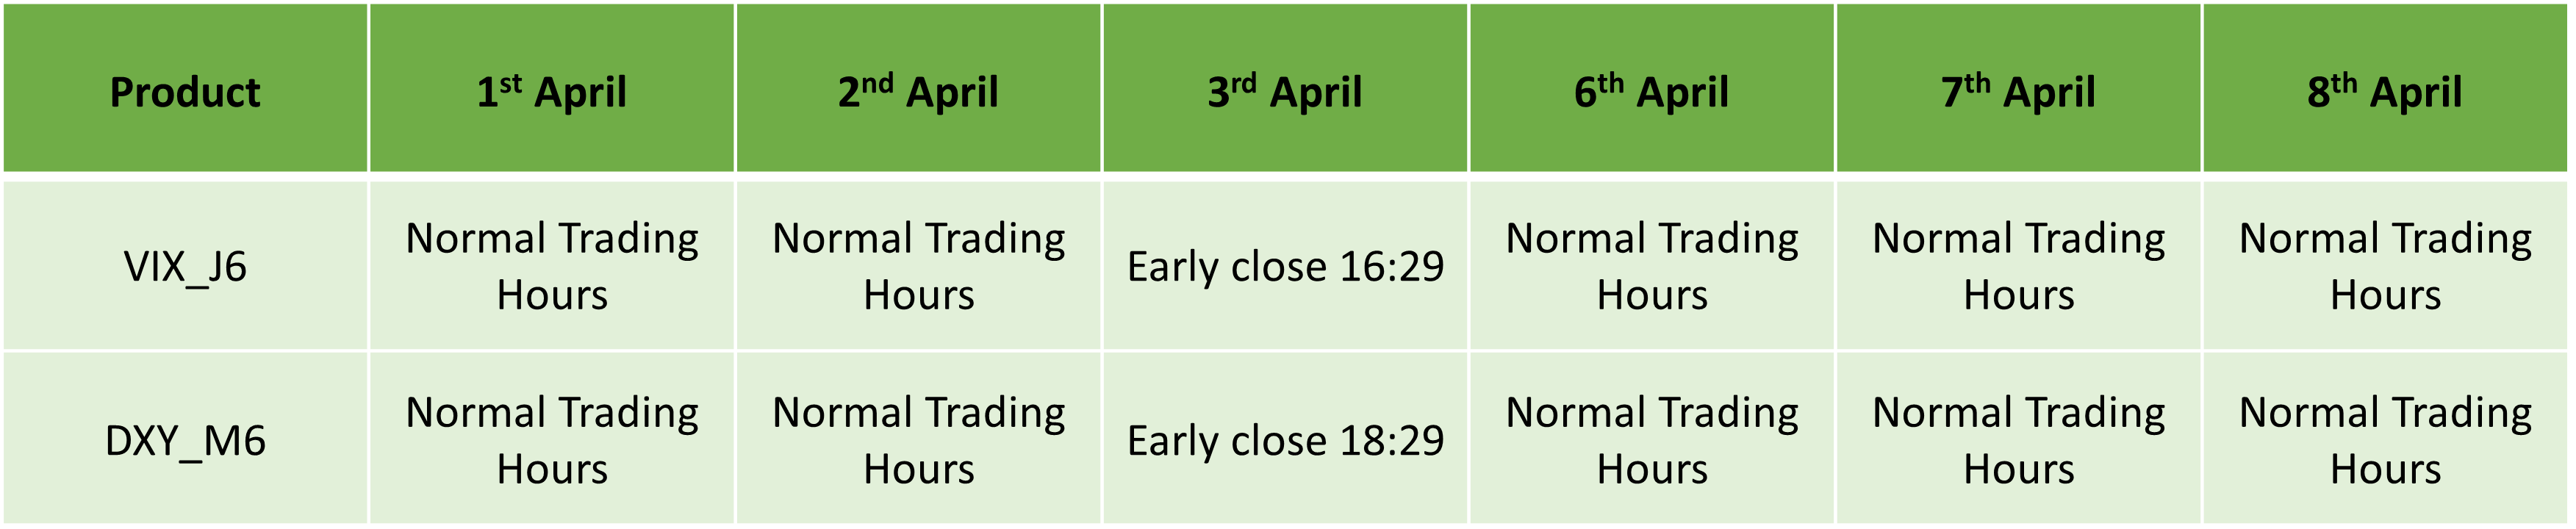
Bonds Futures:
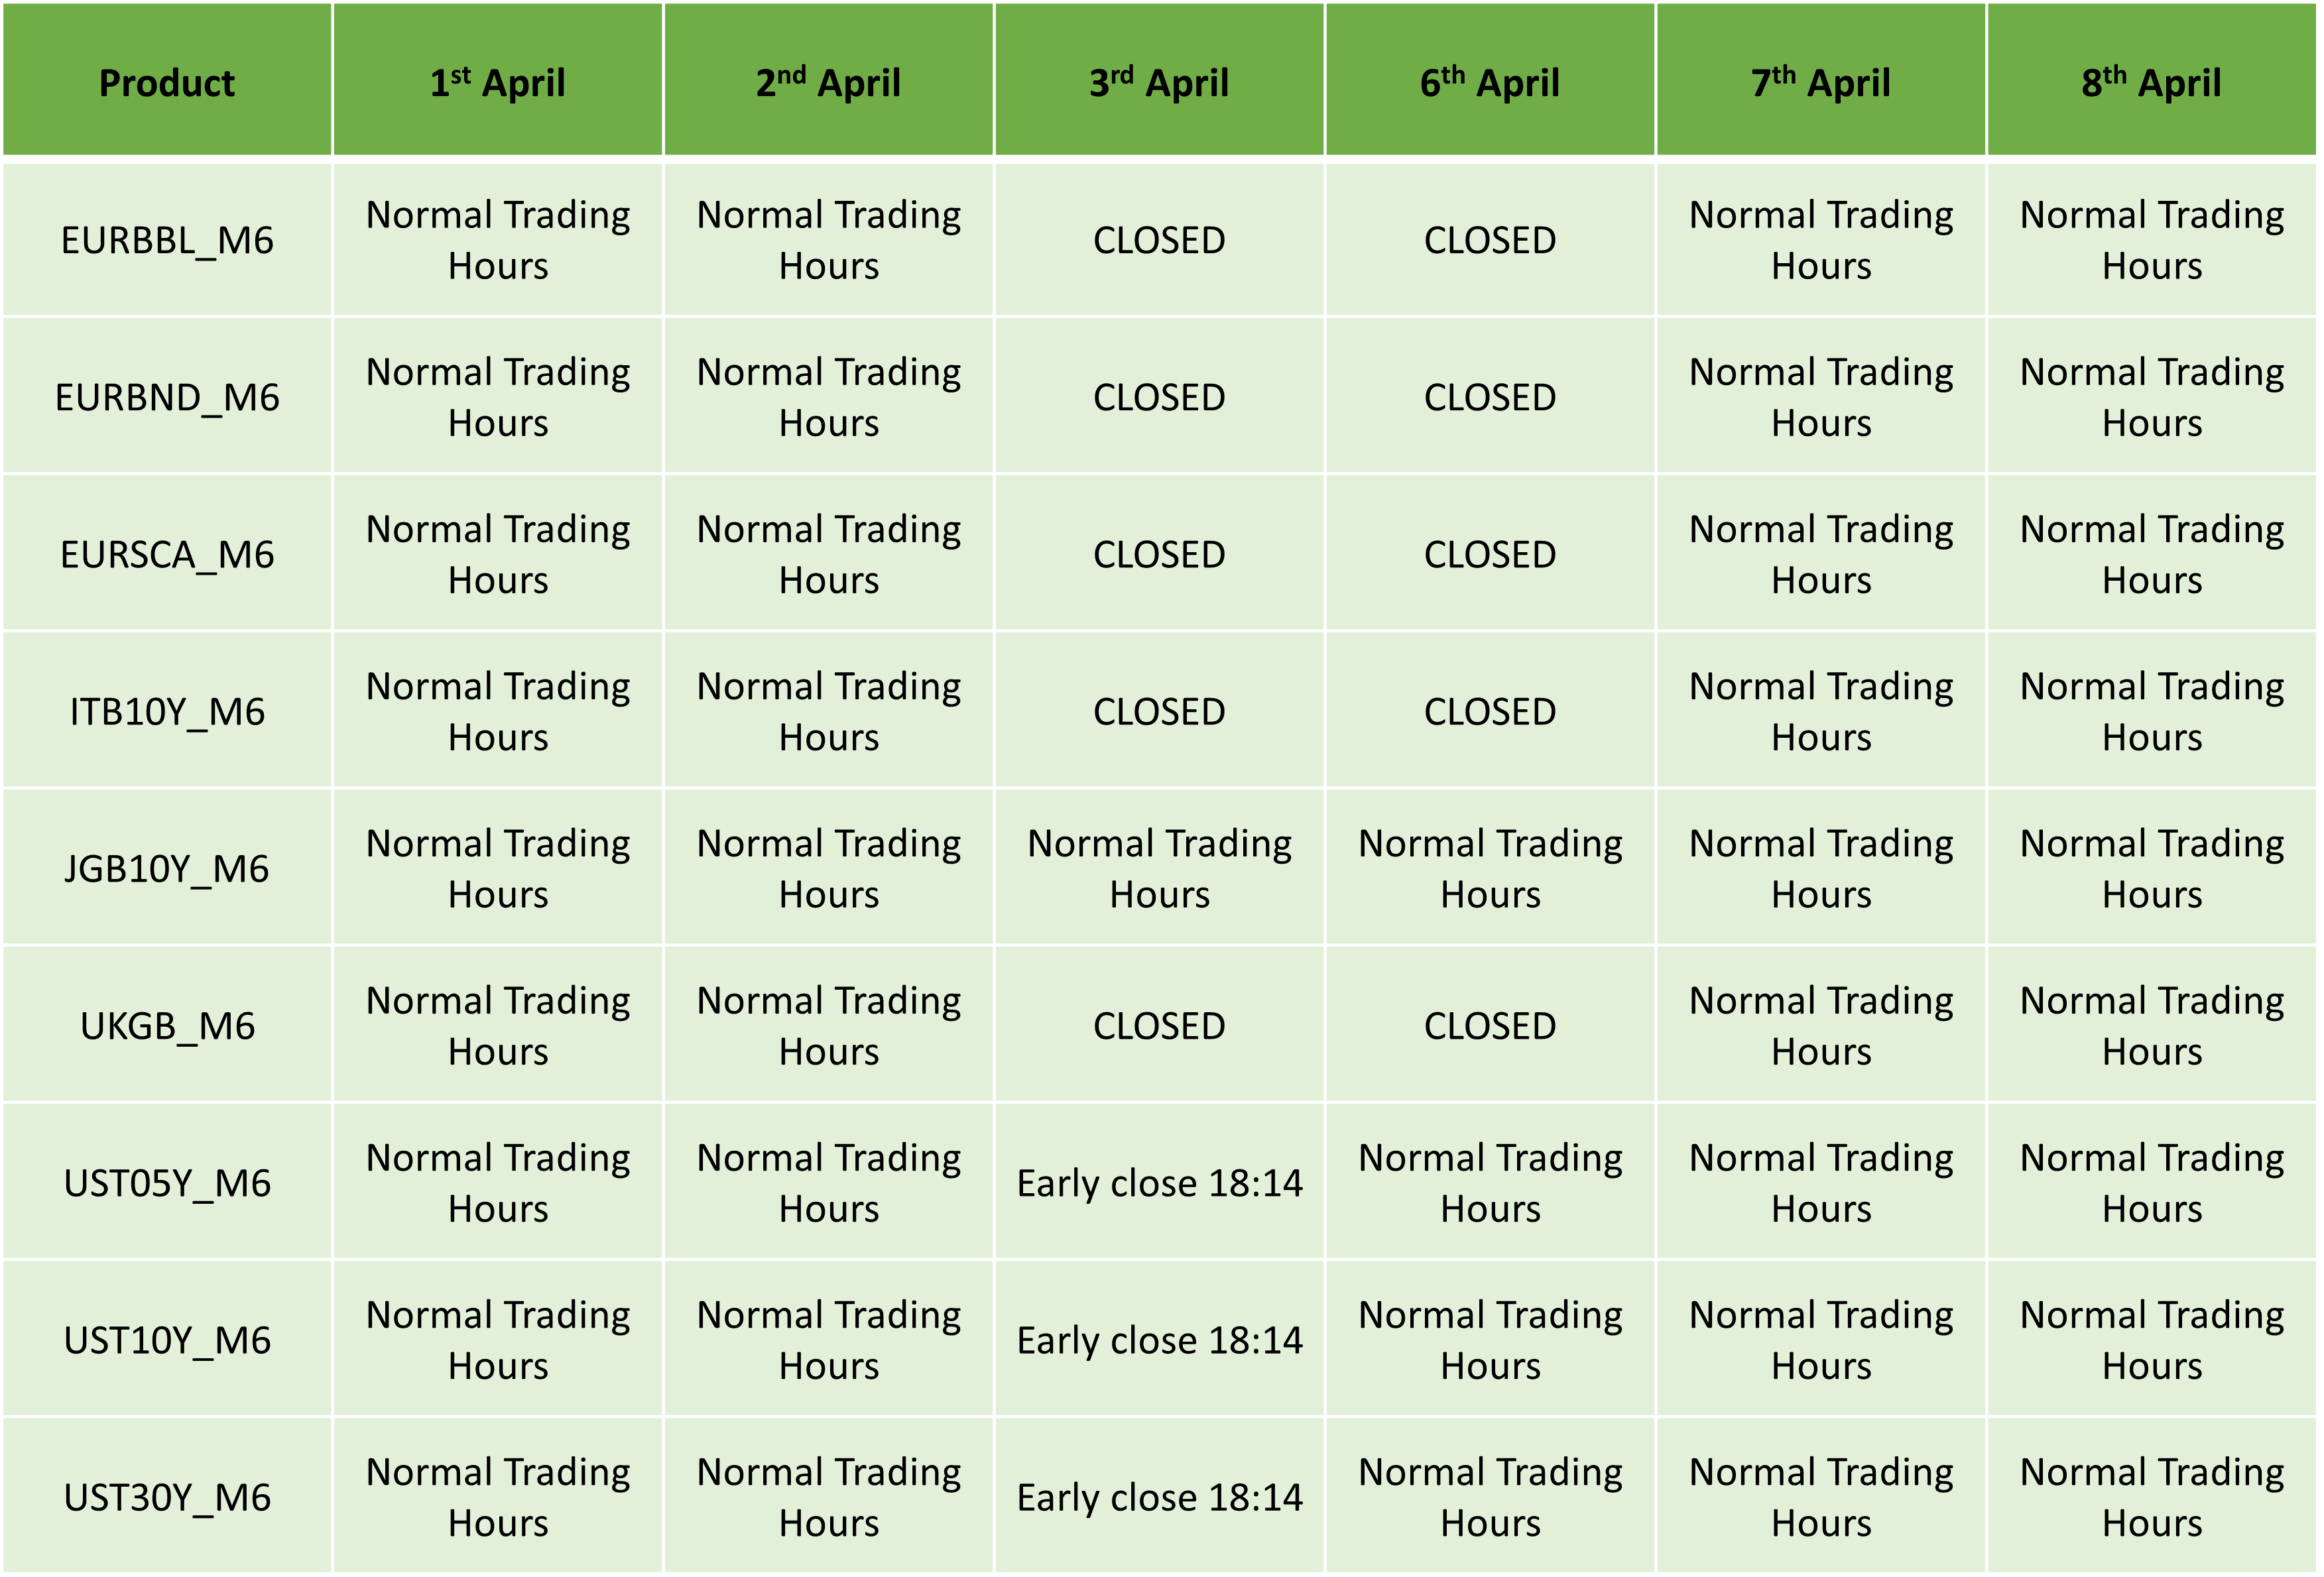
Equities:
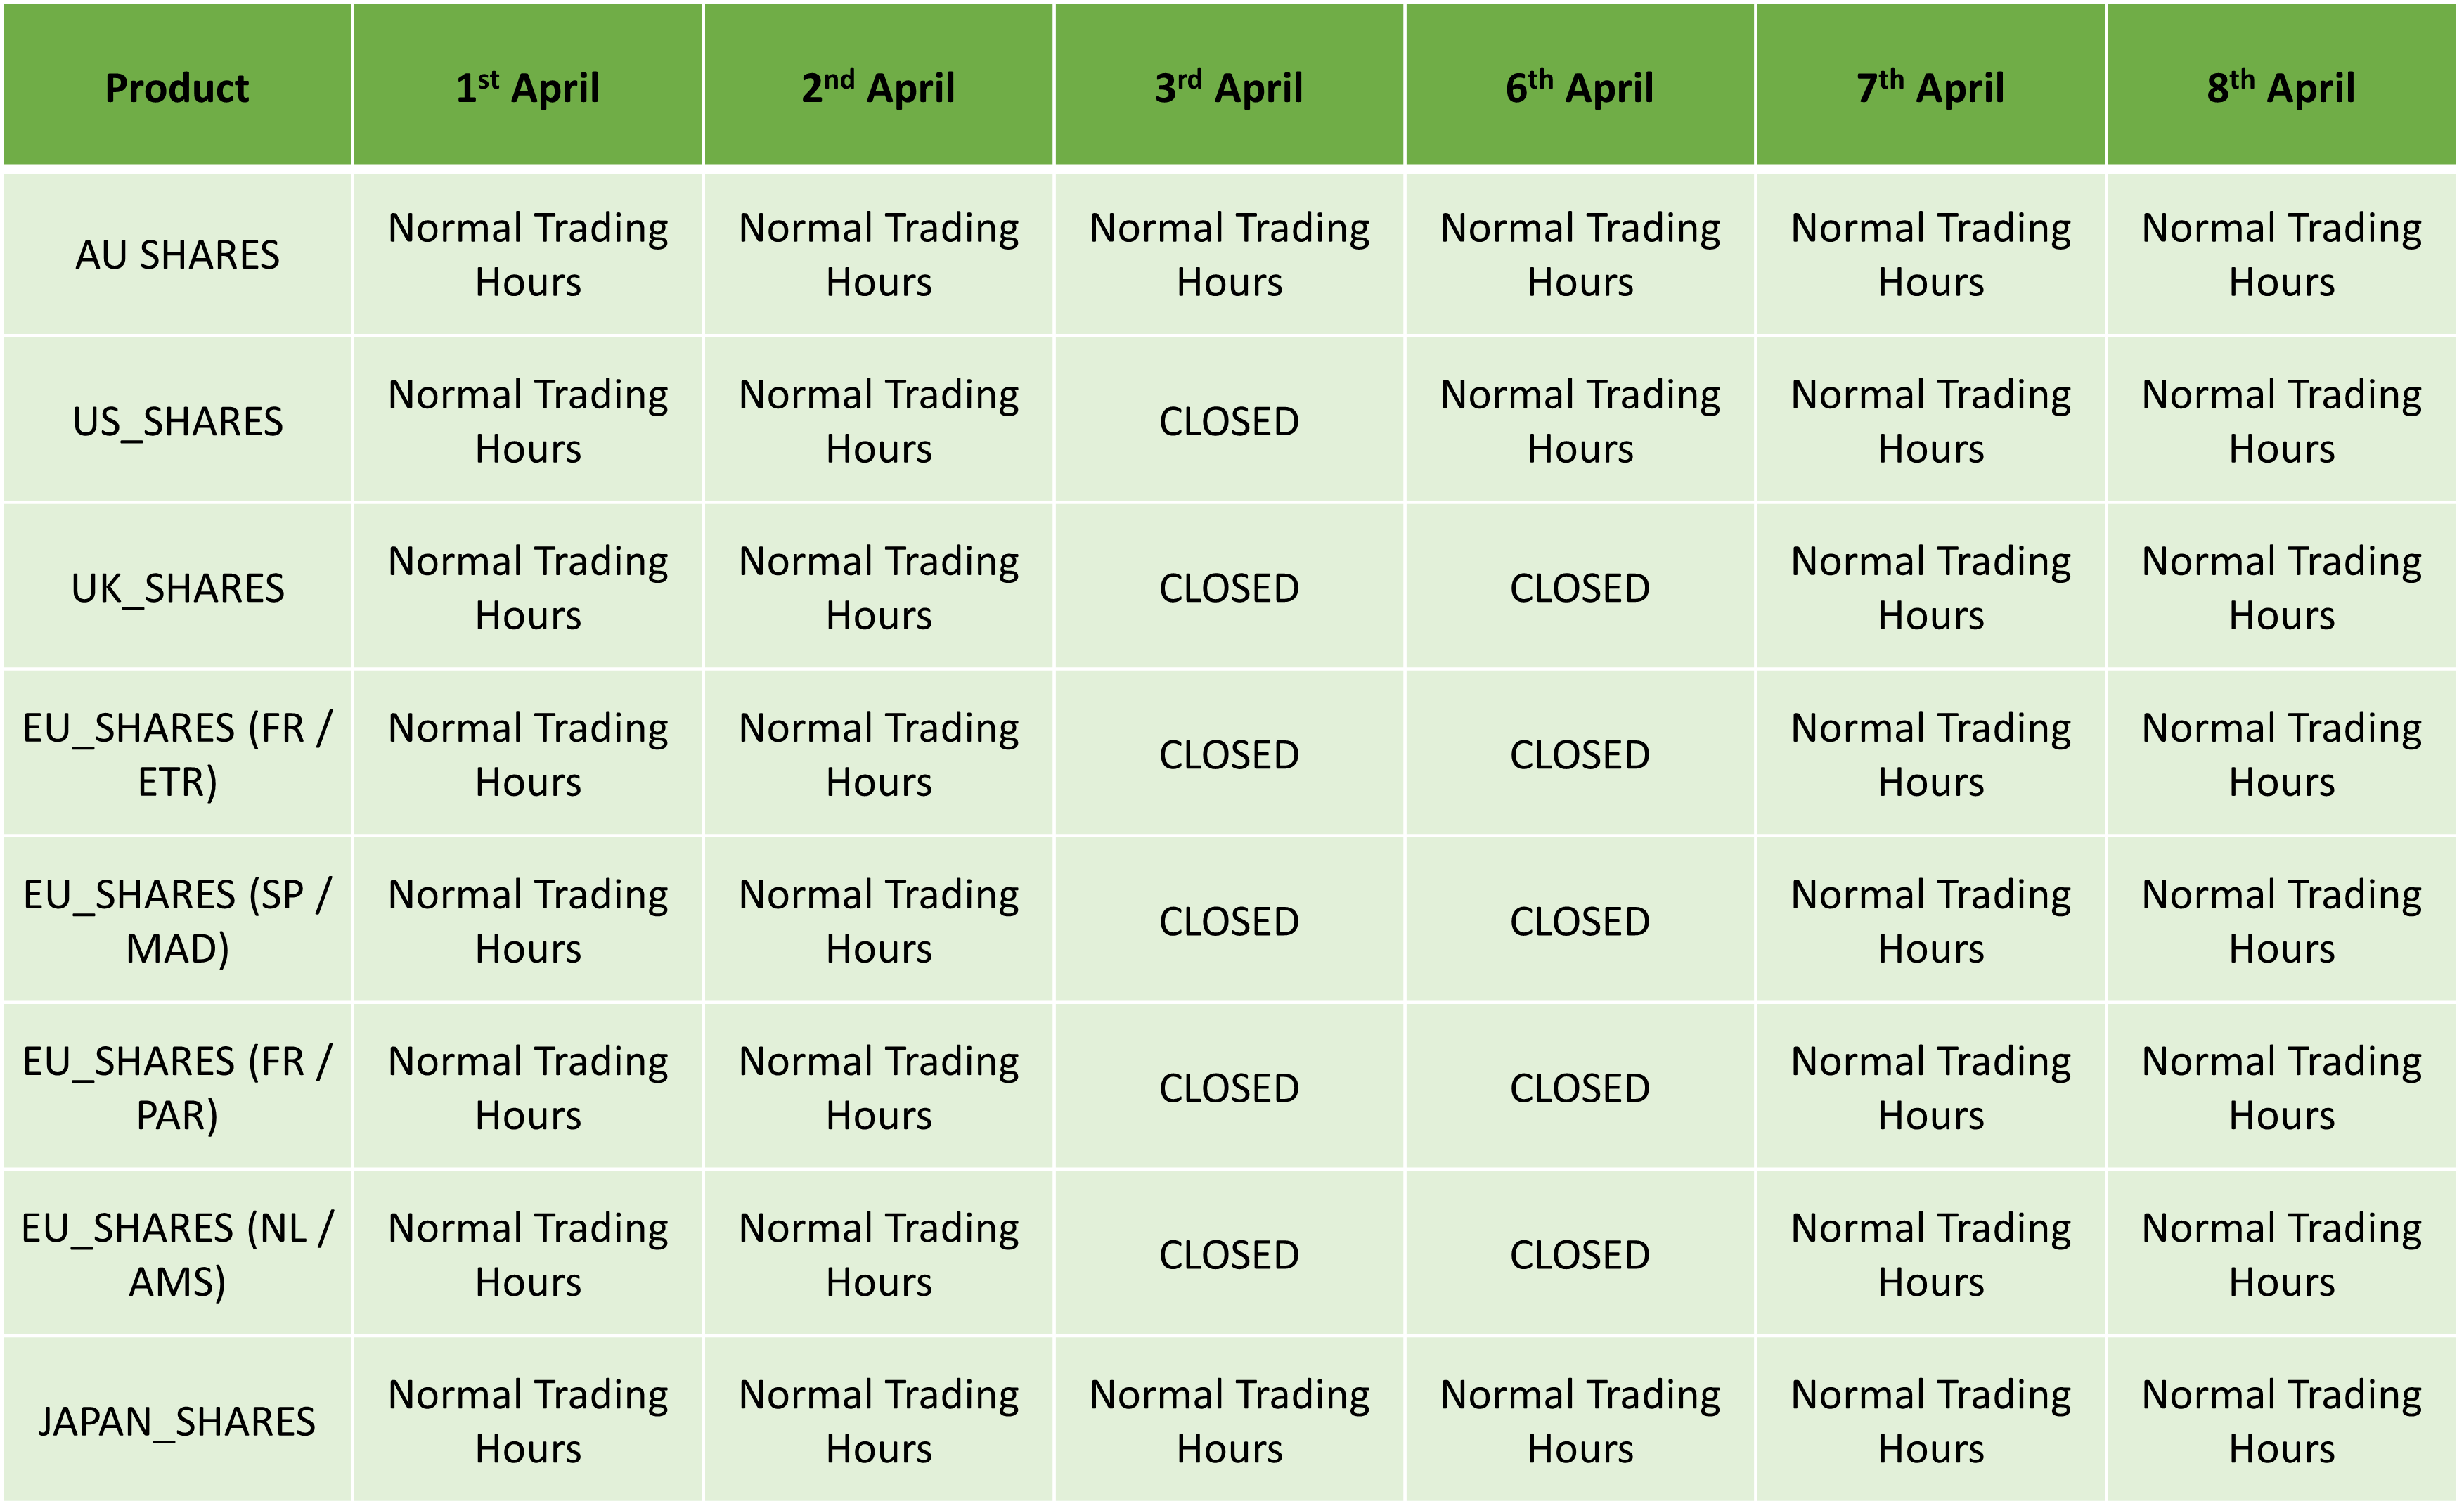
Kind regards,
IC.
The post Easter Holidays Trading Schedule 2026 first appeared on IC Your Trading Edge | Official Blog.
Walpurgis Night Holiday Trading Schedule 2026
429047 March 30, 2026 16:00 ICMarkets Market News
Dear Client,
Please find our updated Trading schedule and general information related to the Walpurgis Night Holiday on Thursday, 30 April, 2026.
Liquidity over the holidays is expected to be particularly thin so please take the necessary precaution to ensure that you are not affected by increased volatility, spreads and intermittent pricing.
All times mentioned below are Platform time (GMT +3).

Kind Regards,
IC.
The post Walpurgis Night Holiday Trading Schedule 2026 first appeared on IC Your Trading Edge | Official Blog.