Articles

General Market Analysis – 22/10/25
422577 October 22, 2025 14:14 ICMarkets Market News
US Stocks Flat on Earnings, but Gold Smashed – XAU down 5%
US stocks had a relatively flat day yesterday as mixed earnings results across sectors hit the market. The Dow had the best of it, finishing up 0.47% at 46,924, while tech stocks took a bit of a hit on a weaker Netflix update, the Nasdaq closing down 0.16% at 22,953 and the S&P flat at 6,735. US Treasury yields had a relatively quiet day, the 2-year flat, closing again at 3.455%, while the 10-year lost 1.7 basis points to move down to 3.963%. The dollar pushed higher against the majors, the DXY up 0.37% at 98.95. Oil prices pushed higher off recent lows, Brent up 1.03% to $61.64 and WTI up 0.39% to $57.24 a barrel. Gold and silver were the outstanding moves on the day as they experienced their biggest down days for the year, gold off 2.30% to $4,125.22 and silver down 7.48% to $48.40.
Gold Smashed in Trading Yesterday – Down 5%
Gold’s relentless recent rally took more than a breather last night as it crashed over 5% on the day, and as with the moves higher, there appears to be no real solid catalyst for the move. There was no major update on geopolitical risks, etc., and not a huge move in the dollar, so we are probably seeing some large profit-taking flow coming through the market. From a technical perspective, the move did halt nearly perfectly on the support trendline on the daily charts, and therefore traders are expecting to see more volatility in the hours ahead. A further break would open the way for a move to the next trendline support near $4,000, with the next major support after that at the September breakout level at $3,500. If the topside trend resumes, then the target will again be the recent record highs just under $4,400 an ounce.
Quiet Calendar Day Again, but More Volatility Expected
It is another quiet day on the macroeconomic calendar today, although UK data in the London session will be a focus, as will further quarterly earnings reports in the US session. The Asian session is likely to start in a relatively muted fashion today after a relatively quiet day on Wall Street, although FX and metals traders will be on their toes after the moves yesterday. The London session will see the release of key inflation numbers, with both the CPI (exp. 4.0% y/y) and PPI (exp. 0.3% m/m) data due out. We also hear from ECB President Christine Lagarde again as she continues on her recent global speaking tour. The US session will see the release of the weekly US crude oil inventory data (exp. 2.2mio barrels), and we hear from FOMC member Michael Barr, but expect volatility to come from earnings numbers and geopolitical updates.
The post General Market Analysis – 22/10/25 first appeared on IC Markets | Official Blog.
IC Markets – Europe Fundamental Forecast | 22 October 2025
422576 October 22, 2025 14:14 ICMarkets Market News
IC Markets Europe Fundamental Forecast | 22 October 2025
What happened in the Asia session?
Asian markets rallied on optimism around reduced US-China trade tensions and upbeat Japanese leadership news, further buoyed by encouraging macroeconomic signals, especially Japan’s resurgent exports and UK inflation data. The most significant market impacts were felt in Japanese and UK instruments (USDJPY, GBPUSD, Nikkei, FTSE), as well as region-wide equity indices, while the commodity complex stabilized after previous volatility.
What does it mean for the Europe & US sessions?
Wednesday’s European and US trading sessions will be dominated by three critical data points: UK inflation expected at a 21-month high of 4.0%, insights from ECB President Lagarde’s speech, and Tesla’s highly anticipated Q3 earnings report. The UK inflation surge to double the BoE’s target complicates the central bank’s easing path ahead of its November 6 meeting, while the ECB continues to grapple with weak monetary policy transmission despite aggressive rate cuts. Third-quarter earnings season remains robust with 86% beat rates, though profit margins face pressure from price competition.
The Dollar Index (DXY)
Key news events today
No major news event
What can we expect from DXY today?
The US dollar faces a complex set of crosscurrents showing short-term resilience supported by Japanese political developments and safe-haven demand. The currency remains under pressure from the ongoing government shutdown, expected Fed rate cuts, and trade uncertainties. The dollar’s ability to sustain current levels will largely depend on the resolution of the government shutdown, upcoming inflation data, and progress in US-China trade negotiations. Markets are positioned for continued volatility as these key factors evolve through the remainder of October.
Central Bank Notes:
- The Federal Open Market Committee (FOMC) voted, by majority, to lower the federal funds rate target range by 25 basis points to 4.00%–4.25% at its September 16–17, 2025, meeting, marking the first policy rate adjustment since December 2024 after five consecutive holds.
- The Committee maintained its long-term objective of achieving maximum employment and 2% inflation, acknowledging recent labor market softening and continued tariff-driven price pressures.
- Policymakers expressed elevated concern about downside risks to growth, citing a stalling labor market, modest job creation, and an unemployment rate drifting up toward 4.4%. At the same time, inflation remains above target, with CPI at 3.2% and core inflation at 3.1% as of August 2025; higher energy and food prices, largely attributable to tariffs, continue to weigh on headline measures.
- Although economic activity expanded at a moderate pace in the third quarter, the growth outlook has weakened. Q3 GDP growth is estimated near 1.0% (annualized), with full-year 2025 GDP growth guidance revised to 1.2%, reflecting slowing household consumption and tighter financial conditions.
- In the updated Summary of Economic Projections, the unemployment rate is projected to average 4.5% for the year, with headline PCE inflation revised up slightly to 3.1% for 2025. The Committee anticipates core PCE inflation to remain stubborn, requiring sustained vigilance and a flexible approach to risk management.
- The Committee reiterated its data-dependent approach and openness to further adjustments should employment or inflation deviate meaningfully from current forecasts. Several members dissented, either advocating a larger 50-basis-point cut or preferring no adjustment at this meeting, revealing heightened divergence within the Committee.
- Balance sheet reduction continues at a measured pace. The monthly Treasury redemption cap remains at $5B and the agency MBS cap at $35B, as the Board aims to support orderly market conditions in the face of evolving global and domestic uncertainty
- The next meeting is scheduled for 28 to 29 October 2025.
Next 24 Hours Bias
Weak Bearish
Gold (XAU)
Key news events today
No major news event
What can we expect from Gold today?
Gold continues to trade near record-high levels after a brief but significant pullback, with the price consolidating above $4,300/oz. The rally is underpinned by safe-haven flows, inflation concerns, and robust demand from both institutional and retail investors. Minor corrections remain viewed as buy opportunities, and most analysts expect the bullish trend to continue as macroeconomic and geopolitical risks persist. Technical volatility is likely to remain elevated, but strategic sentiment for gold stays very positive into year-end.
Next 24 Hours Bias
Weak Bullish
The Euro (EUR)
Key news events today
ECB President Lagarde speaks (12:25 pm GMT)
What can we expect from EUR today?
The euro faces a challenging environment characterized by gradual monetary policy easing with limited credit transmission, persistent political instability in France, modest economic growth prospects in Germany, and ongoing trade policy uncertainty. EUR/USD trades near 1.16, under short-term bearish pressure despite maintaining a longer-term uptrend. Market participants await ECB President Lagarde’s speech today for further policy guidance before the central bank enters its blackout period ahead of next week’s meeting. The eurozone economy shows tentative growth momentum, particularly in services, but manufacturing remains weak and faces headwinds from trade tensions and subdued external demand.
Central Bank Notes:
- The Governing Council kept the three key ECB interest rates unchanged at its meeting on September 11, 2025. The main refinancing rate remains at 2.15%, the marginal lending facility at 2.40%, and the deposit facility at 2.00%. These levels have been maintained after the cuts earlier in 2025, reflecting the Council’s confidence that the current stance is consistent with the price stability mandate.
- Evidence that inflation is running close to the ECB’s medium-term target of 2% supported the decision to hold rates steady. Domestic price pressures are easing as wage growth continues to moderate, and financing conditions remain accommodative. Policymakers reaffirmed a data-dependent, meeting-by-meeting approach to further policy moves, with no pre-commitment to a predetermined path amid ongoing global and domestic risks.
- Eurosystem staff projections foresee headline inflation averaging 2.0% for 2025, 1.8% for 2026, and 2.0% in 2027. The 2025 and 2026 forecasts reflect a downward revision, primarily on lower energy costs and exchange rate effects, even as food inflation remains persistent. Core inflation (excluding energy and food) is expected at 2.0% for 2026 and 2027, with only minor changes since prior rounds.
- Real GDP growth in the euro area is projected at 1.1% for 2025, 1.1% for 2026, and 1.4% for 2027. A robust first quarter—partly due to firms accelerating exports ahead of anticipated tariff hikes—cushioned a weaker outlook for the remainder of 2025. While business investment continues to face uncertainty from ongoing global trade disputes, especially with the US, government investment and infrastructure spending are expected to provide some support to the outlook.
- Rising real incomes and continued strength in the labor market boost household spending. Despite some fading tailwind from previous rate cuts, financing conditions remain broadly favorable and are expected to underpin the resilience of private consumption and investment against outside shocks. Moderating wage growth and profit margin adjustments are helping to absorb residual cost pressures.
- Rising real incomes and continued strength in the labor market boost household spending. Despite some fading tailwind from previous rate cuts, financing conditions remain broadly favorable and are expected to underpin the resilience of private consumption and investment against outside shocks. Moderating wage growth and profit margin adjustments are helping to absorb residual cost pressures.
- All future interest rate decisions will continue to be guided by the integrated assessment of economic and financial data, the inflation outlook, and underlying inflation dynamics, and the effectiveness of monetary policy transmission—without any pre-commitment to a specific future rate path.
- The ECB’s Asset Purchase Program (APP) and Pandemic Emergency Purchase Program (PEPP) portfolios are declining predictably, as maturities have ceased to be reinvested. Balance-sheet normalization continues in line with the ECB’s previously communicated schedule.
- The next meeting is on 29 to 30 October 2025
Next 24 Hours Bias
Weak Bearish
The Swiss Franc (CHF)
Key news events today
No major news event
What can we expect from CHF today?
The Swiss Franc remains firmly positioned as a premier safe-haven currency trading near multi-year highs against the euro and maintaining substantial year-to-date gains against the dollar. Key drivers include persistent geopolitical tensions, US-China trade friction, concerns over the US financial system, and expectations of Federal Reserve rate cuts. The SNB’s decision to hold rates at 0% reflects balanced concerns between supporting a weakening economic outlook, dampened by high US tariffs, and managing persistent franc strength that threatens price stability through deflationary pressures.
Central Bank Notes:
- The SNB maintained its key policy rate at 0% during its meeting on 25 September 2025, pausing a sequence of six consecutive rate cuts as inflation stabilized and the Swiss franc remained firm.
- Recent data showed a modest rebound in inflation, with Swiss consumer prices rising 0.2% year-on-year in August after staying above zero for three consecutive months; this helped alleviate fears of deflation that were mounting earlier in the year.
- The conditional inflation forecast remains broadly unchanged from June: headline inflation is expected to average 0.2% in 2025, 0.5% in 2026, and 0.7% in 2027. The risk of a negative rate move has diminished for now, but the SNB retains flexibility should inflationary pressures weaken again.
- The global economic outlook has deteriorated further, weighed down by heightened trade tensions—especially with the U.S.—and ongoing uncertainty in key Swiss export markets.
- Swiss GDP growth moderated in Q2 after a strong Q1 boosted by front-loaded U.S. exports. The SNB expects growth to slow and remain subdued, with forecasted GDP expansion between 1% and 1.5% in both 2025 and 2026.
- Labor market sentiment in the Swiss industrial sector has softened on concerns over export competitiveness and potential adjustments to production, but the overall growth outlook stays broadly unchanged
- The SNB reiterated its readiness to respond as needed if deflation risks re-emerge, emphasizing its commitment to medium-term price stability and a robust, transparent communication policy, with the introduction of more detailed monetary policy minutes beginning in October.
- The next meeting is on 11 December 2025.
Next 24 Hours Bias
Weak Bearish
The Pound (GBP)
Key news events today
CPI y/y (6:00 am GMT)
What can we expect from GBP today?
Wednesday represents a critical juncture for the British pound as September inflation data is expected to confirm the UK’s persistent price pressures. With CPI forecast to hit 4% double the Bank of England’s target, the reading will dominate market focus and likely eliminate any near-term prospects for additional rate cuts. The pound traded around 1.3371 against the dollar and 1.1515 versus the euro as investors digested weak fiscal dynamics, with government borrowing overshooting forecasts and Chancellor Rachel Reeves facing pressure to announce significant tax increases in November’s Autumn Budget.
Central Bank Notes:
- The Bank of England’s Monetary Policy Committee (MPC) voted on 18 September 2025 by a majority (expected split likely 7–2 or 6–3) to hold the Bank Rate steady at 4.00%, following the August rate cut. Most members cited persistent inflation and mixed indicators on growth and employment, while a minority favored further easing due to the cooling labor market and subdued GDP growth.
- The Committee decided to decrease the pace of quantitative tightening, planning to reduce the stock of UK government bond purchases by £67.5 billion over the next 12 months, instead of the prior £100 billion pace, with the gilt balance now standing at nearly £558 billion. This reflects increased volatility in bond markets and a shift to a more gradual approach.
- Headline inflation rose unexpectedly to 3.8% in July and is projected at 4% for September, above the Bank’s 2% target. Price pressures are driven by regulated energy costs and ongoing food price increases. While previous disinflation has been substantial, core inflation remains elevated and sticky.
- The MPC expects headline inflation to remain above target through Q4, with a resumption of the downward trend projected for early 2026 as energy and regulated price pressures abate. The Committee remains watchful for signs of persistent inflation despite previous policy tightening.
- UK GDP growth is stagnant, with business and consumer activity subdued. Recent labor market data show rising unemployment rates (now at 4.7%) and stabilizing wage growth (holding near 5%), indicating slack but continued wage price pressure. The Committee remains cautious amid lackluster demand and soft survey sentiment.
- Pay growth and employment indicators have moderated further, alongside confirmation from business surveys that pay settlements are slowing. The Committee expects wage growth to decelerate significantly through Q4 and the rest of 2025.
- Global uncertainty persists due to volatile energy prices, supply chain disruptions linked to Middle East conflicts, and renewed trade tensions. The MPC remains vigilant in tracking transmission of external cost/wage shocks to UK inflation.
- Risks to inflation are considered two-sided. While subdued domestic growth and softening labor activity suggest scope for easing, persistent inflation requires caution. The MPC anticipates a slow, gradual reduction path in rates, continuing its data-dependent approach with careful adjustment as warranted by economic developments.
- The Committee’s bias remains toward maintaining a restrictive monetary policy stance until firmer evidence emerges that inflation will return sustainably to the 2% target. All future decisions will remain highly data dependent, with a strong emphasis on evolving demand, inflation expectations, costs, and labor market conditions.
- The next meeting is on 6 November 2025.
Next 24 Hours Bias
Weak Bullish
The Canadian Dollar (CAD)
Key news events today
No major news event
What can we expect from CAD today?
The Canadian dollar is navigating challenging conditions characterized by rising inflation above the Bank of Canada’s target, persistent trade tensions with the United States, declining commodity prices, and weakening economic fundamentals. While inflation accelerated to 2.4% in September, driven by base-year effects in gasoline and rising food costs, elevated unemployment and economic slack support continued monetary easing expectations. Markets are pricing in a high probability of another 25 basis point rate cut on October 29, though the inflation uptick adds some uncertainty.
Central Bank Notes:
- The Council cited continued U.S. tariff volatility and slow progress on trade negotiations as major contributors to ongoing uncertainty. While headline tariffs have not escalated further, the unpredictability of U.S. policy remains a significant risk for Canadian exports and business confidence.
- Uncertainty about U.S. trade policy and recurring tariff threats continued to weigh on growth prospects. The Bank flagged downside risks to the export sector, with survey data indicating ongoing hesitancy among manufacturers and exporters.
- After modest growth in Q1, Canada’s economy slipped into contraction, with GDP shrinking by 0.8% in Q2 and forecast to decrease again by 0.8% in Q3. Economic weakness has been most pronounced in manufacturing and goods-producing sectors affected by trade frictions and softer U.S. demand.
- Early estimates show that growth stabilized in September but remained well below the Bank’s 2% forecast for Q4. Manufacturing output has improved slightly—supported by a modest rebound in petroleum and mining activity—while consumer spending and retail sales were largely flat.
- Consumer spending remained subdued as households continued to limit discretionary purchases amid uncertainty and a slower job market. Housing activity stayed weak, despite earlier government efforts to boost affordability and modest gains in some real estate segments.
- Headline CPI inflation edged up to 1.9% in August, undershooting economist expectations but still showing emerging pressures from shelter and imported goods costs. Core inflation metrics were mixed, though price growth remains just below the Bank’s 2% target.
- The Governing Council reaffirmed its cautious approach, emphasizing that while further rate cuts are possible, the pace will hinge on the path of U.S. tariffs, domestic inflation dynamics, and signs of a sustainable recovery. The Bank remains vigilant against the risk of inflation falling below target in the face of economic slack.
- The next meeting is on 29 October 2025.
Next 24 Hours Bias
Medium Bearish
Oil
Key news events today
EIA crude oil inventories ( 2:30 pm GMT)
What can we expect from Oil today?
Oil prices are attempting a modest recovery from five-month lows, with Brent trading around $61.32/barrel and WTI near $57.82/barrel. The market faces significant headwinds from a projected record global oversupply of 4 million bpd in 2026, driven by accelerating OPEC+ production increases and surging non-OPEC+ output, particularly from the United States, where production hit an all-time high of 13.636 million bpd. Over 1 billion barrels of crude are currently stored on tankers worldwide, the largest floating inventory since 2020, signaling extreme oversupply conditions.
Next 24 Hours Bias
Weak Bearish
The post IC Markets – Europe Fundamental Forecast | 22 October 2025 first appeared on IC Markets | Official Blog.
Wednesday 22nd October 2025: Technical Outlook and Review
422562 October 22, 2025 14:00 ICMarkets Market News
DXY (U.S. Dollar Index):
Potential Direction: Bullish
Overall momentum of the chart: Bearish
The price could make a short-term pullback toward the pivot before rising again toward the 1st resistance
Pivot: 98.55
Supporting reasons: Identified as an overlap support, where renewed buying pressure could emerge to push the price higher.
1st support: 98.00
Supporting reasons: Identified as a pullback support that aligns with the 50% Fibonacci retracement, indicating a potential area where the price could again stabilize.
1st resistance: 99.53
Supporting reasons: Identified as a pullback resistance, indicating a potential area that could halt any further upward movement
EUR/USD:
Potential Direction: Bullish
Overall momentum of the chart: Bullish
The price could make a short-term pullback toward the pivot before rising again toward the 1st resistance
Pivot: 1.1582
Supporting reasons: Identified as a pullback support that aligns with the 78.6% Fibonacci retracement, where renewed buying pressure could emerge to push the price higher.
1st support: 1.1554
Supporting reasons: Identified as a multi-swing low support, indicating a potential level where the price could stabilize once again.
1st resistance: 1.1655
Supporting reasons: Identified as a pullback resistance, indicating a potential level that could cap further upward movement.
EUR/JPY:
Potential Direction: Bullish
Overall momentum of the chart: Bullish
The price could make a short-term pullback toward the pivot before rising again toward the 1st resistance
Pivot: 176.07
Supporting reasons: Identified as a pullback support, where renewed buying pressure could emerge to push the price higher.
1st support: 174.93
Supporting reasons: Identified as an overlap support that aligns with the 50% Fibonacci retracement, indicating a potential area where the price could again stabilize.
1st resistance: 177.75
Supporting reasons: Identified as a swing high resistance, indicating a potential level that could cap further upward movement.
EUR/GBP:
Potential Direction: Bearish
Overall momentum of the chart: Bullish
The price has already reacted off the pivot and may continue its bearish move toward the 1st support
Pivot: 0.8693
Supporting reasons: Identified as an overlap resistance, where selling pressures could intensify and potentially cap any upward retracement
1st support: 0.8646
Supporting reasons: Identified as an overlap support that aligns with the 127.2% Fibonacci extension, indicating a potential area where the price could stabilize once more.
1st resistance: 0.8719
Supporting reasons: Identified as an overlap resistance, indicating a potential level that could cap further upward movement.
GBP/USD:
Potential Direction: Bullish
Overall momentum of the chart: Bearish
The price is falling toward the pivot and could make a short-term pullback before rising again toward the 1st resistance
Pivot: 1.3356
Supporting reasons: Identified as a pullback support that aligns with the 50% Fibonacci retracement, where renewed buying pressure could emerge to push the price higher.
1st support: 1.3309
Supporting reasons: Identified as a pullback support that aligns closely with the 78.6% Fibonacci retracement, indicating a potential area where the price could stabilize once more.
1st resistance: 1.3409
Supporting reasons: Identified as a pullback resistance, indicating a potential level that could halt further upward movement.
GBP/JPY:
Potential Direction: Bullish
Overall momentum of the chart: Bullish
The price could make a short-term pullback toward the pivot before rising again toward the 1st resistance
Pivot: 202.86
Supporting reasons: Identified as a pullback support, where renewed buying pressure could emerge to push the price higher.
1st support: 201.15
Supporting reasons: Identified as an overlap support, indicating a potential level where the price could stabilize once more.
1st resistance: 204.86
Supporting reasons: Identified as a swing high resistance, indicating a potential level that could halt further upward movement.
USD/CHF:
Potential Direction: Bullish
Overall momentum of the chart: Bullish
The price could make a short-term pullback toward the pivot before rising again toward the 1st resistance
Pivot: 0.7947
Supporting reasons: Identified as a pullback support, where renewed buying pressure could emerge to push the price higher.
1st support: 0.7896
Supporting reasons: Identified as a pullback support that aligns with the 78.6% Fibonacci retracement, indicating a potential area where the price could again stabilize.
1st resistance: 0.8008
Supporting reasons: Identified as a pullback resistance that aligns closely with the 78.6% Fibonacci retracement, indicating a potential level that could cap further upward movement.
USD/JPY:
Potential Direction: Bullish
Overall momentum of the chart: Bullish
The price could make a short-term pullback toward the pivot before rising again toward the 1st resistance
Pivot: 151.17
Supporting reasons: Identified as a pullback support, where renewed buying pressure could emerge to push the price higher.
1st support: 149.81
Supporting reasons: Identified as an overlap support, indicating a strong area where buyers might return, and the price could stabilize once again.
1st resistance: 152.47
Supporting reasons: Identified as an overlap resistance. This is a significant resistance that could cap further upward movement and coincide with profit-taking zones for bullish positions
USD/CAD:
Potential Direction: Bullish
Overall momentum of the chart: Bearish
The price has already bounced off the pivot and may continue its bullish move toward the 1st resistance.
Pivot: 1.4005
Supporting reasons: Identified as an overlap support that aligns with the 50% Fibonacci retracement, indicating a potential area where buying interest could pick up.
1st support: 1.3947
Supporting reasons: Identified as an overlap support, indicating a key level where the price could stabilize once more.
1st resistance: 1.4073
Supporting reasons: Identified as a swing high resistance, making it a possible target for bullish advances and a level where some sellers could return to cap gains
AUD/USD:
Potential Direction: Bearish
Overall momentum of the chart: Bullish
The price has already reacted off the pivot and may continue its bearish move toward the 1st support
Pivot: 0.6530
Supporting reasons: Identified as an overlap resistance that aligns with the 50% Fibonacci retracement,, where selling pressures could intensify and potentially cap any upward retracement
1st support: 0.6446
Supporting reasons: Identified as a swing low support, this area has provided strong support historically and may attract buying interest for a potential short-term bounce
1st resistance: 0.6558
Supporting reasons: Identified as a pullback resistance, this level could cap upside potential in the current bearish structure.
NZD/USD
Potential Direction: Bearish
Overall momentum of the chart: Bullish
The price could see a short-term pullback toward the pivot before continuing its bearish move down toward the 1st support.
Pivot: 0.5762
Supporting reasons: Identified as a pullback resistance that aligns with the 61.8% Fibonacci retracement, where selling pressures could intensify and potentially cap any upward retracement.
1st support: 0.5688
Supporting reasons: Identified as a swing low support, this area has provided strong support historically and may attract buying interest for a potential short-term bounce
1st resistance: 0.5803
Supporting reasons: Identified as an overlap resistance, indicating a potential area that could halt any further upward movement.
US30 (DJIA):
Potential Direction: Bullish
Overall momentum of the chart: Bullish
The price could make a short-term pullback toward the pivot before rising again toward the 1st resistance
Pivot: 46,684.86
Supporting reasons: Identified as a pullback support, where renewed buying pressure could emerge to push the price higher.
1st support: 46,182.48
Supporting reasons: Identified as a pullback support, suggesting a potential area where the price could stabilize once again.
1st resistance: 47,505.88
Supporting reasons: Identified as a resistance that is supported by the 161.8% Fibonacci extension, indicating a potential area that could halt any further upward movement.
DE40 (DAX):
Potential Direction: Bearish
Overall momentum of the chart: Bullish
The price could see a short-term pullback toward the pivot before continuing its bearish move down toward the 1st support.
Pivot: 24,344.49
Supporting reasons: Identified as an overlap resistance that aligns with the 61.8% Fibonacci retracement, where selling pressures could intensify and potentially cap any upward retracement.
1st support: 23,935.25
Supporting reasons: Identified as a pullback support, indicating a key level where the price could stabilize once more.
1st resistance: 24,771.19
Supporting reasons: Identified as a swing high resistance, indicating a potential area that could halt any further upward movement.
US500 (S&P 500):
Potential Direction: Bullish
Overall momentum of the chart: Bullish
The price could make a short-term pullback toward the pivot before rising again toward the 1st resistance
Pivot: 6,697.28
Supporting reasons: Identified as a pullback support, where renewed buying pressure could emerge to push the price higher.
1st support: 6,592.60
Supporting reasons: Identified as a pullback support, indicating a potential level where the price could stabilize once again.
1st resistance: 6,760.21
Supporting reasons: Identified as a multi-swing high resistance that aligns with the 127.2% Fibonacci extension, indicating a potential area that could halt any further upward movement.
BTC/USD (Bitcoin):
Potential Direction: Bullish
Overall momentum of the chart: Bullish
The price could make a short-term pullback toward the pivot before rising again toward the 1st resistance
Pivot: 107,723.74
Supporting reasons: Identified as an overlap support, where renewed buying pressure could emerge to push the price higher.
1st support: 104,594.52
Supporting reasons: Identified as a swing low support, indicating a potential level where the price could stabilize once more.
1st resistance: 116,139.03
Supporting reasons: Identified as an overlap resistance that aligns with the 100% Fibonacci projection, indicating a potential area that could halt any further upward movement.
ETH/USD (Ethereum):
Potential Direction: Bearish
Overall momentum of the chart: Bullish
The price could see a short-term pullback toward the pivot before continuing its bearish move down toward the 1st support.
Pivot: 4,263.96
Supporting reasons: Identified as an overlap resistance that aligns with the 50% Fibonacci retracement, where selling pressures could intensify and potentially cap any upward retracement.
1st support: 3,831.00
Supporting reasons: Identified as an overlap support, indicating a potential level where the price could stabilize once more.
1st resistance: 4,455.38
Supporting reasons: Identified as a pullback resistance, indicating a potential area that could halt any further upward movement.
WTI/USD (Oil):
Potential Direction: Bearish
Overall momentum of the chart: Bullish
The price could see a short-term pullback toward the pivot before continuing its bearish move down toward the 1st support.
Pivot: 60.57
Supporting reasons: Identified as a pullback resistance, where selling pressures could intensify and potentially cap any upward retracement.
1st support: 56.79
Supporting reasons: Identified as a swing low support, indicating a key level where the price could stabilize once more.
1st resistance: 63.15
Supporting reasons: Identified as a pullback resistance, indicating a potential area that could halt any further upward movement.
XAU/USD (GOLD):
Potential Direction: Bearish
Overall momentum of the chart: Bullish
The price could see a short-term pullback toward the pivot before continuing its bearish move down toward the 1st support.
Pivot: 4,179.64
Supporting reasons: Identified as a pullback resistance, where selling pressures could intensify and potentially cap any upward retracement.
1st support: 4,059.16
Supporting reasons: Identified as a pullback support that aligns with the 78.6% Fibonacci retracement, indicating a key level where the price could stabilize once more.
1st resistance: 4,369.41
Supporting reasons: Identified as a multi swing high resistancethat, indicating a potential area that could halt any further upward movement.
The accuracy, completeness and timeliness of the information contained on this site cannot be guaranteed. IC Markets does not warranty, guarantee or make any representations, or assume any liability regarding financial results based on the use of the information in the site.
News, views, opinions, recommendations and other information obtained from sources outside of www.icmarkets.com, used in this site are believed to be reliable, but we cannot guarantee their accuracy or completeness. All such information is subject to change at any time without notice. IC Markets assumes no responsibility for the content of any linked site.
The fact that such links may exist does not indicate approval or endorsement of any material contained on any linked site. IC Markets is not liable for any harm caused by the transmission, through accessing the services or information on this site, of a computer virus, or other computer code or programming device that might be used to access, delete, damage, disable, disrupt or otherwise impede in any manner, the operation of the site or of any user’s software, hardware, data or property.
The post Wednesday 22nd October 2025: Technical Outlook and Review first appeared on IC Markets | Official Blog.
Wednesday 22nd October 2025: Asian Markets Slip Amid U.S.-China Tensions and Weak Commodity Prices
422561 October 22, 2025 14:00 ICMarkets Market News
Global Markets:
- Asian Stock Markets : Nikkei up 0.11%, Shanghai Composite down -0.44%, Hang Seng down -1.30% ASX down -0.75%
- Commodities : Gold at $4,140.84 (0.77%), Silver at $48.275 (1.20%), Brent Oil at $62.27 (1.55%), WTI Oil at $58.19 (1.66%)
- Rates : US 10-year yield at 3.959, UK 10-year yield at 4.4820, Germany 10-year yield at 2.5508
News & Data:
- (CAD) CPI m/m 0.1% to -0.1% expected
- (CAD) Median CPI y/y 3.2% to 3.0% expected
- (CAD) Trimmed CPI y/y 3.1% to 3.0% expected
Markets Update:
Asian stock markets traded mostly lower on Wednesday, mirroring mixed cues from Wall Street, as traders stayed cautious amid persistent U.S.-China trade tensions and the ongoing U.S. government shutdown. The absence of key U.S. economic data, due to the shutdown, also kept investors on the sidelines. Attention now turns to U.S. consumer inflation data due Friday and the upcoming Asia-Pacific Economic Cooperation summit in South Korea.
In Australia, the S&P/ASX 200 dropped 0.84 percent to 9,018.80, dragged by sharp losses in gold mining stocks after bullion prices recorded their biggest intra-day drop in nearly 12 years. Major miners like BHP, Rio Tinto, and Fortescue fell over 1 percent, while gold producers such as Northern Star and Evolution Mining plunged around 10 percent. Oil stocks were mixed, with Woodside Energy up over 4 percent, while Santos slipped nearly 1 percent.
Japan’s Nikkei 225 declined 0.48 percent to 49,077.56, reversing earlier gains. Losses were led by SoftBank and technology firms like Advantest and Screen Holdings, while automakers Toyota and Honda gained more than 3 percent each. Japan also reported a trade deficit of 234.6 billion yen in September, missing expectations for a surplus.
Elsewhere, markets in China, Hong Kong, and New Zealand traded modestly higher. On Wall Street, the Dow gained 0.5 percent to a new record close, while the S&P 500 and Nasdaq ended nearly flat.
Upcoming Events:
- 02:30 PM GMT – USD Crude Oil Inventories
The post Wednesday 22nd October 2025: Asian Markets Slip Amid U.S.-China Tensions and Weak Commodity Prices first appeared on IC Markets | Official Blog.
Trade Euro on the USD CPI Data
422559 October 22, 2025 13:39 ICMarkets Market News
The market is eagerly anticipating the first government US data in a number of weeks on Friday, with traders looking for some big moves on the delayed release of key inflation numbers. The US Bureau of Labour Statistics is scheduled to release key CPI numbers this Friday despite the continued government shutdown, and with the Federal Reserve Bank’s next meeting just five days later, the impact is expected to be much larger than usual as investors look for data indicators on the health of the US economy that have been in short supply recently.
FX markets have been largely influenced by geopolitical updates in the last few weeks, as the dearth of US data has affected underlying fundamentals. However, traders are expecting big moves in the dollar, especially if the data prints substantially off expected levels. The month-on-month CPI number is expected to show an increase of 0.3%, with the Core data coming in at +0.4%. The year-on-year number is expected to push up to +3.1% from +2.9%, and anything higher could see some pullback on rate cut expectations from the Fed.
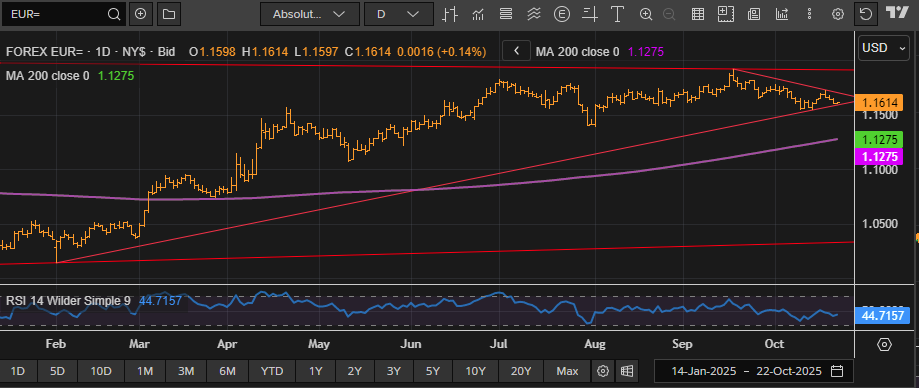
The Euro is nicely positioned for a move on the data, as it is trading close to good long-term support on the daily charts. A stronger number, which—although unlikely to change expectations of a rate cut next week—would push longer-dated expectations back, could see a break of strong support levels and a move down under the trendline support and recent lows, with the initial target at the August lows around 1.1400. However, a weaker number would lock in a more dovish Fed and see the Euro rally back into recent ranges, with the initial resistance now just under 1.1700.
Resistance 2: 1.1728 – 17 Oct High
Resistance 1: 1.1696 – Trendline Resistance
Support 1: 1.1590 – Trendline Support
Support 2: 1.1540 – October Low
The post Trade Euro on the USD CPI Data first appeared on IC Markets | Official Blog.
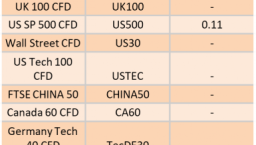
Ex-Dividend 22/10/2025
422552 October 22, 2025 10:39 ICMarkets Market News
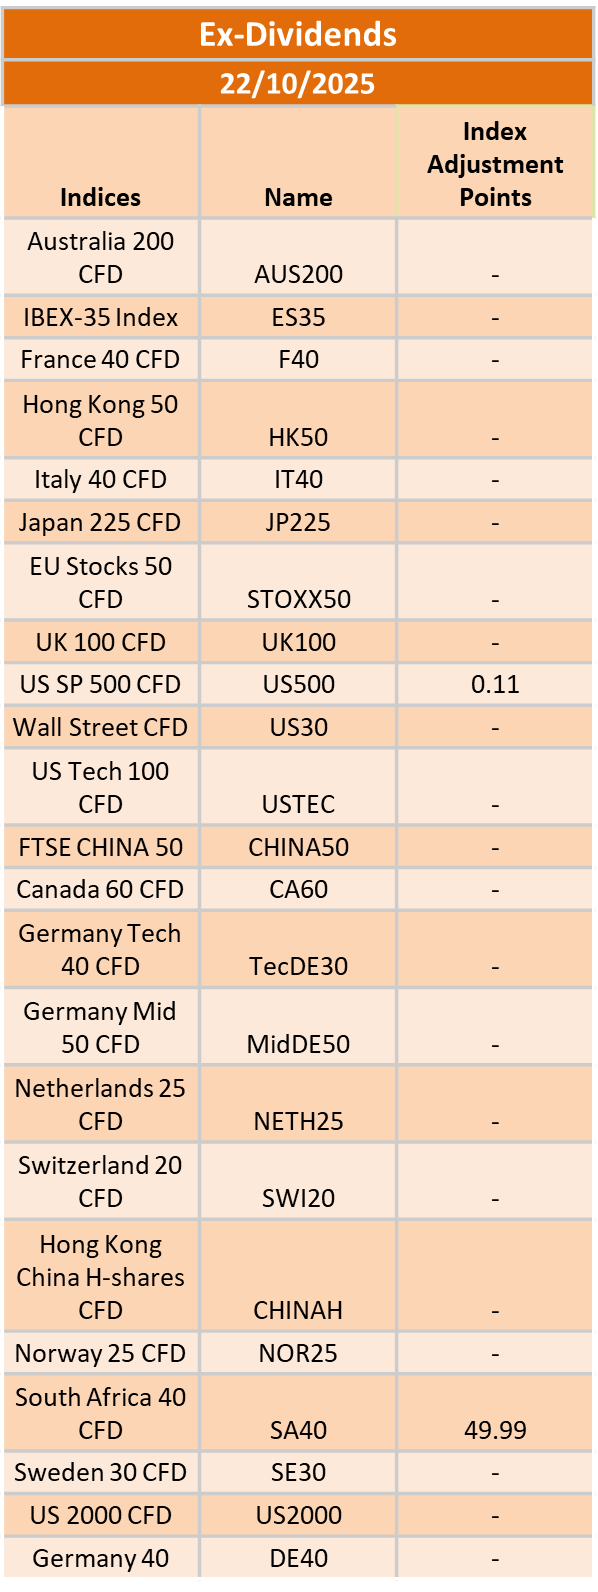
The post Ex-Dividend 22/10/2025 first appeared on IC Markets | Official Blog.
General Market Analysis – 21/10/25
422525 October 21, 2025 15:05 ICMarkets Market News
US Markets Drive Higher to Start the Week – Nasdaq up 1.4%
US stocks drove higher in trading yesterday to kick off a big earnings week in strong fashion. Investors, hoping for more positive quarterly earnings data in the coming days, pushed the Dow 1.12% higher to 46,706, the S&P up 1.07% to 6,735, and the Nasdaq 1.37% to 22,990. US Treasury yields eased lower again as traders await the first government data update for weeks on Friday, the 2-year down just 0.2 of a basis point to 3.455%, and the benchmark 10-year down 2.9 basis points to 3.980%. The dollar pushed higher against the majors, the DXY up 0.17% to 98.60. Oil prices were steady near recent lows, Brent down 0.64% to $60.90 and WTI off just 0.03% to $57.52. Gold had another big day as it surged back again towards record levels, up 2.45% at $4,356.20 by the close.
Gold Rush Continues – More Fresh Records on the Horizon
Gold powered higher again in trading yesterday as buyers propelled it 2.5% higher to push it close to yet another all-time high. Commentary continues to flood in on its meteoric rise over the last several weeks, with the move being attributed to various theories, including dollar debasement, increased geopolitical concerns, huge portfolio reallocations, and Federal Reserve rate cuts. Most of these can be argued against fairly comprehensively, as other moves in the market do not back up those concepts. However, only time will tell if we do see some corrections in other markets, and if they come, they should be substantial. For now, though, traders are happy to continue to follow the trend – which is being backed up by huge lines outside physical brokers in major global cities – and any dip is looking well supported, as are break trades above previous highs. The current record is $4,381.21, and with the market trading just under that level at the moment, many traders are not expecting that record to last too long.
Quiet Calendar Day Ahead for Traders
It is another quiet calendar day ahead for traders today as the continuing US government shutdown keeps most US data off the schedule. Asian markets are set to open on the front foot after a strong day on Wall Street yesterday, and there is little on the calendar to rock sentiment unless we have further geopolitical updates. The European session is also relatively quiet, with no major data scheduled. We do hear from ECB President Christine Lagarde midway through the day, but most traders are not expecting any substantial market moves around the event, as she has been active on the speaking circuit over the last few weeks. The New York session looks to have the most potential for moves, with the initial focus north of the border for Canadian CPI data before the focus moves back south for earnings numbers later in the day, including Netflix results after the close.
The post General Market Analysis – 21/10/25 first appeared on IC Markets | Official Blog.
The Week Ahead – Week Commencing 20 October 2025
422519 October 21, 2025 15:05 ICMarkets Market News
It was another hectic week for traders last week as geopolitical updates again dominated market flow. Stock markets remained strong despite talk of bearish sentiment, while gold smashed new records on a daily basis.
The US–China trade debate will again take centre stage for investors this week as they continue to deal with a lack of US data due to the government shutdown, although we are scheduled to get key CPI numbers later in the week.
Earnings numbers will also feature for equities markets, with big names Tesla and Netflix due to report, which investors will also monitor for an overall perception of the US economy.
Here is our usual day-by-day breakdown of the major risk events this week:

The macroeconomic calendar kicks off early this week with a focus on New Zealand data early in the day, with CPI numbers due out shortly after the open. The focus moves north later in the day with a big Chinese data drop due; Loan Prime Rate numbers are scheduled before we then have key GDP, Industrial Production, and Retail Sales data midway through the session. The latter two sessions are relatively quiet from a calendar perspective, but traders will be paying close attention to newswires for any trade updates.

The Asian session has little on the cards on Tuesday, but things will start to pick up as we move through the day. ECB President Christine Lagarde is due to speak in the London session, but the major focus for the day will be on Canadian markets close to the New York open, when key CPI numbers are released.

It is a relatively quiet day on Wednesday on the calendar, with little in the first session of the day. There will be key UK CPI numbers out early in the London session, which will have sterling traders on their toes, but there is little else scheduled for the rest of the day to influence markets.

It is another quiet calendar day on Thursday, with nothing of note out during the first two sessions of the day. Once again, Canadian markets will be in focus at the New York open, with Retail Sales data due out. Existing Home Sales numbers are scheduled out of the US as well, but traders are still expecting geopolitical updates to dominate flow.

It is a busy day to end the week on Friday, with Flash Manufacturing and Services PMI numbers due out from several jurisdictions, including Australia, France, Germany, the UK, the EU, and the US. We are also scheduled to have delayed key CPI data out of the US, which will give us our first big data update for three weeks, with plenty of volatility expected around the release.
The post The Week Ahead – Week Commencing 20 October 2025 first appeared on IC Markets | Official Blog.
Tuesday 21st October 2025: Technical Outlook and Review
422502 October 21, 2025 15:00 ICMarkets Market News
DXY (U.S. Dollar Index):
Potential Direction: Bearish
Overall momentum of the chart: Bearish
The price could see a short-term pullback toward the pivot before continuing its bearish move down toward the 1st support.
Pivot: 98.76
Supporting reasons: Identified as an overlap resistance, where selling pressures could intensify and potentially cap any upward retracement.
1st support: 98.00
Supporting reasons: Identified as a pullback support that aligns with the 50% Fibonacci retracement, indicating a potential area where the price could again stabilize.
1st resistance: 99.53
Supporting reasons: Identified as a pullback resistance, indicating a potential area that could halt any further upward movement
EUR/USD:
Potential Direction: Bullish
Overall momentum of the chart: Bullish
The price could make a short-term pullback toward the pivot before rising again toward the 1st resistance
Pivot: 1.1618
Supporting reasons: Identified as a pullback support, where renewed buying pressure could emerge to push the price higher.
1st support: 1.1554
Supporting reasons: Identified as a multi-swing low support, indicating a potential level where the price could stabilize once again.
1st resistance: 1.1712
Supporting reasons: Identified as an overlap resistance that aligns closely with the 78.6% Fibonacci retracement, indicating a potential level that could cap further upward movement.
EUR/JPY:
Potential Direction: Bearish
Overall momentum of the chart: Bullish
The price has already reacted off the pivot and may continue its bearish move toward the first support
Pivot: 176.23
Supporting reasons: Identified as an overlap resistance, where selling pressures could intensify and potentially cap any upward retracement.
1st support: 174.43
Supporting reasons: Identified as an overlap support that aligns with the 61.8% Fibonacci retracement, indicating a potential area where the price could again stabilize.
1st resistance: 177.75
Supporting reasons: Identified as a swing high resistance, indicating a potential level that could cap further upward movement.
EUR/GBP:
Potential Direction: Bearish
Overall momentum of the chart: Bullish
The price could see a short-term pullback toward the pivot before continuing its bearish move down toward the 1st support.
Pivot: 0.8725
Supporting reasons: Identified as an overlap resistance, where selling pressures could intensify and potentially cap any upward retracement.
1st support: 0.8657
Supporting reasons: Identified as an overlap support, indicating a potential area where the price could stabilize once more.
1st resistance: 0.8750
Supporting reasons: Identified as a swing high resistance, indicating a potential level that could cap further upward movement.
GBP/USD:
Potential Direction: Bullish
Overall momentum of the chart: Bearish
The price is falling toward the pivot and could make a short-term pullback before rising again toward the 1st resistance
Pivot: 1.3356
Supporting reasons: Identified as a pullback support that aligns with the 50% Fibonacci retracement, where renewed buying pressure could emerge to push the price higher.
1st support: 1.3269
Supporting reasons: Identified as an overlap support, indicating a potential area where the price could stabilize once more.
1st resistance: 1.3523
Supporting reasons: Identified as an overlap resistance that aligns closely with the 61.8% Fibonacci retracement, indicating a potential level that could halt further upward movement.
GBP/JPY:
Potential Direction: Bearish
Overall momentum of the chart: Bullish
The price has already reacted off the pivot and may continue its bearish move toward the first support
Pivot: 202.86
Supporting reasons: Identified as a pullback resistance, where selling pressures could intensify and potentially cap any upward retracement.
1st support: 201.15
Supporting reasons: Identified as an overlap support, indicating a potential level where the price could stabilize once more.
1st resistance: 204.86
Supporting reasons: Identified as a swing high resistance, indicating a potential level that could halt further upward movement.
USD/CHF:
Potential Direction: Bearish
Overall momentum of the chart: Bullish
The price could see a short-term pullback toward the pivot before continuing its bearish move down toward the 1st support.
Pivot: 0.7947
Supporting reasons: Identified as a pullback resistance that aligns with the 38.2% Fibonacci retracement, where selling pressures could intensify and potentially cap any upward retracement.
1st support: 0.7896
Supporting reasons: Identified as a pullback support that aligns with the 78.6% Fibonacci retracement, indicating a potential area where the price could again stabilize.
1st resistance: 0.8008
Supporting reasons: Identified as a pullback resistance, indicating a potential level that could cap further upward movement.
USD/JPY:
Potential Direction: Bearish
Overall momentum of the chart: Bullish
The price could see a short-term pullback toward the pivot before continuing its bearish move down toward the 1st support.
Pivot: 150.91
Supporting reasons: Identified as a pullback resistance, where selling pressures could intensify and potentially cap any upward retracement.
1st support: 148.82
Supporting reasons: Identified as a pullback support that aligns with the 61.8% Fibonacci retracement, indicating a strong area where buyers might return, and the price could stabilize once again.
1st resistance: 152.47
Supporting reasons: Identified as an overlap resistance. This is a significant resistance that could cap further upward movement and coincide with profit-taking zones for bullish positions
USD/CAD:
Potential Direction: Bullish
Overall momentum of the chart: Bearish
The price has already bounced off the pivot and may continue its bullish move toward the 1st resistance.
Pivot: 1.4012
Supporting reasons: Identified as an overlap support, indicating a potential area where buying interest could pick up.
1st support: 1.3919
Supporting reasons: Identified as an overlap support, indicating a key level where the price could stabilize once more.
1st resistance: 1.4156
Supporting reasons: Identified as a pullback resistance that aligns with the 78.6% Fibonacci retracement, making it a possible target for bullish advances and a level where some sellers could return to cap gains
AUD/USD:
Potential Direction: Bearish
Overall momentum of the chart: Bullish
The price could see a short-term pullback toward the pivot before continuing its bearish move down toward the 1st support.
Pivot: 0.6530
Supporting reasons: Identified as an overlap zone where any brief bullish recovery could find resistance before resuming the bearish trend.
1st support: 0.6446
Supporting reasons: Identified as a swing low support, this area has provided strong support historically and may attract buying interest for a potential short-term bounce
1st resistance: 0.6558
Supporting reasons: Identified as a pullback resistance, this level could cap upside potential in the current bearish structure.
NZD/USD
Potential Direction: Bearish
Overall momentum of the chart: Bullish
The price could see a short-term pullback toward the pivot before continuing its bearish move down toward the 1st support.
Pivot: 0.5762
Supporting reasons: Identified as a pullback resistance, where selling pressures could intensify and potentially cap any upward retracement.
1st support: 0.5698
Supporting reasons: Identified as a support that is supported by the 161.8% Fibonacci extension, this area has provided strong support historically and may attract buying interest for a potential short-term bounce
1st resistance: 0.5803
Supporting reasons: Identified as an overlap resistance, indicating a potential area that could halt any further upward movement.
US30 (DJIA):
Potential Direction: Bearish
Overall momentum of the chart: Bullish
The price could see a short-term pullback toward the pivot before continuing its bearish move down toward the 1st support.
Pivot: 46,854.31
Supporting reasons: Identified as a multi swing high resistance, where selling pressures could intensify and potentially cap any upward retracement.
1st support: 46,182.48
Supporting reasons: Identified as a pullback support, suggesting a potential area where the price could stabilize once again.
1st resistance: 47,505.88
Supporting reasons: Identified as a resistance that is supported by the 161.8% Fibonacci extension, indicating a potential area that could halt any further upward movement.
DE40 (DAX):
Potential Direction: Bearish
Overall momentum of the chart: Bullish
The price could see a short-term pullback toward the pivot before continuing its bearish move down toward the 1st support.
Pivot: 24,344.49
Supporting reasons: Identified as an overlap resistance, where selling pressures could intensify and potentially cap any upward retracement.
1st support: 23,935.25
Supporting reasons: Identified as a pullback support that aligns with the 61.8% Fibonacci retracement, indicating a key level where the price could stabilize once more.
1st resistance: 24,771.19
Supporting reasons: Identified as a swing high resistance, indicating a potential area that could halt any further upward movement.
US500 (S&P 500):
Potential Direction: Bullish
Overall momentum of the chart: Bullish
The price could make a short-term pullback toward the pivot before rising again toward the 1st resistance
Pivot: 6,697.28
Supporting reasons: Identified as a pullback support, where renewed buying pressure could emerge to push the price higher.
1st support: 6,520.61
Supporting reasons: Identified as an overlap support, indicating a potential level where the price could stabilize once again.
1st resistance: 6,760.21
Supporting reasons: Identified as a multi-swing high resistance that aligns with the 127.2% Fibonacci extension, indicating a potential area that could halt any further upward movement.
BTC/USD (Bitcoin):
Potential Direction: Bearish
Overall momentum of the chart: Bullish
The price could see a short-term pullback toward the pivot before continuing its bearish move down toward the 1st support.
Pivot: 112,195.81
Supporting reasons: Identified as a pullback resistance, where selling pressures could intensify and potentially cap any upward retracement.
1st support: 107,723.74
Supporting reasons: Identified as an overlap support, indicating a potential level where the price could stabilize once more.
1st resistance: 114,604.73
Supporting reasons: Identified as a pullback resistance, indicating a potential area that could halt any further upward movement.
ETH/USD (Ethereum):
Potential Direction: Bearish
Overall momentum of the chart: Bullish
The price could see a short-term pullback toward the pivot before continuing its bearish move down toward the 1st support.
Pivot: 4,263.96
Supporting reasons: Identified as an overlap resistance, where selling pressures could intensify and potentially cap any upward retracement.
1st support: 3,831.00
Supporting reasons: Identified as an overlap support, indicating a potential level where the price could stabilize once more.
1st resistance: 4,455.38
Supporting reasons: Identified as a pullback resistance, indicating a potential area that could halt any further upward movement.
WTI/USD (Oil):
Potential Direction: Bearish
Overall momentum of the chart: Bullish
The price could see a short-term pullback toward the pivot before continuing its bearish move down toward the 1st support.
Pivot: 60.57
Supporting reasons: Identified as a pullback resistance, where selling pressures could intensify and potentially cap any upward retracement.
1st support: 57.01
Supporting reasons: Identified as a swing low support that aligns with the 100% Fibonacci projection, indicating a key level where the price could stabilize once more.
1st resistance: 63.15
Supporting reasons: Identified as a pullback resistance, indicating a potential area that could halt any further upward movement.
XAU/USD (GOLD):
Potential Direction: Bullish
Overall momentum of the chart: Bullish
The price could make a short-term pullback toward the pivot before rising again toward the 1st resistance
Pivot: 4,179.64
Supporting reasons: Identified as a pullback support, where renewed buying pressure could emerge to push the price higher.
1st support: 4,059.16
Supporting reasons: Identified as a pullback support, indicating a key level where the price could stabilize once more.
1st resistance: 4,375.11
Supporting reasons: Identified as a resistancethat is supported by the 100% Fibonacci projection, indicating a potential area that could halt any further upward movement.
The accuracy, completeness and timeliness of the information contained on this site cannot be guaranteed. IC Markets does not warranty, guarantee or make any representations, or assume any liability regarding financial results based on the use of the information in the site.
News, views, opinions, recommendations and other information obtained from sources outside of www.icmarkets.com, used in this site are believed to be reliable, but we cannot guarantee their accuracy or completeness. All such information is subject to change at any time without notice. IC Markets assumes no responsibility for the content of any linked site.
The fact that such links may exist does not indicate approval or endorsement of any material contained on any linked site. IC Markets is not liable for any harm caused by the transmission, through accessing the services or information on this site, of a computer virus, or other computer code or programming device that might be used to access, delete, damage, disable, disrupt or otherwise impede in any manner, the operation of the site or of any user’s software, hardware, data or property.
The post Tuesday 21st October 2025: Technical Outlook and Review first appeared on IC Markets | Official Blog.
IC Markets Asia Fundamental Forecast | 21 October 2025
422501 October 21, 2025 15:00 ICMarkets Market News
IC Markets Asia Fundamental Forecast | 21 October 2025
What happened in the U.S. session?
Markets during the U.S. session steadied after prior volatility. Equity benchmarks advanced on optimism surrounding earnings and potential monetary easing, while oil weakened and bond yields rose marginally. Macroeconomic uncertainty persisted due to the federal shutdown’s impact on data flow, but GDP tracking and consumption metrics continued to signal a resilient U.S. economy heading into late October.
What does it mean for the Asia Session?
Asian traders balanced optimism from improving growth forecasts and bullish equities with caution over trade risks and slowing Chinese momentum. The day’s narrative was dominated by Fed policy expectations, AI-fueled tech sector strength, and a watchful tone on U.S.-China diplomacy ingredients that shaped a cautiously risk-on trading environment across Asian markets.
The Dollar Index (DXY)
Key news events today
No major news event
What can we expect from DXY today?
The US dollar enters Tuesday’s session broadly steady, trading near the mid-98 range on the DXY, with investors cautious ahead of delayed US inflation data and watching political signals from Washington and Beijing. The overarching tone is one of consolidation — the dollar is neither extending its rebound nor revisiting lows, reflecting a balance between softer rate expectations and stable global risk sentiment.
Central Bank Notes:
- The Federal Open Market Committee (FOMC) voted, by majority, to lower the federal funds rate target range by 25 basis points to 4.00%–4.25% at its September 16–17, 2025, meeting, marking the first policy rate adjustment since December 2024 after five consecutive holds.
- The Committee maintained its long-term objective of achieving maximum employment and 2% inflation, acknowledging recent labor market softening and continued tariff-driven price pressures.
- Policymakers expressed elevated concern about downside risks to growth, citing a stalling labor market, modest job creation, and an unemployment rate drifting up toward 4.4%. At the same time, inflation remains above target, with CPI at 3.2% and core inflation at 3.1% as of August 2025; higher energy and food prices, largely attributable to tariffs, continue to weigh on headline measures.
- Although economic activity expanded at a moderate pace in the third quarter, the growth outlook has weakened. Q3 GDP growth is estimated near 1.0% (annualized), with full-year 2025 GDP growth guidance revised to 1.2%, reflecting slowing household consumption and tighter financial conditions.
- In the updated Summary of Economic Projections, the unemployment rate is projected to average 4.5% for the year, with headline PCE inflation revised up slightly to 3.1% for 2025. The Committee anticipates core PCE inflation to remain stubborn, requiring sustained vigilance and a flexible approach to risk management.
- The Committee reiterated its data-dependent approach and openness to further adjustments should employment or inflation deviate meaningfully from current forecasts. Several members dissented, either advocating a larger 50-basis-point cut or preferring no adjustment at this meeting, revealing heightened divergence within the Committee.
- Balance sheet reduction continues at a measured pace. The monthly Treasury redemption cap remains at $5B and the agency MBS cap at $35B, as the Board aims to support orderly market conditions in the face of evolving global and domestic uncertainty.
- The next meeting is scheduled for 28 to 29 October 2025.
Next 24 Hours Bias
Weak Bearish
Gold (XAU)
Key news events today
No major news event
What can we expect from Gold today?
Gold is hovering around the $4,260–$4,280 per ounce range, having regained momentum after last week’s consolidation phase below $4,200. Market forecasts suggest a possible retest of the $4,325–$4,380 resistance zone, with potential for a push beyond $4,400 if bullish momentum persists. On the downside, short-term support lies near $4,200 and $4,163, levels that could attract dip-buying if price corrections occur.
Next 24 Hours Bias
Strong Bullish
The Australian Dollar (AUD)
Key news events today
No major news event
What can we expect from AUD today?
The Australian Dollar is trading cautiously ahead of tomorrow’s Asian session, likely remaining range-bound unless fresh catalysts emerge. Weak labour market data, subdued Chinese demand, and global risk-off trends continue to pressure the AUD. the Australian Dollar is expected to stay under bearish pressure near 0.65, with downside risks dominating unless global sentiment improves or Chinese growth stabilizes.
Central Bank Notes:
- The RBA held its cash rate steady at 3.60% at its October meeting on 29–30 September 2025, marking a second consecutive pause after August’s 25 basis point cut. The move affirms the Bank’s data-dependent approach as inflation trends within the target range.
- Inflation indicators remained stable through September, with headline CPI likely anchoring near 2.2%—comfortably within the 2–3% band. Insurance and housing costs remain sticky but are increasingly offset by moderation in discretionary goods.
- Trimmed mean inflation is estimated at around 2.8%, signaling underlying pressures remain contained. The Board continues to flag food and energy price volatility as short-term risks, though the broader disinflation narrative holds.
- Global conditions remain a source of uncertainty. U.S. policy expectations and uneven growth in China continue to weigh on commodities, even as trade disruptions have eased marginally since mid-year.
- Domestic growth shows resilience in the housing and services sectors, though manufacturing remains subdued. Household incomes have stabilized, but consumption remains only modest, capped by high borrowing costs.
- The labor market maintains relative tightness, though job growth has slowed notably since the first half of the year. Underutilization has ticked higher, but overall employment conditions remain supportive.
- Wage growth is plateauing, reflecting softer labor demand. Weak productivity continues to keep unit labor costs elevated, underscoring a medium-term concern highlighted repeatedly by the RBA.
- Household consumption prospects remain fragile. The combination of high rents and weak discretionary appetite suggests risks of a consumer-led slowdown in Q4 if confidence fails to rebound.
- The Board reiterated that subdued household spending poses risks to business sentiment and may dampen investment and job creation in the coming quarters.
- Monetary policy remains mildly restrictive. The RBA balanced confidence in inflation progress with caution around global and domestic demand risks, keeping further adjustments conditional on incoming data.
- The Bank reaffirmed its dual commitment to price stability and full employment, noting its readiness to act should conditions shift markedly.
- The next meeting is on 5 to 6 November 2025.
Next 24 Hours Bias
Weak Bearish
The Kiwi Dollar (NZD)
Key news events today
No major news event
What can we expect from NZD today?
The NZD recovered slightly to about 0.574 USD on Monday after losing ground earlier in October, supported by in-line inflation data showing consumer prices rose 3% in Q3—exactly at the top of the RBNZ’s target band. While the data indicated some sticky inflation, underlying measures remain subdued, which gives policymakers room to continue easing in November.
Central Bank Notes:
- The Monetary Policy Committee (MPC) agreed to cut the Official Cash Rate (OCR) by 25 basis points to 3.00% on 20 August 2025, marking a three-year low and continuing the easing cycle after July’s pause. The vote was split 4-2, with two members advocating a 50-basis-point cut, highlighting diverging views within the Committee.
- Policymakers indicated that significant uncertainty and a stalling economic recovery prompted this move, leaving the door open for further rate cuts later in the year, with a possible trough around 2.5% by December.
- Annual consumer price index inflation rose to 2.7% in the June quarter and is expected to reach 3% for the September quarter—at the upper end of the MPC’s 1 to 3% target band—but medium-term expectations remain anchored near the 2% midpoint.
- Despite the near-term uptick, headline inflation is projected to return toward 2% by mid-2026, as tradables inflation pressures ease and significant spare capacity continues to dampen domestic price momentum.
- Domestic financial conditions are broadly aligning with MPC expectations, as lower wholesale rates have translated into reduced borrowing costs for households. However, declining consumption and investment demand, higher unemployment, and subdued wage growth reflect ongoing economic slack.
- GDP growth stalled in the second quarter of 2025, contrasting with earlier projections. High-frequency indicators point to continued weakness driven by rising prices for essentials, weakening household savings, and constrained business lending.
- The MPC cautioned that ongoing global tariff uncertainties and policy shifts, especially recent changes in US trade regulations, could amplify market volatility and present both upside and downside risks to New Zealand’s recovery.
- Subject to medium-term inflation pressures continuing to ease as projected, the MPC signaled scope for further OCR cuts, possibly down to 2.5% by year-end, consistent with the latest Monetary Policy Statement outlook.
- The next meeting is on 22 October 2025.
Next 24 Hours Bias
Medium Bearish
The Japanese Yen (JPY)
Key news events today
No major news event
What can we expect from JPY today?
the Japanese yen remains under moderate pressure due to political transition and policy expectations, though downside momentum appears contained by U.S. yield softness and safe-haven demand. The Japanese yen traded defensively ahead of Japan’s leadership vote, with USD/JPY hovering near 150.7–151.2. The currency continued to weaken slightly as markets priced in the likely appointment of Sanae Takaichi as Japan’s first female prime minister, an outcome seen as dovish for monetary policy.
Central Bank Notes:
- The Policy Board of the Bank of Japan decided on 17 September, by a unanimous vote, to set the following guidelines for money market operations for the inter-meeting period:
- The Bank will encourage the uncollateralized overnight call rate to remain at around 0.5%.
- The BOJ will continue its gradual reduction of monthly outright purchases of Japanese Government Bonds (JGBs). The scheduled amount of long-term government bond purchases remains unchanged from the prior decision, with a quarterly reduction pace of about ¥400 billion through March 2026 and about ¥200 billion per quarter from April to June 2026 onward, aiming for a purchase level near ¥2 trillion in January to March 2027.
- Japan’s economy continues to show a moderate recovery, with household consumption supported by rising incomes, although corporate activity has softened somewhat. Overseas economies remain on a moderate growth path, with the impact of global trade policies still weighing on Japan’s export and industrial production outlook.
- On the price front, the year-on-year rate of change in consumer prices (excluding fresh food) remains in the mid-3% range. Inflationary pressures remain broad-based, with persistent cost-push factors in food and energy, alongside solid wage pass-through. However, input cost pressures from past import surges are showing early signs of easing.
- Short-term inflation momentum may moderate as cost-push effects diminish, though rent increases and service-related price gains tied to labor shortages are likely to provide support. Inflation expectations among firms and households continue a gradual upward drift.
- Looking ahead, the economy is projected to grow at a slower-than-trend pace in the near term due to external demand softness and cautious corporate investment plans. However, accommodative financial conditions and steady increases in real labor income are expected to underpin domestic demand.
- In the medium term, as overseas economies recover and global trade stabilizes, Japan’s growth potential is likely to improve. With persistent labor market tightness and rising medium- to long-term inflation expectations, core inflation is projected to remain on a gradual upward trend, converging toward the 2% price stability target in the latter half of the projection horizon.
- The next meeting is scheduled for 30 to 31 October 2025.
Next 24 Hours Bias
Medium Bearish
Oil
Key news events today
API crude oil stock (8:30 pm GMT)
What can we expect from Oil today?
Oil markets are dominated by oversupply fears, weak demand, and trade friction, pushing Brent to roughly $60.70 and WTI to $57.20 per barrel. The near‑term outlook remains bearish, with traders awaiting the API crude inventory data later today and upcoming Federal Reserve speeches for fresh demand‑side cues. Trade tensions between the United States and China have re‑emerged after Washington reinstated tariffs on select Chinese imports and imposed sanctions on key commodities.
Next 24 Hours Bias
Medium Bearish
The post IC Markets Asia Fundamental Forecast | 21 October 2025 first appeared on IC Markets | Official Blog.
IC Markets Europe Fundamental Forecast | 21 October 2025
422499 October 21, 2025 14:39 ICMarkets Market News
IC Markets Europe Fundamental Forecast | 21 October 2025
What happened in the Asia session?
The session was marked by optimism over US-China trade relations and key political shifts in Japan, propelling regional equities higher and supporting risk-intensive assets. Currencies generally reflected subdued volatility, while commodities like gold cooled off after recent highs. Equity indices in Japan, South Korea, China, and Hong Kong were among the most measurably impacted as traders responded to the day’s headlines and data releases.
What does it mean for the Europe & US sessions?
Easing U.S.-China trade tensions with diplomatic progress toward face-to-face negotiations, strong Asian market performance led by optimism over reduced geopolitical risks, robust corporate earnings expectations with major companies reporting throughout the week, and near-certainty of Federal Reserve rate cuts supporting risk assets.
The Dollar Index (DXY)
Key news events today
No major news event
What can we expect from DXY today?
The US dollar faces a confluence of negative pressures trading near 98.5 on the DXY index after declining over 12% year-to-date. The 20-day government shutdown has created a critical data vacuum ahead of the Fed’s widely expected October 29 rate cut, while escalating US-China trade tensions and regional banking sector stress compound investor concerns. Most significantly, the dollar appears to be losing its traditional safe-haven status amid fiscal sustainability worries and threats to Federal Reserve independence.
Central Bank Notes:
- The Federal Open Market Committee (FOMC) voted, by majority, to lower the federal funds rate target range by 25 basis points to 4.00%–4.25% at its September 16–17, 2025, meeting, marking the first policy rate adjustment since December 2024 after five consecutive holds.
- The Committee maintained its long-term objective of achieving maximum employment and 2% inflation, acknowledging recent labor market softening and continued tariff-driven price pressures.
- Policymakers expressed elevated concern about downside risks to growth, citing a stalling labor market, modest job creation, and an unemployment rate drifting up toward 4.4%. At the same time, inflation remains above target, with CPI at 3.2% and core inflation at 3.1% as of August 2025; higher energy and food prices, largely attributable to tariffs, continue to weigh on headline measures.
- Although economic activity expanded at a moderate pace in the third quarter, the growth outlook has weakened. Q3 GDP growth is estimated near 1.0% (annualized), with full-year 2025 GDP growth guidance revised to 1.2%, reflecting slowing household consumption and tighter financial conditions.
- In the updated Summary of Economic Projections, the unemployment rate is projected to average 4.5% for the year, with headline PCE inflation revised up slightly to 3.1% for 2025. The Committee anticipates core PCE inflation to remain stubborn, requiring sustained vigilance and a flexible approach to risk management.
- The Committee reiterated its data-dependent approach and openness to further adjustments should employment or inflation deviate meaningfully from current forecasts. Several members dissented, either advocating a larger 50-basis-point cut or preferring no adjustment at this meeting, revealing heightened divergence within the Committee.
- Balance sheet reduction continues at a measured pace. The monthly Treasury redemption cap remains at $5B and the agency MBS cap at $35B, as the Board aims to support orderly market conditions in the face of evolving global and domestic uncertainty
- The next meeting is scheduled for 28 to 29 October 2025.
Next 24 Hours Bias
Medium Bearish
Gold (XAU)
Key news events today
No major news event
What can we expect from Gold today?
Gold consolidated just below record highs as profit-taking tempered the precious metal’s historic rally following Monday’s all-time high of $4,381.21 per ounce. The pullback represents a natural pause after gold’s extraordinary 58-62% year-to-date surge, with the metal remaining firmly supported above $4,300. Record ETF inflows and continued central bank buying provide structural support, while Friday’s delayed September CPI data will be crucial in confirming the Fed’s rate cut trajectory
Next 24 Hours Bias
Strong Bullish
The Euro (EUR)
Key news events today
ECB President Lagarde speaks (11:00 am GMT)
What can we expect from EUR today?
The euro is trading relatively stable near 1.1640 against the dollar as markets digest mixed economic signals. ECB President Lagarde is speaking in Oslo today while continuing to advocate for a stronger global role for the euro amid concerns about US dollar erosion. Eurozone inflation at 2.2% remains slightly above the ECB’s target, while economic growth continues to disappoint at just 0.1% in Q2. The ECB has paused its rate-cutting cycle with rates on hold since June 2025, and further cuts appear increasingly unlikely.
Central Bank Notes:
- The Governing Council kept the three key ECB interest rates unchanged at its meeting on September 11, 2025. The main refinancing rate remains at 2.15%, the marginal lending facility at 2.40%, and the deposit facility at 2.00%. These levels have been maintained after the cuts earlier in 2025, reflecting the Council’s confidence that the current stance is consistent with the price stability mandate.
- Evidence that inflation is running close to the ECB’s medium-term target of 2% supported the decision to hold rates steady. Domestic price pressures are easing as wage growth continues to moderate, and financing conditions remain accommodative. Policymakers reaffirmed a data-dependent, meeting-by-meeting approach to further policy moves, with no pre-commitment to a predetermined path amid ongoing global and domestic risks.
- Eurosystem staff projections foresee headline inflation averaging 2.0% for 2025, 1.8% for 2026, and 2.0% in 2027. The 2025 and 2026 forecasts reflect a downward revision, primarily on lower energy costs and exchange rate effects, even as food inflation remains persistent. Core inflation (excluding energy and food) is expected at 2.0% for 2026 and 2027, with only minor changes since prior rounds.
- Real GDP growth in the euro area is projected at 1.1% for 2025, 1.1% for 2026, and 1.4% for 2027. A robust first quarter—partly due to firms accelerating exports ahead of anticipated tariff hikes—cushioned a weaker outlook for the remainder of 2025. While business investment continues to face uncertainty from ongoing global trade disputes, especially with the US, government investment and infrastructure spending are expected to provide some support to the outlook.
- Rising real incomes and continued strength in the labor market boost household spending. Despite some fading tailwind from previous rate cuts, financing conditions remain broadly favorable and are expected to underpin the resilience of private consumption and investment against outside shocks. Moderating wage growth and profit margin adjustments are helping to absorb residual cost pressures.
- Rising real incomes and continued strength in the labor market boost household spending. Despite some fading tailwind from previous rate cuts, financing conditions remain broadly favorable and are expected to underpin the resilience of private consumption and investment against outside shocks. Moderating wage growth and profit margin adjustments are helping to absorb residual cost pressures.
- All future interest rate decisions will continue to be guided by the integrated assessment of economic and financial data, the inflation outlook, and underlying inflation dynamics, and the effectiveness of monetary policy transmission—without any pre-commitment to a specific future rate path.
- The ECB’s Asset Purchase Program (APP) and Pandemic Emergency Purchase Program (PEPP) portfolios are declining predictably, as maturities have ceased to be reinvested. Balance-sheet normalization continues in line with the ECB’s previously communicated schedule.
- The next meeting is on 29 to 30 October 2025
Next 24 Hours Bias
Medium Bullish
The Swiss Franc (CHF)
Key news events today
No major news event
What can we expect from CHF today?
The Swiss Franc’s strength reflects a confluence of factors: persistent safe-haven demand driven by the US government shutdown, global trade tensions, and financial system concerns; divergent monetary policy trajectories with the SNB maintaining rates at 0% while the Fed signals further cuts; and the franc’s structural advantages as a safe-haven asset. However, this strength comes despite significant domestic economic challenges, with Switzerland facing below-average growth forecasts of 1.3% in 2025 and 0.9% in 2026 due to US tariff impacts on its export-oriented economy.
Central Bank Notes:
- The SNB maintained its key policy rate at 0% during its meeting on 25 September 2025, pausing a sequence of six consecutive rate cuts as inflation stabilized and the Swiss franc remained firm.
- Recent data showed a modest rebound in inflation, with Swiss consumer prices rising 0.2% year-on-year in August after staying above zero for three consecutive months; this helped alleviate fears of deflation that were mounting earlier in the year.
- The conditional inflation forecast remains broadly unchanged from June: headline inflation is expected to average 0.2% in 2025, 0.5% in 2026, and 0.7% in 2027. The risk of a negative rate move has diminished for now, but the SNB retains flexibility should inflationary pressures weaken again.
- The global economic outlook has deteriorated further, weighed down by heightened trade tensions—especially with the U.S.—and ongoing uncertainty in key Swiss export markets.
- Swiss GDP growth moderated in Q2 after a strong Q1 boosted by front-loaded U.S. exports. The SNB expects growth to slow and remain subdued, with forecasted GDP expansion between 1% and 1.5% in both 2025 and 2026.
- Labor market sentiment in the Swiss industrial sector has softened on concerns over export competitiveness and potential adjustments to production, but the overall growth outlook stays broadly unchanged
- The SNB reiterated its readiness to respond as needed if deflation risks re-emerge, emphasizing its commitment to medium-term price stability and a robust, transparent communication policy, with the introduction of more detailed monetary policy minutes beginning in October.
- The next meeting is on 11 December 2025.
Next 24 Hours Bias
Medium Bullish
The Pound (GBP)
Key news events today
No major news event
What can we expect from GBP today?
The Swiss franc remains well-supported on trading near 0.7927 against the US dollar as multiple factors continue to underpin its safe-haven appeal. While easing US-China trade tensions and hopes for a US government shutdown resolution are providing modest support to the dollar, the franc benefits from elevated global uncertainty, concerns over US regional bank stability, and Switzerland’s reputation for fiscal stability.
Central Bank Notes:
- The Bank of England’s Monetary Policy Committee (MPC) voted on 18 September 2025 by a majority (expected split likely 7–2 or 6–3) to hold the Bank Rate steady at 4.00%, following the August rate cut. Most members cited persistent inflation and mixed indicators on growth and employment, while a minority favored further easing due to the cooling labor market and subdued GDP growth.
- The Committee decided to decrease the pace of quantitative tightening, planning to reduce the stock of UK government bond purchases by £67.5 billion over the next 12 months, instead of the prior £100 billion pace, with the gilt balance now standing at nearly £558 billion. This reflects increased volatility in bond markets and a shift to a more gradual approach.
- Headline inflation rose unexpectedly to 3.8% in July and is projected at 4% for September, above the Bank’s 2% target. Price pressures are driven by regulated energy costs and ongoing food price increases. While previous disinflation has been substantial, core inflation remains elevated and sticky.
- The MPC expects headline inflation to remain above target through Q4, with a resumption of the downward trend projected for early 2026 as energy and regulated price pressures abate. The Committee remains watchful for signs of persistent inflation despite previous policy tightening.
- UK GDP growth is stagnant, with business and consumer activity subdued. Recent labor market data show rising unemployment rates (now at 4.7%) and stabilizing wage growth (holding near 5%), indicating slack but continued wage price pressure. The Committee remains cautious amid lackluster demand and soft survey sentiment.
- Pay growth and employment indicators have moderated further, alongside confirmation from business surveys that pay settlements are slowing. The Committee expects wage growth to decelerate significantly through Q4 and the rest of 2025.
- Global uncertainty persists due to volatile energy prices, supply chain disruptions linked to Middle East conflicts, and renewed trade tensions. The MPC remains vigilant in tracking transmission of external cost/wage shocks to UK inflation.
- Risks to inflation are considered two-sided. While subdued domestic growth and softening labor activity suggest scope for easing, persistent inflation requires caution. The MPC anticipates a slow, gradual reduction path in rates, continuing its data-dependent approach with careful adjustment as warranted by economic developments.
- The Committee’s bias remains toward maintaining a restrictive monetary policy stance until firmer evidence emerges that inflation will return sustainably to the 2% target. All future decisions will remain highly data dependent, with a strong emphasis on evolving demand, inflation expectations, costs, and labor market conditions.
- The next meeting is on 6 November 2025.
Next 24 Hours Bias
Weak Bullish
The Canadian Dollar (CAD)
Key news events today
CPI m/m (12:30 pm GMT)
Median CPI y/y (12:30 pm GMT)
Trimmed CPI y/y (12:30 pm GMT)
Common CPI y/y (12:30 pm GMT)
What can we expect from CAD today?
The Canadian dollar faced multiple headwinds including declining oil prices to five-month lows, anticipation of higher inflation data, ongoing US-China trade uncertainty, and the protracted US government shutdown. While the Bank of Canada’s dovish stance and weak business sentiment surveys suggested further rate cuts ahead, the critical September CPI release would determine whether the central bank proceeds with easing at its October 29 meeting.
Central Bank Notes:
- The Council cited continued U.S. tariff volatility and slow progress on trade negotiations as major contributors to ongoing uncertainty. While headline tariffs have not escalated further, the unpredictability of U.S. policy remains a significant risk for Canadian exports and business confidence.
- Uncertainty about U.S. trade policy and recurring tariff threats continued to weigh on growth prospects. The Bank flagged downside risks to the export sector, with survey data indicating ongoing hesitancy among manufacturers and exporters.
- After modest growth in Q1, Canada’s economy slipped into contraction, with GDP shrinking by 0.8% in Q2 and forecast to decrease again by 0.8% in Q3. Economic weakness has been most pronounced in manufacturing and goods-producing sectors affected by trade frictions and softer U.S. demand.
- Early estimates show that growth stabilized in September but remained well below the Bank’s 2% forecast for Q4. Manufacturing output has improved slightly—supported by a modest rebound in petroleum and mining activity—while consumer spending and retail sales were largely flat.
- Consumer spending remained subdued as households continued to limit discretionary purchases amid uncertainty and a slower job market. Housing activity stayed weak, despite earlier government efforts to boost affordability and modest gains in some real estate segments.
- Headline CPI inflation edged up to 1.9% in August, undershooting economist expectations but still showing emerging pressures from shelter and imported goods costs. Core inflation metrics were mixed, though price growth remains just below the Bank’s 2% target.
- The Governing Council reaffirmed its cautious approach, emphasizing that while further rate cuts are possible, the pace will hinge on the path of U.S. tariffs, domestic inflation dynamics, and signs of a sustainable recovery. The Bank remains vigilant against the risk of inflation falling below target in the face of economic slack.
- The next meeting is on 29 October 2025.
Next 24 Hours Bias
Medium Bearish
Oil
Key news events today
API crude oil stock (8:30 pm GMT)
What can we expect from Oil today?
Oil markets face significant headwinds from multiple directions. Prices have declined to five-month lows, with WTI near $57 and Brent around $61 per barrel, as an unprecedented supply glut emerges. The IEA’s projection of a 4 million barrel per day surplus by 2026 driven by OPEC+ production increases, record crude storage at sea, and rising U.S. inventories has fundamentally shifted market dynamics. Demand concerns stemming from U.S.-
Next 24 Hours Bias
Strong Bearish
The post IC Markets Europe Fundamental Forecast | 21 October 2025 first appeared on IC Markets | Official Blog.
Tuesday 21st October 2025: Asian Markets Extend Gains on Fed Rate Cut Hopes and Strong Wall Street Rally
422498 October 21, 2025 14:39 ICMarkets Market News
Global Markets:
- Asian Stock Markets : Nikkei up 0.94%, Shanghai Composite up 1.20%, Hang Seng up 1.67% ASX up 0.76%
- Commodities : Gold at $4,362.11 (0.50%), Silver at $50.298 (-1.00%), Brent Oil at $60.73 (-0.5%), WTI Oil at $56.75 (-0.2%)
- Rates : US 10-year yield at 3.982, UK 10-year yield at 4.5160, Germany 10-year yield at 2.5839
News & Data:
- (EUR) Current Account 11.9B to 22.5B expected
Markets Update:
Asian stock markets are trading mostly higher on Tuesday, following positive cues from Wall Street amid strong expectations of further U.S. Federal Reserve rate cuts, as the labor market shows signs of slowing. The CME FedWatch Tool indicates a 98.9% chance of a quarter-point cut this month and a 96.1% chance of another in December. Reports suggesting the Trump administration is easing some tariffs have also lifted investor sentiment.
In Australia, the S&P/ASX 200 Index is up 0.65% at 9,090.50, supported by mining and technology stocks. BHP and Rio Tinto are gaining nearly 2–3%, while Mineral Resources is up over 4%. Tech stocks like WiseTech Global and Block are advancing, though Zip is down over 3%. Gold miners such as Evolution Mining and Newmont are up sharply. In other news, Alcoa and Arafura Rare Earths surged after a U.S.–Australia deal on critical minerals. The Aussie dollar is trading at $0.652.
Japan’s Nikkei 225 hit a record high near 49,946, gaining 1.5% with strength in exporters and financials. SoftBank, Fast Retailing, and Renesas Electronics led gains.
Across Asia, Hong Kong, Singapore, and South Korea rose 1.3–1.8%. On Wall Street, the Nasdaq jumped 1.4%, the S&P 500 gained 1.1%, and the Dow climbed 515 points, while European indices also advanced
Upcoming Events:
- 12:30 PM GMT – CAD CPI m/m
- 12:30 PM GMT – CAD Median CPI y/y
- 12:30 PM GMT – CAD Trimmed CPI y/y
- 12:30 PM GMT – CAD Common CPI y/y
The post Tuesday 21st October 2025: Asian Markets Extend Gains on Fed Rate Cut Hopes and Strong Wall Street Rally first appeared on IC Markets | Official Blog.