Articles

Thursday 16th October 2025: Asian Markets Advance on Fed Rate Cut Hopes Amid U.S.-China Trade Tensions
422349 October 16, 2025 14:39 ICMarkets Market News
Global Markets:
- Asian Stock Markets : Nikkei up 1.08%, Shanghai Composite up 0.10%, Hang Seng down -0.52% ASX up 0.81%
- Commodities : Gold at $4,248.79 (1.12%), Silver at $52.375 (1.94%), Brent Oil at $62.48 (0.92%), WTI Oil at $58.87 (1.03%)
- Rates : US 10-year yield at 4.027, UK 10-year yield at 4.5480, Germany 10-year yield at 2.5580
News & Data:
- (CAD) Manufacturing Sales m/m -1.0% to -1.5% expected
- (CAD) Wholesale Sales m/m -1.2% to -1.3% expected
Markets Update:
Asian markets traded higher Thursday, following mixed cues from Wall Street overnight and comments from U.S. Fed Chair Jerome Powell that hinted at another potential rate cut as traders weighed the impact of escalating U.S.-China trade friction. Markets had closed mostly higher Wednesday.
Powell warned the slow pass-through of tariffs risks becoming persistent inflation, reinforcing expectations for further easing. With the release of some data postponed amid the U.S. government shutdown, markets are watching remarks from several Fed officials for guidance.
Australia led gains, with the S&P/ASX 200 rising to record territory above 9,050. The index was up about 1.05% at 9,085.20 after touching 9,109.70 earlier, while the All Ordinaries climbed near 9,389.80. Gold miners, energy and financials drove gains, offsetting weakness in technology. Major miners BHP and Rio Tinto were slightly higher; Mineral Resources and Fortescue slipped. Oil and energy stocks were broadly firmer. AMP jumped after a quarterly rise in assets under management.
Japan’s Nikkei 225 extended gains, trading above 48,000 as financials, automakers and tech stocks advanced. SoftBank and select exporters rallied, though some names retreated. Japan reported a monthly fall in core machinery orders, weighing on industrial names.
Elsewhere, South Korea and Taiwan outperformed, and U.S. equities showed volatile swings with the S&P 500 and Nasdaq finishing higher ahead of mixed European trade.
Upcoming Events:
- 04:00 PM GMT – USD Crude Oil Inventories
The post Thursday 16th October 2025: Asian Markets Advance on Fed Rate Cut Hopes Amid U.S.-China Trade Tensions first appeared on IC Markets | Official Blog.
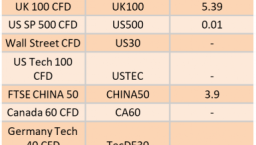
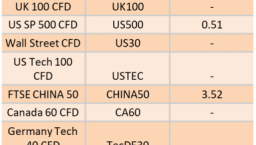
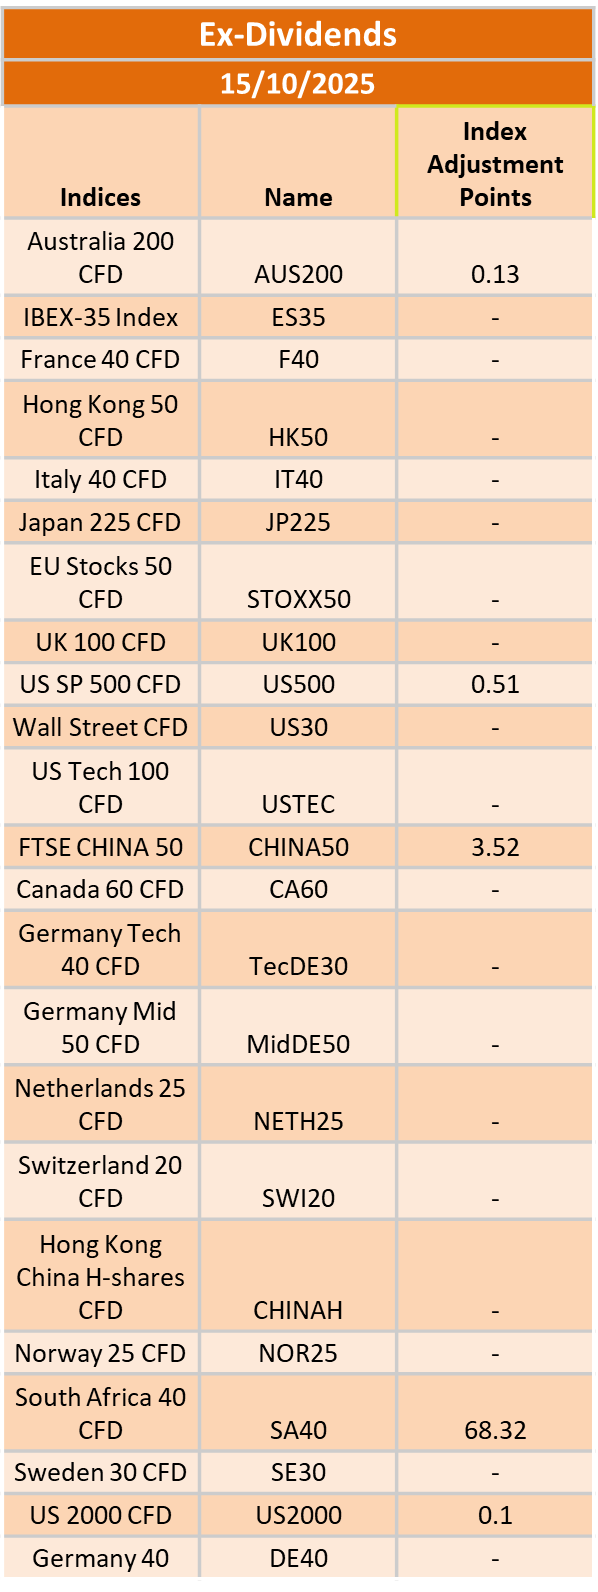
Ex-Dividend 16/10/2025
422314 October 15, 2025 16:39 ICMarkets Market News
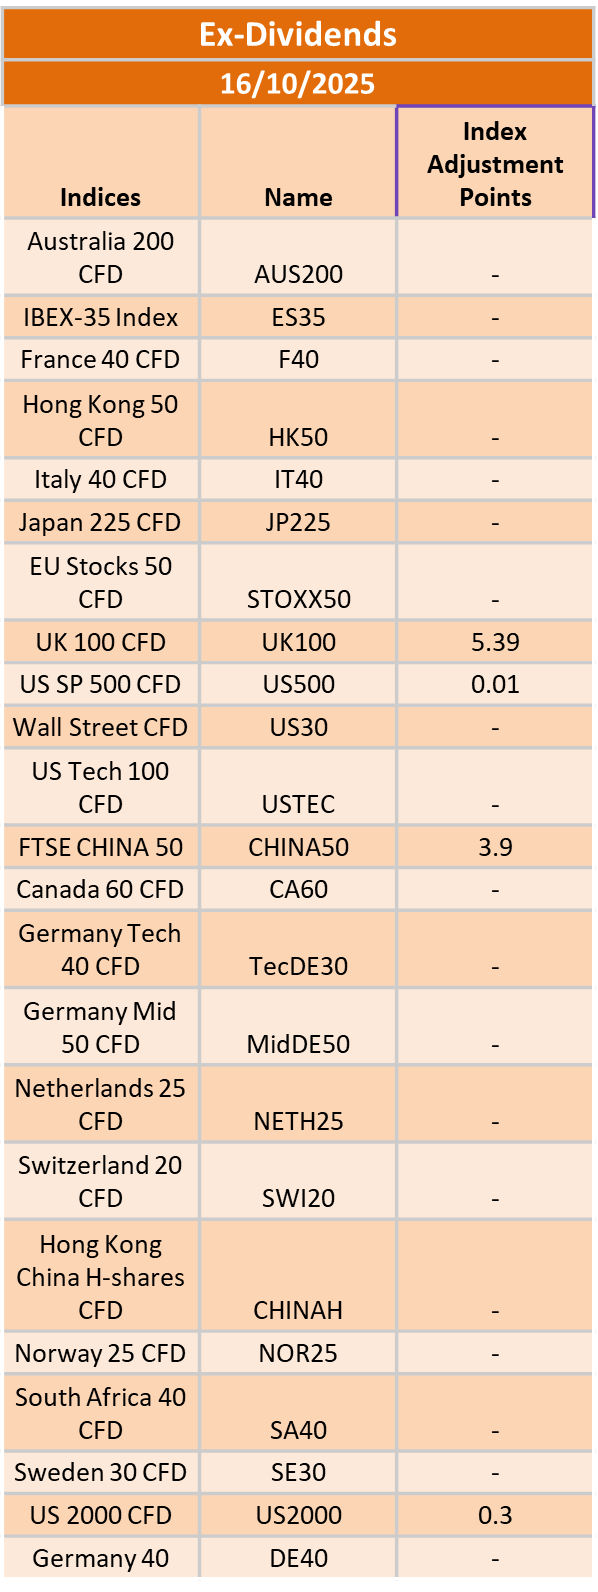
The post Ex-Dividend 16/10/2025 first appeared on IC Markets | Official Blog.
General Market Analysis – 15/10/25
422310 October 15, 2025 15:00 ICMarkets Market News
Stocks Mixed in Volatile Markets – Nasdaq down 0.8%
US stock markets were mixed yesterday. The Dow rallied well after bank earnings beat expectations and Jerome Powell made dovish comments with regard to the jobs market; however, negative updates from the White House on Chinese trade pulled the S&P and Nasdaq lower. The Dow added 0.44% on the day to push up to 46,270, while the S&P fell 0.16% to 6,644 and the Nasdaq dropped 0.76% to 22,521. The dollar ultimately fell after a whippy day’s trading, the DXY down 0.23% to 99.04, while Treasury yields finished close to flat, the 2-year losing 2.1 basis points to move to 3.481%, while the benchmark 10-year did close flat at 4.032%. Oil fell again on the increased China–US trade tensions and an IEA warning on oversupply in the coming year, Brent down 1.71% to $62.24 and WTI down 1.33% to $58.70. Gold hit another record level in choppy trading, ultimately closing up 0.79% at $4,142.92 an ounce.
Oil Contracts Looking Weak Again
Oil prices fell again in trading yesterday as the planets started to align for a bigger trend to the downside for ‘black gold’, while its shiny yellow counterpart continues to drive higher to fresh records on a daily basis. Geopolitical concerns continue to raise demand issues for oil, and they do not seem to be receding, while the supply side of the equation also looks to be conspiring to push prices lower. The International Energy Agency warned of a huge oversupply in 2026 as OPEC+ continue to plan for production increases. WTI dipped under $58 in trading yesterday and is now within touching distance of the annual low just above $55, and a break here could open the way for a move into fresh downside ranges, with the next major support levels down near 2020 lows under $40 a barrel.
Geopolitics and Central Banks in Play Again Today
Geopolitical updates continue to dominate market sentiment this week, and traders are again expecting updates from China and the US to dictate moves in the sessions ahead today. However, there are some key data updates out, and we do hear from some senior central bankers, both of which could add further volatility to the mix. The Asian session will have a strong focus on China again today, not just for any further updates on trade issues, but also because we have key CPI (exp. -0.2% y/y) and PPI (exp. -2.3% y/y) data due out midway through the day. There is nothing of note due out in the European session, but focus will again be on Washington, D.C. later in the day, with central bankers gathering there this week. Fed members Miran, Waller, and Schmid are due to speak today, as well as the MPC’s Breedon and RBA Governor Michele Bullock.
The post General Market Analysis – 15/10/25 first appeared on IC Markets | Official Blog.
Wednesday 15th October 2025: Technical Outlook and Review
422298 October 15, 2025 14:39 ICMarkets Market News
DXY (U.S. Dollar Index):
Potential Direction: Bullish
Overall momentum of the chart: Bearish
The price could make a short-term pullback toward the pivot before rising again toward the 1st resistance
Pivot: 98.76
Supporting reasons: Identified as an overlap support, where renewed buying pressure could emerge to push the price higher.
1st support: 98.00
Supporting reasons: Identified as an overlap support, indicating a potential area where the price could again stabilize.
1st resistance: 99.53
Supporting reasons: Identified as a pullback resistance, indicating a potential area that could halt any further upward movement
EUR/USD:
Potential Direction: Bearish
Overall momentum of the chart: Bullish
The price could see a short-term pullback toward the pivot before continuing its bearish move down toward the 1st support.
Pivot: 1.1618
Supporting reasons: Identified as an overlap resistance, where selling pressures could intensify and potentially cap any upward retracement.
1st support: 1.1471
Supporting reasons: Identified as a pullback support that aligns closely with the 161.8% Fibonacci extension, indicating a potential level where the price could stabilize once again.
1st resistance: 1.1726
Supporting reasons: Identified as an overlap resistance, indicating a potential level that could cap further upward movement.
EUR/JPY:
Potential Direction: Bearish
Overall momentum of the chart: Bullish
The price could see a short-term pullback toward the pivot before continuing its bearish move down toward the 1st support.
Pivot: 176.23
Supporting reasons: Identified as an overlap resistance, where selling pressures could intensify and potentially cap any upward retracement.
1st support: 174.99
Supporting reasons: Identified as an overlap support that aligns with the 50% Fibonacci retracement, indicating a potential area where the price could again stabilize.
1st resistance: 177.75
Supporting reasons: Identified as a resistance that is supported by the 200% Fibonacci extension, indicating a potential level that could cap further upward movement.
EUR/GBP:
Potential Direction: Bullish
Overall momentum of the chart: Bullish
The price could make a short-term pullback toward the pivot before rising again toward the 1st resistance
Pivot: 0.8693
Supporting reasons: Identified as an overlap support, where renewed buying pressure could emerge to push the price higher.
1st support: 0.8657
Supporting reasons: Identified as an overlap support, indicating a potential area where the price could stabilize once more.
1st resistance: 0.8725
Supporting reasons: Identified as an overlap resistance, indicating a potential level that could cap further upward movement.
GBP/USD:
Potential Direction: Bearish
Overall momentum of the chart: Bearish
The price could see a short-term pullback toward the pivot before continuing its bearish move down toward the 1st support.
Pivot: 1.3392
Supporting reasons: Identified as an overlap resistance, where selling pressures could intensify and potentially cap any upward retracement.
1st support: 1.3269
Supporting reasons: Identified as an overlap support, indicating a potential area where the price could stabilize once more.
1st resistance: 1.3513
Supporting reasons: Identified as a swing high resistance, indicating a potential level that could halt further upward movement.
GBP/JPY:
Potential Direction: Bullish
Overall momentum of the chart: Bullish
The price could make a short-term pullback toward the pivot before rising again toward the 1st resistance
Pivot: 202.86
Supporting reasons: Identified as a pullback support, where renewed buying pressure could emerge to push the price higher.
1st support: 201.04
Supporting reasons: Identified as a pullback support, indicating a potential level where the price could stabilize once more.
1st resistance: 204.86
Supporting reasons: Identified as a multi-swing high resistance, indicating a potential level that could halt further upward movement.
USD/CHF:
Potential Direction: Bullish
Overall momentum of the chart: Bullish
The price could make a short-term pullback toward the pivot before rising again toward the 1st resistance
Pivot: 0.7992
Supporting reasons: Identified as a pullback support that aligns with the 61.8% Fibonacci retracement, where renewed buying pressure could emerge to push the price higher.
1st support: 0.7923
Supporting reasons: Identified as an overlap support, indicating a potential area where the price could again stabilize.
1st resistance: 0.8104
Supporting reasons: Identified as a swing high resistance that aligns with the 127.2% Fibonacci extension, indicating a potential level that could cap further upward movement.
USD/JPY:
Potential Direction: Bullish
Overall momentum of the chart: Bullish
The price could make a short-term pullback toward the pivot before rising again toward the 1st resistance
Pivot: 150.91
Supporting reasons: This level is identified as a pullback support and a prior breakout zone. After a strong bullish impulse above this area, a retest could invite renewed buying interest.
1st support: 149.82
Supporting reasons: Identified as a pullback support, indicating a strong area where buyers might return, and the price could stabilize once again.
1st resistance: 153.98
Supporting reasons: Identified as a pullback resistance.This is a significant resistance that could cap further upward movement and coincide with profit-taking zones for bullish positions
USD/CAD:
Potential Direction: Bullish
Overall momentum of the chart: Bearish
The price could fall toward the pivot and make a bullish bounce off toward the 1st resistance.
Pivot: 1.4012
Supporting reasons: Identified as a pullback support, indicating a potential area where buying interest could pick up.
1st support: 1.3919
Supporting reasons: Identified as an overlap support, indicating a key level where the price could stabilize once more.
1st resistance: 1.4156
Supporting reasons: Identified as a pullback resistance that aligns with the 78.6% Fibonacci retracement making it a possible target for bullish advances and a level where some sellers could return to cap gains
AUD/USD:
Potential Direction: Bearish
Overall momentum of the chart: Bullish
The price could see a short-term pullback toward the pivot before continuing its bearish move down toward the 1st support.
Pivot: 0.6509
Supporting reasons: Identified as a pullback zone where any brief bullish recovery could find resistance before resuming the bearish trend.
1st support: 0.6454
Supporting reasons: Identified as a swing low support, this area has provided strong support historically and may attract buying interest for a potential short-term bounce
1st resistance: 0.6585
Supporting reasons: Identified as a pullback resistance, this level could cap upside potential in the current bearish structure.
NZD/USD
Potential Direction: Bearish
Overall momentum of the chart: Bullish
The price could see a short-term pullback toward the pivot before continuing its bearish move down toward the 1st support.
Pivot: 0.5762
Supporting reasons: Identified as a pullback resistance, where selling pressures could intensify and potentially cap any upward retracement.
1st support: 0.5698
Supporting reasons: Identified as a support that is supported by the 161.8% Fibonacci extension, this area has provided strong support historically and may attract buying interest for a potential short-term bounce
1st resistance: 0.5803
Supporting reasons: Identified as an overlap resistance, indicating a potential area that could halt any further upward movement.
US30 (DJIA):
Potential Direction: Bullish
Overall momentum of the chart: Bullish
The price could make a short-term pullback toward the pivot before rising again toward the 1st resistance
Pivot: 46182.48
Supporting reasons: Identified as a pullback support, where renewed buying pressure could emerge to push the price higher.
1st support: 45,239.96
Supporting reasons: Identified as an overlap support, suggesting a potential area where the price could stabilize once again.
1st resistance: 46,854.31
Supporting reasons: Identified as a multi-swing high resistance, indicating a potential area that could halt any further upward movement.
DE40 (DAX):
Potential Direction: Bearish
Overall momentum of the chart: Bullish
The price could see a short-term pullback toward the pivot before continuing its bearish move down toward the 1st support.
Pivot: 24,511.06
Supporting reasons: Identified as a pullback resistance, where selling pressures could intensify and potentially cap any upward retracement.
1st support: 24,080.53
Supporting reasons: Identified as a pullback support that aligns with the 50% Fibonacci retracement, indicating a key level where the price could stabilize once more.
1st resistance: 24,771.19
Supporting reasons: Identified as a swing high resistance, indicating a potential area that could halt any further upward movement.
US500 (S&P 500):
Potential Direction: Bearish
Overall momentum of the chart: Bullish
The price could see a short-term pullback toward the pivot before continuing its bearish move down toward the 1st support.
Pivot: 6,697.28
Supporting reasons: Identified as a pullback resistance, where selling pressures could intensify and potentially cap any upward retracement.
1st support: 6,520.61
Supporting reasons: Identified as an overlap support, indicating a potential level where the price could stabilize once again.
1st resistance: 6,760.21
Supporting reasons: Identified as a multi-swing high resistance, indicating a potential area that could halt any further upward movement.
BTC/USD (Bitcoin):
Potential Direction: Bearish
Overall momentum of the chart: Bullish
The price could see a short-term pullback toward the pivot before continuing its bearish move down toward the 1st support.
Pivot: 115,113.31
Supporting reasons: Identified as a pullback resistance that aligns with the 50% Fibonacci retracement,, where selling pressures could intensify and potentially cap any upward retracement.
1st support: 110,041.57
Supporting reasons: Identified as a pullback support, indicating a potential level where the price could stabilize once more.
1st resistance: 119,828.44
Supporting reasons: Identified as a pullback resistance that aligns with the 61.8% Fibonacci retracement, indicating a potential area that could halt any further upward movement.
ETH/USD (Ethereum):
Potential Direction: Bearish
Overall momentum of the chart: Bullish
The price could see a short-term pullback toward the pivot before continuing its bearish move down toward the 1st support.
Pivot: 4,372.65
Supporting reasons: Identified as a pullback resistance that aligns with the 61.8% Fibonacci retracement, where selling pressures could intensify and potentially cap any upward retracement.
1st support: 3,894.07
Supporting reasons: Identified as an overlap support, indicating a potential level where the price could stabilize once more.
1st resistance: 4,642.75
Supporting reasons: Identified as a pullback resistance, indicating a potential area that could halt any further upward movement.
WTI/USD (Oil):
Potential Direction: Bearish
Overall momentum of the chart: Bullish
The price could see a short-term pullback toward the pivot before continuing its bearish move down toward the 1st support.
Pivot: 60.61
Supporting reasons: Identified as a pullback resistance, where selling pressures could intensify and potentially cap any upward retracement.
1st support: 58.39
Supporting reasons: Identified as a swing low support that aligns with the 78.6% Fibonacci projection, indicating a key level where the price could stabilize once more.
1st resistance: 63.15
Supporting reasons: Identified as a pullback resistance, indicating a potential area that could halt any further upward movement.
XAU/USD (GOLD):
Potential Direction: Bullish
Overall momentum of the chart: Bullish
The price could fall toward the pivot and make a bullish rise toward the 1st resistance.
Pivot: 4,055.24
Supporting reasons: Identified as a pullback support, indicating a potential area where buying interest could pick up.
1st support: 3,953.04
Supporting reasons: Identified as a swing low support, indicating a key level where the price could stabilize once more.
1st resistance: 4,170.76
Supporting reasons: Identified as a resistancethat is supported by the 200% Fibonacci extension and the 100% Fibonacci projection, indicating a potential area that could halt any further upward movement.
The accuracy, completeness and timeliness of the information contained on this site cannot be guaranteed. IC Markets does not warranty, guarantee or make any representations, or assume any liability regarding financial results based on the use of the information in the site.
News, views, opinions, recommendations and other information obtained from sources outside of www.icmarkets.com, used in this site are believed to be reliable, but we cannot guarantee their accuracy or completeness. All such information is subject to change at any time without notice. IC Markets assumes no responsibility for the content of any linked site.
The fact that such links may exist does not indicate approval or endorsement of any material contained on any linked site. IC Markets is not liable for any harm caused by the transmission, through accessing the services or information on this site, of a computer virus, or other computer code or programming device that might be used to access, delete, damage, disable, disrupt or otherwise impede in any manner, the operation of the site or of any user’s software, hardware, data or property.
The post Wednesday 15th October 2025: Technical Outlook and Review first appeared on IC Markets | Official Blog.
IC Markets Asia Fundamental Forecast | 15 October 2025
422297 October 15, 2025 14:39 ICMarkets Market News
IC Markets Asia Fundamental Forecast | 15 October 2025
What happened in the U.S. session?
The US session was dominated by three major themes: disappointing small business sentiment data and dovish Federal Reserve commentary reinforcing rate cut expectations; strong but complex bank earnings that drove divergent stock reactions; and escalating US-China trade tensions that triggered safe-haven flows into gold and Treasuries while pressuring equities, oil, and cryptocurrencies
What does it mean for the Asia Session?
Wednesday’s Asian session centers on critical Chinese economic data that will indicate whether Beijing’s stimulus measures are gaining traction, alongside ongoing US-China trade negotiations that remain fluid despite recent conciliatory rhetoric. The RBA Governor’s speech will provide insights into Australia’s monetary policy trajectory, while elevated gold prices reflect persistent safe-haven demand.
The Dollar Index (DXY)
Key news events today
Empire State Manufacturing Index (12:30 pm GMT)
What can we expect from DXY today?
The dollar faces a complex path forward, with near-term support from political instability abroad offset by Fed rate cuts, trade war risks, and government shutdown impacts. Most analysts expect the dollar to remain range-bound with a mild bearish bias through year-end unless significant safe-haven demand materializes or trade negotiations break down completely.
Central Bank Notes:
- The Federal Open Market Committee (FOMC) voted, by majority, to lower the federal funds rate target range by 25 basis points to 4.00%–4.25% at its September 16–17, 2025, meeting, marking the first policy rate adjustment since December 2024 after five consecutive holds.
- The Committee maintained its long-term objective of achieving maximum employment and 2% inflation, acknowledging recent labor market softening and continued tariff-driven price pressures.
- Policymakers expressed elevated concern about downside risks to growth, citing a stalling labor market, modest job creation, and an unemployment rate drifting up toward 4.4%. At the same time, inflation remains above target, with CPI at 3.2% and core inflation at 3.1% as of August 2025; higher energy and food prices, largely attributable to tariffs, continue to weigh on headline measures.
- Although economic activity expanded at a moderate pace in the third quarter, the growth outlook has weakened. Q3 GDP growth is estimated near 1.0% (annualized), with full-year 2025 GDP growth guidance revised to 1.2%, reflecting slowing household consumption and tighter financial conditions.
- In the updated Summary of Economic Projections, the unemployment rate is projected to average 4.5% for the year, with headline PCE inflation revised up slightly to 3.1% for 2025. The Committee anticipates core PCE inflation to remain stubborn, requiring sustained vigilance and a flexible approach to risk management.
- The Committee reiterated its data-dependent approach and openness to further adjustments should employment or inflation deviate meaningfully from current forecasts. Several members dissented, either advocating a larger 50-basis-point cut or preferring no adjustment at this meeting, revealing heightened divergence within the Committee.
- Balance sheet reduction continues at a measured pace. The monthly Treasury redemption cap remains at $5B and the agency MBS cap at $35B, as the Board aims to support orderly market conditions in the face of evolving global and domestic uncertainty.
- The next meeting is scheduled for 28 to 29 October 2025.
Next 24 Hours Bias
Medium Bullish
Gold (XAU)
Key news events today
Empire State Manufacturing Index (12:30 pm GMT)
What can we expect from Gold today?
Gold’s unprecedented rally to above $4,100 per ounce reflects a convergence of powerful forces: escalating US-China trade tensions, expectations for Federal Reserve rate cuts totaling 50 basis points by year-end, a prolonged US government shutdown, record-breaking central bank accumulation, and historic ETF inflows. While technical indicators flash extreme overbought warnings suggesting potential near-term volatility, the structural drivers, including de-dollarization trends, inflation hedging demand, and supply constraints, position gold for continued strength.
Next 24 Hours Bias
Strong Bullish
The Australian Dollar (AUD)
Key news events today
RBA Gov Bullock speaks (7:45 pm GMT)
What can we expect from AUD today?
The Australian dollar is experiencing significant weakness driven by intensifying US-China trade tensions that directly threaten Australia’s economic outlook, given China’s status as its largest trading partner. The AUD/USD pair has fallen to one-month lows around 0.6440-0.6488, with the critical 200-day moving average near 0.6420 representing the last major technical support level.
Central Bank Notes:
- The RBA held its cash rate steady at 3.60% at its October meeting on 29–30 September 2025, marking a second consecutive pause after August’s 25 basis point cut. The move affirms the Bank’s data-dependent approach as inflation trends within the target range.
- Inflation indicators remained stable through September, with headline CPI likely anchoring near 2.2%—comfortably within the 2–3% band. Insurance and housing costs remain sticky but are increasingly offset by moderation in discretionary goods.
- Trimmed mean inflation is estimated at around 2.8%, signaling underlying pressures remain contained. The Board continues to flag food and energy price volatility as short-term risks, though the broader disinflation narrative holds.
- Global conditions remain a source of uncertainty. U.S. policy expectations and uneven growth in China continue to weigh on commodities, even as trade disruptions have eased marginally since mid-year.
- Domestic growth shows resilience in the housing and services sectors, though manufacturing remains subdued. Household incomes have stabilized, but consumption remains only modest, capped by high borrowing costs.
- The labor market maintains relative tightness, though job growth has slowed notably since the first half of the year. Underutilization has ticked higher, but overall employment conditions remain supportive.
- Wage growth is plateauing, reflecting softer labor demand. Weak productivity continues to keep unit labor costs elevated, underscoring a medium-term concern highlighted repeatedly by the RBA.
- Household consumption prospects remain fragile. The combination of high rents and weak discretionary appetite suggests risks of a consumer-led slowdown in Q4 if confidence fails to rebound.
- The Board reiterated that subdued household spending poses risks to business sentiment and may dampen investment and job creation in the coming quarters.
- Monetary policy remains mildly restrictive. The RBA balanced confidence in inflation progress with caution around global and domestic demand risks, keeping further adjustments conditional on incoming data.
- The Bank reaffirmed its dual commitment to price stability and full employment, noting its readiness to act should conditions shift markedly.
- The next meeting is on 5 to 6 November 2025.
Next 24 Hours Bias
Weak Bearish
The Kiwi Dollar (NZD)
Key news events today
No major news event
What can we expect from NZD today?
The New Zealand Dollar faces a perfect storm of negative factors. The RBNZ’s aggressive easing cycle, with further cuts anticipated, renewed US-China trade tensions threatening New Zealand’s export-dependent economy, weak domestic economic data showing contraction across multiple quarters, and declining dairy prices undermining a key export sector. With the currency trading near six-month lows around 0.5700 against the USD, market participants remain cautious ahead of potential further weakness, particularly if the RBNZ follows through with another rate cut in November and trade tensions continue to escalate.
Central Bank Notes:
- The Monetary Policy Committee (MPC) agreed to cut the Official Cash Rate (OCR) by 25 basis points to 3.00% on 20 August 2025, marking a three-year low and continuing the easing cycle after July’s pause. The vote was split 4-2, with two members advocating a 50-basis-point cut, highlighting diverging views within the Committee.
- Policymakers indicated that significant uncertainty and a stalling economic recovery prompted this move, leaving the door open for further rate cuts later in the year, with a possible trough around 2.5% by December.
- Annual consumer price index inflation rose to 2.7% in the June quarter and is expected to reach 3% for the September quarter—at the upper end of the MPC’s 1 to 3% target band—but medium-term expectations remain anchored near the 2% midpoint.
- Despite the near-term uptick, headline inflation is projected to return toward 2% by mid-2026, as tradables inflation pressures ease and significant spare capacity continues to dampen domestic price momentum.
- Domestic financial conditions are broadly aligning with MPC expectations, as lower wholesale rates have translated into reduced borrowing costs for households. However, declining consumption and investment demand, higher unemployment, and subdued wage growth reflect ongoing economic slack.
- GDP growth stalled in the second quarter of 2025, contrasting with earlier projections. High-frequency indicators point to continued weakness driven by rising prices for essentials, weakening household savings, and constrained business lending.
- The MPC cautioned that ongoing global tariff uncertainties and policy shifts, especially recent changes in US trade regulations, could amplify market volatility and present both upside and downside risks to New Zealand’s recovery.
- Subject to medium-term inflation pressures continuing to ease as projected, the MPC signaled scope for further OCR cuts, possibly down to 2.5% by year-end, consistent with the latest Monetary Policy Statement outlook.
- The next meeting is on 22 October 2025.
Next 24 Hours Bias
Medium Bearish
The Japanese Yen (JPY)
Key news events today
No major news event
What can we expect from JPY today?
The Japanese yen remains under significant pressure heading into October 15, 2025, caught between multiple conflicting forces. The collapse of the ruling coalition has paradoxically provided some support to the currency by undermining expectations for aggressive fiscal stimulus, while simultaneously creating political uncertainty that typically weighs on a country’s currency.
Central Bank Notes:
- The Policy Board of the Bank of Japan decided on 17 September, by a unanimous vote, to set the following guidelines for money market operations for the inter-meeting period:
- The Bank will encourage the uncollateralized overnight call rate to remain at around 0.5%.
- The BOJ will continue its gradual reduction of monthly outright purchases of Japanese Government Bonds (JGBs). The scheduled amount of long-term government bond purchases remains unchanged from the prior decision, with a quarterly reduction pace of about ¥400 billion through March 2026 and about ¥200 billion per quarter from April to June 2026 onward, aiming for a purchase level near ¥2 trillion in January to March 2027.
- Japan’s economy continues to show a moderate recovery, with household consumption supported by rising incomes, although corporate activity has softened somewhat. Overseas economies remain on a moderate growth path, with the impact of global trade policies still weighing on Japan’s export and industrial production outlook.
- On the price front, the year-on-year rate of change in consumer prices (excluding fresh food) remains in the mid-3% range. Inflationary pressures remain broad-based, with persistent cost-push factors in food and energy, alongside solid wage pass-through. However, input cost pressures from past import surges are showing early signs of easing.
- Short-term inflation momentum may moderate as cost-push effects diminish, though rent increases and service-related price gains tied to labor shortages are likely to provide support. Inflation expectations among firms and households continue a gradual upward drift.
- Looking ahead, the economy is projected to grow at a slower-than-trend pace in the near term due to external demand softness and cautious corporate investment plans. However, accommodative financial conditions and steady increases in real labor income are expected to underpin domestic demand.
- In the medium term, as overseas economies recover and global trade stabilizes, Japan’s growth potential is likely to improve. With persistent labor market tightness and rising medium- to long-term inflation expectations, core inflation is projected to remain on a gradual upward trend, converging toward the 2% price stability target in the latter half of the projection horizon.
- The next meeting is scheduled for 30 to 31 October 2025.
Next 24 Hours Bias
Weak Bullish
Oil
Key news events today
EIA crude oil inventories (2:30 pm GMT)
What can we expect from Oil today?
Oil markets face substantial headwinds entering the fourth quarter of 2025, with prices at five-month lows amid converging bearish factors: escalating U.S.-China trade tensions threatening demand, OPEC+ production increases adding supply, and major forecasters predicting record surpluses in 2026. While China’s strategic stockpiling and potential U.S. shale slowdowns at current prices may provide some support, the near-term outlook remains decidedly bearish.
Next 24 Hours Bias
Medium Bearish
The post IC Markets Asia Fundamental Forecast | 15 October 2025 first appeared on IC Markets | Official Blog.
Wednesday 15th October 2025: Asian Markets Gain on Fed Rate Cut Hopes, Despite Renewed U.S.-China Trade Tensions
422294 October 15, 2025 14:14 ICMarkets Market News
Global Markets:
- Asian Stock Markets : Nikkei up 1.16%, Shanghai Composite up 0.10%, Hang Seng up 1.20% ASX up 0.81%
- Commodities : Gold at $4,205.06 (1.00%), Silver at $51.160 (1.06%), Brent Oil at $61.15 (-0.38%), WTI Oil at $58.51 (-0.32%)
- Rates : US 10-year yield at 4.013, UK 10-year yield at 4.5870, Germany 10-year yield at 2.6071
News & Data:
- (CAD) Building Permits m/m -1.2% to -0.7% expected
Markets Update:
Asian stock markets are trading mostly higher on Wednesday, following mixed cues from Wall Street overnight, as optimism about further interest rate cuts continues after U.S. Federal Reserve Chair Jerome Powell signaled two more quarter-point cuts this year, citing slower job growth. However, renewed U.S.-China trade tensions are weighing on sentiment. On Tuesday, Powell warned there was “no risk-free path” in balancing employment and inflation goals. Meanwhile, U.S. President Donald Trump accused China of being “economically hostile” by halting U.S. soybean purchases and hinted at further trade restrictions. China responded, accusing the U.S. of harmful measures undermining bilateral trade talks.
Australian shares are trading significantly higher, extending gains from the previous session. The S&P/ASX 200 is up 73.30 points or 0.82 percent to 8,972.70, led by miners and financials, while energy stocks are weak. Major miners BHP, Fortescue, and Rio Tinto are up around 0.5 percent each. Commonwealth Bank and Westpac are gaining nearly 2 percent.
Japan’s Nikkei 225 is also surging, up 1.31 percent to 47,463.31, supported by tech and export stocks. SoftBank gained 3 percent, while Advantest and Screen Holdings advanced nearly 4 percent.
Elsewhere in Asia, Hong Kong and South Korea are up 1.6 percent each, while other regional markets post smaller gains. On Wall Street, stocks ended mixed amid late-session volatility, and crude oil prices declined over 1 percent to $58.79 per barrel.
Upcoming Events:
- 12:30 PM GMT – CAD Manufacturing Sales m/m
- 12:30 PM GMT – CAD Wholesale Sales m/m
The post Wednesday 15th October 2025: Asian Markets Gain on Fed Rate Cut Hopes, Despite Renewed U.S.-China Trade Tensions first appeared on IC Markets | Official Blog.
IC Markets Europe Fundamental Forecast | 15 October 2025
422293 October 15, 2025 14:14 ICMarkets Market News
IC Markets Europe Fundamental Forecast | 15 October 2025
What happened in the Asia session?
Asian markets were mostly driven by weak Chinese inflation data, Fed rate cut expectations, and fluctuating trade tensions, with equities, FX, and commodities showing pronounced volatility in response to these developments. The U.S. dollar was under pressure as market participants increased bets on a Federal Reserve rate cut following dovish comments from Fed Chair Powell, bolstering Asian stocks early in the session.
What does it mean for the Europe & US sessions?
Monitor China’s economic data for indications of stabilization or further deflationary pressure, as this will influence overall Asian market sentiment. Key central bank speeches, particularly from the Federal Reserve and the Reserve Bank of Australia, may trigger volatility across FX and equity markets. U.S. financial sector earnings are expected to set the tone for risk appetite today. Meanwhile, heightened trade tensions and potential geopolitical escalations keep both risk assets and safe havens in focus. Oil, equities, and Bitcoin remain highly sensitive to macroeconomic headlines and central bank communications throughout the day.
The Dollar Index (DXY)
Key news events today
Empire State Manufacturing Index (12:30 pm GMT)
What can we expect from DXY today?
The dollar edged lower, driven by expectations for Fed rate cuts, government shutdown worries, and trade tensions with China. The dollar’s strength earlier in the month moderated, with risk-sensitive currencies and safe havens showing mixed performance. Analysts expect further weakness for the dollar if economic and policy risks do not subside.
Central Bank Notes:
- The Federal Open Market Committee (FOMC) voted, by majority, to lower the federal funds rate target range by 25 basis points to 4.00%–4.25% at its September 16–17, 2025, meeting, marking the first policy rate adjustment since December 2024 after five consecutive holds.
- The Committee maintained its long-term objective of achieving maximum employment and 2% inflation, acknowledging recent labor market softening and continued tariff-driven price pressures.
- Policymakers expressed elevated concern about downside risks to growth, citing a stalling labor market, modest job creation, and an unemployment rate drifting up toward 4.4%. At the same time, inflation remains above target, with CPI at 3.2% and core inflation at 3.1% as of August 2025; higher energy and food prices, largely attributable to tariffs, continue to weigh on headline measures.
- Although economic activity expanded at a moderate pace in the third quarter, the growth outlook has weakened. Q3 GDP growth is estimated near 1.0% (annualized), with full-year 2025 GDP growth guidance revised to 1.2%, reflecting slowing household consumption and tighter financial conditions.
- In the updated Summary of Economic Projections, the unemployment rate is projected to average 4.5% for the year, with headline PCE inflation revised up slightly to 3.1% for 2025. The Committee anticipates core PCE inflation to remain stubborn, requiring sustained vigilance and a flexible approach to risk management.
- The Committee reiterated its data-dependent approach and openness to further adjustments should employment or inflation deviate meaningfully from current forecasts. Several members dissented, either advocating a larger 50-basis-point cut or preferring no adjustment at this meeting, revealing heightened divergence within the Committee.
- Balance sheet reduction continues at a measured pace. The monthly Treasury redemption cap remains at $5B and the agency MBS cap at $35B, as the Board aims to support orderly market conditions in the face of evolving global and domestic uncertainty
- The next meeting is scheduled for 28 to 29 October 2025.
Next 24 Hours Bias
Medium Bullish
Gold (XAU)
Key news events today
Empire State Manufacturing Index (12:30 pm GMT)
What can we expect from Gold today?
Gold’s uptrend is expected to continue as markets digest global policy risks and central banks reassess reserve strategies. However, traders should stay alert for near-term pullbacks as profit-taking increases around historic highs. The rally is fueled by a flight to safe-haven assets, particularly following the US announcement of 100% tariffs on Chinese imports, with both countries imposing new port fees and trade restrictions
Next 24 Hours Bias
Strong Bullish
The Euro (EUR)
Key news events today
No major news event
What can we expect from EUR today?
The euro faces a challenging environment on Wednesday, October 15, caught between domestic political instability in France, modest growth prospects, and external risks from US-China trade tensions. While ECB officials maintain the disinflation process is complete with inflation around the 2% target, they signal readiness for further policy adjustments if conditions deteriorate. The immediate focus shifts to eurozone industrial production data due Wednesday morning, which could provide critical signals about manufacturing sector health.
Central Bank Notes:
- The Governing Council kept the three key ECB interest rates unchanged at its meeting on September 11, 2025. The main refinancing rate remains at 2.15%, the marginal lending facility at 2.40%, and the deposit facility at 2.00%. These levels have been maintained after the cuts earlier in 2025, reflecting the Council’s confidence that the current stance is consistent with the price stability mandate.
- Evidence that inflation is running close to the ECB’s medium-term target of 2% supported the decision to hold rates steady. Domestic price pressures are easing as wage growth continues to moderate, and financing conditions remain accommodative. Policymakers reaffirmed a data-dependent, meeting-by-meeting approach to further policy moves, with no pre-commitment to a predetermined path amid ongoing global and domestic risks.
- Eurosystem staff projections foresee headline inflation averaging 2.0% for 2025, 1.8% for 2026, and 2.0% in 2027. The 2025 and 2026 forecasts reflect a downward revision, primarily on lower energy costs and exchange rate effects, even as food inflation remains persistent. Core inflation (excluding energy and food) is expected at 2.0% for 2026 and 2027, with only minor changes since prior rounds.
- Real GDP growth in the euro area is projected at 1.1% for 2025, 1.1% for 2026, and 1.4% for 2027. A robust first quarter—partly due to firms accelerating exports ahead of anticipated tariff hikes—cushioned a weaker outlook for the remainder of 2025. While business investment continues to face uncertainty from ongoing global trade disputes, especially with the US, government investment and infrastructure spending are expected to provide some support to the outlook.
- Rising real incomes and continued strength in the labor market boost household spending. Despite some fading tailwind from previous rate cuts, financing conditions remain broadly favorable and are expected to underpin the resilience of private consumption and investment against outside shocks. Moderating wage growth and profit margin adjustments are helping to absorb residual cost pressures.
- Rising real incomes and continued strength in the labor market boost household spending. Despite some fading tailwind from previous rate cuts, financing conditions remain broadly favorable and are expected to underpin the resilience of private consumption and investment against outside shocks. Moderating wage growth and profit margin adjustments are helping to absorb residual cost pressures.
- All future interest rate decisions will continue to be guided by the integrated assessment of economic and financial data, the inflation outlook, and underlying inflation dynamics, and the effectiveness of monetary policy transmission—without any pre-commitment to a specific future rate path.
- The ECB’s Asset Purchase Program (APP) and Pandemic Emergency Purchase Program (PEPP) portfolios are declining predictably, as maturities have ceased to be reinvested. Balance-sheet normalization continues in line with the ECB’s previously communicated schedule.
- The next meeting is on 29 to 30 October 2025
Next 24 Hours Bias
Medium Bearish
The Swiss Franc (CHF)
Key news events today
No major news event
What can we expect from CHF today?
CHF strength is fueled by continuing risk aversion, weak global sentiment, and steady Swiss disinflation. The SNB is widely seen as likely to cut rates before year-end if deflation persists. Legal questions after the Credit Suisse bond ruling present fresh uncertainty for Swiss finance. Technical analysts see near-term resistance just above 0.80 USD/CHF, and potential for volatility in the coming weeks. The Swiss Franc remains a favored haven for investors during market stress, but faces mixed prospects amid domestic and global developments.
Central Bank Notes:
- The SNB maintained its key policy rate at 0% during its meeting on 25 September 2025, pausing a sequence of six consecutive rate cuts as inflation stabilized and the Swiss franc remained firm.
- Recent data showed a modest rebound in inflation, with Swiss consumer prices rising 0.2% year-on-year in August after staying above zero for three consecutive months; this helped alleviate fears of deflation that were mounting earlier in the year.
- The conditional inflation forecast remains broadly unchanged from June: headline inflation is expected to average 0.2% in 2025, 0.5% in 2026, and 0.7% in 2027. The risk of a negative rate move has diminished for now, but the SNB retains flexibility should inflationary pressures weaken again.
- The global economic outlook has deteriorated further, weighed down by heightened trade tensions—especially with the U.S.—and ongoing uncertainty in key Swiss export markets.
- Swiss GDP growth moderated in Q2 after a strong Q1 boosted by front-loaded U.S. exports. The SNB expects growth to slow and remain subdued, with forecasted GDP expansion between 1% and 1.5% in both 2025 and 2026.
- Labor market sentiment in the Swiss industrial sector has softened on concerns over export competitiveness and potential adjustments to production, but the overall growth outlook stays broadly unchanged
- The SNB reiterated its readiness to respond as needed if deflation risks re-emerge, emphasizing its commitment to medium-term price stability and a robust, transparent communication policy, with the introduction of more detailed monetary policy minutes beginning in October.
- The next meeting is on 11 December 2025.
Next 24 Hours Bias
Weak Bearish
The Pound (GBP)
Key news events today
No major news event
What can we expect from GBP today?
The British pound faces significant headwinds entering mid-October 2025, with the currency trading near two-month lows around $1.33 following disappointing labor market data that showed rising unemployment and slowing wage growth. The weaker jobs report has intensified speculation about additional Bank of England rate cuts, though markets expect any easing to be delayed until spring 2026. Meanwhile, persistently high inflation at 3.8% the highest among G7 nations, complicates the BoE’s policy path.
Central Bank Notes:
- The Bank of England’s Monetary Policy Committee (MPC) voted on 18 September 2025 by a majority (expected split likely 7–2 or 6–3) to hold the Bank Rate steady at 4.00%, following the August rate cut. Most members cited persistent inflation and mixed indicators on growth and employment, while a minority favored further easing due to the cooling labor market and subdued GDP growth.
- The Committee decided to decrease the pace of quantitative tightening, planning to reduce the stock of UK government bond purchases by £67.5 billion over the next 12 months, instead of the prior £100 billion pace, with the gilt balance now standing at nearly £558 billion. This reflects increased volatility in bond markets and a shift to a more gradual approach.
- Headline inflation rose unexpectedly to 3.8% in July and is projected at 4% for September, above the Bank’s 2% target. Price pressures are driven by regulated energy costs and ongoing food price increases. While previous disinflation has been substantial, core inflation remains elevated and sticky.
- The MPC expects headline inflation to remain above target through Q4, with a resumption of the downward trend projected for early 2026 as energy and regulated price pressures abate. The Committee remains watchful for signs of persistent inflation despite previous policy tightening.
- UK GDP growth is stagnant, with business and consumer activity subdued. Recent labor market data show rising unemployment rates (now at 4.7%) and stabilizing wage growth (holding near 5%), indicating slack but continued wage price pressure. The Committee remains cautious amid lackluster demand and soft survey sentiment.
- Pay growth and employment indicators have moderated further, alongside confirmation from business surveys that pay settlements are slowing. The Committee expects wage growth to decelerate significantly through Q4 and the rest of 2025.
- Global uncertainty persists due to volatile energy prices, supply chain disruptions linked to Middle East conflicts, and renewed trade tensions. The MPC remains vigilant in tracking transmission of external cost/wage shocks to UK inflation.
- Risks to inflation are considered two-sided. While subdued domestic growth and softening labor activity suggest scope for easing, persistent inflation requires caution. The MPC anticipates a slow, gradual reduction path in rates, continuing its data-dependent approach with careful adjustment as warranted by economic developments.
- The Committee’s bias remains toward maintaining a restrictive monetary policy stance until firmer evidence emerges that inflation will return sustainably to the 2% target. All future decisions will remain highly data dependent, with a strong emphasis on evolving demand, inflation expectations, costs, and labor market conditions.
- The next meeting is on 6 November 2025.
Next 24 Hours Bias
Medium Bearish
The Canadian Dollar (CAD)
Key news events today
No major news event
What can we expect from CAD today?
The Canadian dollar faces multiple headwinds trading near six-month lows against the U.S. dollar. Collapsing oil prices, ongoing U.S.-Canada trade tensions, and a struggling domestic economy continue to pressure the loonie. While stronger-than-expected September employment data reduced expectations for an October rate cut by the Bank of Canada, underlying labor market weakness persists.
Central Bank Notes:
- The Council cited continued U.S. tariff volatility and slow progress on trade negotiations as major contributors to ongoing uncertainty. While headline tariffs have not escalated further, the unpredictability of U.S. policy remains a significant risk for Canadian exports and business confidence.
- Uncertainty about U.S. trade policy and recurring tariff threats continued to weigh on growth prospects. The Bank flagged downside risks to the export sector, with survey data indicating ongoing hesitancy among manufacturers and exporters.
- After modest growth in Q1, Canada’s economy slipped into contraction, with GDP shrinking by 0.8% in Q2 and forecast to decrease again by 0.8% in Q3. Economic weakness has been most pronounced in manufacturing and goods-producing sectors affected by trade frictions and softer U.S. demand.
- Early estimates show that growth stabilized in September but remained well below the Bank’s 2% forecast for Q4. Manufacturing output has improved slightly—supported by a modest rebound in petroleum and mining activity—while consumer spending and retail sales were largely flat.
- Consumer spending remained subdued as households continued to limit discretionary purchases amid uncertainty and a slower job market. Housing activity stayed weak, despite earlier government efforts to boost affordability and modest gains in some real estate segments.
- Headline CPI inflation edged up to 1.9% in August, undershooting economist expectations but still showing emerging pressures from shelter and imported goods costs. Core inflation metrics were mixed, though price growth remains just below the Bank’s 2% target.
- The Governing Council reaffirmed its cautious approach, emphasizing that while further rate cuts are possible, the pace will hinge on the path of U.S. tariffs, domestic inflation dynamics, and signs of a sustainable recovery. The Bank remains vigilant against the risk of inflation falling below target in the face of economic slack.
- The next meeting is on 29 October 2025.
Next 24 Hours Bias
Medium Bearish
Oil
Key news events today
EIA crude oil inventories (2:30 pm GMT)
What can we expect from Oil today?
Oil markets on Wednesday remain under severe pressure from multiple bearish factors. The IEA’s warning of a record 4 million bpd supply surplus in 2026, combined with OPEC+ production increases totaling over 2.7 million bpd this year, has created expectations of massive inventory builds ahead. Escalating US-China trade tensions threaten to further weaken demand in the world’s two largest economies, while structural shifts toward electric vehicles and peak gasoline consumption compound long-term challenges.
Next 24 Hours Bias
Medium Bearish
The post IC Markets Europe Fundamental Forecast | 15 October 2025 first appeared on IC Markets | Official Blog.
Ex-Dividend 15/10/2025
422265 October 14, 2025 17:39 ICMarkets Market News
The post Ex-Dividend 15/10/2025 first appeared on IC Markets | Official Blog.
General Market Analysis – 14/10/25
422260 October 14, 2025 16:00 ICMarkets Market News
US Stocks Recover as Trade Tensions Ease – Nasdaq up 2.2%
US stock indices recovered in trading yesterday as trade tensions eased after both the US and China indicated that trade negotiations will remain ongoing. The Dow jumped 1.29% to 46,067, the S&P added 1.56% to 6,655, and the Nasdaq leapt 2.21% to 22,694. Bond markets were closed for the Columbus Day holiday, but yields are expected to bounce tomorrow. The dollar did bounce back to recover some of its losses from Friday, the DXY up 0.30% to 99.28 by the close. Oil prices also recovered some, but by no means all, of Friday’s lost ground, with Brent up 1.20% to $63.48 and WTI up 1.26% to $59.64 a barrel. Gold was once again a standout mover as it powered through $4,100 to close at yet another record high, up 2.29% to $4,110.27 an ounce.
Gold Bulls Back in Charge Again
Gold resumed its relentless move higher yesterday as it powered over 2% further north to smash through its latest big-figure barrier like a hot knife through butter. The last couple of days of last week had seen some more ‘normal’ trading for gold as first a big risk-on move had seen it sink hard before trade tensions escalated into the weekend and it rallied again in line with other market moves. However, yesterday the relentless buying that has been a feature of the last six weeks since it broke its previous record level recommenced, and it far outstripped moves in other financial products. Gold has now gained over 56% this year, and various theories are still being bandied across markets as to the reason behind the move. They seem to be changing on a daily basis, but traders cannot ignore the trend, and most are still looking to jump on the back of it, with any dip still well supported.
Central Banks in Focus on the Calendar Today
Geopolitics looks set to continue to dominate market sentiment into today’s trading sessions; however, the economic calendar does have a distinctly central-bank feel to it, with several updates due out across the day. The initial focus in the Asian session will be on Australian markets, with the Reserve Bank of Australia’s Monetary Policy Meeting Minutes due out early in the day, before focus moves north as Japanese markets reopen after a long weekend. There is some key data due out of the UK early in the London session, with employment numbers scheduled for release. The Claimant Count is expected to increase by 10k m/m, with the unemployment rate remaining steady at 4.7%. Later in the day, during the New York session, the focus moves to Washington, D.C., where the great and good of the central banking world are gathering for a couple of days. The highlights today will be updates from Fed Chair Jerome Powell and Bank of England Governor Andrew Bailey.
The post General Market Analysis – 14/10/25 first appeared on IC Markets | Official Blog.
Tuesday 14th October 2025: Technical Outlook and Review
422245 October 14, 2025 15:39 ICMarkets Market News
DXY (U.S. Dollar Index):
Potential Direction: Bullish
Overall momentum of the chart: Bearish
The price could make a short-term pullback toward the pivot before rising again toward the 1st resistance
Pivot: 98.76
Supporting reasons: Identified as an overlap support, where renewed buying pressure could emerge to push the price higher.
1st support: 98.00
Supporting reasons: Identified as an overlap support, indicating a potential area where the price could again stabilize.
1st resistance: 99.53
Supporting reasons: Identified as a pullback resistance, indicating a potential area that could halt any further upward movement
EUR/USD:
Potential Direction: Bearish
Overall momentum of the chart: Bullish
The price could see a short-term pullback toward the pivot before continuing its bearish move down toward the 1st support.
Pivot: 1.1618
Supporting reasons: Identified as an overlap resistance, where selling pressures could intensify and potentially cap any upward retracement.
1st support: 1.1471
Supporting reasons: Identified as a pullback support that aligns closely with the 161.8% Fibonacci extension, indicating a potential level where the price could stabilize once again.
1st resistance: 1.1726
Supporting reasons: Identified as an overlap resistance, indicating a potential level that could cap further upward movement.
EUR/JPY:
Potential Direction: Bearish
Overall momentum of the chart: Bullish
The price could see a short-term pullback toward the pivot before continuing its bearish move down toward the 1st support.
Pivot: 176.23
Supporting reasons: Identified as an overlap resistance, where selling pressures could intensify and potentially cap any upward retracement.
1st support: 174.99
Supporting reasons: Identified as an overlap support that aligns with the 50% Fibonacci retracement, indicating a potential area where the price could again stabilize.
1st resistance: 177.75
Supporting reasons: Identified as a resistance that is supported by the 200% Fibonacci extension, indicating a potential level that could cap further upward movement.
EUR/GBP:
Potential Direction: Bearish
Overall momentum of the chart: Bullish
The price could see a short-term pullback toward the pivot before continuing its bearish move down toward the 1st support.
Pivot: 0.8693
Supporting reasons: Identified as an overlap resistance, where selling pressures could intensify and potentially cap any upward retracement.
1st support: 0.8657
Supporting reasons: Identified as an overlap support, indicating a potential area where the price could stabilize once more.
1st resistance: 0.8708
Supporting reasons: Identified as an overlap resistance, indicating a potential level that could cap further upward movement.
GBP/USD:
Potential Direction: Bearish
Overall momentum of the chart: Bearish
The price could see a short-term pullback toward the pivot before continuing its bearish move down toward the 1st support.
Pivot: 1.3392
Supporting reasons: Identified as an overlap resistance, where selling pressures could intensify and potentially cap any upward retracement.
1st support: 1.3269
Supporting reasons: Identified as an overlap support, indicating a potential area where the price could stabilize once more.
1st resistance: 1.3513
Supporting reasons: Identified as a swing high resistance, indicating a potential level that could halt further upward movement.
GBP/JPY:
Potential Direction: Bullish
Overall momentum of the chart: Bullish
The price could make a short-term pullback toward the pivot before rising again toward the 1st resistance
Pivot: 202.86
Supporting reasons: Identified as a pullback support, where renewed buying pressure could emerge to push the price higher.
1st support: 201.04
Supporting reasons: Identified as a pullback support, indicating a potential level where the price could stabilize once more.
1st resistance: 204.86
Supporting reasons: Identified as a multi-swing high resistance, indicating a potential level that could halt further upward movement.
USD/CHF:
Potential Direction: Bullish
Overall momentum of the chart: Bullish
The price could make a short-term pullback toward the pivot before rising again toward the 1st resistance
Pivot: 0.8007
Supporting reasons: Identified as a pullback support, where renewed buying pressure could emerge to push the price higher.
1st support: 0.7923
Supporting reasons: Identified as an overlap support, indicating a potential area where the price could again stabilize.
1st resistance: 0.8104
Supporting reasons: Identified as a swing high resistance that aligns with the 127.2% Fibonacci extension, indicating a potential level that could cap further upward movement.
USD/JPY:
Potential Direction: Bullish
Overall momentum of the chart: Bullish
The price could make a short-term pullback toward the pivot before rising again toward the 1st resistance
Pivot: 150.91
Supporting reasons: This level is identified as a pullback support and a prior breakout zone. After a strong bullish impulse above this area, a retest could invite renewed buying interest.
1st support: 149.82
Supporting reasons: Identified as a pullback support, indicating a strong area where buyers might return, and the price could stabilize once again.
1st resistance: 153.98
Supporting reasons: Identified as a pullback resistance.This is a significant resistance that could cap further upward movement and coincide with profit-taking zones for bullish positions
USD/CAD:
Potential Direction: Bullish
Overall momentum of the chart: Bearish
The price could fall toward the pivot and make a bullish bounce off toward the 1st resistance.
Pivot: 1.4012
Supporting reasons: Identified as a pullback support, indicating a potential area where buying interest could pick up.
1st support: 1.3919
Supporting reasons: Identified as an overlap support, indicating a key level where the price could stabilize once more.
1st resistance: 1.4156
Supporting reasons: Identified as a pullback resistance that aligns with the 78.6% Fibonacci retracement making it a possible target for bullish advances and a level where some sellers could return to cap gains
AUD/USD:
Potential Direction: Bearish
Overall momentum of the chart: Bullish
The price could see a short-term pullback toward the pivot before continuing its bearish move down toward the 1st support.
Pivot: 0.6531
Supporting reasons: Identified as an overlap zone where any brief bullish recovery could find resistance before resuming the bearish trend.
1st support: 0.6569
Supporting reasons: Identified as a swing low support, this area has provided strong support historically and may attract buying interest for a potential short-term bounce
1st resistance: 0.6585
Supporting reasons: Identified as a pullback resistance, this level could cap upside potential in the current bearish structure.
NZD/USD
Potential Direction: Bearish
Overall momentum of the chart: Bullish
The price could see a short-term pullback toward the pivot before continuing its bearish move down toward the 1st support.
Pivot: 0.5762
Supporting reasons: Identified as a pullback resistance, where selling pressures could intensify and potentially cap any upward retracement.
1st support: 0.5698
Supporting reasons: Identified as a support that is supported by the 161.8% Fibonacci extension, this area has provided strong support historically and may attract buying interest for a potential short-term bounce
1st resistance: 0.5803
Supporting reasons: Identified as an overlap resistance, indicating a potential area that could halt any further upward movement.
US30 (DJIA):
Potential Direction: Bearish
Overall momentum of the chart: Bullish
The price could see a short-term pullback toward the pivot before continuing its bearish move down toward the 1st support.
Pivot: 46,182.48
Supporting reasons: Identified as a pullback resistance that aligns with the 50% Fibonacci retracement, where selling pressures could intensify and potentially cap any upward retracement.
1st support: 45,239.96
Supporting reasons: Identified as an overlap support, suggesting a potential area where the price could stabilize once again.
1st resistance: 46,854.31
Supporting reasons: Identified as a multi-swing high resistance, indicating a potential area that could halt any further upward movement.
DE40 (DAX):
Potential Direction: Bearish
Overall momentum of the chart: Bullish
The price could see a short-term pullback toward the pivot before continuing its bearish move down toward the 1st support.
Pivot: 24,511.06
Supporting reasons: Identified as a pullback resistance, where selling pressures could intensify and potentially cap any upward retracement.
1st support: 24,080.53
Supporting reasons: Identified as a pullback support that aligns with the 50% Fibonacci retracement, indicating a key level where the price could stabilize once more.
1st resistance: 24,771.19
Supporting reasons: Identified as a swing high resistance, indicating a potential area that could halt any further upward movement.
US500 (S&P 500):
Potential Direction: Bearish
Overall momentum of the chart: Bullish
The price could see a short-term pullback toward the pivot before continuing its bearish move down toward the 1st support.
Pivot: 6,697.28
Supporting reasons: Identified as a pullback resistance, where selling pressures could intensify and potentially cap any upward retracement.
1st support: 6,520.61
Supporting reasons: Identified as an overlap support, indicating a potential level where the price could stabilize once again.
1st resistance: 6,760.21
Supporting reasons: Identified as a multi-swing high resistance, indicating a potential area that could halt any further upward movement.
BTC/USD (Bitcoin):
Potential Direction: Bearish
Overall momentum of the chart: Bullish
The price could see a short-term pullback toward the pivot before continuing its bearish move down toward the 1st support.
Pivot: 117,689.57
Supporting reasons: Identified as a pullback resistance that aligns with the 50% Fibonacci retracement,, where selling pressures could intensify and potentially cap any upward retracement.
1st support: 111,917.12
Supporting reasons: Identified as a pullback support, indicating a potential level where the price could stabilize once more.
1st resistance: 120,968.46
Supporting reasons: Identified as a pullback resistance, indicating a potential area that could halt any further upward movement.
ETH/USD (Ethereum):
Potential Direction: Bearish
Overall momentum of the chart: Bullish
The price could see a short-term pullback toward the pivot before continuing its bearish move down toward the 1st support.
Pivot: 4,372.65
Supporting reasons: Identified as a pullback resistance that aligns with the 61.8% Fibonacci retracement, where selling pressures could intensify and potentially cap any upward retracement.
1st support: 4,049.67
Supporting reasons: Identified as a pullback support, indicating a potential level where the price could stabilize once more.
1st resistance: 4,642.75
Supporting reasons: Identified as a pullback resistance, indicating a potential area that could halt any further upward movement.
WTI/USD (Oil):
Potential Direction: Bearish
Overall momentum of the chart: Bullish
The price could see a short-term pullback toward the pivot before continuing its bearish move down toward the 1st support.
Pivot: 60.61
Supporting reasons: Identified as a pullback resistance, where selling pressures could intensify and potentially cap any upward retracement.
1st support: 58.39
Supporting reasons: Identified as a swing low support that aligns with the 78.6% Fibonacci projection, indicating a key level where the price could stabilize once more.
1st resistance: 63.15
Supporting reasons: Identified as a pullback resistance, indicating a potential area that could halt any further upward movement.
XAU/USD (GOLD):
Potential Direction: Bullish
Overall momentum of the chart: Bullish
The price could fall toward the pivot and make a bullish rise toward the 1st resistance.
Pivot: 4,055.24
Supporting reasons: Identified as a pullback support, indicating a potential area where buying interest could pick up.
1st support: 3,953.04
Supporting reasons: Identified as a swing low support, indicating a key level where the price could stabilize once more.
1st resistance: 4,129.14
Supporting reasons: Identified as a resistancethat is supported by the 161.8% Fibonacci extension and the 78.6% Fibonacci projection, indicating a potential area that could halt any further upward movement.
The accuracy, completeness and timeliness of the information contained on this site cannot be guaranteed. IC Markets does not warranty, guarantee or make any representations, or assume any liability regarding financial results based on the use of the information in the site.
News, views, opinions, recommendations and other information obtained from sources outside of www.icmarkets.com, used in this site are believed to be reliable, but we cannot guarantee their accuracy or completeness. All such information is subject to change at any time without notice. IC Markets assumes no responsibility for the content of any linked site.
The fact that such links may exist does not indicate approval or endorsement of any material contained on any linked site. IC Markets is not liable for any harm caused by the transmission, through accessing the services or information on this site, of a computer virus, or other computer code or programming device that might be used to access, delete, damage, disable, disrupt or otherwise impede in any manner, the operation of the site or of any user’s software, hardware, data or property.
The post Tuesday 14th October 2025: Technical Outlook and Review first appeared on IC Markets | Official Blog.
IC Markets Asia Fundamental Forecast | 14 October 2025
422244 October 14, 2025 15:39 ICMarkets Market News
IC Markets Asia Fundamental Forecast | 14 October 2025
What happened in the U.S. session?
Major U.S. equities reversed Friday’s rout on Trump’s more conciliatory China statements. Gold and silver soared to new highs on safe-haven flows, while oil stayed range-bound. Semiconductor and AI-focused stocks outperformed on demand optimism and easing trade fears. Key U.S. economic data remained delayed due to the ongoing government shutdown, keeping volatility elevated.The U.S. dollar strengthened slightly against other major currencies, while fixed income stayed muted with bond markets closed.
What does it mean for the Asia Session?
Traders should expect heightened volatility in Asian markets driven by ongoing US-China trade friction and the potential for major market-moving statements from central bank leaders (RBA, Fed, BOE). Gold and safe-haven assets are in favor, while Asian equities remain under pressure. Key macroeconomic releases and speeches will set the tone for Asia-Pacific FX pairs and broader risk sentiment.
The Dollar Index (DXY)
Key news events today
Fed Chair Powell speaks (4:20 pm GMT)
What can we expect from DXY today?
The dollar starts with moderate strength, supported by the anticipation of Powell’s speech and temporarily abated trade tensions. The outlook for the USD is shaped by the potential continuation of Fed rate cuts, sticky inflation, and nervous market sentiment, given government shutdown delays and unresolved trade issues with China. Near-term volatility is expected, with the Fed’s forward guidance and geopolitical headlines dictating major moves for the dollar across global markets.
Central Bank Notes:
- The Federal Open Market Committee (FOMC) voted, by majority, to lower the federal funds rate target range by 25 basis points to 4.00%–4.25% at its September 16–17, 2025, meeting, marking the first policy rate adjustment since December 2024 after five consecutive holds.
- The Committee maintained its long-term objective of achieving maximum employment and 2% inflation, acknowledging recent labor market softening and continued tariff-driven price pressures.
- Policymakers expressed elevated concern about downside risks to growth, citing a stalling labor market, modest job creation, and an unemployment rate drifting up toward 4.4%. At the same time, inflation remains above target, with CPI at 3.2% and core inflation at 3.1% as of August 2025; higher energy and food prices, largely attributable to tariffs, continue to weigh on headline measures.
- Although economic activity expanded at a moderate pace in the third quarter, the growth outlook has weakened. Q3 GDP growth is estimated near 1.0% (annualized), with full-year 2025 GDP growth guidance revised to 1.2%, reflecting slowing household consumption and tighter financial conditions.
- In the updated Summary of Economic Projections, the unemployment rate is projected to average 4.5% for the year, with headline PCE inflation revised up slightly to 3.1% for 2025. The Committee anticipates core PCE inflation to remain stubborn, requiring sustained vigilance and a flexible approach to risk management.
- The Committee reiterated its data-dependent approach and openness to further adjustments should employment or inflation deviate meaningfully from current forecasts. Several members dissented, either advocating a larger 50-basis-point cut or preferring no adjustment at this meeting, revealing heightened divergence within the Committee.
- Balance sheet reduction continues at a measured pace. The monthly Treasury redemption cap remains at $5B and the agency MBS cap at $35B, as the Board aims to support orderly market conditions in the face of evolving global and domestic uncertainty.
- The next meeting is scheduled for 28 to 29 October 2025.
Next 24 Hours Bias
Weak Bearish
Gold (XAU)
Key news events today
Fed Chair Powell speaks (4:20 pm GMT)
What can we expect from Gold today?
Gold’s breakthrough above $4,100 per ounce represents a historic milestone driven by a confluence of factors, including renewed US-China trade tensions, Federal Reserve dovish expectations, record ETF inflows, and sustained central bank buying. While technical indicators suggest potential for near-term consolidation, the fundamental backdrop remains supportive with multiple analysts forecasting continued gains toward $5,000 per ounce by 2026. Fed Chair Powell’s speech on Tuesday will be closely watched for additional policy guidance that could influence gold’s next directional move.
Next 24 Hours Bias
Strong Bullish
The Australian Dollar (AUD)
Key news events today
Monetary policy meeting minutes (12:30 am GMT)
What can we expect from AUD today?
The Australian Dollar staged a notable recovery, rising 0.7% to 65.14 US cents as US-China trade tensions eased following more conciliatory rhetoric from the Trump administration. However, the currency remains under pressure from domestic factors, including rising inflation expectations (4.8% in October), deteriorating consumer confidence (92.1, a six-month low), and the RBA’s increasingly hawkish stance on monetary policy.
Central Bank Notes:
- The RBA held its cash rate steady at 3.60% at its October meeting on 29–30 September 2025, marking a second consecutive pause after August’s 25 basis point cut. The move affirms the Bank’s data-dependent approach as inflation trends within the target range.
- Inflation indicators remained stable through September, with headline CPI likely anchoring near 2.2%—comfortably within the 2–3% band. Insurance and housing costs remain sticky but are increasingly offset by moderation in discretionary goods.
- Trimmed mean inflation is estimated at around 2.8%, signaling underlying pressures remain contained. The Board continues to flag food and energy price volatility as short-term risks, though the broader disinflation narrative holds.
- Global conditions remain a source of uncertainty. U.S. policy expectations and uneven growth in China continue to weigh on commodities, even as trade disruptions have eased marginally since mid-year.
- Domestic growth shows resilience in the housing and services sectors, though manufacturing remains subdued. Household incomes have stabilized, but consumption remains only modest, capped by high borrowing costs.
- The labor market maintains relative tightness, though job growth has slowed notably since the first half of the year. Underutilization has ticked higher, but overall employment conditions remain supportive.
- Wage growth is plateauing, reflecting softer labor demand. Weak productivity continues to keep unit labor costs elevated, underscoring a medium-term concern highlighted repeatedly by the RBA.
- Household consumption prospects remain fragile. The combination of high rents and weak discretionary appetite suggests risks of a consumer-led slowdown in Q4 if confidence fails to rebound.
- The Board reiterated that subdued household spending poses risks to business sentiment and may dampen investment and job creation in the coming quarters.
- Monetary policy remains mildly restrictive. The RBA balanced confidence in inflation progress with caution around global and domestic demand risks, keeping further adjustments conditional on incoming data.
- The Bank reaffirmed its dual commitment to price stability and full employment, noting its readiness to act should conditions shift markedly.
- The next meeting is on 5 to 6 November 2025.
Next 24 Hours Bias
Medium Bearish
The Kiwi Dollar (NZD)
Key news events today
No major news event
What can we expect from NZD today?
The New Zealand Dollar remains under significant pressure as markets continue to digest the implications of the RBNZ’s aggressive 50 basis point rate cut from the previous week. Trading near six-month lows around 0.5730-0.5740 against the US Dollar, the currency faces headwinds from both dovish monetary policy expectations and underlying economic weakness. With markets pricing in further rate cuts and key economic data releases scheduled throughout the week, the NZD’s recovery prospects remain limited in the near term.
Central Bank Notes:
- The Monetary Policy Committee (MPC) agreed to cut the Official Cash Rate (OCR) by 25 basis points to 3.00% on 20 August 2025, marking a three-year low and continuing the easing cycle after July’s pause. The vote was split 4-2, with two members advocating a 50-basis-point cut, highlighting diverging views within the Committee.
- Policymakers indicated that significant uncertainty and a stalling economic recovery prompted this move, leaving the door open for further rate cuts later in the year, with a possible trough around 2.5% by December.
- Annual consumer price index inflation rose to 2.7% in the June quarter and is expected to reach 3% for the September quarter—at the upper end of the MPC’s 1 to 3% target band—but medium-term expectations remain anchored near the 2% midpoint.
- Despite the near-term uptick, headline inflation is projected to return toward 2% by mid-2026, as tradables inflation pressures ease and significant spare capacity continues to dampen domestic price momentum.
- Domestic financial conditions are broadly aligning with MPC expectations, as lower wholesale rates have translated into reduced borrowing costs for households. However, declining consumption and investment demand, higher unemployment, and subdued wage growth reflect ongoing economic slack.
- GDP growth stalled in the second quarter of 2025, contrasting with earlier projections. High-frequency indicators point to continued weakness driven by rising prices for essentials, weakening household savings, and constrained business lending.
- The MPC cautioned that ongoing global tariff uncertainties and policy shifts, especially recent changes in US trade regulations, could amplify market volatility and present both upside and downside risks to New Zealand’s recovery.
- Subject to medium-term inflation pressures continuing to ease as projected, the MPC signaled scope for further OCR cuts, possibly down to 2.5% by year-end, consistent with the latest Monetary Policy Statement outlook.
- The next meeting is on 22 October 2025.
Next 24 Hours Bias
Medium Bearish
The Japanese Yen (JPY)
Key news events today
No major news event
What can we expect from JPY today?
The Japanese yen amid unprecedented political uncertainty. The collapse of the LDP-Komeito coalition has complicated Takaichi’s path to the premiership and raised questions about Japan’s economic policy direction. While the yen remains under pressure at multi-month lows around 152 per dollar, verbal intervention warnings from Japanese authorities suggest growing concern about the currency’s rapid decline. The upcoming BOJ meeting on October 29-30 will be crucial for determining the monetary policy path, with markets significantly reducing expectations for an October rate hike.
Central Bank Notes:
- The Policy Board of the Bank of Japan decided on 17 September, by a unanimous vote, to set the following guidelines for money market operations for the inter-meeting period:
- The Bank will encourage the uncollateralized overnight call rate to remain at around 0.5%.
- The BOJ will continue its gradual reduction of monthly outright purchases of Japanese Government Bonds (JGBs). The scheduled amount of long-term government bond purchases remains unchanged from the prior decision, with a quarterly reduction pace of about ¥400 billion through March 2026 and about ¥200 billion per quarter from April to June 2026 onward, aiming for a purchase level near ¥2 trillion in January to March 2027.
- Japan’s economy continues to show a moderate recovery, with household consumption supported by rising incomes, although corporate activity has softened somewhat. Overseas economies remain on a moderate growth path, with the impact of global trade policies still weighing on Japan’s export and industrial production outlook.
- On the price front, the year-on-year rate of change in consumer prices (excluding fresh food) remains in the mid-3% range. Inflationary pressures remain broad-based, with persistent cost-push factors in food and energy, alongside solid wage pass-through. However, input cost pressures from past import surges are showing early signs of easing.
- Short-term inflation momentum may moderate as cost-push effects diminish, though rent increases and service-related price gains tied to labor shortages are likely to provide support. Inflation expectations among firms and households continue a gradual upward drift.
- Looking ahead, the economy is projected to grow at a slower-than-trend pace in the near term due to external demand softness and cautious corporate investment plans. However, accommodative financial conditions and steady increases in real labor income are expected to underpin domestic demand.
- In the medium term, as overseas economies recover and global trade stabilizes, Japan’s growth potential is likely to improve. With persistent labor market tightness and rising medium- to long-term inflation expectations, core inflation is projected to remain on a gradual upward trend, converging toward the 2% price stability target in the latter half of the projection horizon.
- The next meeting is scheduled for 30 to 31 October 2025.
Next 24 Hours Bias
Medium Bearish
Oil
Key news events today
API crude oil stock (8:30 pm GMT)
What can we expect from Oil today?
Oil prices are rebounding modestly from multi-month lows. The outlook remains volatile, with price recovery hinging heavily on US–China trade negotiations, the pace of OPEC+ supply growth, and the resolution of localized supply issues in major consuming regions. Short-term price movements are particularly sensitive to any signals of trade de-escalation or fresh disruptions, and the broader trend remains capped by potential oversupply and macroeconomic uncertainty. The market is searching for a catalyst amid a cautious and fluid environment.
Next 24 Hours Bias
Medium Bearish
The post IC Markets Asia Fundamental Forecast | 14 October 2025 first appeared on IC Markets | Official Blog.
IC Markets Europe Fundamental Forecast | 14 October 2025
422243 October 14, 2025 15:14 ICMarkets Market News
IC Markets Europe Fundamental Forecast | 14 October 2025
What happened in the Asia session?
This Asia session was dominated by risk-off sentiment due to escalating US-China trade tensions and new policy threats, driving major declines in Asian equities and commodity gains, while traditional safe havens (JPY, CHF, and gold) attracted flows. Australian and Chinese assets saw direct currency and index impact, setting the tone for global trading ahead of critical macro and earnings releases.
What does it mean for the Europe & US sessions?
The main data releases for today are supportive for both GBP and EUR, with wage and jobless data in the UK painting a steady to slightly optimistic picture, and German sentiment improving.U.S. markets are sensitive to central bank speeches and ongoing trade tensions, as recent recoveries in tech and materials indicate market optimism after previous volatility.China’s jump in new loans could reflect global risk appetite, boosting commodities and Asian-linked currencies.The overarching theme is cautious optimism: persistent inflation and global trade tensions are acting as headwinds, but stronger wage figures, positive sentiment, and new loan growth could support an incremental risk-on mood as sessions get underway.
The Dollar Index (DXY)
Key news events today
Fed Chair Powell speaks (4:20 pm GMT)
What can we expect from DXY today?
The Dollar enters Tuesday with heightened uncertainty, anticipation around Powell’s address, and ongoing focus on Fed rate policy. Currency movements will hinge significantly on Powell’s remarks and subsequent Fed commentary, as markets weigh persistent inflation pressures against signs of labor market softening and global interest rate dynamics.
Central Bank Notes:
- The Federal Open Market Committee (FOMC) voted, by majority, to lower the federal funds rate target range by 25 basis points to 4.00%–4.25% at its September 16–17, 2025, meeting, marking the first policy rate adjustment since December 2024 after five consecutive holds.
- The Committee maintained its long-term objective of achieving maximum employment and 2% inflation, acknowledging recent labor market softening and continued tariff-driven price pressures.
- Policymakers expressed elevated concern about downside risks to growth, citing a stalling labor market, modest job creation, and an unemployment rate drifting up toward 4.4%. At the same time, inflation remains above target, with CPI at 3.2% and core inflation at 3.1% as of August 2025; higher energy and food prices, largely attributable to tariffs, continue to weigh on headline measures.
- Although economic activity expanded at a moderate pace in the third quarter, the growth outlook has weakened. Q3 GDP growth is estimated near 1.0% (annualized), with full-year 2025 GDP growth guidance revised to 1.2%, reflecting slowing household consumption and tighter financial conditions.
- In the updated Summary of Economic Projections, the unemployment rate is projected to average 4.5% for the year, with headline PCE inflation revised up slightly to 3.1% for 2025. The Committee anticipates core PCE inflation to remain stubborn, requiring sustained vigilance and a flexible approach to risk management.
- The Committee reiterated its data-dependent approach and openness to further adjustments should employment or inflation deviate meaningfully from current forecasts. Several members dissented, either advocating a larger 50-basis-point cut or preferring no adjustment at this meeting, revealing heightened divergence within the Committee.
- Balance sheet reduction continues at a measured pace. The monthly Treasury redemption cap remains at $5B and the agency MBS cap at $35B, as the Board aims to support orderly market conditions in the face of evolving global and domestic uncertainty
- The next meeting is scheduled for 28 to 29 October 2025.
Next 24 Hours Bias
Medium Bullish
Gold (XAU)
Key news events today
Fed Chair Powell speaks (4:20 pm GMT)
What can we expect from Gold today?
Gold prices surged to new record highs above $4,100 per ounce on Monday, October 13, 2025, marking another historic milestone for the metal amid intense geopolitical and economic uncertainty. This fresh rally was largely sparked by renewed US-China trade tensions, safe-haven demand, continued expectations of Federal Reserve rate cuts, and investor anxiety fueled by the ongoing US government shutdown.
Next 24 Hours Bias
Strong Bullish
The Euro (EUR)
Key news events today
German ZEW economic sentiment (9:00 am GMT)
What can we expect from EUR today?
The Euro is characterized by marginal improvement in sentiment indicators, but with continued caution due to mixed macroeconomic signals and ongoing external uncertainties. Eurozone-wide investor sentiment, as measured by the ZEW Index, also registered a small uptick (17.6 from 17.2 last month), signaling some stabilization in expectations despite industry headwinds and lingering inflation risks.
Central Bank Notes:
- The Governing Council kept the three key ECB interest rates unchanged at its meeting on September 11, 2025. The main refinancing rate remains at 2.15%, the marginal lending facility at 2.40%, and the deposit facility at 2.00%. These levels have been maintained after the cuts earlier in 2025, reflecting the Council’s confidence that the current stance is consistent with the price stability mandate.
- Evidence that inflation is running close to the ECB’s medium-term target of 2% supported the decision to hold rates steady. Domestic price pressures are easing as wage growth continues to moderate, and financing conditions remain accommodative. Policymakers reaffirmed a data-dependent, meeting-by-meeting approach to further policy moves, with no pre-commitment to a predetermined path amid ongoing global and domestic risks.
- Eurosystem staff projections foresee headline inflation averaging 2.0% for 2025, 1.8% for 2026, and 2.0% in 2027. The 2025 and 2026 forecasts reflect a downward revision, primarily on lower energy costs and exchange rate effects, even as food inflation remains persistent. Core inflation (excluding energy and food) is expected at 2.0% for 2026 and 2027, with only minor changes since prior rounds.
- Real GDP growth in the euro area is projected at 1.1% for 2025, 1.1% for 2026, and 1.4% for 2027. A robust first quarter—partly due to firms accelerating exports ahead of anticipated tariff hikes—cushioned a weaker outlook for the remainder of 2025. While business investment continues to face uncertainty from ongoing global trade disputes, especially with the US, government investment and infrastructure spending are expected to provide some support to the outlook.
- Rising real incomes and continued strength in the labor market boost household spending. Despite some fading tailwind from previous rate cuts, financing conditions remain broadly favorable and are expected to underpin the resilience of private consumption and investment against outside shocks. Moderating wage growth and profit margin adjustments are helping to absorb residual cost pressures.
- Rising real incomes and continued strength in the labor market boost household spending. Despite some fading tailwind from previous rate cuts, financing conditions remain broadly favorable and are expected to underpin the resilience of private consumption and investment against outside shocks. Moderating wage growth and profit margin adjustments are helping to absorb residual cost pressures.
- All future interest rate decisions will continue to be guided by the integrated assessment of economic and financial data, the inflation outlook, and underlying inflation dynamics, and the effectiveness of monetary policy transmission—without any pre-commitment to a specific future rate path.
- The ECB’s Asset Purchase Program (APP) and Pandemic Emergency Purchase Program (PEPP) portfolios are declining predictably, as maturities have ceased to be reinvested. Balance-sheet normalization continues in line with the ECB’s previously communicated schedule.
- The next meeting is on 29 to 30 October 2025
Next 24 Hours Bias
Weak Bullish
The Swiss Franc (CHF)
Key news events today
No major news event
What can we expect from CHF today?
The Swiss Franc is experiencing slight depreciation versus the US dollar amidst easing geopolitical tensions, persistent trade uncertainty, and a landmark US tariff policy affecting Swiss industries. Safe-haven flows remain strong, but the SNB has shown little inclination to intervene, supporting current rates and allowing CHF to seek its value via market dynamics. The outlook remains stable, with gradual appreciation expected and external factors (like US tariffs and SNB commentary) being key drivers for volatility.
Central Bank Notes:
- The SNB maintained its key policy rate at 0% during its meeting on 25 September 2025, pausing a sequence of six consecutive rate cuts as inflation stabilized and the Swiss franc remained firm.
- Recent data showed a modest rebound in inflation, with Swiss consumer prices rising 0.2% year-on-year in August after staying above zero for three consecutive months; this helped alleviate fears of deflation that were mounting earlier in the year.
- The conditional inflation forecast remains broadly unchanged from June: headline inflation is expected to average 0.2% in 2025, 0.5% in 2026, and 0.7% in 2027. The risk of a negative rate move has diminished for now, but the SNB retains flexibility should inflationary pressures weaken again.
- The global economic outlook has deteriorated further, weighed down by heightened trade tensions—especially with the U.S.—and ongoing uncertainty in key Swiss export markets.
- Swiss GDP growth moderated in Q2 after a strong Q1 boosted by front-loaded U.S. exports. The SNB expects growth to slow and remain subdued, with forecasted GDP expansion between 1% and 1.5% in both 2025 and 2026.
- Labor market sentiment in the Swiss industrial sector has softened on concerns over export competitiveness and potential adjustments to production, but the overall growth outlook stays broadly unchanged
- The SNB reiterated its readiness to respond as needed if deflation risks re-emerge, emphasizing its commitment to medium-term price stability and a robust, transparent communication policy, with the introduction of more detailed monetary policy minutes beginning in October.
- The next meeting is on 11 December 2025.
Next 24 Hours Bias
Weak Bearish
The Pound (GBP)
Key news events today
Average Earnings Index 3m/y (6:00 am GMT)
Claimant Count Change (6:00 am GMT)
BOE Gov Bailey Speaks (5:00 pm GMT)
What can we expect from GBP today?
Today, the Pound faces headwinds from a rebounding US dollar and market concerns about the fiscal sustainability of the UK economy. With wage growth stable and jobless claims declining, the immediate focus will shift to BoE commentary and the broader impact of potential upcoming tax policies on growth and inflation. Traders are advised to watch for volatility around BoE speeches and US data releases later in the day.
Central Bank Notes:
- The Bank of England’s Monetary Policy Committee (MPC) voted on 18 September 2025 by a majority (expected split likely 7–2 or 6–3) to hold the Bank Rate steady at 4.00%, following the August rate cut. Most members cited persistent inflation and mixed indicators on growth and employment, while a minority favored further easing due to the cooling labor market and subdued GDP growth.
- The Committee decided to decrease the pace of quantitative tightening, planning to reduce the stock of UK government bond purchases by £67.5 billion over the next 12 months, instead of the prior £100 billion pace, with the gilt balance now standing at nearly £558 billion. This reflects increased volatility in bond markets and a shift to a more gradual approach.
- Headline inflation rose unexpectedly to 3.8% in July and is projected at 4% for September, above the Bank’s 2% target. Price pressures are driven by regulated energy costs and ongoing food price increases. While previous disinflation has been substantial, core inflation remains elevated and sticky.
- The MPC expects headline inflation to remain above target through Q4, with a resumption of the downward trend projected for early 2026 as energy and regulated price pressures abate. The Committee remains watchful for signs of persistent inflation despite previous policy tightening.
- UK GDP growth is stagnant, with business and consumer activity subdued. Recent labor market data show rising unemployment rates (now at 4.7%) and stabilizing wage growth (holding near 5%), indicating slack but continued wage price pressure. The Committee remains cautious amid lackluster demand and soft survey sentiment.
- Pay growth and employment indicators have moderated further, alongside confirmation from business surveys that pay settlements are slowing. The Committee expects wage growth to decelerate significantly through Q4 and the rest of 2025.
- Global uncertainty persists due to volatile energy prices, supply chain disruptions linked to Middle East conflicts, and renewed trade tensions. The MPC remains vigilant in tracking transmission of external cost/wage shocks to UK inflation.
- Risks to inflation are considered two-sided. While subdued domestic growth and softening labor activity suggest scope for easing, persistent inflation requires caution. The MPC anticipates a slow, gradual reduction path in rates, continuing its data-dependent approach with careful adjustment as warranted by economic developments.
- The Committee’s bias remains toward maintaining a restrictive monetary policy stance until firmer evidence emerges that inflation will return sustainably to the 2% target. All future decisions will remain highly data dependent, with a strong emphasis on evolving demand, inflation expectations, costs, and labor market conditions.
- The next meeting is on 6 November 2025.
Next 24 Hours Bias
Weak Bearish
The Canadian Dollar (CAD)
Key news events today
No major news event
What can we expect from CAD today?
The Canadian Dollar remains under pressure just below 1.40 per USD, rebounding on strong job growth but capped by declining oil prices, with the market cautiously optimistic about its prospects heading into the fourth quarter. The CAD’s gains have been capped by falling oil prices and global market volatility, and the USD/CAD exchange rate recently touched a six-month high above 1.40. Most analysts expect further consolidation for the Canadian Dollar, with a possibility of testing resistance at 1.4085 before any meaningful decline.
Central Bank Notes:
- The Council cited continued U.S. tariff volatility and slow progress on trade negotiations as major contributors to ongoing uncertainty. While headline tariffs have not escalated further, the unpredictability of U.S. policy remains a significant risk for Canadian exports and business confidence.
- Uncertainty about U.S. trade policy and recurring tariff threats continued to weigh on growth prospects. The Bank flagged downside risks to the export sector, with survey data indicating ongoing hesitancy among manufacturers and exporters.
- After modest growth in Q1, Canada’s economy slipped into contraction, with GDP shrinking by 0.8% in Q2 and forecast to decrease again by 0.8% in Q3. Economic weakness has been most pronounced in manufacturing and goods-producing sectors affected by trade frictions and softer U.S. demand.
- Early estimates show that growth stabilized in September but remained well below the Bank’s 2% forecast for Q4. Manufacturing output has improved slightly—supported by a modest rebound in petroleum and mining activity—while consumer spending and retail sales were largely flat.
- Consumer spending remained subdued as households continued to limit discretionary purchases amid uncertainty and a slower job market. Housing activity stayed weak, despite earlier government efforts to boost affordability and modest gains in some real estate segments.
- Headline CPI inflation edged up to 1.9% in August, undershooting economist expectations but still showing emerging pressures from shelter and imported goods costs. Core inflation metrics were mixed, though price growth remains just below the Bank’s 2% target.
- The Governing Council reaffirmed its cautious approach, emphasizing that while further rate cuts are possible, the pace will hinge on the path of U.S. tariffs, domestic inflation dynamics, and signs of a sustainable recovery. The Bank remains vigilant against the risk of inflation falling below target in the face of economic slack.
- The next meeting is on 29 October 2025.
Next 24 Hours Bias
Medium Bearish
Oil
Key news events today
API crude oil stock (8:30 pm GMT)
What can we expect from Oil today?
Oil prices on Tuesday showed modest gains of approximately 0.3% as US-China trade tensions showed signs of easing, with WTI trading near $59.67/barrel and Brent at $63.50/barrel. However, prices remain down significantly over the past month and year amid a confluence of bearish factors: the elimination of Middle East geopolitical risk premiums following the Israel-Hamas ceasefire, an expanding supply glut with OPEC+ adding 630,000 bpd in September, building global inventories projected to average 2.6 million bpd in Q4 2025, record US production exceeding 13.6 million bpd, and weakening demand from China where oil consumption growth has slowed dramatically.
Next 24 Hours Bias
Weak Bearish
The post IC Markets Europe Fundamental Forecast | 14 October 2025 first appeared on IC Markets | Official Blog.