Articles
Wednesday 8th October 2025: Technical Outlook and Review
422004 October 8, 2025 14:14 ICMarkets Market News
DXY (U.S. Dollar Index):
Potential Direction: Bullish
Overall momentum of the chart: Bearish
The price could continue to make a bullish rise toward the 1st resistance
Pivot: 97.99
Supporting reasons: Identified as a pullback support, where renewed buying pressure could emerge to push the price higher.
1st support: 97.49
Supporting reasons: Identified as an overlap support, indicating a potential area where the price could again stabilize.
1st resistance: 99.28
Supporting reasons: Identified as a pullback resistance that aligns with the 161.8% Fibonacci extension and the 78.6% Fibonacci retracement, indicating a potential area that could halt any further upward movement
EUR/USD:
Potential Direction: Bearish
Overall momentum of the chart: Bullish
The price has already reacted off the pivot and could continue to make a bearish move down toward the 1st support.
Pivot: 1.1691
Supporting reasons: Identified as a pullback esistance, where selling pressures could intensify and potentially cap any upward retracement..
1st support: 1.1586
Supporting reasons: Identified as an overlap support that aligns closely with the 127.2% Fibonacci extension, indicating a potential level where the price could stabilize once again.
1st resistance: 1.1773
Supporting reasons: Identified as an overlap resistance, indicating a potential level that could cap further upward movement.
EUR/JPY:
Potential Direction: Bullish
Overall momentum of the chart: Bullish
The price could make a short-term pullback toward the pivot before rising again toward the 1st resistance
Pivot: 176.23
Supporting reasons: Identified as a pullback support, where renewed buying pressure could emerge to push the price higher.
1st support: 174.99
Supporting reasons: Identified as an overlap support, indicating a potential area where the price could again stabilize.
1st resistance: 177.75
Supporting reasons: Identified as a resistance that is supported by the 200% Fibonacci extension, indicating a potential level that could cap further upward movement.
EUR/GBP:
Potential Direction: Bearish
Overall momentum of the chart: Bullish
The price could continue to make a bearish fall toward the 1st support.
Pivot: 0.8693
Supporting reasons: Identified as an overlap resistance, where selling pressures could intensify and potentially cap any upward retracement.
1st support: 0.8664
Supporting reasons: Identified as an overlap support that aligns with the 161.8% Fibonacci extension, indicating a potential area where the price could stabilize once more.
1st resistance: 0.8725
Supporting reasons: Identified as an overlap resistance, indicating a potential level that could cap further upward movement.
GBP/USD:
Potential Direction: Bearish
Overall momentum of the chart: Bearish
The price could see a short-term pullback toward the pivot before continuing its bearish move down toward the 1st support.
Pivot: 1.3434
Supporting reasons: Identified as an overlap resistance, where selling pressures could intensify and potentially cap any upward retracement.
1st support: 1.3314
Supporting reasons: Identified as a pullback support, indicating a potential area where the price could stabilize once more.
1st resistance: 1.3513
Supporting reasons: Identified as a swing high resistance, indicating a potential level that could halt further upward movement.
GBP/JPY:
Potential Direction: Bullish
Overall momentum of the chart: Bullish
The price could make a short-term pullback toward the pivot before rising again toward the 1st resistance
Pivot: 202.20
Supporting reasons: Identified as an overlap support, where renewed buying pressure could emerge to push the price higher.
1st support: 200.38
Supporting reasons: Identified as an overlap support, indicating a potential level where the price could stabilize once more.
1st resistance: 206.01
Supporting reasons: Identified as a pullback resistance, indicating a potential level that could halt further upward movement.
USD/CHF:
Potential Direction: Sideways
Overall momentum of the chart: Neutral to Slightly Bullish
The price is expected to continue fluctuating within the established range, as it currently lacks clear directional bias but shows attempts to push higher toward resistance
1st support: 0.7937
Supporting reasons: Identified as range support, repeatedly tested, and holding as a floor, indicating a potential rebound zone when approached.
1st resistance: 0.8006
Supporting reasons: Marked as the main range cap and recent swing high, showing where upside moves have been stalled by sellers over multiple attempts.
USD/JPY:
Potential Direction: Bullish
Overall momentum of the chart: Bullish
The price could make a short-term pullback toward the pivot before rising again toward the 1st resistance
Pivot: 150.91
Supporting reasons: This level is identified as a pullback support and a prior breakout zone. After a strong bullish impulse above this area, a retest could invite renewed buying interest.
1st support: 149.82
Supporting reasons: Identified as a pullback support, indicating a strong area where buyers might return, and the price could stabilize once again.
1st resistance: 153.98
Supporting reasons: Identified as a pullback resistance. Marked as the 161.8%Fibonacci extension. This is a significant resistance that could cap further upward movement and coincide with profit-taking zones for bullish positions
USD/CAD:
Potential Direction: Bullish
Overall momentum of the chart: Bearish
The price could fall toward the pivot and make a bullish bounce off toward the 1st resistance.
Pivot: 1.3927
Supporting reasons: Identified as a pullback support, indicating a potential area where buying interest could pick up.
1st support: 1.3880
Supporting reasons: Identified as a pullback support that aligns closely with the 38.2% Fibonacci retracement, indicating a key level where the price could stabilize once more.
1st resistance: 1.3987
Supporting reasons: Identified as a swing high resistance, making it a possible target for bullish advances and a level where some sellers could return to cap gains
AUD/USD:
Potential Direction: Bearish
Overall momentum of the chart: Bullish
The price could see a short-term pullback toward the pivot before continuing its bearish move down toward the 1st support.
Pivot: 0.6591
Supporting reasons: Identified as an intermediate pullback zone where any brief bullish recovery could find resistance before resuming the bearish trend.
1st support: 0.6543
Supporting reasons: Identified as a pullback support, this area has provided strong support historically and may attract buying interest for a potential short-term bounce
1st resistance: 0.6625
Supporting reasons: Identified as a swing high resistance near the 61.8% Fibonacci retracement, this level could cap upside potential in the current bearish structure.
NZD/USD
Potential Direction: Bearish
Overall momentum of the chart: Bullish
The price could see a short-term pullback toward the pivot before continuing its bearish move down toward the 1st support.
Pivot: 0.5814
Supporting reasons: Identified as a pullback resistance, where selling pressures could intensify and potentially cap any upward retracement.
1st support: 0.5763
Supporting reasons: Identified as a swing low support, this area has provided strong support historically and may attract buying interest for a potential short-term bounce
1st resistance: 0.5845
Supporting reasons: Identified as a pullback resistance that aligns closely with the 38.2% Fibonacci retracement, indicating a potential area that could halt any further upward movement.
US30 (DJIA):
Potential Direction: Bullish
Overall momentum of the chart: Bullish
The price has already bounced off the pivot and could continue to make a bullish move toward the 1st resistance.
Pivot: 46,439.34
Supporting reasons: Identified as an overlap support, indicating a potential area where buying interest could pick up.
1st support: 45,125.00
Supporting reasons: Identified as an overlap support, suggesting a potential area where the price could stabilize once again.
1st resistance: 47,061.00
Supporting reasons: Identified as a swing high resistance, indicating a potential area that could halt any further upward movement.
DE40 (DAX):
Potential Direction: Bullish
Overall momentum of the chart: Bullish
The price could make a short-term pullback toward the pivot before rising again toward the 1st resistance
Pivot: 24,234.71
Supporting reasons: Identified as a pullback support, indicating a potential area where buying interest could pick up
1st support: 23,927.36
Supporting reasons: Identified as a pullback support, indicating a key level where the price could stabilize once more.
1st resistance: 24,533.15
Supporting reasons: Identified as a swing high resistance, indicating a potential area that could halt any further upward movement.
US500 (S&P 500):
Potential Direction: Bearish
Overall momentum of the chart: Bullish
The price could make a short-term pullback toward the pivot before rising again toward the 1st resistance
Pivot: 6,697.28
Supporting reasons: Identified as an overlap support, where renewed buying pressure could emerge to push the price higher.
1st support: 6,632.04
Supporting reasons: Identified as an overlap support, indicating a potential level where the price could stabilize once again.
1st resistance: 6,776.73
Supporting reasons: Identified as a resistance that is supported by the 161.8% Fibonacci extension, indicating a potential area that could halt any further upward movement.
BTC/USD (Bitcoin):
Potential Direction: Bearish
Overall momentum of the chart: Bullish
The price could see a short-term pullback toward the pivot before continuing its bearish move down toward the 1st support.
Pivot: 122,726.88
Supporting reasons: Identified as a pullback resistance, where selling pressures could intensify and potentially cap any upward retracement.
1st support: 119,294.96
Supporting reasons: Identified as a pullback support that aligns with the 38.2% Fibonacci retracement, indicating a potential level where the price could stabilize once more.
1st resistance: 126,282.29
Supporting reasons: Identified as a swing high resistance that aligns with the 161.8% Fibonacci projection, indicating a potential area that could halt any further upward movement.
ETH/USD (Ethereum):
Potential Direction: Bearish
Overall momentum of the chart: Bullish
The price could see a short-term pullback toward the pivot before continuing its bearish move down toward the 1st support.
Pivot: 4,607.50
Supporting reasons: Identified as a pullback resistance, where selling pressures could intensify and potentially cap any upward retracement.
1st support: 4,422.20
Supporting reasons: Identified as a pullback support that aligns with the 38.2% Fibonacci retracement, indicating a potential level where the price could stabilize once more.
1st resistance: 4,762.59
Supporting reasons: Identified as a swing high resistance, indicating a potential area that could halt any further upward movement.
WTI/USD (Oil):
Potential Direction: Bullish
Overall momentum of the chart: Bullish
The price could make a short-term pullback toward the pivot before rising again toward the 1st resistance
Pivot: 62.15
Supporting reasons: Identified as a pullback support, where renewed buying pressure could emerge to push the price higher.
1st support: 60.61
Supporting reasons: Identified as a swing low support, indicating a key level where the price could stabilize once more.
1st resistance: 63.15
Supporting reasons: Identified as a pullback resistance, indicating a potential area that could halt any further upward movement.
XAU/USD (GOLD):
Potential Direction: Bullish
Overall momentum of the chart: Bullish
The price could fall toward the pivot and make a bullish rise toward the 1st resistance.
Pivot: 3,889.12
Supporting reasons: Identified as a pullback support, indicating a potential area where buying interest could pick up.
1st support: 3,790.67
Supporting reasons: Identified as a pullback support, indicating a key level where the price could stabilize once more.
1st resistance: 4001.18
Supporting reasons: Identified as a resistance that is supported by the 100% Fibonacci projection, indicating a potential area that could halt any further upward movement.
The accuracy, completeness and timeliness of the information contained on this site cannot be guaranteed. IC Markets does not warranty, guarantee or make any representations, or assume any liability regarding financial results based on the use of the information in the site.
News, views, opinions, recommendations and other information obtained from sources outside of www.icmarkets.com, used in this site are believed to be reliable, but we cannot guarantee their accuracy or completeness. All such information is subject to change at any time without notice. IC Markets assumes no responsibility for the content of any linked site.
The fact that such links may exist does not indicate approval or endorsement of any material contained on any linked site. IC Markets is not liable for any harm caused by the transmission, through accessing the services or information on this site, of a computer virus, or other computer code or programming device that might be used to access, delete, damage, disable, disrupt or otherwise impede in any manner, the operation of the site or of any user’s software, hardware, data or property.
The post Wednesday 8th October 2025: Technical Outlook and Review first appeared on IC Markets | Official Blog.

General Market Analysis – 8/10/25
422003 October 8, 2025 14:14 ICMarkets Market News
US Stocks Drift as Shutdown Continues – Nasdaq down 0.7%
US stock indices fell in trading yesterday as the government shutdown continued with no sign of a resolution. The Dow dropped 0.20% to 46,602, the S&P lost 0.38% to move down to 6,714, and the Nasdaq lost 0.67%, closing at 22,788. The dollar pushed higher, with the DXY up 0.49% to 98.59, notably higher against the yen as the market continued to react to Sanae Takaichi’s surprise leadership victory over the weekend. Treasury yields pulled back, with the 2-year down 2.1 basis points to 3.568% and the benchmark 10-year down 2.7 basis points to 4.125%. Oil prices pushed higher as markets continued to reprice the lower-than-expected production increases from OPEC+, with Brent up 0.40% to $65.73 and WTI up 0.55% to $62.03. Gold continued to drive higher, hitting yet another all-time high just under the key $4,000 level, closing the day up 0.53% at $3,981.94 an ounce.
Yen in Focus for FX Traders
The yen remains very much in focus for the FX world at the moment after Sanae Takaichi’s surprise victory in the prime ministerial race led to a huge depreciation in the currency. Takaichi has pledged to boost the Japanese economy with aggressive spending and has been critical of the Bank of Japan’s interest rate hikes in the past, and traders were not prepared for her to become the next prime minister. The yen hit an all-time low against the euro earlier in the week and then fell to a seven-month low against the dollar overnight, with little in the way of retracements in the moves. USD/JPY is now trading nearly 3% above Friday’s close, and experienced FX traders are now starting to factor in the potential for official intervention in the currency if the speed of depreciation continues. From a technical perspective, long-term resistance now comes in around the 154.50 level, and a break higher from there could see recent multi-decade levels above 160.00 come into focus. It is unlikely that the MOF and BOJ will allow that to happen in short order, so traders are preparing for more volatility in the days ahead.
Central Banks in Focus Today
It is another quiet day in terms of data releases for global markets today; however, there are two major central bank updates scheduled, as well as a plethora of central bankers set to speak. Chinese markets complete their long holiday today, but the major focus for the Asian session will be the Reserve Bank of New Zealand’s interest rate call. The bank is well priced in to lower the Official Cash Rate to 2.75% from 3.00%, and even though no press conference is scheduled, bearing no surprises on the rate call, any changes in forward guidance from the rate statement could see moves in the Kiwi dollar.
The other major event of the day comes close to the end of the New York session with the FOMC’s meeting minutes due for release. As always, anything new from the committee will see strong moves in the market, particularly with no data updates from the US at the moment. There is a raft of central bankers set to speak during the day, including the ECB’s Christine Lagarde and Fed members Musalem, Barr, Goolsbee, Logan, and Kashkari. However, as we have had updates from all of the above over the last few days, traders are expecting their speeches to have minimal impact on markets.
The post General Market Analysis – 8/10/25 first appeared on IC Markets | Official Blog.
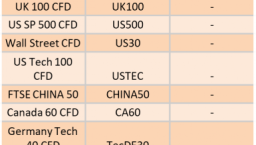
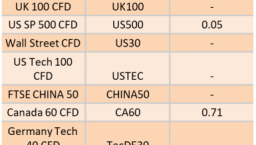
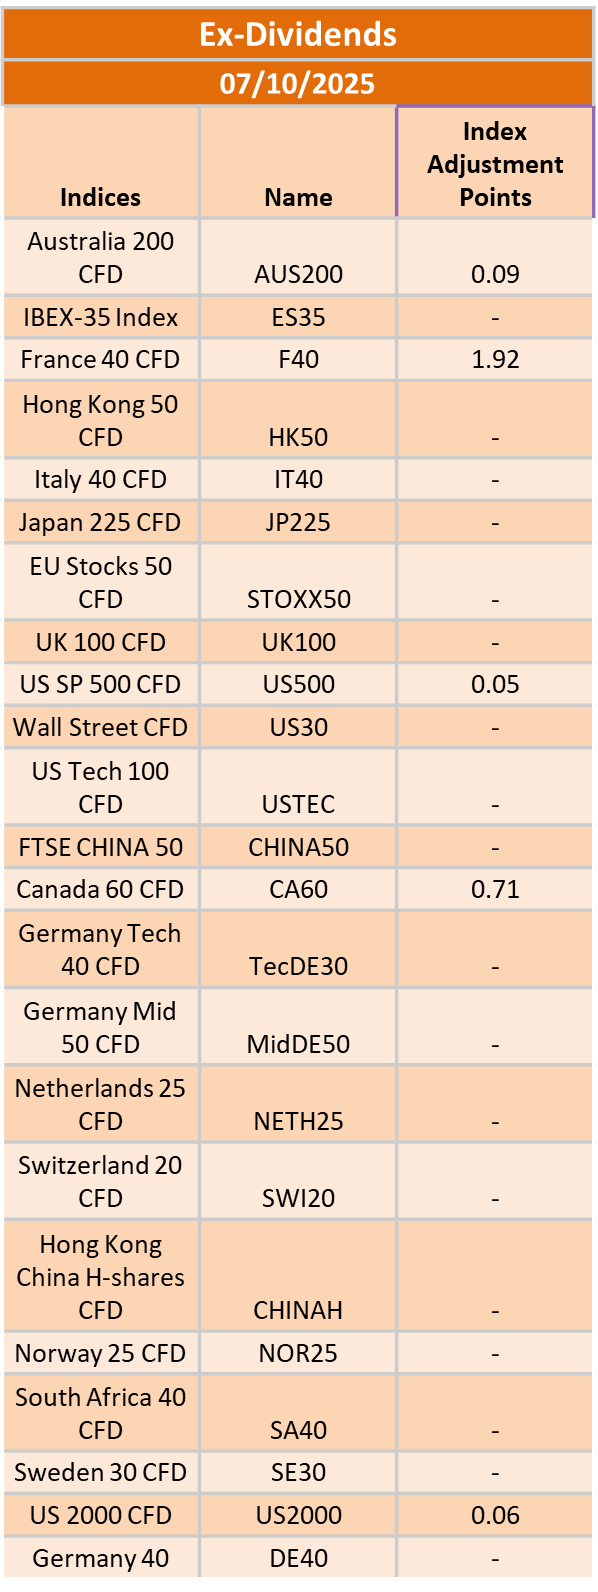
Ex-Dividend 8/10/2025
421995 October 8, 2025 08:39 ICMarkets Market News
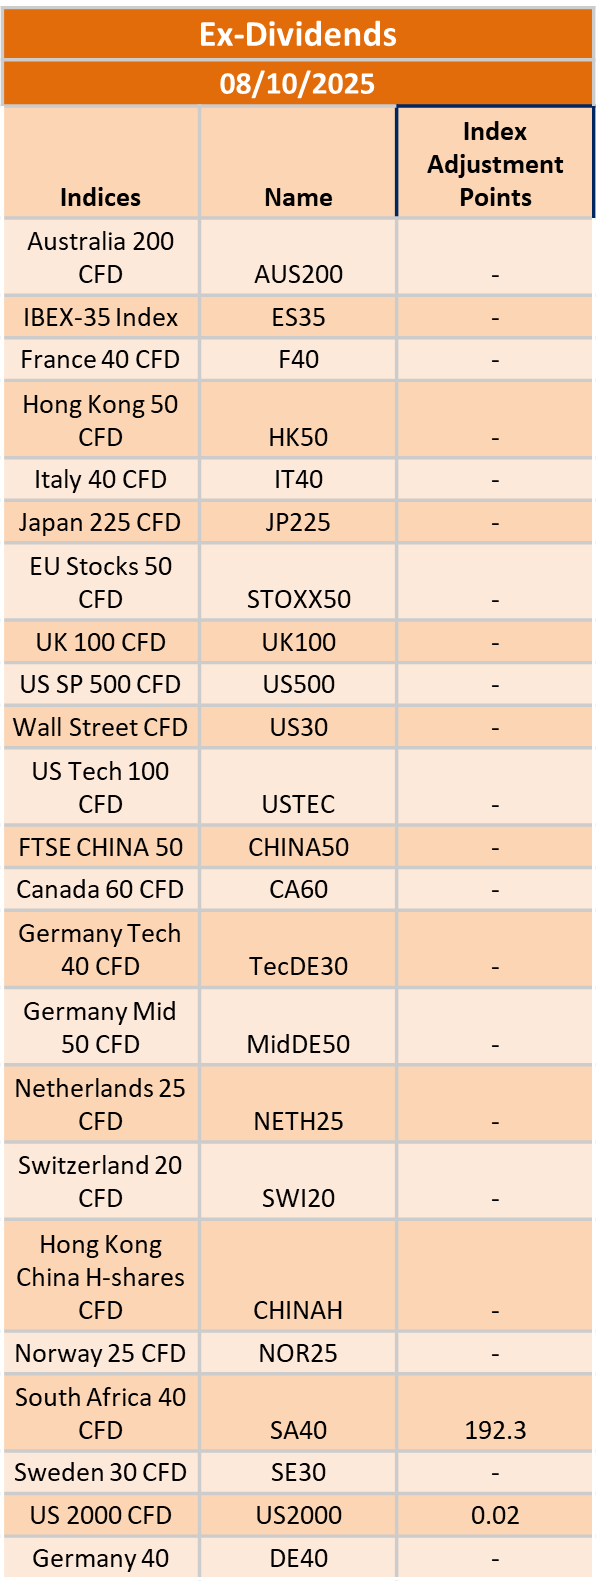
The post Ex-Dividend 8/10/2025 first appeared on IC Markets | Official Blog.
General Market Analysis – 7/10/25
421994 October 7, 2025 15:05 ICMarkets Market News
US Stocks Hit New Highs Again – Nasdaq up 0.7%
US tech stocks pushed higher again in trading yesterday to propel the S&P and the Nasdaq to fresh record levels, while President Trump hinted at a possible end to the government shutdown. The Dow edged lower, losing 0.14% to 46,694, while the S&P added 0.36% to close at 6,740 and the Nasdaq gained 0.71% to 22,941. The dollar pushed higher, notably against the yen and euro, as political surprises hit both markets, with the DXY up 0.38% to 98.09. Treasury yields also pushed higher despite the ongoing shutdown, with the 2-year up 1.3 basis points to 3.588% and the 10-year up 3.3 basis points to 4.152%. Oil prices jumped nicely off recent lows as OPEC+ production increases were not as substantial as previously reported, with Brent up 1.49% to $65.49 and WTI up 1.33% to $61.69. Gold powered higher again to yet another fresh record level, adding another 1.95% to close at $3,960.58 an ounce.
Gold Powering Higher Again
Gold powered higher again in trading yesterday and is now within touching distance of $4,000 an ounce — something that many market participants would have laughed at just a few short weeks ago. It has now risen nearly 14% in the last month after it broke through the previous record level just above $3,500, and its relentless push has many in the market still puzzled. We usually see gold trade like this in highly volatile, high-risk economic conditions; however, we currently have the strange phenomenon of global stock markets also trading at all-time highs at the same time. This move has been relentless, and it seems that the $4,000 barrier will be broken in short order. However, many traders are now analyzing what is behind such a strong move in current conditions. It does feel like there are some very big portfolio adjustments going through from major players, and the question will be how long this momentum can continue. For now, though, many are just trying to go with the flow, and any dip is being well supported. Roll on 4k!
Central Bankers in Focus for Traders Again Today
The macroeconomic calendar is relatively quiet once again today; however, given the volatility we saw across markets yesterday and the expected continued political updates, traders are expecting to be busy across all three sessions. In addition to geopolitical updates, we are also set to hear from a plethora of central bankers, which could add further spice to the mix. Chinese markets are closed again in the Asian session; however, Japanese markets are likely to remain in focus with more updates expected from the new Prime Minister and her team. There is nothing in the way of Tier 1 data scheduled in the London session, although speeches from both the Bundesbank’s Joachim Nagel and the ECB’s Christine Lagarde may see some reaction in the euro. We do have some data due out shortly after the New York open, with the Canadian Ivey PMI (exp. 51.2) due for release. We are also set to get more updates on Fed thinking during the day, with members Bostic, Bowman, Kashkari, and Miran all scheduled to speak.
The post General Market Analysis – 7/10/25 first appeared on IC Markets | Official Blog.
Tuesday 7th October 2025: Technical Outlook and Review
421981 October 7, 2025 15:00 ICMarkets Market News
DXY (U.S. Dollar Index):
Potential Direction: Bullish
Overall momentum of the chart: Bearish
The price could make a short-term pullback toward the pivot before rising again toward the 1st resistance
Pivot: 97.79
Supporting reasons: Identified as a pullback support, where renewed buying pressure could emerge to push the price higher.
1st support: 97.49
Supporting reasons: Identified as an overlap support, indicating a potential area where the price could again stabilize.
1st resistance: 98.68
Supporting reasons: Identified as a swing high resistance, indicating a potential area that could halt any further upward movement
EUR/USD:
Potential Direction: Bearish
Overall momentum of the chart: Bullish
The price has already reacted off the pivot and could continue to make a bearish move down toward the 1st support.
Pivot: 1.1714
Supporting reasons: Identified as an overlap resistance, where selling pressures could intensify and potentially cap any upward retracement..
1st support: 1.1618
Supporting reasons: Identified as a swing low support, indicating a potential level where the price could stabilize once again.
1st resistance: 1.1773
Supporting reasons: Identified as an overlap resistance, indicating a potential level that could cap further upward movement.
EUR/JPY:
Potential Direction: Bullish
Overall momentum of the chart: Bullish
The price could make a short-term pullback toward the pivot before rising again toward the 1st resistance
Pivot: 174.87
Supporting reasons: Identified as an overlap support, where renewed buying pressure could emerge to push the price higher.
1st support: 173.75
Supporting reasons: Identified as a pullback support, indicating a potential area where the price could again stabilize.
1st resistance: 176.71
Supporting reasons: Identified as a resistance that is supported by the 161.8% Fibonacci retracement, indicating a potential level that could cap further upward movement.
EUR/GBP:
Potential Direction: Bearish
Overall momentum of the chart: Bullish
The price could see a short-term pullback toward the pivot before continuing its bearish move down toward the 1st support.
Pivot: 0.8693
Supporting reasons: Identified as a pullback resistance, where selling pressures could intensify and potentially cap any upward retracement.
1st support: 0.8664
Supporting reasons: Identified as an overlap support that aligns with the 161.8% Fibonacci extension, indicating a potential area where the price could stabilize once more.
1st resistance: 0.8725
Supporting reasons: Identified as an overlap resistance, indicating a potential level that could cap further upward movement.
GBP/USD:
Potential Direction: Bearish
Overall momentum of the chart: Bearish
The price could see a short-term pullback toward the pivot before continuing its bearish move down toward the 1st support.
Pivot: 1.3534
Supporting reasons: Identified as an overlap resistance, where selling pressures could intensify and potentially cap any upward retracement.
1st support: 1.3402
Supporting reasons: Identified as a swing low support that aligns with the 61.8% Fibonacci retracement, indicating a potential area where the price could stabilize once more.
1st resistance: 1.3616
Supporting reasons: Identified as a pullback resistance, indicating a potential level that could halt further upward movement.
GBP/JPY:
Potential Direction: Bullish
Overall momentum of the chart: Bullish
The price could make a short-term pullback toward the pivot before rising again toward the 1st resistance
Pivot: 201.16
Supporting reasons: Identified as an overlap support, where renewed buying pressure could emerge to push the price higher.
1st support: 199.06
Supporting reasons: Identified as a pullback support, indicating a potential level where the price could stabilize once more.
1st resistance: 203.59
Supporting reasons: Identified as a resistance that is supported by the 161.8% Fiboancci extension, indicating a potential level that could halt further upward movement.
USD/CHF:
Potential Direction: Bullish
Overall momentum of the chart: Bullish
The price could make a short-term pullback toward the pivot before rising again toward the 1st resistance
Pivot: 0.7921
Supporting reasons: Identified as a pullback support, where renewed buying pressure could emerge to push the price higher.
1st support: 0.7854
Supporting reasons: Identified as a swing low support, indicating a potential level where the price could stabilize once again.
1st resistance: 0.8025
Supporting reasons: Identified as a pullback resistance t, indicating a potential level that could cap further upward movement.
USD/JPY:
Potential Direction: Bullish
Overall momentum of the chart: Bullish
The price could make a short-term pullback toward the pivot before rising again toward the 1st resistance
Pivot: 148.81
Supporting reasons: Identified as a pullback support, where renewed buying pressure could emerge to push the price higher.
1st support:147.54
Supporting reasons: Identified as a pullback support, indicating a strong area where buyers might return, and the price could stabilize once again.
1st resistance: 150.91
Supporting reasons: Identified as a swing high resistance. That aligns with the 127.2% Fibonacci extension. This level represents the next key area where upward movement could be capped amid increased selling pressure
USD/CAD:
Potential Direction: Bullish
Overall momentum of the chart: Bearish
The price could fall toward the pivot and make a bullish bounce off toward the 1st resistance.
Pivot: 1.3927
Supporting reasons: Identified as a pullback support, indicating a potential area where buying interest could pick up.
1st support: 1.3880
Supporting reasons: Identified as a pullback support that aligns closely with the 38.2% Fibonacci retracement, indicating a key level where the price could stabilize once more.
1st resistance: 1.3987
Supporting reasons: Identified as a swing high resistance, making it a possible target for bullish advances and a level where some sellers could return to cap gains
AUD/USD:
Potential Direction: Bearish
Overall momentum of the chart: Bullish
The price could see a short-term pullback toward the pivot before continuing its bearish move down toward the 1st support.
Pivot: 0.6631
Supporting reasons: Identified as a pullback resistance that is aligns with the 61.8% Fibonacci retracement, where selling pressures could intensify and potentially cap any upward retracement.
1st support: 0.6558
Supporting reasons: Identified as a pullback support, this area has provided strong support historically and may attract buying interest for a potential short-term bounce
1st resistance: 0.6685
Supporting reasons: Identified as a swing high resistance, indicating a potential area that could halt any further upward movement.
NZD/USD
Potential Direction: Bearish
Overall momentum of the chart: Bullish
The price could see a short-term pullback toward the pivot before continuing its bearish move down toward the 1st support.
Pivot: 0.5884
Supporting reasons: Identified as a pullback resistance that aligns with the 50.8% Fibonacci retracement, where selling pressures could intensify and potentially cap any upward retracement.
1st support: 0.5805
Supporting reasons: Identified as an overlap support, this area has provided strong support historically and may attract buying interest for a potential short-term bounce
1st resistance: 0.5951
Supporting reasons: Identified as a pullback resistance, indicating a potential area that could halt any further upward movement.
US30 (DJIA):
Potential Direction: Bullish
Overall momentum of the chart: Bullish
The price has already bounced off the pivot and could continue to make a bullish move toward the 1st resistance.
Pivot: 46,439.34
Supporting reasons: Identified as an overlap support, indicating a potential area where buying interest could pick up.
1st support: 45,125.00
Supporting reasons: Identified as an overlap support, suggesting a potential area where the price could stabilize once again.
1st resistance: 47,061.00
Supporting reasons: Identified as a swing high resistance, indicating a potential area that could halt any further upward movement.
DE40 (DAX):
Potential Direction: Bullish
Overall momentum of the chart: Bullish
The price could make a short-term pullback toward the pivot before rising again toward the 1st resistance
Pivot: 24,234.71
Supporting reasons: Identified as a pullback support, indicating a potential area where buying interest could pick up
1st support: 23,927.36
Supporting reasons: Identified as a pullback support, indicating a key level where the price could stabilize once more.
1st resistance: 24,533.15
Supporting reasons: Identified as a swing high resistance, indicating a potential area that could halt any further upward movement.
US500 (S&P 500):
Potential Direction: Bullish
Overall momentum of the chart: Bullish
The price could make a short-term pullback toward the pivot before rising again toward the 1st resistance
Pivot: 6,697.28
Supporting reasons: Identified as an overlap support, where renewed buying pressure could emerge to push the price higher.
1st support: 6,632.04
Supporting reasons: Identified as an overlap support, indicating a potential level where the price could stabilize once again.
1st resistance: 6,778.83
Supporting reasons: Identified as a resistance that is supported by the 161.8% Fibonacci extension, indicating a potential area that could halt any further upward movement.
BTC/USD (Bitcoin):
Potential Direction: Bullish
Overall momentum of the chart: Bullish
The price could make a short-term pullback toward the pivot before rising again toward the 1st resistance
Pivot: 122,726.88
Supporting reasons: Identified as an overlap support, where renewed buying pressure could emerge to push the price higher.
1st support: 119,223.37
Supporting reasons: Identified as a pullback support, indicating a potential level where the price could stabilize once more.
1st resistance: 126,282.29
Supporting reasons: Identified as a swing high resistance that aligns with the 161.8% Fibonacci projection, indicating a potential area that could halt any further upward movement.
ETH/USD (Ethereum):
Potential Direction: Bullish
Overall momentum of the chart: Bullish
The price could make a short-term pullback toward the pivot before rising again toward the 1st resistance
Pivot: 4,615.41
Supporting reasons: Identified as a pullback support, where renewed buying pressure could emerge to push the price higher.
1st support: 4,422.20
Supporting reasons: Identified as a pullback support, indicating a potential level where the price could stabilize once more.
1st resistance: 4,908.15
Supporting reasons: Identified as a swing high resistance, indicating a potential area that could halt any further upward movement.
WTI/USD (Oil):
Potential Direction: Bearish
Overall momentum of the chart: Bullish
The price could see a short-term pullback toward the pivot before continuing its bearish move down toward the 1st support.
Pivot: 62.15
Supporting reasons: Identified as a pullback resistance, where selling pressures could intensify and potentially cap any upward retracement.
1st support: 60.63
Supporting reasons: Identified as a support that is supported by the 127.2% Fibonacci extension, indicating a key level where the price could stabilize once more.
1st resistance: 63.15
Supporting reasons: Identified as a pullback resistance, indicating a potential area that could halt any further upward movement.
XAU/USD (GOLD):
Potential Direction: Bullish
Overall momentum of the chart: Bullish
The price could fall toward the pivot and make a bullish rise toward the 1st resistance.
Pivot: 3,889.12
Supporting reasons: Identified as a pullback support, indicating a potential area where buying interest could pick up.
1st support: 3,790.67
Supporting reasons: Identified as a pullback support, indicating a key level where the price could stabilize once more.
1st resistance: 4001.18
Supporting reasons: Identified as a resistance that is supported by the 100% Fibonacci projection, indicating a potential area that could halt any further upward movement.
The accuracy, completeness and timeliness of the information contained on this site cannot be guaranteed. IC Markets does not warranty, guarantee or make any representations, or assume any liability regarding financial results based on the use of the information in the site.
News, views, opinions, recommendations and other information obtained from sources outside of www.icmarkets.com, used in this site are believed to be reliable, but we cannot guarantee their accuracy or completeness. All such information is subject to change at any time without notice. IC Markets assumes no responsibility for the content of any linked site.
The fact that such links may exist does not indicate approval or endorsement of any material contained on any linked site. IC Markets is not liable for any harm caused by the transmission, through accessing the services or information on this site, of a computer virus, or other computer code or programming device that might be used to access, delete, damage, disable, disrupt or otherwise impede in any manner, the operation of the site or of any user’s software, hardware, data or property.
The post Tuesday 7th October 2025: Technical Outlook and Review first appeared on IC Markets | Official Blog.
Tuesday 7th October 2025: Asian Markets Mostly Higher Amid Fed Rate Cut Bets and Japanese Optimism
421980 October 7, 2025 15:00 ICMarkets Market News
Global Markets:
- Asian Stock Markets : Nikkei up 0.76%, Shanghai Composite up 0.52%, Hang Seng down 0.67% ASX down 0.33%
- Commodities : Gold at $3,954.90 (0.18%), Silver at $48.40 (0.07%), Brent Oil at $65.49 (0.4%), WTI Oil at $61.9 (0.4%)
- Rates : US 10-year yield at 4.162, UK 10-year yield at 4.735, Germany 10-year yield at 2.7174
News & Data:
- (EUR) Retail Sales m/m 0.1% to 0.1% expected
Markets Update:
Asian stock markets traded mostly higher on Tuesday, tracking mixed cues from Wall Street overnight, while markets in mainland China, Hong Kong, and South Korea remained closed for holidays. Traders continued to price in a 92.5% chance of a 25-basis-point rate cut by the U.S. Federal Reserve at its late-October meeting, amid the ongoing U.S. government shutdown.
In Australia, the S&P/ASX 200 slipped 0.23% to 8,960.60, dragged by weakness in financial and technology sectors. Among miners, BHP, Rio Tinto, and Mineral Resources gained nearly 1%, while Fortescue dipped 1%. Oil stocks were mixed, with Woodside Energy up 0.4% and Santos down nearly 1%. Tech names such as WiseTech Global and Appen fell over 1%. The Australian dollar traded at $0.662.
Japan’s Nikkei 225 rose 0.67% to 48,264.98, extending gains for a fourth session after Sanae Takaichi became Japan’s first female prime minister, boosting optimism over pro-market policies. Automakers led the rally, with Toyota up nearly 2%. Household spending data showed a 0.6% monthly and 2.3% annual rise in August, beating expectations.
Elsewhere in Asia, Taiwan gained 1.5%, while New Zealand, Singapore, and Indonesia advanced modestly. On Wall Street, the Nasdaq hit a record high, rising 0.7%, while oil prices climbed over 1% on signs of limited OPEC output growth.
Upcoming Events:
- 12:30 AM GMT – CAD Trade Balance
The post Tuesday 7th October 2025: Asian Markets Mostly Higher Amid Fed Rate Cut Bets and Japanese Optimism first appeared on IC Markets | Official Blog.
IC Markets Asia Fundamental Forecast | 07 October 2025
421979 October 7, 2025 14:39 ICMarkets Market News
IC Markets Asia Fundamental Forecast | 07 October 2025
What happened in the U.S. session?
Shutdown-driven data blackout kept traders focused on Fed communications while haven demand pushed gold above $3,900, oil firmed on a small OPEC+ hike, Treasury yields nudged up, and equity futures stayed positive; the biggest movers were gold, WTI, U.S. Treasuries, U.S. stock futures, and Bitcoin under the same macro narrative.
What does it mean for the Asia Session?
Tuesday’s Asian market trading will be guided by macro events such as the RBNZ rate decision, ongoing Japanese political changes, and updates from the ECB’s Lagarde later in the day. The US government shutdown continues to delay major economic releases, sustaining a cautious yet volatile trading environment across risk assets and major FX pairs.
The Dollar Index (DXY)
Key news events today
No major news event
What can we expect from DXY today?
The US Dollar starts the week consolidating after robust gains, with global risk sentiment, Fed policy outlook, and geopolitical uncertainties all playing major roles. The balance of strong data, slowing labor momentum, and persistent inflation will dictate the Dollar’s performance, with an eye on upcoming Fed statements and global event risks.
Central Bank Notes:
- The Federal Open Market Committee (FOMC) voted, by majority, to lower the federal funds rate target range by 25 basis points to 4.00%–4.25% at its September 16–17, 2025, meeting, marking the first policy rate adjustment since December 2024 after five consecutive holds.
- The Committee maintained its long-term objective of achieving maximum employment and 2% inflation, acknowledging recent labor market softening and continued tariff-driven price pressures.
- Policymakers expressed elevated concern about downside risks to growth, citing a stalling labor market, modest job creation, and an unemployment rate drifting up toward 4.4%. At the same time, inflation remains above target, with CPI at 3.2% and core inflation at 3.1% as of August 2025; higher energy and food prices, largely attributable to tariffs, continue to weigh on headline measures.
- Although economic activity expanded at a moderate pace in the third quarter, the growth outlook has weakened. Q3 GDP growth is estimated near 1.0% (annualized), with full-year 2025 GDP growth guidance revised to 1.2%, reflecting slowing household consumption and tighter financial conditions.
- In the updated Summary of Economic Projections, the unemployment rate is projected to average 4.5% for the year, with headline PCE inflation revised up slightly to 3.1% for 2025. The Committee anticipates core PCE inflation to remain stubborn, requiring sustained vigilance and a flexible approach to risk management.
- The Committee reiterated its data-dependent approach and openness to further adjustments should employment or inflation deviate meaningfully from current forecasts. Several members dissented, either advocating a larger 50-basis-point cut or preferring no adjustment at this meeting, revealing heightened divergence within the Committee.
- Balance sheet reduction continues at a measured pace. The monthly Treasury redemption cap remains at $5B and the agency MBS cap at $35B, as the Board aims to support orderly market conditions in the face of evolving global and domestic uncertainty.
- The next meeting is scheduled for 28 to 29 October 2025.
Next 24 Hours Bias
Weak Bullish
Gold (XAU)
Key news events today
No major news event
What can we expect from Gold today?
Gold’s record-setting rally is backed by safe-haven flows and dovish monetary policy expectations, but extreme overbought signals suggest caution for traders as volatility could increase if economic or policy surprises occur. Gold prices have surged to record highs, trading just under $4,000 per ounce amid global economic and political uncertainty, strong safe-haven demand, and expectations of further U.S. interest rate cuts.
Next 24 Hours Bias
Medium Bullish
The Australian Dollar (AUD)
Key news events today
No major news event
What can we expect from AUD today?
The Australian Dollar (AUD) is experiencing a mixture of stabilizing domestic factors and shifting global sentiment. The AUD/USD pair traded near 0.6593 on October 6, reflecting a marginal decline of 0.16% from the previous session and a 0.07% weakening over the past month. The currency remains range-bound, with technical resistance around 0.6610 and near-term targets above 0.6700 if global risk appetite holds.
Central Bank Notes:
- The RBA held its cash rate steady at 3.60% at its October meeting on 29–30 September 2025, marking a second consecutive pause after August’s 25 basis point cut. The move affirms the Bank’s data-dependent approach as inflation continues to trend within the target range.
- Inflation indicators remained stable through September, with headline CPI likely anchoring near 2.2%—comfortably within the 2–3% band. Insurance and housing costs remain sticky but are increasingly offset by moderation in discretionary goods.
- Trimmed mean inflation is estimated at around 2.8%, signaling underlying pressures remain contained. The Board continues to flag food and energy price volatility as short-term risks, though the broader disinflation narrative holds.
- Global conditions remain a source of uncertainty. U.S. policy expectations and uneven growth in China continue to weigh on commodities, even as trade disruptions have eased marginally since mid-year.
- Domestic growth shows resilience in the housing and services sectors, though manufacturing remains subdued. Household incomes have stabilized, but consumption remains only modest, capped by high borrowing costs.
- The labor market maintains relative tightness, though job growth has slowed notably since the first half of the year. Underutilization has ticked higher, but overall employment conditions remain supportive.
- Wage growth is plateauing, reflecting softer labour demand. Weak productivity continues to keep unit labour costs elevated, underscoring a medium-term concern highlighted repeatedly by the RBA.
- Household consumption prospects remain fragile. The combination of high rents and weak discretionary appetite suggests risks of a consumer-led slowdown in Q4 if confidence fails to rebound.
- The Board reiterated that subdued household spending poses risks to business sentiment and may dampen investment and job creation in the coming quarters.
- Monetary policy remains mildly restrictive. The RBA balanced confidence in inflation progress with caution around global and domestic demand risks, keeping further adjustments conditional on incoming data.
- The Bank reaffirmed its dual commitment to price stability and full employment, noting its readiness to act should conditions shift markedly.
- The next meeting is on 5 to 6 November 2025.
Next 24 Hours Bias
Weak Bullish
The Kiwi Dollar (NZD)
Key news events today
No major news event
What can we expect from NZD today?
The New Zealand Dollar is likely to remain muted today, focused on upcoming policy action and further economic releases, with traders watching for signs of either a confirmed breakout or deeper downside if sentiment sours further. The NZD remains under pressure as markets widely expect the Reserve Bank of New Zealand (RBNZ) to cut rates at its next meeting, with consensus predicting a reduction from 3.00% to 2.75%. This expectation has weighed on the currency, as cuts typically diminish investor appeal.
Central Bank Notes:
- The Monetary Policy Committee (MPC) agreed to cut the Official Cash Rate (OCR) by 25 basis points to 3.00% on 20 August 2025, marking a three-year low and continuing the easing cycle after July’s pause. The vote was split 4-2, with two members advocating a 50-basis-point cut, highlighting diverging views within the Committee.
- Policymakers indicated that significant uncertainty and a stalling economic recovery prompted this move, leaving the door open for further rate cuts later in the year, with a possible trough around 2.5% by December.
- Annual consumer price index inflation rose to 2.7% in the June quarter and is expected to reach 3% for the September quarter—at the upper end of the MPC’s 1 to 3% target band—but medium-term expectations remain anchored near the 2% midpoint.
- Despite the near-term uptick, headline inflation is projected to return toward 2% by mid-2026, as tradables inflation pressures ease and significant spare capacity continues to dampen domestic price momentum.
- Domestic financial conditions are broadly aligning with MPC expectations, as lower wholesale rates have translated into reduced borrowing costs for households. However, declining consumption and investment demand, higher unemployment, and subdued wage growth reflect ongoing economic slack.
- GDP growth stalled in the second quarter of 2025, contrasting with earlier projections. High-frequency indicators point to continued weakness driven by rising prices for essentials, weakening household savings, and constrained business lending.
- The MPC cautioned that ongoing global tariff uncertainties and policy shifts, especially recent changes in US trade regulations, could amplify market volatility and present both upside and downside risks to New Zealand’s recovery.
- Subject to medium-term inflation pressures continuing to ease as projected, the MPC signaled scope for further OCR cuts, possibly down to 2.5% by year-end, consistent with the latest Monetary Policy Statement outlook.
- The next meeting is on 22 October 2025.
Next 24 Hours Bias
Medium Bearish
The Japanese Yen (JPY)
Key news events today
No major news event
What can we expect from JPY today?
The Japanese Yen is under strong selling pressure entering primarily driven by political developments with the new LDP leader Sanae Takaichi, who is seen as favoring fiscal stimulus and looser monetary policy. This has led to expectations that the Bank of Japan will hold back on interest rate hikes, contributing to yen depreciation against major currencies, especially the US dollar. The yen’s weakness is coupled with cautious bets on incoming monetary policy changes and a mixed outlook on USD/JPY movements with potential short-term rebounds but overall downward pressure in the coming days.
Central Bank Notes:
- The Policy Board of the Bank of Japan decided on 17 September, by a unanimous vote, to set the following guidelines for money market operations for the inter-meeting period:
- The Bank will encourage the uncollateralized overnight call rate to remain at around 0.5%.
- The BOJ will continue its gradual reduction of monthly outright purchases of Japanese Government Bonds (JGBs). The scheduled amount of long-term government bond purchases remains unchanged from the prior decision, with a quarterly reduction pace of about ¥400 billion through March 2026 and about ¥200 billion per quarter from April to June 2026 onward, aiming for a purchase level near ¥2 trillion in January to March 2027.
- Japan’s economy continues to show a moderate recovery, with household consumption supported by rising incomes, although corporate activity has softened somewhat. Overseas economies remain on a moderate growth path, with the impact of global trade policies still weighing on Japan’s export and industrial production outlook.
- On the price front, the year-on-year rate of change in consumer prices (excluding fresh food) remains in the mid-3% range. Inflationary pressures remain broad-based, with persistent cost-push factors in food and energy, alongside solid wage pass-through. However, input cost pressures from past import surges are showing early signs of easing.
- Short-term inflation momentum may moderate as cost-push effects diminish, though rent increases and service-related price gains tied to labor shortages are likely to provide support. Inflation expectations among firms and households continue a gradual upward drift.
- Looking ahead, the economy is projected to grow at a slower-than-trend pace in the near term due to external demand softness and cautious corporate investment plans. However, accommodative financial conditions and steady increases in real labor income are expected to underpin domestic demand.
- In the medium term, as overseas economies recover and global trade stabilizes, Japan’s growth potential is likely to improve. With persistent labor market tightness and rising medium- to long-term inflation expectations, core inflation is projected to remain on a gradual upward trend, converging toward the 2% price stability target in the latter half of the projection horizon.
- The next meeting is scheduled for 30 to 31 October 2025.
Next 24 Hours Bias
Strong Bearish
Oil
Key news events today
API crude oil stock (8:30 pm GMT)
What can we expect from Oil today?
The latest developments for the oil market on Tuesday, October 7, 2025, revolve around OPEC+ announcing a modest increase in oil production by 137,000 barrels per day starting in November, the same increase as in October. This cautious move helped oil prices rise about 1-1.5% on Monday after some concerns over a potential supply glut. Brent crude oil was trading around $65.30 per barrel, and U.S. West Texas Intermediate crude around $61.59 per barrel.
Next 24 Hours Bias
Weak Bullish
The post IC Markets Asia Fundamental Forecast | 07 October 2025 first appeared on IC Markets | Official Blog.
IC Markets Europe Fundamental Forecast | 07 October 2025
421978 October 7, 2025 14:39 ICMarkets Market News
IC Markets Europe Fundamental Forecast | 07 October 2025
What happened in the Asia session?
Today’s Asia trading session was defined by ongoing bullish tech sentiment pushing Japanese equities and select Asian chipmakers to new highs, while fiscal and political developments weighed heavily on regional currencies and sovereign debt. The Japanese yen and government bonds saw particularly pronounced volatility as traders monitored fiscal policy debate and central bank guidance. Gold continued to benefit from safe-haven flows, underscoring persistent concerns over global political and economic stability
What does it mean for the Europe & US sessions?
Risk appetite remains mixed. Tech and crypto are rallying, but FX and rates markets show caution amid geopolitics and data risk. The dollar index hit a one-week high, the euro is under pressure, and traders are bracing for high intra-day volatility, especially in EUR/USD, USD/JPY, USD/CAD, and commodity-linked crosses. Traders should focus closely on today’s scheduled data prints and the evolving political headlines out of Japan and France for the next major catalyst in global markets.
The Dollar Index (DXY)
Key news events today
No major news event
What can we expect from DXY today?
The US dollar is trading cautiously on October 7th, driven by a blend of political uncertainty, persistent inflation risks, and careful Federal Reserve guidance. While the dollar index is holding firm, ongoing government shutdown fears and President Trump’s tariff agenda create volatile conditions, and currency traders are watching key data releases and central bank signals for the next move.
Central Bank Notes:
- The Federal Open Market Committee (FOMC) voted, by majority, to lower the federal funds rate target range by 25 basis points to 4.00%–4.25% at its September 16–17, 2025, meeting, marking the first policy rate adjustment since December 2024 after five consecutive holds.
- The Committee maintained its long-term objective of achieving maximum employment and 2% inflation, acknowledging recent labor market softening and continued tariff-driven price pressures.
- Policymakers expressed elevated concern about downside risks to growth, citing a stalling labor market, modest job creation, and an unemployment rate drifting up toward 4.4%. At the same time, inflation remains above target, with CPI at 3.2% and core inflation at 3.1% as of August 2025; higher energy and food prices, largely attributable to tariffs, continue to weigh on headline measures.
- Although economic activity expanded at a moderate pace in the third quarter, the growth outlook has weakened. Q3 GDP growth is estimated near 1.0% (annualized), with full-year 2025 GDP growth guidance revised to 1.2%, reflecting slowing household consumption and tighter financial conditions.
- In the updated Summary of Economic Projections, the unemployment rate is projected to average 4.5% for the year, with headline PCE inflation revised up slightly to 3.1% for 2025. The Committee anticipates core PCE inflation to remain stubborn, requiring sustained vigilance and a flexible approach to risk management.
- The Committee reiterated its data-dependent approach and openness to further adjustments should employment or inflation deviate meaningfully from current forecasts. Several members dissented, either advocating a larger 50-basis-point cut or preferring no adjustment at this meeting, revealing heightened divergence within the Committee.
- Balance sheet reduction continues at a measured pace. The monthly Treasury redemption cap remains at $5B and the agency MBS cap at $35B, as the Board aims to support orderly market conditions in the face of evolving global and domestic uncertainty
- The next meeting is scheduled for 28 to 29 October 2025.
Next 24 Hours Bias
Weak Bullish
Gold (XAU)
Key news events today
No major news event
What can we expect from Gold today?
Gold continues to outperform other assets in 2025, driven by safe-haven demand amid persistent geopolitical and macroeconomic risks, making it a focal point for global investors today. Gold has reached new record highs today, trading around $3,970–$3,976 per ounce in early session highs, fueled by continued safe-haven demand amid global economic and political uncertainties, strong expectations of further U.S. Federal Reserve rate cuts, and persistent buying by central banks and investors.
Next 24 Hours Bias
Strong Bullish
The Euro (EUR)
Key news events today
ECB President Lagarde Speaks(4:10 pm GMT)
What can we expect from EUR today?
The euro remains mostly range-bound but shows underlying support due to the Eurozone’s economic resilience, stable policy outlooks, and reduced expectations for ECB easing, even as external risks persist. The Euro declined slightly against the US dollar on trading around 1.1702, down 0.08% for the day. Over the past month, the euro has weakened by roughly 0.57%, but remains up 6.62% year-over-year. The market outlook remains cautiously optimistic with expectations that the euro could reach 1.19 by the end of the quarter, provided Eurozone economic momentum and an end to ECB rate cuts support the currency.
Central Bank Notes:
- The Governing Council kept the three key ECB interest rates unchanged at its meeting on September 11, 2025. The main refinancing rate remains at 2.15%, the marginal lending facility at 2.40%, and the deposit facility at 2.00%. These levels have been maintained after the cuts earlier in 2025, reflecting the Council’s confidence that the current stance is consistent with the price stability mandate.
- Evidence that inflation is running close to the ECB’s medium-term target of 2% supported the decision to hold rates steady. Domestic price pressures are easing as wage growth continues to moderate, and financing conditions remain accommodative. Policymakers reaffirmed a data-dependent, meeting-by-meeting approach to further policy moves, with no pre-commitment to a predetermined path amid ongoing global and domestic risks.
- Eurosystem staff projections foresee headline inflation averaging 2.0% for 2025, 1.8% for 2026, and 2.0% in 2027. The 2025 and 2026 forecasts reflect a downward revision, primarily on lower energy costs and exchange rate effects, even as food inflation remains persistent. Core inflation (excluding energy and food) is expected at 2.0% for 2026 and 2027, with only minor changes since prior rounds.
- Real GDP growth in the euro area is projected at 1.1% for 2025, 1.1% for 2026, and 1.4% for 2027. A robust first quarter—partly due to firms accelerating exports ahead of anticipated tariff hikes—cushioned a weaker outlook for the remainder of 2025. While business investment continues to face uncertainty from ongoing global trade disputes, especially with the US, government investment and infrastructure spending are expected to provide some support to the outlook..
- Rising real incomes and continued strength in the labor market boost household spending. Despite some fading tailwind from previous rate cuts, financing conditions remain broadly favorable and are expected to underpin the resilience of private consumption and investment against outside shocks. Moderating wage growth and profit margin adjustments are helping to absorb residual cost pressures.
- Rising real incomes and continued strength in the labor market boost household spending. Despite some fading tailwind from previous rate cuts, financing conditions remain broadly favorable and are expected to underpin the resilience of private consumption and investment against outside shocks. Moderating wage growth and profit margin adjustments are helping to absorb residual cost pressures.
- All future interest rate decisions will continue to be guided by the integrated assessment of economic and financial data, the inflation outlook, and underlying inflation dynamics, and the effectiveness of monetary policy transmission—without any pre-commitment to a specific future rate path.
- The ECB’s Asset Purchase Programme (APP) and Pandemic Emergency Purchase Programme (PEPP) portfolios are declining predictably, as maturities have ceased to be reinvested. Balance-sheet normalization continues in line with the ECB’s previously communicated schedule.
- The next meeting is on 29 to 30 October 2025
Next 24 Hours Bias
Weak Bearish
The Swiss Franc (CHF)
Key news events today
No major news event
What can we expect from CHF today?
The Swiss Franc remains relatively stable today, with limited volatility and a cautious outlook influenced by central bank policy, global tariffs, and ongoing risk sentiment in financial markets. The Swiss National Bank (SNB) continues to hold its key interest rate at zero following six consecutive cuts, while current CHF/USD movements reflect muted strength amid fading speculation about further rate cuts.
Central Bank Notes:
- The SNB maintained its key policy rate at 0% during its meeting on 25 September 2025, pausing a sequence of six consecutive rate cuts as inflation stabilized and the Swiss franc remained firm.
- Recent data showed a modest rebound in inflation, with Swiss consumer prices rising 0.2% year-on-year in August after staying above zero for three consecutive months; this helped alleviate fears of deflation that were mounting earlier in the year.
- The conditional inflation forecast remains broadly unchanged from June: headline inflation is expected to average 0.2% in 2025, 0.5% in 2026, and 0.7% in 2027. The risk of a negative rate move has diminished for now, but the SNB retains flexibility should inflationary pressures weaken again.
- The global economic outlook has deteriorated further, weighed down by heightened trade tensions—especially with the U.S.—and ongoing uncertainty in key Swiss export markets.
- Swiss GDP growth moderated in Q2 after a strong Q1 boosted by front-loaded U.S. exports. The SNB expects growth to slow and remain subdued, with forecasted GDP expansion between 1% and 1.5% in both 2025 and 2026.
- Labour market sentiment in the Swiss industrial sector has softened on concerns over export competitiveness and potential adjustments to production, but the overall growth outlook stays broadly unchanged
- The SNB reiterated its readiness to respond as needed if deflation risks re-emerge, emphasizing its commitment to medium-term price stability and a robust, transparent communication policy, with the introduction of more detailed monetary policy minutes beginning in October.
- The next meeting is on 11 December 2025.
Next 24 Hours Bias
Medium Bullish
The Pound (GBP)
Key news events today
No major news event
What can we expect from GBP today?
The Pound faces continued near-term volatility, with further fiscal and monetary policy updates awaited. Dollar strength, UK budget deficits, and risk sentiment are major factors influencing the GBP, while the yen’s political and monetary shifts present trading opportunities. The currency is facing moderate declines against the US dollar and euro, stabilizing against some other currencies, and setting fresh highs versus the Japanese yen.
Central Bank Notes:
- The Bank of England’s Monetary Policy Committee (MPC) voted on 18 September 2025 by a majority (expected split likely 7–2 or 6–3) to hold the Bank Rate steady at 4.00%, following the August rate cut. Most members cited persistent inflation and mixed indicators on growth and employment, while a minority favored further easing due to the cooling labor market and subdued GDP growth.
- The Committee decided to decrease the pace of quantitative tightening, planning to reduce the stock of UK government bond purchases by £67.5 billion over the next 12 months instead of the prior £100 billion pace, with the gilt balance now standing near £558 billion. This reflects increased volatility in bond markets and a shift to a more gradual approach.
- Headline inflation rose unexpectedly to 3.8% in July and is projected at 4% for September, above the Bank’s 2% target. Price pressures are driven by regulated energy costs and ongoing food price increases. While previous disinflation has been substantial, core inflation remains elevated and sticky.
- The MPC expects headline inflation to remain above target through Q4, with a resumption of the downward trend projected for early 2026 as energy and regulated price pressures abate. The Committee remains watchful for signs of persistent inflation despite previous policy tightening.
- UK GDP growth is stagnant, with business and consumer activity subdued. Recent labor market data show rising unemployment rates (now at 4.7%) and stabilizing wage growth (holding near 5%), indicating slack but continued wage price pressure. The Committee remains cautious amid lackluster demand and soft survey sentiment.
- Pay growth and employment indicators have moderated further, alongside confirmation from business surveys that pay settlements are slowing. The Committee expects wage growth to decelerate significantly through Q4 and the rest of 2025.
- Global uncertainty persists due to volatile energy prices, supply chain disruptions linked to Middle East conflicts, and renewed trade tensions. The MPC remains vigilant in tracking transmission of external cost/wage shocks to UK inflation.
- Risks to inflation are considered two-sided. While subdued domestic growth and softening labor activity suggest scope for easing, persistent inflation requires caution. The MPC anticipates a slow, gradual reduction path in rates, continuing its data-dependent approach with careful adjustment as warranted by economic developments.
- The Committee’s bias remains toward maintaining a restrictive monetary policy stance until firmer evidence emerges that inflation will return sustainably to the 2% target. All future decisions will remain highly data dependent, with a strong emphasis on evolving demand, inflation expectations, costs, and labor market conditions.
- The next meeting is on 6 November 2025.
Next 24 Hours Bias
Weak Bearish
The Canadian Dollar (CAD)
Key news events today
Ivey PMI (2:00 pm GMT)
What can we expect from CAD today?
Today, the Canadian Dollar remains under pressure due to persistent domestic economic weakness, falling industrial activity, and subdued oil prices. The market is wary of further Bank of Canada rate cuts, which have contributed to its recent losses versus the US Dollar. The outlook remains cautious, with ongoing volatility likely as economic data and central bank signals unfold.
Central Bank Notes:
- The Council cited continued U.S. tariff volatility and slow progress on trade negotiations as major contributors to ongoing uncertainty. While headline tariffs have not escalated further, the unpredictability of U.S. policy remains a significant risk for Canadian exports and business confidence.
- Uncertainty about U.S. trade policy and recurring tariff threats continued to weigh on growth prospects. The Bank flagged downside risks to the export sector, with survey data indicating ongoing hesitancy among manufacturers and exporters.
- After modest growth in Q1, Canada’s economy slipped into contraction, with GDP shrinking by 0.8% in Q2 and forecast to decrease again by 0.8% in Q3. Economic weakness has been most pronounced in manufacturing and goods-producing sectors affected by trade frictions and softer U.S. demand.
- Early estimates show that growth stabilized in September but remained well below the Bank’s 2% forecast for Q4. Manufacturing output has improved slightly—supported by a modest rebound in petroleum and mining activity—while consumer spending and retail sales were largely flat.
- Consumer spending remained subdued as households continued to limit discretionary purchases amid uncertainty and a slower job market. Housing activity stayed weak, despite earlier government efforts to boost affordability and modest gains in some real estate segments.
- Headline CPI inflation edged up to 1.9% in August, undershooting economist expectations but still showing emerging pressures from shelter and imported goods costs. Core inflation metrics were mixed, though price growth remains just below the Bank’s 2% target.
- The Governing Council reaffirmed its cautious approach, emphasizing that while further rate cuts are possible, the pace will hinge on the path of U.S. tariffs, domestic inflation dynamics, and signs of a sustainable recovery. The Bank remains vigilant against the risk of inflation falling below target in the face of economic slack.
- The next meeting is on 29 October 2025.
Next 24 Hours Bias
Medium Bearish
Oil
Key news events today
API crude oil stock (8:30 pm GMT)
What can we expect from Oil today?
Oil prices are steady following OPEC+’s cautious approach, but the balance between new supply, potential disruptions, and demand uncertainty keeps the market on edge. The ongoing Russia-Ukraine conflict continues to influence market sentiment, with a recent drone attack and fire at Russia’s Kirishi refinery halting its most efficient unit, potentially reducing supply in the coming weeks.
Next 24 Hours Bias
Weak Bearish
The post IC Markets Europe Fundamental Forecast | 07 October 2025 first appeared on IC Markets | Official Blog.
Ex-Dividend 7/10/2025
421976 October 7, 2025 06:39 ICMarkets Market News
The post Ex-Dividend 7/10/2025 first appeared on IC Markets | Official Blog.
IC Markets Europe Fundamental Forecast | 06 October 2025
421975 October 6, 2025 15:14 ICMarkets Market News
IC Markets Europe Fundamental Forecast | 06 October 2025
What happened in the Asia session?
The Asia session was characterized by a significant political risk premium in Japanese assets, with the yen weakening and stocks rallying on expectations of continued fiscal stimulus. Meanwhile, US political uncertainty and delayed economic data benefited safe-haven assets like gold. The commodity complex showed strength, with both precious metals and energy prices advancing.
What does it mean for the Europe & US sessions?
Today’s trading sessions face a unique confluence of factors: continued U.S. government shutdown limiting crucial economic data, significant central bank speeches from the ECB and BOE, Japanese market euphoria following political developments, and ongoing speculation about Federal Reserve policy direction. The absence of traditional economic indicators forces markets to rely more heavily on private sector data and policymaker guidance, creating an environment of heightened sensitivity to any official communications.
The Dollar Index (DXY)
Key news events today
No major news event
What can we expect from DXY today?
The US dollar faces mounting pressure on multiple fronts. The ongoing government shutdown has disrupted critical economic data flow, while weak services sector data and deteriorating labor market conditions are reinforcing expectations for aggressive Federal Reserve rate cuts. Market participants are pricing in near-certain rate reductions in both October and December, contributing to dollar weakness despite a modest recovery in the DXY index. The prolonged political impasse in Washington adds a layer of uncertainty, with experts warning of potential structural impacts on dollar demand if the shutdown extends significantly beyond previous historical precedents.
Central Bank Notes:
- The Federal Open Market Committee (FOMC) voted, by majority, to lower the federal funds rate target range by 25 basis points to 4.00%–4.25% at its September 16–17, 2025, meeting, marking the first policy rate adjustment since December 2024 after five consecutive holds.
- The Committee maintained its long-term objective of achieving maximum employment and 2% inflation, acknowledging recent labor market softening and continued tariff-driven price pressures.
- Policymakers expressed elevated concern about downside risks to growth, citing a stalling labor market, modest job creation, and an unemployment rate drifting up toward 4.4%. At the same time, inflation remains above target, with CPI at 3.2% and core inflation at 3.1% as of August 2025; higher energy and food prices, largely attributable to tariffs, continue to weigh on headline measures.
- Although economic activity expanded at a moderate pace in the third quarter, the growth outlook has weakened. Q3 GDP growth is estimated near 1.0% (annualized), with full-year 2025 GDP growth guidance revised to 1.2%, reflecting slowing household consumption and tighter financial conditions.
- In the updated Summary of Economic Projections, the unemployment rate is projected to average 4.5% for the year, with headline PCE inflation revised up slightly to 3.1% for 2025. The Committee anticipates core PCE inflation to remain stubborn, requiring sustained vigilance and a flexible approach to risk management.
- The Committee reiterated its data-dependent approach and openness to further adjustments should employment or inflation deviate meaningfully from current forecasts. Several members dissented, either advocating a larger 50-basis-point cut or preferring no adjustment at this meeting, revealing heightened divergence within the Committee.
- Balance sheet reduction continues at a measured pace. The monthly Treasury redemption cap remains at $5B and the agency MBS cap at $35B, as the Board aims to support orderly market conditions in the face of evolving global and domestic uncertainty
- The next meeting is scheduled for 28 to 29 October 2025.
Next 24 Hours Bias
Weak Bearish
Gold (XAU)
Key news events today
No major news event
What can we expect from Gold today?
Monday marked a historic milestone for gold as it surpassed $3,900 per ounce for the first time, driven by a confluence of factors including the ongoing US government shutdown, aggressive Federal Reserve rate cut expectations, and sustained institutional demand. The precious metal’s 47.84% year-to-date performance reflects a perfect storm of safe-haven demand, dollar weakness, and structural shifts in central bank reserve management. With strong ETF inflows, continued central bank buying, and resilient physical demand despite elevated prices, gold appears well-positioned for further gains toward the $4,000 milestone that many analysts believe could be reached within months.
Next 24 Hours Bias
Medium Bullish
The Euro (EUR)
Key news events today
ECB President Lagarde Speaks(5:00 pm GMT)
What can we expect from EUR today?
The euro is experiencing a period of relative stability following the ECB’s hawkish pivot in September. With inflation running slightly above target and the central bank signaling an end to its easing cycle, attention focuses on today’s retail sales data and President Lagarde’s evening address to the European Parliament. The currency’s medium-term outlook appears cautiously optimistic, supported by the ECB’s policy stance divergence from the Fed and the eurozone’s resilience to trade tensions, though growth challenges persist across major economies like Germany and France.
Central Bank Notes:
- The Governing Council kept the three key ECB interest rates unchanged at its September 11, 2025, meeting. The main refinancing rate remains at 2.15%, the marginal lending facility at 2.40%, and the deposit facility at 2.00%. These levels have been maintained after the cuts earlier in 2025, reflecting the Council’s confidence that the current stance is consistent with the price stability mandate.
- Evidence that inflation is running close to the ECB’s medium-term target of 2% supported the decision to hold rates steady. Domestic price pressures are easing as wage growth continues to moderate, and financing conditions remain accommodative. Policymakers reaffirmed a data-dependent, meeting-by-meeting approach to further policy moves, with no pre-commitment to a predetermined path amid ongoing global and domestic risks.
- Eurosystem staff projections foresee headline inflation averaging 2.0% for 2025, 1.8% for 2026, and 2.0% in 2027. The 2025 and 2026 forecasts reflect a downward revision, primarily on lower energy costs and exchange rate effects, even as food inflation remains persistent. Core inflation (excluding energy and food) is expected at 2.0% for 2026 and 2027, with only minor changes since prior rounds.
- Real GDP growth in the euro area is projected at 1.1% for 2025, 1.1% for 2026, and 1.4% for 2027. A robust first quarter—partly due to firms accelerating exports ahead of anticipated tariff hikes—cushioned a weaker outlook for the remainder of 2025. While business investment continues to face uncertainty from ongoing global trade disputes, especially with the US, government investment and infrastructure spending are expected to provide some support to the outlook..
- Rising real incomes and continued strength in the labor market boost household spending. Despite some fading tailwind from previous rate cuts, financing conditions remain broadly favorable and are expected to underpin the resilience of private consumption and investment against outside shocks. Moderating wage growth and profit margin adjustments are helping to absorb residual cost pressures.
- Rising real incomes and continued strength in the labor market boost household spending. Despite some fading tailwind from previous rate cuts, financing conditions remain broadly favorable and are expected to underpin the resilience of private consumption and investment against outside shocks. Moderating wage growth and profit margin adjustments are helping to absorb residual cost pressures.
- All future interest rate decisions will continue to be guided by the integrated assessment of economic and financial data, the inflation outlook, and underlying inflation dynamics, and the effectiveness of monetary policy transmission—without any pre-commitment to a specific future rate path.
- The ECB’s Asset Purchase Programme (APP) and Pandemic Emergency Purchase Programme (PEPP) portfolios are declining predictably, as maturities have ceased to be reinvested. Balance-sheet normalization continues in line with the ECB’s previously communicated schedule.
- The next meeting is on 29 to 30 October 2025
Next 24 Hours Bias
Weak Bullish
The Swiss Franc (CHF)
Key news events today
No major news event
What can we expect from CHF today?
The Swiss franc enters from a position of considerable strength, supported by persistent safe-haven flows, contained inflation pressures, and a more measured approach to currency intervention from the SNB. While the central bank demonstrated its willingness to act decisively when necessary through its Q2 intervention activity, the franc’s continued appreciation suggests market forces remain dominant. With USD/CHF trading near multi-year lows and inflation remaining well-contained, the franc’s outperformance trajectory appears likely to continue absent significant policy shifts or external shocks.
Central Bank Notes:
- The SNB maintained its key policy rate at 0% during its meeting on 25 September 2025, pausing a sequence of six consecutive rate cuts as inflation stabilized and the Swiss franc remained firm.
- Recent data showed a modest rebound in inflation, with Swiss consumer prices rising 0.2% year-on-year in August after staying above zero for three consecutive months; this helped alleviate fears of deflation that were mounting earlier in the year.
- The conditional inflation forecast remains broadly unchanged from June: headline inflation is expected to average 0.2% in 2025, 0.5% in 2026, and 0.7% in 2027. The risk of a negative rate move has diminished for now, but the SNB retains flexibility should inflationary pressures weaken again.
- The global economic outlook has deteriorated further, weighed down by heightened trade tensions—especially with the U.S.—and ongoing uncertainty in key Swiss export markets.
- Swiss GDP growth moderated in Q2 after a strong Q1 boosted by front-loaded U.S. exports. The SNB expects growth to slow and remain subdued, with forecasted GDP expansion between 1% and 1.5% in both 2025 and 2026.
- Labour market sentiment in the Swiss industrial sector has softened on concerns over export competitiveness and potential adjustments to production, but the overall growth outlook stays broadly unchanged
- The SNB reiterated its readiness to respond as needed if deflation risks re-emerge, emphasizing its commitment to medium-term price stability and a robust, transparent communication policy, with the introduction of more detailed monetary policy minutes beginning in October.
- The next meeting is on 11 December 2025.
Next 24 Hours Bias
Medium Bullish
The Pound (GBP)
Key news events today
BOE Gov Bailey Speaks (5:30 pm GMT)
What can we expect from GBP today?
The Pound Sterling enters Monday in a relatively stable position, supported by hawkish BoE rhetoric and US Dollar weakness. Key focus areas include Governor Bailey’s evening speech, upcoming inflation data on October 22, and the critical Autumn Budget on November 26. While technical indicators suggest potential for further gains toward 1.40, the currency faces headwinds from persistent inflation, Brexit-related productivity challenges, and political uncertainty surrounding potential tax increases. The BoE’s cautious approach to rate cuts, combined with the government’s fiscal constraints, creates a complex backdrop for Sterling’s near-term performance.
Central Bank Notes:
- The Bank of England’s Monetary Policy Committee (MPC) voted on 18 September 2025 by a majority (expected split likely 7–2 or 6–3) to hold the Bank Rate steady at 4.00%, following the August rate cut. Most members cited persistent inflation and mixed indicators on growth and employment, while a minority favored further easing due to the cooling labor market and subdued GDP growth.
- The Committee decided to decrease the pace of quantitative tightening, planning to reduce the stock of UK government bond purchases by £67.5 billion over the next 12 months instead of the prior £100 billion pace, with the gilt balance now standing near £558 billion. This reflects increased volatility in bond markets and a shift to a more gradual approach.
- Headline inflation rose unexpectedly to 3.8% in July and is projected at 4% for September, above the Bank’s 2% target. Price pressures are driven by regulated energy costs and ongoing food price increases. While previous disinflation has been substantial, core inflation remains elevated and sticky.
- The MPC expects headline inflation to remain above target through Q4, with a resumption of the downward trend projected for early 2026 as energy and regulated price pressures abate. The Committee remains watchful for signs of persistent inflation despite previous policy tightening.
- UK GDP growth is stagnant, with business and consumer activity subdued. Recent labor market data show rising unemployment rates (now at 4.7%) and stabilizing wage growth (holding near 5%), indicating slack but continued wage price pressure. The Committee remains cautious amid lackluster demand and soft survey sentiment.
- Pay growth and employment indicators have moderated further, alongside confirmation from business surveys that pay settlements are slowing. The Committee expects wage growth to decelerate significantly through Q4 and the rest of 2025.
- Global uncertainty persists due to volatile energy prices, supply chain disruptions linked to Middle East conflicts, and renewed trade tensions. The MPC remains vigilant in tracking transmission of external cost/wage shocks to UK inflation.
- Risks to inflation are considered two-sided. While subdued domestic growth and softening labor activity suggest scope for easing, persistent inflation requires caution. The MPC anticipates a slow, gradual reduction path in rates, continuing its data-dependent approach with careful adjustment as warranted by economic developments.
- The Committee’s bias remains toward maintaining a restrictive monetary policy stance until firmer evidence emerges that inflation will return sustainably to the 2% target. All future decisions will remain highly data dependent, with a strong emphasis on evolving demand, inflation expectations, costs, and labor market conditions.
- The next meeting is on 6 November 2025.
Next 24 Hours Bias
Weak Bullish
The Canadian Dollar (CAD)
Key news events today
No major news event
What can we expect from CAD today?
CAD is soft to start Oct 6, trading near 1.395 per USD as weak domestic activity and softer crude reinforce expectations for additional BoC easing ahead of the Oct 29 decision. BoC minutes point to the return of baseline projections in the October MPR, keeping focus on Friday’s jobs report to shape cut odds. Strategists see potential CAD recovery over a 12‑month horizon if Fed cuts weaken the USD, but near‑term risks remain skewed against CAD until domestic data turns and oil stabilizes.
Central Bank Notes:
- The Council cited continued U.S. tariff volatility and slow progress on trade negotiations as major contributors to ongoing uncertainty. While headline tariffs have not escalated further, the unpredictability of U.S. policy remains a significant risk for Canadian exports and business confidence.
- Uncertainty about U.S. trade policy and recurring tariff threats continued to weigh on growth prospects. The Bank flagged downside risks to the export sector, with survey data indicating ongoing hesitancy among manufacturers and exporters.
- After modest growth in Q1, Canada’s economy slipped into contraction, with GDP shrinking by 0.8% in Q2 and forecast to decrease again by 0.8% in Q3. Economic weakness has been most pronounced in manufacturing and goods-producing sectors affected by trade frictions and softer U.S. demand.
- Early estimates show that growth stabilized in September but remained well below the Bank’s 2% forecast for Q4. Manufacturing output has improved slightly—supported by a modest rebound in petroleum and mining activity—while consumer spending and retail sales were largely flat.
- Consumer spending remained subdued as households continued to limit discretionary purchases amid uncertainty and a slower job market. Housing activity stayed weak, despite earlier government efforts to boost affordability and modest gains in some real estate segments.
- Headline CPI inflation edged up to 1.9% in August, undershooting economist expectations but still showing emerging pressures from shelter and imported goods costs. Core inflation metrics were mixed, though price growth remains just below the Bank’s 2% target.
- The Governing Council reaffirmed its cautious approach, emphasizing that while further rate cuts are possible, the pace will hinge on the path of U.S. tariffs, domestic inflation dynamics, and signs of a sustainable recovery. The Bank remains vigilant against the risk of inflation falling below target in the face of economic slack.
- The next meeting is on 29 October 2025.
Next 24 Hours Bias
Weak Bearish
Oil
Key news events today
No major news event
What can we expect from Oil today?
Oil markets showed resilience on Monday, October 6, 2025, with prices gaining around 1% following OPEC+’s decision to limit November production increases to 137,000 bpd rather than the feared 500,000 bpd hike. However, underlying fundamentals remain challenging, with global crude exports hitting record highs and supply growth significantly outpacing demand increases. Ukrainian attacks on Russian energy infrastructure continue to provide geopolitical support, but the market faces mounting oversupply pressures that could drive prices significantly lower in the coming months. The delicate balance between OPEC+ production restraint and market share recovery efforts will be critical for price stability through the remainder of 2025.
Next 24 Hours Bias
Medium Bearish
The post IC Markets Europe Fundamental Forecast | 06 October 2025 first appeared on IC Markets | Official Blog.
IC Markets Asia Fundamental Forecast | 06 October 2025
421974 October 6, 2025 15:05 ICMarkets Market News
IC Markets Asia Fundamental Forecast | 06 October 2025
What happened in the U.S. session?
The U.S. financial markets overnight remained influenced by potential government shutdown risks and their impact on economic data flow, combined with ongoing Fed communications and key corporate earnings. Safe-haven assets like gold and Treasury bonds gained, while equities maintained strength, supported by strong Q3 corporate prospects. The dollar softened, and Bitcoin rose notably. Upcoming Fed minutes and consumer data will remain focal points for market direction in the near term.
What does it mean for the Asia Session?
Asian traders should closely monitor several key developments. The most significant scheduled events are high-impact speeches from ECB President Christine Lagarde and Bank of England Governor Andrew Bailey. Additionally, major developments in the Japanese market, US government shutdown-related data delays, and record rallies in Asian equities and gold are likely to shape trading sentiment throughout the day.
The Dollar Index (DXY)
Key news events today
No major news event
What can we expect from DXY today?
The US Dollar is under pressure today, amid ongoing concerns about the US government shutdown, delayed economic data, and signals of a weaker labor market. This uncertainty is driving cautious sentiment in the forex markets and shaping expectations for Federal Reserve policy going forward. The dollar is broadly soft at the start of this week, hampered by US government shutdown uncertainty, weaker jobs data, and a dovish Fed outlook, with major upside risks highly event-dependent.
Central Bank Notes:
- The Federal Open Market Committee (FOMC) voted, by majority, to lower the federal funds rate target range by 25 basis points to 4.00%–4.25% at its September 16–17, 2025, meeting, marking the first policy rate adjustment since December 2024 after five consecutive holds.
- The Committee maintained its long-term objective of achieving maximum employment and 2% inflation, acknowledging recent labor market softening and continued tariff-driven price pressures.
- Policymakers expressed elevated concern about downside risks to growth, citing a stalling labor market, modest job creation, and an unemployment rate drifting up toward 4.4%. At the same time, inflation remains above target, with CPI at 3.2% and core inflation at 3.1% as of August 2025; higher energy and food prices, largely attributable to tariffs, continue to weigh on headline measures.
- Although economic activity expanded at a moderate pace in the third quarter, the growth outlook has weakened. Q3 GDP growth is estimated near 1.0% (annualized), with full-year 2025 GDP growth guidance revised to 1.2%, reflecting slowing household consumption and tighter financial conditions.
- In the updated Summary of Economic Projections, the unemployment rate is projected to average 4.5% for the year, with headline PCE inflation revised up slightly to 3.1% for 2025. The Committee anticipates core PCE inflation to remain stubborn, requiring sustained vigilance and a flexible approach to risk management.
- The Committee reiterated its data-dependent approach and openness to further adjustments should employment or inflation deviate meaningfully from current forecasts. Several members dissented, either advocating a larger 50-basis-point cut or preferring no adjustment at this meeting, revealing heightened divergence within the Committee.
- Balance sheet reduction continues at a measured pace. The monthly Treasury redemption cap remains at $5B and the agency MBS cap at $35B, as the Board aims to support orderly market conditions in the face of evolving global and domestic uncertainty.
- The next meeting is scheduled for 28 to 29 October 2025.
Next 24 Hours Bias
Weak Bullish
Gold (XAU)
Key news events today
No major news event
What can we expect from Gold today?
Gold is trading near $3,900 per ounce—an all-time high, propelled by safe-haven buying in response to US political turmoil and Fed policy expectations. While technical analysts anticipate possible short-term corrections, the broader outlook remains strongly bullish heading into year-end. Gold prices surged to another historic high on surpassing $3,900 per ounce, as safe-haven demand intensified amid a prolonged US government shutdown and strong expectations for further US Federal Reserve rate cuts. The rally continues a bullish trend, with gold up nearly 48% year-to-date, driven by central bank buying, investor inflows into gold-backed ETFs, and macroeconomic uncertainty.
Next 24 Hours Bias
Medium Bullish
The Australian Dollar (AUD)
Key news events today
No major news event
What can we expect from AUD today?
The Australian Dollar (AUD) began the week of trading slightly lower, with recent market action reflecting both global and domestic influences. The Reserve Bank of Australia (RBA) maintained its cash rate at 3.6% last week, signaling a cautious, data-dependent stance as inflation hovers near the top of its target range. The AUD/USD pair is trading near 0.6600, showing weakness after minor gains in the previous sessions, and analysts expect a test of resistance at 0.6665 before a possible decline later in the week.
Central Bank Notes:
- The RBA held its cash rate steady at 3.60% at its October meeting on 29–30 September 2025, marking a second consecutive pause after August’s 25 basis point cut. The move affirms the Bank’s data-dependent approach as inflation continues to trend within the target range.
- Inflation indicators remained stable through September, with headline CPI likely anchoring near 2.2%—comfortably within the 2–3% band. Insurance and housing costs remain sticky but are increasingly offset by moderation in discretionary goods.
- Trimmed mean inflation is estimated at around 2.8%, signaling underlying pressures remain contained. The Board continues to flag food and energy price volatility as short-term risks, though the broader disinflation narrative holds.
- Global conditions remain a source of uncertainty. U.S. policy expectations and uneven growth in China continue to weigh on commodities, even as trade disruptions have eased marginally since mid-year.
- Domestic growth shows resilience in the housing and services sectors, though manufacturing remains subdued. Household incomes have stabilized, but consumption remains only modest, capped by high borrowing costs.
- The labor market maintains relative tightness, though job growth has slowed notably since the first half of the year. Underutilization has ticked higher, but overall employment conditions remain supportive.
- Wage growth is plateauing, reflecting softer labour demand. Weak productivity continues to keep unit labour costs elevated, underscoring a medium-term concern highlighted repeatedly by the RBA.
- Household consumption prospects remain fragile. The combination of high rents and weak discretionary appetite suggests risks of a consumer-led slowdown in Q4 if confidence fails to rebound.
- The Board reiterated that subdued household spending poses risks to business sentiment and may dampen investment and job creation in the coming quarters.
- Monetary policy remains mildly restrictive. The RBA balanced confidence in inflation progress with caution around global and domestic demand risks, keeping further adjustments conditional on incoming data.
- The Bank reaffirmed its dual commitment to price stability and full employment, noting its readiness to act should conditions shift markedly.
- The next meeting is on 5 to 6 November 2025.
Next 24 Hours Bias
Weak Bullish
The Kiwi Dollar (NZD)
Key news events today
No major news event
What can we expect from NZD today?
The New Zealand Dollar continues to face significant headwinds entering the week of with traders positioning for further rate cuts and remaining cautious due to global and domestic uncertainties. The NZD is expected to remain range-bound unless a clear catalyst emerges. The New Zealand Dollar (NZD) has started the week on a soft note, facing continued downward pressure amid anticipation of potential rate cuts from the Reserve Bank of New Zealand (RBNZ), recent weak domestic economic data, and persistent global risk aversion.
Central Bank Notes:
- The Monetary Policy Committee (MPC) agreed to cut the Official Cash Rate (OCR) by 25 basis points to 3.00% on 20 August 2025, marking a three-year low and continuing the easing cycle after July’s pause. The vote was split 4-2, with two members advocating a 50-basis-point cut, highlighting diverging views within the Committee.
- Policymakers indicated that significant uncertainty and a stalling economic recovery prompted this move, leaving the door open for further rate cuts later in the year, with a possible trough around 2.5% by December.
- Annual consumer price index inflation rose to 2.7% in the June quarter and is expected to reach 3% for the September quarter—at the upper end of the MPC’s 1 to 3% target band—but medium-term expectations remain anchored near the 2% midpoint.
- Despite the near-term uptick, headline inflation is projected to return toward 2% by mid-2026, as tradables inflation pressures ease and significant spare capacity continues to dampen domestic price momentum.
- Domestic financial conditions are broadly aligning with MPC expectations, as lower wholesale rates have translated into reduced borrowing costs for households. However, declining consumption and investment demand, higher unemployment, and subdued wage growth reflect ongoing economic slack.
- GDP growth stalled in the second quarter of 2025, contrasting with earlier projections. High-frequency indicators point to continued weakness driven by rising prices for essentials, weakening household savings, and constrained business lending.
- The MPC cautioned that ongoing global tariff uncertainties and policy shifts, especially recent changes in US trade regulations, could amplify market volatility and present both upside and downside risks to New Zealand’s recovery.
- Subject to medium-term inflation pressures continuing to ease as projected, the MPC signaled scope for further OCR cuts, possibly down to 2.5% by year-end, consistent with the latest Monetary Policy Statement outlook.
- The next meeting is on 22 October 2025.
Next 24 Hours Bias
Medium Bearish
The Japanese Yen (JPY)
Key news events today
No major news event
What can we expect from JPY today?
The yen is notably weaker today due to political shifts favoring continued expansionary economic policy, which has sparked a historic Japanese stock market rally and led to reduced expectations for BOJ interest rate increases. Investors are watching for further moves in USD/JPY, bond yields, and BOJ policy signals in light of Takaichi’s leadership win. The significant depreciation of the yen has coincided with a historic rally in Japanese equities, as investors expect ongoing aggressive monetary easing and substantial fiscal spending.
Central Bank Notes:
- The Policy Board of the Bank of Japan decided on 17 September, by a unanimous vote, to set the following guidelines for money market operations for the inter-meeting period:
- The Bank will encourage the uncollateralized overnight call rate to remain at around 0.5%.
- The BOJ will continue its gradual reduction of monthly outright purchases of Japanese Government Bonds (JGBs). The scheduled amount of long-term government bond purchases remains unchanged from the prior decision, with a quarterly reduction pace of about ¥400 billion through March 2026 and about ¥200 billion per quarter from April to June 2026 onward, aiming for a purchase level near ¥2 trillion in January to March 2027.
- Japan’s economy continues to show a moderate recovery, with household consumption supported by rising incomes, although corporate activity has softened somewhat. Overseas economies remain on a moderate growth path, with the impact of global trade policies still weighing on Japan’s export and industrial production outlook.
- On the price front, the year-on-year rate of change in consumer prices (excluding fresh food) remains in the mid-3% range. Inflationary pressures remain broad-based, with persistent cost-push factors in food and energy, alongside solid wage pass-through. However, input cost pressures from past import surges are showing early signs of easing.
- Short-term inflation momentum may moderate as cost-push effects diminish, though rent increases and service-related price gains tied to labor shortages are likely to provide support. Inflation expectations among firms and households continue a gradual upward drift.
- Looking ahead, the economy is projected to grow at a slower-than-trend pace in the near term due to external demand softness and cautious corporate investment plans. However, accommodative financial conditions and steady increases in real labor income are expected to underpin domestic demand.
- In the medium term, as overseas economies recover and global trade stabilizes, Japan’s growth potential is likely to improve. With persistent labor market tightness and rising medium- to long-term inflation expectations, core inflation is projected to remain on a gradual upward trend, converging toward the 2% price stability target in the latter half of the projection horizon.
- The next meeting is scheduled for 30 to 31 October 2025.
Next 24 Hours Bias
Strong Bearish
Oil
Key news events today
No major news event
What can we expect from Oil today?
Monday’s oil market rally was driven by relief that OPEC+ chose a conservative production increase rather than the more aggressive supply additions many traders had feared. While the 137,000 barrel per day increase for November provides some supply cushion, it falls well short of the potential market disruptions needed to significantly alter the fundamental supply-demand balance.
Next 24 Hours Bias
Weak Bullish
The post IC Markets Asia Fundamental Forecast | 06 October 2025 first appeared on IC Markets | Official Blog.
Monday 6th October 2025: Asian Stocks Mixed in Holiday Trade; Japan Hits Record High, Gold Surges
421973 October 6, 2025 15:05 ICMarkets Market News
Global Markets:
- Asian Stock Markets : Nikkei up 4.48%, Shanghai Composite up 0.52%, Hang Seng down 0.69% ASX down 0.11%
- Commodities : Gold at $3,954.90 (1.18%), Silver at $48.40 (1.07%), Brent Oil at $65.49 (1.4%), WTI Oil at $61.9 (1.4%)
- Rates : US 10-year yield at 4.152, UK 10-year yield at 4.6934, Germany 10-year yield at 2.7000
News & Data:
- (USD) ISM Services PMI 50.0 to 51.8 expected
Markets Update:
Asian markets traded mixed in thin holiday sessions on Monday, with Japan standing out after the election of fiscal dove Sanae Takaichi as leader of the ruling party. Japan’s Nikkei index surged 4.5 percent to a record high, supported by plunging bond yields and a weaker yen, which slipped 1.5 percent to 150 per dollar.
China and South Korea remained closed for holidays, while other regional markets edged lower amid concerns over U.S. President Donald Trump’s tariff stance and pressure on the Federal Reserve’s independence. Hong Kong’s Hang Seng fell 0.55 percent to 26,992, while Australia slipped slightly after recent highs. New Zealand’s S&P/NZX-50 dipped 0.20 percent to 13,487.03. Reports suggested Trump may announce a $10 billion bailout for soybean farmers, highlighting Beijing’s leverage in trade talks.
In commodities, oil rose nearly 1.5 percent after OPEC+ confirmed a modest November production hike of 137,000 barrels per day. Gold climbed almost 1 percent past $3,900 an ounce as shutdown worries and expectations of further Fed rate cuts boosted demand. The dollar held steady after recent volatility.
On Wall Street, U.S. markets closed mixed Friday. The S&P 500 inched higher and the Dow gained 0.5 percent, while the Nasdaq eased 0.3 percent on declines in Palantir. European stocks finished mostly higher, with the Stoxx 600 up 0.5 percent, FTSE 100 advancing 0.7 percent, and CAC 40 rising 0.3 percent, though Germany’s DAX slipped 0.2 percent.
Upcoming Events:
- 09:00 AM GMT – EUR Retail Sales m/m
- 05:00 PM GMT – EUR ECB President Lagarde Speaks
- 05:30 PM GMT – GBP BOE Gov Bailey Speaks
The post Monday 6th October 2025: Asian Stocks Mixed in Holiday Trade; Japan Hits Record High, Gold Surges first appeared on IC Markets | Official Blog.