430595 May 18, 2026 16:01 ICMarkets Market News
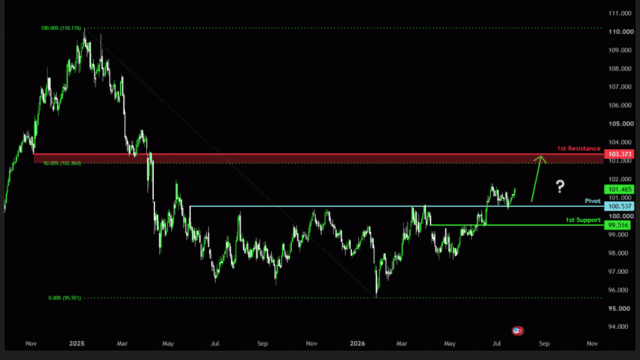
Potential Direction: Bullish
Overall momentum of the chart: Bearish
The price could make a short-term pullback toward the pivot before rising again toward the 1st resistance
Pivot: 99.14
Supporting reasons: Identified as a pullback support, where renewed buying pressure could emerge to push the price higher.
1st support: 97.87
Supporting reasons: Identified as an overlap support that aligns with the 50% Fiboancci retracement that aligns with the 50% Fiboancci retracement, indicating a potential area where the price could again stabilize.
1st resistance: 100.52
Supporting reasons: Identified as an overlap resistance, indicating a potential area that could halt any further upward movement

Potential Direction: Bearish
Overall momentum of the chart: Bullish
The price could see a short-term pullback toward the pivot before continuing its bearish move down toward the 1st support.
Pivot: 1.1669
Supporting reasons: Identified as a pullback resistance, where selling pressures could intensify and potentially cap any upward retracement.
1st support: 1.1480
Supporting reasons: Identified as a pullback support, indicating a potential level where the price could stabilize once again
1st resistance: 1.1808
Supporting reasons: Identified as an overlap resistance that aligns with the 61.8% Fibonacci retracement, indicating a potential level that could cap further upward movement.

Potential Direction: Bearish
Overall momentum of the chart: Bearish
The price could see a short-term pullback toward the pivot before continuing its bearish move down toward the 1st support.
Pivot: 186.13
Supporting reasons: Identified as a pullback resistance that aligns with the 78.6% Fibonacci retracement, where selling pressures could intensify and potentially cap any upward retracement.
1st support: 181.52
Supporting reasons: Identified as an overlap support, indicating a potential area where the price could again stabilize.
1st resistance: 187.92
Supporting reasons: Identified as a swing high resistance, indicating a potential level that could cap further upward movement.

Potential Direction: Bullish
Overall momentum of the chart: Bullish
The price could make a short-term pullback toward the pivot before rising again toward the 1st resistance
Pivot: 0.8687
Supporting reasons: Identified as a pullback support, where renewed buying pressure could emerge to push the price higher.
1st support: 0.8654
Supporting reasons: Identified as a pullback support, indicating a potential area where the price could stabilize once more.
1st resistance: 0.8767
Supporting reasons: Identified as a resistance, indicating a potential level that could cap further upward movement.

Potential Direction: Bearish
Overall momentum of the chart: Bullish
The price could see a short-term pullback toward the pivot before continuing its bearish move down toward the 1st support.
Pivot: 1.3461
Supporting reasons: Identified as a pullback resistance, where selling pressures could intensify and potentially cap any upward retracement.
1st support: 1.3192
Supporting reasons: Identified as an overlap support, indicating a potential area where the price could stabilize once more.
1st resistance: 1.3635
Supporting reasons: Identified as a swing high resistance, indicating a potential level that could halt further upward movement.

Potential Direction: Bearish
Overall momentum of the chart: Bullish
The price could see a short-term pullback toward the pivot before continuing its bearish move down toward the 1st support.
Pivot: 212.12
Supporting reasons: Identified as a pullback resistance, where selling pressures could intensify and potentially cap any upward retracement.
1st support: 209.64
Supporting reasons: Identified as an overlap support, indicating a potential level where the price could stabilize once more.
1st resistance: 213.96
Supporting reasons: Identified as an overlap resistance, indicating a potential level that could halt further upward movement.

Potential Direction: Bullish
Overall momentum of the chart: Bearish
The price could make a short-term pullback toward the pivot before rising again toward the 1st resistance
Pivot: 0.7835
Supporting reasons: Identified as a pullback support, where renewed buying pressure could emerge to push the price higher.
1st support: 0.7764
Supporting reasons: Identified as an overlap support, indicating a potential level where the price could stabilize once again.
1st resistance: 0.7936
Supporting reasons: Identified as a pullback resistance, indicating a potential level that could cap further upward movement.

Potential Direction: Bullish
Overall momentum of the chart: Bullish
The price could make a short-term pullback toward the pivot before rising again toward the 1st resistance
Pivot: 157.72
Supporting reasons: Identified as a pullback support, where renewed buying pressure could emerge to push the price higher.
1st support: 155.05
Supporting reasons: Identified as a swing low support, indicating a strong area where buyers might return, and the price could stabilize once again.
1st resistance: 160.46
Supporting reasons: Identified as a swing high resistance. This level represents the next key area where upward movement could be capped amid increased selling pressure

Potential Direction: Bullish
Overall momentum of the chart: Bearish
The price could make a short-term pullback toward the pivot before rising again toward the 1st resistance
Pivot: 1.3699
Supporting reasons: Identified as a pullback support, where renewed buying pressure could emerge to push the price higher.
1st support: 1.3578
Supporting reasons: Identified as a swing low support, indicating a key level where the price could stabilize once more.
1st resistance: 1.3859
Supporting reasons: Identified as a pullback resistance that aligns with the 78.6% Fibonacci retracement, making it a possible target for bullish advances and a level where some sellers could return to cap gains

Potential Direction: Bearish
Overall momentum of the chart: Bullish
The price could see a short-term pullback toward the pivot before continuing its bearish move down toward the 1st support.
Pivot: 0.7187
Supporting reasons: Identified as a pullback resistance, where selling pressures could intensify and potentially cap any upward retracement.
1st support: 0.7104
Supporting reasons: Identified as an overlap support, this area has provided strong support historically and may attract buying interest for a potential short-term bounce
1st resistance: 0.7278
Supporting reasons: Identified as a swing high resistance, indicating a potential area that could halt any further upward movement.

Potential Direction: Bearish
Overall momentum of the chart: Bullish
The price could see a short-term pullback toward the pivot before continuing its bearish move down toward the 1st support.
Pivot: 0.5853
Supporting reasons: Identified as a pullback resistance, where selling pressures could intensify and potentially cap any upward retracement.
1st support: 0.5752
Supporting reasons: Identified as a pullback support, this area has provided strong support historically and may attract buying interest for a potential short-term bounce
1st resistance: 0.5965
Supporting reasons: Identified a swing high resistance, indicating a potential area that could halt any further upward movement.

Potential Direction: Bullish
Overall momentum of the chart: Bullish
The price could make a short-term pullback toward the pivot before rising again toward the 1st resistance
Pivot: 48,824.60
Supporting reasons: Identified as an overlap support, where renewed buying pressure could emerge to push the price higher.
1st support: 47,747.57
Supporting reasons: Identified as a pullback support, suggesting a potential area where the price could stabilize once again.
1st resistance: 50,477.23
Supporting reasons: Identified as a swing high resistance, indicating a potential area that could halt any further upward movement.

Potential Direction: Bearish
Overall momentum of the chart: Bullish
The price has already reacted off the pivot and may continue its bearish move toward the 1st support.
Pivot: 24,805.50
Supporting reasons: Identified as a pullback resistance, where selling pressures could intensify and potentially cap any upward retracement.
1st support: 23,332.36
Supporting reasons: Identified as a pullback support, indicating a key level where the price could stabilize once more.
1st resistance: 25,451.76
Supporting reasons: Identified as a swing high resistance, indicating a potential area that could halt any further upward movement.

Potential Direction: Bullish
Overall momentum of the chart: Bullish
The price could make a short-term pullback toward the pivot before rising again toward the 1st resistance.
Pivot: 7,175.99
Supporting reasons: Identified as a pullback support, where renewed buying pressure could emerge to push the price higher.
1st support: 7,013.90
Supporting reasons: Identified as a pullback support, indicating a potential level where the price could stabilize once again.
1st resistance: 7,496.71
Supporting reasons: Identified as a swing high resistance, indicating a potential area that could halt any further upward movement.

Potential Direction: Bearish
Overall momentum of the chart: Bullish
The price could see a short-term pullback toward the pivot before continuing its bearish move down toward the 1st support.
Pivot: 78,616.60
Supporting reasons: Identified as a pullback resistance, where selling pressures could intensify and potentially cap any upward retracement.
1st support: 74,631.06
Supporting reasons: Identified as an overlap support, indicating a potential level where the price could stabilize once more.
1st resistance: 81,867.04
Supporting reasons: Identified as a multi swing high resistance, indicating a potential area that could halt any further upward movement.

Potential Direction: Bearish
Overall momentum of the chart: Bullish
The price could see a short-term pullback toward the pivot before continuing its bearish move down toward the 1st support.
Pivot: 2,200.69
Supporting reasons: Identified as a pullback resistance, where selling pressures could intensify and potentially cap any upward retracement.
1st support: 1,983.18
Supporting reasons: Identified as a swing low support, indicating a potential level where the price could stabilize once more.
1st resistance: 2,424.98
Supporting reasons: Identified as a swing high resistance, indicating a potential area that could halt any further upward movement.

Potential Direction: Bullish
Overall momentum of the chart: Bullish
The price has already bounced off the pivot and may continue its bullish move toward the 1st resistance
Pivot: 87.53
Supporting reasons: Identified as an overlap support, where renewed buying pressure could emerge to push the price higher.
1st support: 73.75
Supporting reasons: Identified as a pullback support, indicating a key level where the price could stabilize once more.
1st resistance: 119.24
Supporting reasons: Identified as a pullback resistance, indicating a potential area that could halt any further upward movement.

Potential Direction: Bearish
Overall momentum of the chart: Bullish
The price could see a short-term pullback toward the pivot before continuing its bearish move down toward the 1st support.
Pivot: 4,629.22
Supporting reasons: Identified as a pullback resistance, where selling pressures could intensify and potentially cap any upward retracement.
1st support: 4,367.70
Supporting reasons: Identified as an overlap support, indicating a key level where the price could stabilize once more.
1st resistance: 48,62.42
Supporting reasons: Identified as an overlap resistance, indicating a potential area that could halt any further upward movement.

The accuracy, completeness and timeliness of the information contained on this site cannot be guaranteed. IC Markets does not warranty, guarantee or make any representations, or assume any liability regarding financial results based on the use of the information in the site.
News, views, opinions, recommendations and other information obtained from sources outside of www.icmarkets.com.au, used in this site are believed to be reliable, but we cannot guarantee their accuracy or completeness. All such information is subject to change at any time without notice. IC Markets assumes no responsibility for the content of any linked site.
The fact that such links may exist does not indicate approval or endorsement of any material contained on any linked site. IC Markets is not liable for any harm caused by the transmission, through accessing the services or information on this site, of a computer virus, or other computer code or programming device that might be used to access, delete, damage, disable, disrupt or otherwise impede in any manner, the operation of the site or of any user’s software, hardware, data or property.
Potential Direction: Bullish
Overall momentum of the chart: Bearish
The price could make a short-term pullback toward the pivot before rising again toward the 1st resistance
Pivot: 99.14
Supporting reasons: Identified as a pullback support, where renewed buying pressure could emerge to push the price higher.
1st support: 97.87
Supporting reasons: Identified as an overlap support that aligns with the 50% Fiboancci retracement that aligns with the 50% Fiboancci retracement, indicating a potential area where the price could again stabilize.
1st resistance: 100.52
Supporting reasons: Identified as an overlap resistance, indicating a potential area that could halt any further upward movement

Potential Direction: Bearish
Overall momentum of the chart: Bullish
The price could see a short-term pullback toward the pivot before continuing its bearish move down toward the 1st support.
Pivot: 1.1669
Supporting reasons: Identified as a pullback resistance, where selling pressures could intensify and potentially cap any upward retracement.
1st support: 1.1480
Supporting reasons: Identified as a pullback support, indicating a potential level where the price could stabilize once again
1st resistance: 1.1808
Supporting reasons: Identified as an overlap resistance that aligns with the 61.8% Fibonacci retracement, indicating a potential level that could cap further upward movement.

Potential Direction: Bearish
Overall momentum of the chart: Bearish
The price could see a short-term pullback toward the pivot before continuing its bearish move down toward the 1st support.
Pivot: 186.13
Supporting reasons: Identified as a pullback resistance that aligns with the 78.6% Fibonacci retracement, where selling pressures could intensify and potentially cap any upward retracement.
1st support: 181.52
Supporting reasons: Identified as an overlap support, indicating a potential area where the price could again stabilize.
1st resistance: 187.92
Supporting reasons: Identified as a swing high resistance, indicating a potential level that could cap further upward movement.

Potential Direction: Bullish
Overall momentum of the chart: Bullish
The price could make a short-term pullback toward the pivot before rising again toward the 1st resistance
Pivot: 0.8687
Supporting reasons: Identified as a pullback support, where renewed buying pressure could emerge to push the price higher.
1st support: 0.8654
Supporting reasons: Identified as a pullback support, indicating a potential area where the price could stabilize once more.
1st resistance: 0.8767
Supporting reasons: Identified as a resistance, indicating a potential level that could cap further upward movement.

Potential Direction: Bearish
Overall momentum of the chart: Bullish
The price could see a short-term pullback toward the pivot before continuing its bearish move down toward the 1st support.
Pivot: 1.3461
Supporting reasons: Identified as a pullback resistance, where selling pressures could intensify and potentially cap any upward retracement.
1st support: 1.3192
Supporting reasons: Identified as an overlap support, indicating a potential area where the price could stabilize once more.
1st resistance: 1.3635
Supporting reasons: Identified as a swing high resistance, indicating a potential level that could halt further upward movement.

Potential Direction: Bearish
Overall momentum of the chart: Bullish
The price could see a short-term pullback toward the pivot before continuing its bearish move down toward the 1st support.
Pivot: 212.12
Supporting reasons: Identified as a pullback resistance, where selling pressures could intensify and potentially cap any upward retracement.
1st support: 209.64
Supporting reasons: Identified as an overlap support, indicating a potential level where the price could stabilize once more.
1st resistance: 213.96
Supporting reasons: Identified as an overlap resistance, indicating a potential level that could halt further upward movement.

Potential Direction: Bullish
Overall momentum of the chart: Bearish
The price could make a short-term pullback toward the pivot before rising again toward the 1st resistance
Pivot: 0.7835
Supporting reasons: Identified as a pullback support, where renewed buying pressure could emerge to push the price higher.
1st support: 0.7764
Supporting reasons: Identified as an overlap support, indicating a potential level where the price could stabilize once again.
1st resistance: 0.7936
Supporting reasons: Identified as a pullback resistance, indicating a potential level that could cap further upward movement.

Potential Direction: Bullish
Overall momentum of the chart: Bullish
The price could make a short-term pullback toward the pivot before rising again toward the 1st resistance
Pivot: 157.72
Supporting reasons: Identified as a pullback support, where renewed buying pressure could emerge to push the price higher.
1st support: 155.05
Supporting reasons: Identified as a swing low support, indicating a strong area where buyers might return, and the price could stabilize once again.
1st resistance: 160.46
Supporting reasons: Identified as a swing high resistance. This level represents the next key area where upward movement could be capped amid increased selling pressure

Potential Direction: Bullish
Overall momentum of the chart: Bearish
The price could make a short-term pullback toward the pivot before rising again toward the 1st resistance
Pivot: 1.3699
Supporting reasons: Identified as a pullback support, where renewed buying pressure could emerge to push the price higher.
1st support: 1.3578
Supporting reasons: Identified as a swing low support, indicating a key level where the price could stabilize once more.
1st resistance: 1.3859
Supporting reasons: Identified as a pullback resistance that aligns with the 78.6% Fibonacci retracement, making it a possible target for bullish advances and a level where some sellers could return to cap gains

Potential Direction: Bearish
Overall momentum of the chart: Bullish
The price could see a short-term pullback toward the pivot before continuing its bearish move down toward the 1st support.
Pivot: 0.7187
Supporting reasons: Identified as a pullback resistance, where selling pressures could intensify and potentially cap any upward retracement.
1st support: 0.7104
Supporting reasons: Identified as an overlap support, this area has provided strong support historically and may attract buying interest for a potential short-term bounce
1st resistance: 0.7278
Supporting reasons: Identified as a swing high resistance, indicating a potential area that could halt any further upward movement.

Potential Direction: Bearish
Overall momentum of the chart: Bullish
The price could see a short-term pullback toward the pivot before continuing its bearish move down toward the 1st support.
Pivot: 0.5853
Supporting reasons: Identified as a pullback resistance, where selling pressures could intensify and potentially cap any upward retracement.
1st support: 0.5752
Supporting reasons: Identified as a pullback support, this area has provided strong support historically and may attract buying interest for a potential short-term bounce
1st resistance: 0.5965
Supporting reasons: Identified a swing high resistance, indicating a potential area that could halt any further upward movement.

Potential Direction: Bullish
Overall momentum of the chart: Bullish
The price could make a short-term pullback toward the pivot before rising again toward the 1st resistance
Pivot: 48,824.60
Supporting reasons: Identified as an overlap support, where renewed buying pressure could emerge to push the price higher.
1st support: 47,747.57
Supporting reasons: Identified as a pullback support, suggesting a potential area where the price could stabilize once again.
1st resistance: 50,477.23
Supporting reasons: Identified as a swing high resistance, indicating a potential area that could halt any further upward movement.

Potential Direction: Bearish
Overall momentum of the chart: Bullish
The price has already reacted off the pivot and may continue its bearish move toward the 1st support.
Pivot: 24,805.50
Supporting reasons: Identified as a pullback resistance, where selling pressures could intensify and potentially cap any upward retracement.
1st support: 23,332.36
Supporting reasons: Identified as a pullback support, indicating a key level where the price could stabilize once more.
1st resistance: 25,451.76
Supporting reasons: Identified as a swing high resistance, indicating a potential area that could halt any further upward movement.

Potential Direction: Bullish
Overall momentum of the chart: Bullish
The price could make a short-term pullback toward the pivot before rising again toward the 1st resistance.
Pivot: 7,175.99
Supporting reasons: Identified as a pullback support, where renewed buying pressure could emerge to push the price higher.
1st support: 7,013.90
Supporting reasons: Identified as a pullback support, indicating a potential level where the price could stabilize once again.
1st resistance: 7,496.71
Supporting reasons: Identified as a swing high resistance, indicating a potential area that could halt any further upward movement.

Potential Direction: Bearish
Overall momentum of the chart: Bullish
The price could see a short-term pullback toward the pivot before continuing its bearish move down toward the 1st support.
Pivot: 78,616.60
Supporting reasons: Identified as a pullback resistance, where selling pressures could intensify and potentially cap any upward retracement.
1st support: 74,631.06
Supporting reasons: Identified as an overlap support, indicating a potential level where the price could stabilize once more.
1st resistance: 81,867.04
Supporting reasons: Identified as a multi swing high resistance, indicating a potential area that could halt any further upward movement.

Potential Direction: Bearish
Overall momentum of the chart: Bullish
The price could see a short-term pullback toward the pivot before continuing its bearish move down toward the 1st support.
Pivot: 2,200.69
Supporting reasons: Identified as a pullback resistance, where selling pressures could intensify and potentially cap any upward retracement.
1st support: 1,983.18
Supporting reasons: Identified as a swing low support, indicating a potential level where the price could stabilize once more.
1st resistance: 2,424.98
Supporting reasons: Identified as a swing high resistance, indicating a potential area that could halt any further upward movement.

Potential Direction: Bullish
Overall momentum of the chart: Bullish
The price has already bounced off the pivot and may continue its bullish move toward the 1st resistance
Pivot: 87.53
Supporting reasons: Identified as an overlap support, where renewed buying pressure could emerge to push the price higher.
1st support: 73.75
Supporting reasons: Identified as a pullback support, indicating a key level where the price could stabilize once more.
1st resistance: 119.24
Supporting reasons: Identified as a pullback resistance, indicating a potential area that could halt any further upward movement.

Potential Direction: Bearish
Overall momentum of the chart: Bullish
The price could see a short-term pullback toward the pivot before continuing its bearish move down toward the 1st support.
Pivot: 4,629.22
Supporting reasons: Identified as a pullback resistance, where selling pressures could intensify and potentially cap any upward retracement.
1st support: 4,367.70
Supporting reasons: Identified as an overlap support, indicating a key level where the price could stabilize once more.
1st resistance: 48,62.42
Supporting reasons: Identified as an overlap resistance, indicating a potential area that could halt any further upward movement.

The accuracy, completeness and timeliness of the information contained on this site cannot be guaranteed. IC Markets Global does not warranty, guarantee or make any representations, or assume any liability regarding financial results based on the use of the information in the site.
News, views, opinions, recommendations and other information obtained from sources outside of www.icmarkets.com, used in this site are believed to be reliable, but we cannot guarantee their accuracy or completeness. All such information is subject to change at any time without notice. IC Markets Global assumes no responsibility for the content of any linked site.
The fact that such links may exist does not indicate approval or endorsement of any material contained on any linked site. IC Markets Global is not liable for any harm caused by the transmission, through accessing the services or information on this site, of a computer virus, or other computer code or programming device that might be used to access, delete, damage, disable, disrupt or otherwise impede in any manner, the operation of the site or of any user’s software, hardware, data or property.
The post Monday 18th May 2026: Technical Outlook and Review first appeared on IC Your Trading Edge | Official Blog.
430594 May 18, 2026 16:01 ICMarkets Market News
Asia-Pacific markets declined Monday after renewed geopolitical tensions in the Middle East rattled investors. U.S. President Donald Trump warned Iran to “get moving, FAST,” fueling concerns about a deeper conflict and possible disruptions to global oil supplies.
In a Truth Social post, Trump said “the Clock is Ticking” for Iran and warned there “won’t be anything left” if swift action was not taken. He did not clarify what measures he expected from Tehran or what consequences might follow.
Oil prices jumped more than 1% amid fears of supply disruptions. Brent crude futures rose 1.9% to $111.34 a barrel, while U.S. West Texas Intermediate crude climbed 2.17% to $107.71.
Regional markets reacted negatively. Australia’s S&P/ASX 200 dropped 1.32%, Japan’s Nikkei 225 lost 0.92%, and the Topix fell 0.77%. Hong Kong’s Hang Seng slipped 1.49%, while Taiwan’s Taiex declined 1.02%. South Korea’s Kospi gained 1.15%, though the Kosdaq fell 1.65%.
Investors also monitored rising bond yields and inflation concerns. Japan’s 10-year government bond yield jumped above 2.79%.
Meanwhile, U.S. stock futures were mostly flat after Wall Street ended lower Friday, pressured by rising Treasury yields and weakness in technology shares, including Nvidia, Intel, AMD, and Micron.
The post Monday 18th May 2026: Asia Markets Fall as Trump’s Iran Warning Sparks Oil Supply Fears first appeared on IC Your Trading Edge | Official Blog.
430588 May 18, 2026 15:40 ICMarkets Market News
Markets closed out another busy week on the back foot on Friday, as rising yields across most global markets led to a souring of what had been positive sentiment for most of the week. Inflationary concerns have been building since the conflict in the Middle East started, and data this week, particularly out of the US, saw markets start to react as the week wore on.
On the geopolitical front, President Trump’s trip to China concluded with little in the way of concrete updates for investors, despite plenty of positive rhetoric, while hopes of the ceasefire in the Middle East between the US and Iran continuing seem to be fading with each passing day.
The week ahead will see focus remain strongly on geopolitical updates in general, and the Middle East in particular, whilst on the data front there is little out of the US, although Fed Meeting Minutes should provide interesting reading midway through the week. However, we do have some key updates due from other major economies that should see moves in their respective markets.
Here is our usual day-by-day breakdown of the major risk events this week:

It’s a quiet start to the calendar week on Monday, with nothing of note scheduled across all three trading sessions. Canadian markets are closed for a bank holiday, which could affect liquidity later in the day, but overall expect market moves to be dominated by geopolitical updates.

There is little on the calendar in the Asian session on Tuesday, but we do have the first of some key UK data this week out shortly after the London open, with employment numbers being released. The initial focus in the New York session will be on Canadian markets, with the CPI data due out, while later in the day US Pending Home Sales numbers are scheduled.

The Asian session will see attention move to Chinese markets midway through the day, with the Loan Prime Rate updates due. The London session sees more key UK data out early in the day, this time the CPI and PPI data. The New York session has little in the way of data due out again, although the Weekly Crude Oil Inventory data will draw some attention. However, traders are expecting to see volatility towards the end of the session when the FOMC Meeting Minutes are released.

It’s the busiest day of the week in terms of data releases on Thursday, with Flash Manufacturing and Services PMI numbers out from a variety of jurisdictions including Australia, France, Germany, the EU, the UK, and the US. Australian markets will be in focus early in the day, with key employment data due out, while the New York session sees the Philly Fed Manufacturing Index and Weekly Unemployment Claims numbers out later in the day.

It’s a relatively quiet calendar day to close out the trading week on Friday, although Retail Sales data out of both the UK and Canada may see some moves in their local markets in their respective sessions. Revised University of Michigan Consumer Sentiment data is also out in the US session. However, again traders are expecting news-led flows to dictate market moves into the weekend.
The post The Week Ahead – Week Commencing 18 May 2026 first appeared on IC Your Trading Edge | Official Blog.
430587 May 18, 2026 15:40 ICMarkets Market News
US Stocks Hit Hard into the Weekend – Nasdaq down 1.55%
Global equity markets finished sharply lower into Friday’s close as investors reacted to mounting inflation concerns and another aggressive move higher in global bond yields. Risk sentiment deteriorated throughout the session, with all three major US indices ending firmly in the red as rising yields continued to weigh heavily on growth and technology stocks.
The Dow Jones fell 1.07% to close at 49,526, while the S&P 500 lost 1.24% to finish at 7,408. The Nasdaq underperformed once again, sliding 1.54% to 26,225 as higher rate expectations pressured the tech sector.
US Treasury yields surged higher across the curve, reinforcing the view that the Federal Reserve may need to keep policy restrictive for longer amid persistent inflation risks. The US 2-year yield climbed 5.2 basis points to 4.069%, while the benchmark 10-year yield jumped 11.2 basis points to close at 4.593%, comfortably above the key 4.5% level.
The move in US yields helped underpin broad dollar strength, with the DXY rising 0.46% to 99.27. USD/JPY continued to push higher despite ongoing intervention threats from Japanese authorities, as yield differentials remained firmly in favour of the greenback.
Commodity markets were dominated by geopolitical concerns, with oil prices rallying strongly again as hopes for a ceasefire in the Middle East continued to fade. Brent crude rose 3.35% to settle at $109.26 per barrel, while WTI gained 4.20% to $105.42. Gold lost ground again on the back of the stronger dollar.
Gold Losing its Lustre to the Stronger Dollar
Gold came under heavy selling pressure on Friday as the combination of higher yields and a stronger US dollar triggered another wave of selling. The precious metal fell 2.40% to $4,540.08, breaking through a recent support level in the process. XAUUSD had started the day just above a strong trendline support level on the daily chart around $4,620.00, but further dollar buying soon saw that level break, and it was generally one-way traffic after that for the majority of the day. It found some support just above the key $4,500 level on Friday, where it had also found support on two previous occasions this month, and a clean break through there in the coming sessions could see a much deeper correction as the week rolls on, especially if US yields and the dollar remain supported. The next target on the downside is the 200-day moving average around $4,347, with any further weakness likely to challenge the annual low of $4,097.99.
Quiet Calendar Monday to Kick off the Trading Week
It is a relatively quiet start to the week on the economic calendar today, leaving markets likely to remain heavily driven by bond market moves and geopolitical headlines. Asian equities are expected to open under pressure following Friday’s sharp selloff on Wall Street, and we have so far been blessed with a relatively quiet start to the trading week, with no significant gapping or moves on the early FX open. There is a raft of Chinese data due out midway through the Asian session today, with Industrial Production data (exp. +6.0% y/y) the likely highlight, but traders are not expecting much market impact. There is little else due out in terms of data releases or central bank updates today, and liquidity may be affected later in the day by a Canadian bank holiday, so newswires are likely to be the main catalyst for any significant moves in the market.
Explore all upcoming market events in the Economic Calendar.
The post General Market Analysis – 18/05/26 first appeared on IC Your Trading Edge | Official Blog.
430584 May 18, 2026 15:00 ICMarkets Market News
IC Markets Global – Asia Fundamental Forecast | 18 May 2026
What happened in the U.S. session?
Inflation and consumer‑spending data plus Fed commentary, which pushed front‑end and intermediate Treasury yields higher (raising rate expectations) and supported a firmer dollar; equities were mixed with retail and consumer names reacting to spending prints while tech/AI sectors tracked earnings flow, and oil moved on continuing Middle East/supply headlines that benefited energy stocks and pushed crude prices higher.
What does it mean for the Asia Session?
Asian traders should focus on whether the “trade‑thaw” story from the Trump‑Xi summit continues to support equities and a firmer yuan, on how China’s April industrial production, retail sales, and unemployment data shape perceptions of domestic demand, and on any renewed hawkish geopolitical or tariff signals that could quickly reverse the current risk‑on tone; FX, regional EM flows, and commodity‑linked sectors will be particularly sensitive to the interplay between US‑China rhetoric, Chinese data, and global risk sentiment.
The Dollar Index (DXY)
Key news events today
No major news event
What can we expect from DXY today?
The US dollar is trading moderately firm but range‑bound, with the Dollar Index (DXY) hovering around the mid‑98s after a strong five‑day advance into the weekend, fueled by higher US Treasury yields, a resilient US jobs report, and lingering Middle‑East‑related safe‑haven demand. Markets are still pricing in a modest chance of a Federal Reserve rate hike later in 2026, which underpins the greenback, even as equity‑market strength and occasional risk‑on moves cap its upside.
Central Bank Notes:
Next 24 Hours Bias
Medium Bullish
Gold (XAU)
Key news events today
No major news event
What can we expect from Gold today?
Gold on Monday is holding in a tight, elevated range around the mid‑$4,500s per ounce, balancing safe‑haven demand from Middle East tensions and lingering inflation worries against a firmer U.S. dollar and higher bond yields that cap gains. Analysts broadly expect prices to stay supported near current levels over 2026, thanks to central‑bank buying and strategic diversification away from the dollar, even as some forecasts warn of a potential pullback toward the low‑$4,000s if key support breaks or risk‑on sentiment strengthens.
Next 24 Hours Bias
Weak Bearish
The Australian Dollar (AUD)
Key news events today
No major news event
What can we expect from AUD today?
The Australian Dollar has been trading near 0.7200 AUD/USD, holding close to four-year highs after the Reserve Bank of Australia (RBA) is widely expected to deliver a 25 basis point rate hike to 4.35% at its May 2026 monetary policy meeting. This hawkish shift comes as Australia’s annual inflation remains elevated at 4.6% YoY (March 2026), well above the RBA’s 2–3% target, prompting the central bank to tighten policy to combat persistent price pressures.
Central Bank Notes:
Next 24 Hours Bias
Medium Bullish
The Kiwi Dollar (NZD)
Key news events today
No major news event
What can we expect from NZD today?
On Monday, the New Zealand Dollar is trading near the lower end of its recent range against the US Dollar, underpinned by a stronger‑than‑expected Fed policy outlook and softer domestic fundamentals, which have entrenched the Kiwi’s recent weekly losses and kept NZD/USD close to 0.585–0.590.
Central Bank Notes:
Next 24 Hours Bias
Medium Bearish
The Japanese Yen (JPY)
Key news events today
No major news event
What can we expect from JPY today?
The Japanese Yen weakened toward 158 per dollar as of mid-May 2026, falling for multiple consecutive sessions amid a stronger US Dollar fueled by hotter US inflation and rising expectations for Fed rate hikes. Although the Bank of Japan signaled potential additional rate hikes as soon as June and Japanese officials have warned against excessive volatility (with intervention risk capping some USD/JPY gains), the fundamental interest rate differential continues to pressure the Yen lower.
Central Bank Notes:
Next 24 Hours Bias
Weak Bearish
Oil
Key news events today
No major news event
What can we expect from Oil today?
Brent and WTI have recently been supported by fears over the Strait of Hormuz and wider supply disruptions, but there have also been pullbacks whenever ceasefire or diplomatic headlines ease those risks. Reuters also reported that the U.S. EIA now sees Middle East supply losses peaking at 10.8 million bpd in May, which reinforces the market’s focus on disruption risk.
Next 24 Hours Bias
Strong Bullish
The post IC Markets Global – Asia Fundamental Forecast | 18 May 2026 first appeared on IC Your Trading Edge | Official Blog.
430583 May 18, 2026 15:00 ICMarkets Market News
IC Markets Global – Europe Fundamental Forecast | 18 May 2026
What happened in the Asia session?
Weaker-than-expected China April activity data and a fresh surge in geopolitical risk, producing a clear split between pressure on Chinese and Hong Kong equities and strength in oil. The headline losers were growth-sensitive equities and risk assets, while the headline beneficiaries were crude futures and related energy exposures.
What does it mean for the Europe & US sessions?
Geopolitical news (notably U.S.–Iran tensions) and rising oil prices are the immediate risk drivers this morning, while a packed economic calendar features flash PMIs across Europe and the U.S., Germany’s Ifo and GfK consumer gauges, UK activity and inflation signals, and U.S. regional Fed indexes plus housing and consumer-sentiment reads will provide fresh directional cues for equities, FX, and rates.
The Dollar Index (DXY)
Key news events today
No major news event
What can we expect from DXY today?
The U.S. dollar is strengthening broadly amid rising Treasury yields and fading Federal Reserve rate-cut expectations, continuing a five-day winning streak that positions it for its largest weekly rise in two months. Technical analysis indicates a bearish outlook for the pound versus the dollar, with a projection to fall toward 1.320.
Central Bank Notes:
Next 24 Hours Bias
Medium Bullish
Gold (XAU)
Key news events today
No major news event
What can we expect from Gold today?
As of Monday, gold is trading in the mid‑4,500s USD per ounce, consolidating after a strong early‑2026 rally and a subsequent 2‑percent+ correction, as a firmer U.S. dollar and higher real yields cap gains while persistent geopolitical risk and central‑bank buying cap the downside; the market is currently in a containment phase, with traders awaiting U.S. macro data and Fed‑policy signals to decide whether renewed expectations for rate cuts will reignite a fresh leg higher for bullion later this year.
Next 24 Hours Bias
Weak Bearish
The Euro (EUR)
Key news events today
No major news event
What can we expect from EUR today?
The euro experienced modest weakness today as traders engaged in profit-taking following its recent three-month peak, pushing the EUR/USD pair down to 1.1617 and extending its losing streak against the dollar to three sessions. While the monthly trend shows a 1.45% decline, the euro maintains a solid 3.35% gain year-over-year, suggesting the current pullback is a short-term correction rather than a fundamental shift.
Central Bank Notes:
The next meeting is on 10 to 11 June 2026
Next 24 Hours Bias
Weak Bearish
The Swiss Franc (CHF)
Key news events today
No major news event
What can we expect from CHF today?
The Swiss franc is currently strengthening amid heightened global uncertainty and rising inflation in Switzerland, which has pushed consumer prices to 0.6% year-on-year in April, exceeding the SNB’s 0.5% forecast and prompting futures markets to price in a potential 25-basis-point rate hike by late 2026. Despite SNB Governor Martin Schlegel’s hint at possible currency interventions or a return to negative rates, the franc’s safe-haven appeal, bolstered by geopolitical tensions including US-Iran concerns, continues to support its value against the dollar and euro, with USD/CHF hovering around 0.78.
Central Bank Notes:
The next meeting is on 18 June 2026.
Next 24 Hours Bias
Weak Bearish
The Pound (GBP)
Key news events today
No major news event
What can we expect from GBP today?
The pound is trading modestly stronger versus the dollar and broadly stable against the euro, lifted by a weaker Greenback and lingering expectations that the Bank of England will keep rates relatively supportive rather than turning aggressively dovish. At the same time, the currency remains vulnerable to any downside surprises in UK growth or inflation data.
Central Bank Notes:
Next 24 Hours Bias
Weak Bullish
The Canadian Dollar (CAD)
Key news events today
No major news event
What can we expect from CAD today?
The Canadian dollar is trending weaker against the US dollar, with USD/CAD anticipated to rally toward 1.3825 before potentially rebounding downward toward 1.3245 if the bearish trend persists. The loonie’s decline is driven by a combination of risk-averse market flows, falling oil prices, and a stronger US dollar fueled by rising Treasury yields and geopolitical tensions involving Iran and China.
Central Bank Notes:
Next 24 Hours Bias
Medium Bullish
Oil
Key news events today
No major news event
What can we expect from Oil today?
Oil surged on 18 May 2026 as renewed Middle East tensions and concerns about shut-ins and restricted flows through the Strait of Hormuz pushed benchmark Brent above $110 and WTI above roughly $106, while regional crude grades and the OPEC basket also climbed; the U.S. EIA and market analysts say inventories remain tight and production outages are keeping a sustained risk premium on prices, leaving substantial upside risk if the geopolitical situation does not ease.
Next 24 Hours Bias
Strong Bullish
The post IC Markets Global – Europe Fundamental Forecast | 18 May 2026 first appeared on IC Your Trading Edge | Official Blog.
430556 May 15, 2026 17:40 ICMarkets Market News

The post Ex-Dividend 18/05/2026 first appeared on IC Your Trading Edge | Official Blog.
430553 May 15, 2026 14:00 ICMarkets Market News
South Korea’s benchmark Kospi erased earlier gains and fell 1.35% on Friday after briefly touching a record high above 8,000, as broader Asia-Pacific markets traded lower amid investor caution over ongoing U.S.-China talks. Traders closely monitored the second day of high-level discussions between U.S. President Donald Trump and Chinese President Xi Jinping in Beijing, with markets watching for signs of easing trade and technology tensions.
South Korea’s small-cap Kosdaq dropped 2%, while Japan’s Nikkei 225 lost 0.9% and the Topix ended flat. Australia’s S&P/ASX 200 slipped 0.25%, Hong Kong’s Hang Seng declined 0.39%, and China’s CSI 300 was little changed.
The Kospi had surged past 7,000 earlier this month after Samsung Electronics crossed the $1 trillion market capitalization mark. However, investors remain concerned about growing concentration risks in AI-related stocks, with Samsung Electronics and SK Hynix accounting for over 42% of the index in May.
Samsung shares fell 1% after its labor union announced plans to resume wage negotiations in June. Meanwhile, Xi warned that mishandling the Taiwan issue could seriously damage U.S.-China relations.
In the U.S., stock futures were mostly flat after Wall Street hit fresh record highs overnight.
The post Friday 15th May 2026: Asian Markets Slip as Trump-Xi Talks Weigh on Investor Sentimentv first appeared on IC Your Trading Edge | Official Blog.
430551 May 15, 2026 13:41 ICMarkets Market News
IC Markets Global – Europe Fundamental Forecast | 15 May 2026
What happened in the Asia session?
Shift from tech-led risk appetite to renewed inflation concern, led by Japan’s hotter-than-expected 4.9% wholesale inflation print and amplified by higher oil prices and stronger U.S. yields. That combination most directly moved USD/JPY, Asian equity indexes, oil, gold, and the broader U.S. dollar complex, with risk assets generally softer and inflation-sensitive instruments showing the largest reaction.
What does it mean for the Europe & US sessions?
European inflation/rates pressure and the U.S. growth/labor backdrop, with oil-led inflation still a major cross-asset driver. In Europe, Reuters says euro-zone inflation has moved further above the ECB target and markets are pricing more ECB tightening, while U.S. traders are watching how sticky inflation and labor resilience affect the Fed’s path.
The Dollar Index (DXY)
Key news events today
No major news event
What can we expect from DXY today?
The dollar is stronger today because hot U.S. inflation has revived hawkish Fed expectations, while geopolitical uncertainty is keeping safe-haven demand elevated; however, traders are still watching whether the move can extend beyond the current range or stalls as markets wait for the next data cue.
Central Bank Notes:
Next 24 Hours Bias
Medium Bearish
Gold (XAU)
Key news events today
No major news event
What can we expect from Gold today?
Gold on Friday is still sitting at historically elevated levels, but today’s tone is cautious to slightly bearish as traders take profits and wait for a clearer catalyst. The market is being supported by the broader bullish 2026 backdrop, yet near-term momentum has slowed, so the key story today is consolidation rather than a fresh breakout.
Next 24 Hours Bias
Medium Bearish
The Euro (EUR)
Key news events today
No major news event
What can we expect from EUR today?
Today the euro is slightly softer versus the dollar as traders digest higher‑than‑expected May inflation data that still leaves the ECB on track for a June rate cut, undermining near‑term upside in EUR/USD; the currency remains supported over the past year by the ECB’s gradual easing path and relatively stable euro‑area fundamentals, but short‑term headwinds from weaker growth, subdued investment, and geopolitical risks are keeping gains capped.
Central Bank Notes:
The next meeting is on 10 to 11 June 2026
Next 24 Hours Bias
Weak Bullish
The Swiss Franc (CHF)
Key news events today
No major news event
What can we expect from CHF today?
The Swiss franc is still benefiting from a mix of better Swiss inflation data, persistent safe-haven demand, and uncertainty around how long the SNB will keep policy ultra-loose. That combination has kept CHF elevated against both the dollar and the euro, and today’s news flow continues to reinforce the view that the franc is likely to remain resilient unless risk sentiment improves sharply.
Central Bank Notes:
The next meeting is on 18 June 2026.
Next 24 Hours Bias
Strong Bearish
The Pound (GBP)
Key news events today
No major news event
What can we expect from GBP today?
The pound is trading a touch below recent mid‑1.3500 levels quietly, under pressure from renewed Middle East risk‑off flows boosting the US dollar and from political uncertainty around Prime Minister Keir Starmer’s Labour government after heavy local‑election losses, while holding some support from the Bank of England’s more guarded stance on rate‑cut timing and marginally better UK growth data over April.
Central Bank Notes:
Next 24 Hours Bias
Weak Bearish
The Canadian Dollar (CAD)
Key news events today
No major news event
What can we expect from CAD today?
The Canadian dollar is starting Friday in a relatively stable but cautious position: it is not showing a strong breakout trend, but it is also not under acute pressure. The latest market tone suggests CAD is being pulled in opposite directions by softer oil prices and U.S. dollar firmness on one side, versus occasional support from improving risk sentiment and expectations that the currency could strengthen later in 2026 if rate gaps narrow and conditions stabilize.
Central Bank Notes:
Next 24 Hours Bias
Medium Bullish
Oil
Key news events today
No major news event
What can we expect from Oil today?
Today’s oil market is being driven mainly by geopolitical risk rather than normal supply-and-demand news. The unresolved US-Iran conflict has kept the Strait of Hormuz effectively constrained, leaving crude prices elevated and volatile as traders watch for any sign of de-escalation or restored shipping flows.
Next 24 Hours Bias
Medium Bullish
The post IC Markets Global – Europe Fundamental Forecast | 15 May 2026 first appeared on IC Your Trading Edge | Official Blog.
430514 May 15, 2026 13:40 ICMarkets Market News
Potential Direction: Bullish
Overall momentum of the chart: Bearish
Price could see a short-term pullback toward the pivot before rising again toward the 1st resistance.
Pivot: 98.59
Supporting reasons: Identified as a pullback support, where renewed buying pressure could emerge to push the price higher.
1st support: 98.25
Supporting reasons: Identified as a swing low support, indicating a potential area where the price could again stabilize.
1st resistance: 98.99
Supporting reasons: Identified as a swing high resistance, indicating a potential area that could halt any further upward movement

Potential Direction: Bearish
Overall momentum of the chart: Bullish
The price could see a short-term pullback toward the pivot before continuing its bearish move down toward the 1st support.
Pivot: 1.1677
Supporting reasons: Identified as a pullback resistance, where selling pressures could intensify and potentially cap any upward retracement.
1st support: 1.1624
Supporting reasons: Identified as a pullback support, indicating a potential level where the price could stabilize once again.
1st resistance: 1.1722
Supporting reasons: Identified as an overlap resistance that aligns with the 50% FIbonacci retracement, indicating a potential level that could cap further upward movement.

Potential Direction: Bullish
Overall momentum of the chart: Bullish
Price could see a short-term pullback toward the pivot before rising again toward the 1st resistance.
Pivot: 184.24
Supporting reasons: Identified as an overlap support, where renewed buying pressure could emerge to push the price higher.
1st support: 183.29
Supporting reasons: Identified as a pullback support, indicating a potential area where the price could again stabilize.
1st resistance: 185.32
Supporting reasons: Identified as a swing high resistance, indicating a potential level that could cap further upward movement.

Potential Direction: Bullish
Overall momentum of the chart: Bullish
The price could see a short-term pullback toward the pivot before rising again toward the 1st resistance.
Pivot: 0.8680
Supporting reasons: Identified as a pullback support, where renewed buying pressure could emerge to push the price higher.
1st support: 0.8656
Supporting reasons: Identified as an overlap support, indicating a potential area where the price could stabilize once more.
1st resistance: 0.8717
Supporting reasons: Identified as a swing high resistance, indicating a potential level that could cap further upward movement.

Potential Direction: Bearish
Overall momentum of the chart: Bullish
The price could see a short-term pullback toward the pivot before continuing its bearish move down toward the 1st support.
Pivot: 1.3458
Supporting reasons: Identified as a pullback resistance, where selling pressures could intensify and potentially cap any upward retracement.
1st support: 1.3345
Supporting reasons: Identified as a pullback support, indicating a potential area where the price could stabilize once more.
1st resistance: 1.3554
Supporting reasons: Identified as an overlap resistance, indicating a potential level that could halt further upward movement.

Potential Direction: Bullish
Overall momentum of the chart: Bullish
The price could see a short-term pullback toward the pivot before continuing its bearish move down toward the 1st support.
Pivot: 212.99
Supporting reasons: Identified as a pullback resistance, where selling pressures could intensify and potentially cap any upward retracement.
1st support: 211.72
Supporting reasons: Identified as a swing low support, indicating a potential level where the price could stabilize once more.
1st resistance: 214.39
Supporting reasons: Identified as a swing high resistance, indicating a potential level that could halt further upward movement.

Potential Direction: Bullish
Overall momentum of the chart: Bearish
Price could see a short-term pullback toward the pivot before rising again toward the 1st resistance.
Pivot: 0.7825
Supporting reasons: Identified as a pullback support, where renewed buying pressure could emerge to push the price higher.
1st support: 0.7795
Supporting reasons: Identified as a pullback support, indicating a potential level where the price could stabilize once again.
1st resistance: 0.7873
Supporting reasons: Identified as a pullback resistance, indicating a potential level that could cap further upward movement.

Potential Direction: Bullish
Overall momentum of the chart: Bullish
The price could see a short-term pullback toward the pivot before continuing its bearish move down toward the 1st support.
Pivot: 157.90
Supporting reasons: Identified as a pullback resistance, where selling pressures could intensify and potentially cap any upward retracement.
1st support: 156.94
Supporting reasons: Identified as an overlap support, indicating a strong area where buyers might return, and the price could stabilize once again.
1st resistance: 159.03
Supporting reasons: Identified as a pullback resistance. This level represents the next key area where upward movement could be capped amid increased selling pressure

Potential Direction: Bullish
Overall momentum of the chart: Bullish
The price could see a short-term pullback toward the pivot before continuing its bearish move down toward the 1st support.
Pivot: 1.3710
Supporting reasons: Identified as a pullback support, where renewed buying pressure could emerge to push the price higher.
1st support: 1.3664
Supporting reasons: Identified as an overlap support, indicating a key level where the price could stabilize once more.
1st resistance: 1.3753
Supporting reasons: Identified as a resistance that aligns with the 127.2% Fibonacci extension, making it a possible target for bullish advances and a level where some sellers could return to cap gains

Potential Direction: Bullish
Overall momentum of the chart: Bullish
The price could see a short-term pullback toward the pivot before continuing its bearish move down toward the 1st support.
Pivot: 0.7190
Supporting reasons: Identified as a pullback support that aligns with the 61.8% Fibonacci retracement, where renewed buying pressure could emerge to push the price higher.
1st support: 0.7107
Supporting reasons: Identified as a swing low support, this area has provided strong support historically and may attract buying interest for a potential short-term bounce
1st resistance: 0.7277
Supporting reasons: Identified as a swing resistance, indicating a potential area that could halt any further upward movement.

Potential Direction: Bearish
Overall momentum of the chart: Bullish
The price could see a short-term pullback toward the pivot before continuing its bearish move down toward the 1st support.
Pivot: 0.5920
Supporting reasons: Identified as a pullback resistance, where selling pressures could intensify and potentially cap any upward retracement.
1st support: 0.5873
Supporting reasons: Identified as a pullback support, this area has provided strong support historically and may attract buying interest for a potential short-term bounce
1st resistance: 0.5964
Supporting reasons: Identified as a swing high resistance, indicating a potential area that could halt any further upward movement.

Potential Direction: Bullish
Overall momentum of the chart: Bullish
The price could see a short-term pullback toward the pivot before continuing its bearish move down toward the 1st support.
Pivot: 49,795.35
Supporting reasons: Identified as a pullback support, where renewed buying pressure could emerge to push the price higher.
1st support: 49,319.17
Supporting reasons: Identified as an overlap support, suggesting a potential area where the price could stabilize once again.
1st resistance: 50,201.23
Supporting reasons: Identified as a swing high resistance, indicating a potential area that could halt any further upward movement.

Potential Direction: Bearish
Overall momentum of the chart: Bullish
The price could see a short-term pullback toward the pivot before continuing its bearish move down toward the 1st support.
Pivot: 24,585.01
Supporting reasons: Identified as a pullback resistance that aligns with the 50% Fibonacci retracement, where selling pressures could intensify and potentially cap any upward retracement.
1st support: 24,187.69
Supporting reasons: Identified as a pullback support, indicating a key level where the price could stabilize once more.
1st resistance: 24,796.67
Supporting reasons: Identified as a pullback resistance, indicating a potential area that could halt any further upward movement.

Potential Direction: Bullish
Overall momentum of the chart: Bullish
Price could see a short-term pullback toward the pivot before rising again toward the 1st resistance.
Pivot: 7,424.58
Supporting reasons: Identified as a pullback support, where renewed buying pressure could emerge to push the price higher.
1st support: 7,370.10
Supporting reasons: Identified as an overlap support, indicating a potential level where the price could stabilize once again.
1st resistance: 7,530.85
Supporting reasons: Identified as a resistance that aligns with the 100% Fibonacci projection, indicating a potential area that could halt any further upward movement.

Potential Direction: Bullish
Overall momentum of the chart: Bearish
The price has already bounced off the pivot and may continue its bullish move toward the 1st resistance
Pivot: 79,5361.92
Supporting reasons: Identified as a pullback support that aligns with the 50% Fibonacci retracement, where renewed buying pressure could emerge to push the price higher.
1st support: 77,288.07
Supporting reasons: Identified as a pullback support, indicating a potential level where the price could stabilize once more.
1st resistance: 82,076.01
Supporting reasons: Identified as a swing high resistance, indicating a potential area that could halt any further upward movement.

Potential Direction: Bullish
Overall momentum of the chart: Bullish
Price could see a short-term pullback toward the pivot before rising again toward the 1st resistance.
Pivot: 2,266.40
Supporting reasons: Identified as a pullback support, where renewed buying pressure could emerge to push the price higher.
1st support: 2,217.56
Supporting reasons: Identified as a swing low support, indicating a potential level where the price could stabilize once more.
1st resistance: 2,319.04
Supporting reasons: Identified as an overlap resistance, indicating a potential area that could halt any further upward movement.

Potential Direction: Bullish
Overall momentum of the chart: Bullish
The price has already bounced off the pivot and may continue its bullish move toward the 1st resistance
Pivot: 99.97
Supporting reasons: Identified as a pullback support, where renewed buying pressure could emerge to push the price higher.
1st support: 94.89
Supporting reasons: Identified as a pullback support, indicating a key level where the price could stabilize once more.
1st resistance: 110.90
Supporting reasons: Identified as a swing high resistance, indicating a potential area that could halt any further upward movement.

Potential Direction: Bearish
Overall momentum of the chart: Bullish
The price could see a short-term pullback toward the pivot before continuing its bearish move down toward the 1st support
Pivot: 4,651.91
Supporting reasons: Identified as a pullback resistance, where selling pressures could intensify and potentially cap any upward retracement.
1st support: 4,579.04
Supporting reasons: Identified as a pullback support, indicating a key level where the price could stabilize once more.
1st resistance: 4,698.79
Supporting reasons: Identified as a swing high resistance, indicating a potential area that could halt any further upward movement.

The accuracy, completeness and timeliness of the information contained on this site cannot be guaranteed. IC Markets does not warranty, guarantee or make any representations, or assume any liability regarding financial results based on the use of the information in the site.
News, views, opinions, recommendations and other information obtained from sources outside of www.icmarkets.com.au, used in this site are believed to be reliable, but we cannot guarantee their accuracy or completeness. All such information is subject to change at any time without notice. IC Markets assumes no responsibility for the content of any linked site.
The fact that such links may exist does not indicate approval or endorsement of any material contained on any linked site. IC Markets is not liable for any harm caused by the transmission, through accessing the services or information on this site, of a computer virus, or other computer code or programming device that might be used to access, delete, damage, disable, disrupt or otherwise impede in any manner, the operation of the site or of any user’s software, hardware, data or property.
Potential Direction: Bullish
Overall momentum of the chart: Bearish
Price could see a short-term pullback toward the pivot before rising again toward the 1st resistance.
Pivot: 98.59
Supporting reasons: Identified as a pullback support, where renewed buying pressure could emerge to push the price higher.
1st support: 98.25
Supporting reasons: Identified as a swing low support, indicating a potential area where the price could again stabilize.
1st resistance: 98.99
Supporting reasons: Identified as a swing high resistance, indicating a potential area that could halt any further upward movement

Potential Direction: Bearish
Overall momentum of the chart: Bullish
The price could see a short-term pullback toward the pivot before continuing its bearish move down toward the 1st support.
Pivot: 1.1677
Supporting reasons: Identified as a pullback resistance, where selling pressures could intensify and potentially cap any upward retracement.
1st support: 1.1624
Supporting reasons: Identified as a pullback support, indicating a potential level where the price could stabilize once again.
1st resistance: 1.1722
Supporting reasons: Identified as an overlap resistance that aligns with the 50% FIbonacci retracement, indicating a potential level that could cap further upward movement.

Potential Direction: Bullish
Overall momentum of the chart: Bullish
Price could see a short-term pullback toward the pivot before rising again toward the 1st resistance.
Pivot: 184.24
Supporting reasons: Identified as an overlap support, where renewed buying pressure could emerge to push the price higher.
1st support: 183.29
Supporting reasons: Identified as a pullback support, indicating a potential area where the price could again stabilize.
1st resistance: 185.32
Supporting reasons: Identified as a swing high resistance, indicating a potential level that could cap further upward movement.

Potential Direction: Bullish
Overall momentum of the chart: Bullish
The price could see a short-term pullback toward the pivot before rising again toward the 1st resistance.
Pivot: 0.8680
Supporting reasons: Identified as a pullback support, where renewed buying pressure could emerge to push the price higher.
1st support: 0.8656
Supporting reasons: Identified as an overlap support, indicating a potential area where the price could stabilize once more.
1st resistance: 0.8717
Supporting reasons: Identified as a swing high resistance, indicating a potential level that could cap further upward movement.

Potential Direction: Bearish
Overall momentum of the chart: Bullish
The price could see a short-term pullback toward the pivot before continuing its bearish move down toward the 1st support.
Pivot: 1.3458
Supporting reasons: Identified as a pullback resistance, where selling pressures could intensify and potentially cap any upward retracement.
1st support: 1.3345
Supporting reasons: Identified as a pullback support, indicating a potential area where the price could stabilize once more.
1st resistance: 1.3554
Supporting reasons: Identified as an overlap resistance, indicating a potential level that could halt further upward movement.

Potential Direction: Bullish
Overall momentum of the chart: Bullish
The price could see a short-term pullback toward the pivot before continuing its bearish move down toward the 1st support.
Pivot: 212.99
Supporting reasons: Identified as a pullback resistance, where selling pressures could intensify and potentially cap any upward retracement.
1st support: 211.72
Supporting reasons: Identified as a swing low support, indicating a potential level where the price could stabilize once more.
1st resistance: 214.39
Supporting reasons: Identified as a swing high resistance, indicating a potential level that could halt further upward movement.

Potential Direction: Bullish
Overall momentum of the chart: Bearish
Price could see a short-term pullback toward the pivot before rising again toward the 1st resistance.
Pivot: 0.7825
Supporting reasons: Identified as a pullback support, where renewed buying pressure could emerge to push the price higher.
1st support: 0.7795
Supporting reasons: Identified as a pullback support, indicating a potential level where the price could stabilize once again.
1st resistance: 0.7873
Supporting reasons: Identified as a pullback resistance, indicating a potential level that could cap further upward movement.

Potential Direction: Bullish
Overall momentum of the chart: Bullish
The price could see a short-term pullback toward the pivot before continuing its bearish move down toward the 1st support.
Pivot: 157.90
Supporting reasons: Identified as a pullback resistance, where selling pressures could intensify and potentially cap any upward retracement.
1st support: 156.94
Supporting reasons: Identified as an overlap support, indicating a strong area where buyers might return, and the price could stabilize once again.
1st resistance: 159.03
Supporting reasons: Identified as a pullback resistance. This level represents the next key area where upward movement could be capped amid increased selling pressure

Potential Direction: Bullish
Overall momentum of the chart: Bullish
The price could see a short-term pullback toward the pivot before continuing its bearish move down toward the 1st support.
Pivot: 1.3710
Supporting reasons: Identified as a pullback support, where renewed buying pressure could emerge to push the price higher.
1st support: 1.3664
Supporting reasons: Identified as an overlap support, indicating a key level where the price could stabilize once more.
1st resistance: 1.3753
Supporting reasons: Identified as a resistance that aligns with the 127.2% Fibonacci extension, making it a possible target for bullish advances and a level where some sellers could return to cap gains

Potential Direction: Bullish
Overall momentum of the chart: Bullish
The price could see a short-term pullback toward the pivot before continuing its bearish move down toward the 1st support.
Pivot: 0.7190
Supporting reasons: Identified as a pullback support that aligns with the 61.8% Fibonacci retracement, where renewed buying pressure could emerge to push the price higher.
1st support: 0.7107
Supporting reasons: Identified as a swing low support, this area has provided strong support historically and may attract buying interest for a potential short-term bounce
1st resistance: 0.7277
Supporting reasons: Identified as a swing resistance, indicating a potential area that could halt any further upward movement.

Potential Direction: Bearish
Overall momentum of the chart: Bullish
The price could see a short-term pullback toward the pivot before continuing its bearish move down toward the 1st support.
Pivot: 0.5920
Supporting reasons: Identified as a pullback resistance, where selling pressures could intensify and potentially cap any upward retracement.
1st support: 0.5873
Supporting reasons: Identified as a pullback support, this area has provided strong support historically and may attract buying interest for a potential short-term bounce
1st resistance: 0.5964
Supporting reasons: Identified as a swing high resistance, indicating a potential area that could halt any further upward movement.

Potential Direction: Bullish
Overall momentum of the chart: Bullish
The price could see a short-term pullback toward the pivot before continuing its bearish move down toward the 1st support.
Pivot: 49,795.35
Supporting reasons: Identified as a pullback support, where renewed buying pressure could emerge to push the price higher.
1st support: 49,319.17
Supporting reasons: Identified as an overlap support, suggesting a potential area where the price could stabilize once again.
1st resistance: 50,201.23
Supporting reasons: Identified as a swing high resistance, indicating a potential area that could halt any further upward movement.

Potential Direction: Bearish
Overall momentum of the chart: Bullish
The price could see a short-term pullback toward the pivot before continuing its bearish move down toward the 1st support.
Pivot: 24,585.01
Supporting reasons: Identified as a pullback resistance that aligns with the 50% Fibonacci retracement, where selling pressures could intensify and potentially cap any upward retracement.
1st support: 24,187.69
Supporting reasons: Identified as a pullback support, indicating a key level where the price could stabilize once more.
1st resistance: 24,796.67
Supporting reasons: Identified as a pullback resistance, indicating a potential area that could halt any further upward movement.

Potential Direction: Bullish
Overall momentum of the chart: Bullish
Price could see a short-term pullback toward the pivot before rising again toward the 1st resistance.
Pivot: 7,424.58
Supporting reasons: Identified as a pullback support, where renewed buying pressure could emerge to push the price higher.
1st support: 7,370.10
Supporting reasons: Identified as an overlap support, indicating a potential level where the price could stabilize once again.
1st resistance: 7,530.85
Supporting reasons: Identified as a resistance that aligns with the 100% Fibonacci projection, indicating a potential area that could halt any further upward movement.

Potential Direction: Bullish
Overall momentum of the chart: Bearish
The price has already bounced off the pivot and may continue its bullish move toward the 1st resistance
Pivot: 79,5361.92
Supporting reasons: Identified as a pullback support that aligns with the 50% Fibonacci retracement, where renewed buying pressure could emerge to push the price higher.
1st support: 77,288.07
Supporting reasons: Identified as a pullback support, indicating a potential level where the price could stabilize once more.
1st resistance: 82,076.01
Supporting reasons: Identified as a swing high resistance, indicating a potential area that could halt any further upward movement.

Potential Direction: Bullish
Overall momentum of the chart: Bullish
Price could see a short-term pullback toward the pivot before rising again toward the 1st resistance.
Pivot: 2,266.40
Supporting reasons: Identified as a pullback support, where renewed buying pressure could emerge to push the price higher.
1st support: 2,217.56
Supporting reasons: Identified as a swing low support, indicating a potential level where the price could stabilize once more.
1st resistance: 2,319.04
Supporting reasons: Identified as an overlap resistance, indicating a potential area that could halt any further upward movement.

Potential Direction: Bullish
Overall momentum of the chart: Bullish
The price has already bounced off the pivot and may continue its bullish move toward the 1st resistance
Pivot: 99.97
Supporting reasons: Identified as a pullback support, where renewed buying pressure could emerge to push the price higher.
1st support: 94.89
Supporting reasons: Identified as a pullback support, indicating a key level where the price could stabilize once more.
1st resistance: 110.90
Supporting reasons: Identified as a swing high resistance, indicating a potential area that could halt any further upward movement.

Potential Direction: Bearish
Overall momentum of the chart: Bullish
The price could see a short-term pullback toward the pivot before continuing its bearish move down toward the 1st support
Pivot: 4,651.91
Supporting reasons: Identified as a pullback resistance, where selling pressures could intensify and potentially cap any upward retracement.
1st support: 4,579.04
Supporting reasons: Identified as a pullback support, indicating a key level where the price could stabilize once more.
1st resistance: 4,698.79
Supporting reasons: Identified as a swing high resistance, indicating a potential area that could halt any further upward movement.

The accuracy, completeness and timeliness of the information contained on this site cannot be guaranteed. IC Markets Global does not warranty, guarantee or make any representations, or assume any liability regarding financial results based on the use of the information in the site.
News, views, opinions, recommendations and other information obtained from sources outside of www.icmarkets.com, used in this site are believed to be reliable, but we cannot guarantee their accuracy or completeness. All such information is subject to change at any time without notice. IC Markets Global assumes no responsibility for the content of any linked site.
The fact that such links may exist does not indicate approval or endorsement of any material contained on any linked site. IC Markets Global is not liable for any harm caused by the transmission, through accessing the services or information on this site, of a computer virus, or other computer code or programming device that might be used to access, delete, damage, disable, disrupt or otherwise impede in any manner, the operation of the site or of any user’s software, hardware, data or property.
The post Friday 15th May 2026: Technical Outlook and Review first appeared on IC Your Trading Edge | Official Blog.
430513 May 15, 2026 13:00 ICMarkets Market News
Market Rally on Trade Optimism – S&P up 0.8%
US equity markets pushed to fresh record highs overnight as investors continued to favour risk assets amid growing optimism surrounding President Trump’s trip to China. Technology stocks once again led the move higher, helping lift the Nasdaq 0.88% to a fresh record close of 26,635, while the S&P 500 gained 0.77% to finish at 7,501. The Dow Jones also rallied strongly, rising 0.75% to close above the 50,000 mark at 50,063.
US Treasury yields and the US dollar both moved higher through the session as markets continued to position for the possibility of firmer US inflation data later this week and a Federal Reserve that remains patient on rate cuts. The US 2-year Treasury yield climbed 3.9 basis points to 4.018%, while the 10-year yield added 1.3 basis points to 4.482%. The US Dollar Index also strengthened, rising 0.37% to 98.89.
In commodity markets, oil prices edged higher as traders continued to monitor shipping activity through the Strait of Hormuz and assess ongoing geopolitical risks across the Middle East. Brent crude rose 0.94% to USD 106.62 per barrel, while WTI crude gained 1.04% to USD 102.07 per barrel.
Gold prices drifted lower during the session, with the stronger US dollar weighing on precious metals demand. Spot gold fell 0.78% to USD 4,651.98 per ounce.
Stocks at Record Levels for How Much Longer
The major US stock indices pushed higher again last night, with the S&P and Nasdaq again hitting record closes, all while the world continues to watch the Middle East for a potential escalation in hostilities and US inflation data continues to rise. US earnings reports came in very strong over the last few weeks, and the economy is remaining resilient, with the jobs data also beating estimates alongside this week’s inflation updates. However, some investors are concerned that the drive higher has largely been supported by a narrow section of the market and that the Fed flipping to a more hawkish outlook could lead to some major corrections in the coming weeks, especially if hostilities increase again in the Middle East. Friday is always a classic take-profit day ahead of weekend risk events, so the potential for a pullback later today is on some investors’ minds.
Geopolitics to Dominate Markets into the Weekend
Attention today is likely to remain firmly focused on geopolitical developments, with a relatively quiet economic calendar leaving markets sensitive to any fresh headlines surrounding the US-China talks and further developments in the Middle East. Traders will also keep an eye on US Empire State Manufacturing Index data (exp. 7.3) during the US session for any further insight into the health of the US economy. FX traders will also be keeping a close eye on the yen into the weekend after it broke through a sticky level in trading yesterday that many thought was a line in the sand for the Japanese authorities, knowing that intervention has a lot more punch in thinner liquidity sessions at the end of the week.
Explore all upcoming market events in the Economic Calendar.
The post General Market Analysis – 15/05/26 first appeared on IC Your Trading Edge | Official Blog.
430512 May 15, 2026 13:00 ICMarkets Market News
IC Markets Global – Asia Fundamental Forecast | 15 May 2026
What happened in the U.S. session?
The hotter-than-expected U.S. producer price report, which sharpened inflation concerns and pushed rate-sensitive markets toward a more defensive stance. That combination supported the dollar and Treasury yields, while crude oil and gold weakened; equities were more mixed, with semiconductors and large-cap tech cushioning the S&P 500 and Nasdaq from the macro headwind.
What does it mean for the Asia Session?
Asian traders should track the policy‑ and geopolitical fallout from the Trump–Xi summit, the stability of the US–Iran ceasefire and Strait of Hormuz logistics, and fresh Asian‑region inflation and trade data that will shape FX and rate expectations. Markets remain vulnerable to oil‑driven risk‑premium moves and sudden risk‑off shocks, but resilient domestic fundamentals and relatively strong Chinese exports are capping the downside on many regional equities and supporting select Asian currencies against a still‑contained dollar.
The Dollar Index (DXY)
Key news events today
No major news event
What can we expect from DXY today?
The dollar strengthened to a one-week high, as robust U.S. inflation data (CPI +3.8% YoY) led traders to reprice the Fed outlook toward fewer rate cuts and possible hikes, while Middle East geopolitical tensions amplified safe-haven demand. The DXY hovered near 98.45–98.56, the euro slipped to $1.1702, the pound fell 0.2%, and the yen weakened to ~157.8 per dollar, with oil prices staying above $100/barrel amid the conflict.
Central Bank Notes:
Next 24 Hours Bias
Weak Bearish
Gold (XAU)
Key news events today
No major news event
What can we expect from Gold today?
Gold remains in a volatile but still structurally bullish phase heading into Friday, with recent reports pointing to a broad range around the mid-$4,600s to $4,800s after earlier spikes above $5,600 and subsequent pullbacks. The main drivers in the latest news are firm U.S. yields, a stronger dollar, and still-elevated geopolitical tension, which have kept price action choppy even as longer-term sentiment stays positive.
Next 24 Hours Bias
Medium Bearish
The Australian Dollar (AUD)
Key news events today
No major news event
What can we expect from AUD today?
The Australian Dollar is relatively steady but vulnerable today, with traders watching the budget, RBA expectations, and global risk sentiment more than any single domestic data release. That mix is keeping AUD directionless in the short term, but also leaves it ready for a sharper move if the budget or external headlines surprise the market.
Central Bank Notes:
Next 24 Hours Bias
Medium Bullish
The Kiwi Dollar (NZD)
Key news events today
No major news event
What can we expect from NZD today?
The New Zealand Dollar has been under modest pressure this week, with NZD/USD hovering around 0.5930–0.5940 as stronger U.S. inflation, a firm U.S. dollar, and geopolitical risk have outweighed the kiwi’s domestic support. At the same time, the RBNZ’s Q2 inflation expectations rose to 2.53% on the two-year horizon and 3.41% on the one-year horizon, which keeps the policy outlook somewhat hawkish and may limit deeper losses in the NZD.
Central Bank Notes:
Next 24 Hours Bias
Weak Bullish
The Japanese Yen (JPY)
Key news events today
No major news event
What can we expect from JPY today?
The Japanese yen is still being driven by a mix of intervention risk, U.S. dollar strength, and market focus on how long Japan can defend key levels near 160 per dollar. The latest reporting suggests Japanese officials may continue stepping into the currency market with U.S. backing, while traders are also watching fresh Japan inflation/producer-price data and broader global risk sentiment for the next move.
Central Bank Notes:
Next 24 Hours Bias
Medium Bearish
Oil
Key news events today
No major news event
What can we expect from Oil today?
Oil finished the week on a firm note on Friday, as renewed U.S.–Iran hostilities and ongoing uncertainty over the Strait of Hormuz’s operability kept risk‑driven premiums embedded in prices; Brent crude has been trading around the mid‑$100s per barrel and WTI near the high‑$90s, supported by limited spare‑capacity buffers and fears that any fresh escalation could further constrict flows, while tentative proposals for navally‑assisted commercial transits have only modestly tempered the rally.
Next 24 Hours Bias
Medium Bullish
The post IC Markets Global – Asia Fundamental Forecast | 15 May 2026 first appeared on IC Your Trading Edge | Official Blog.