Articles


Thursday 14th May 2026: Asia Markets Mixed as Trump-Xi Summit, Samsung Strike Threat and Tech Rally Drive Investor Focus

Thursday 14th May 2026: Asia Markets Mixed as Trump-Xi Summit, Samsung Strike Threat and Tech Rally Drive Investor Focus

430486   May 14, 2026 17:40   ICMarkets   Market News  

Global Markets:

  •  Asian Stock Markets : Nikkei up 0.04%, Shanghai Composite down 1.02% Hang Seng up 0.50% ASX down 0.17%
  • Commodities : Gold at $4,711.34 (0.13%) Silver at $87.675 (-1.91%), Brent Oil at $106.04 (0.38%), WTI Oil at $101.51 (0.49%)
  • Rates : US 10-year yield at 4.461, UK 10-year yield at 5.0750, Germany 10-year yield at 3.1098

News & Data:

  • (USD) Core PPI m/m  1.0%  to 0.3%   expected

Markets Update:

Asia-Pacific markets traded mixed Thursday as investors closely watched a high-stakes meeting between U.S. President Donald Trump and Chinese President Xi Jinping for signals on the future of trade relations between the world’s two largest economies. Trump arrived in Beijing on Wednesday alongside several U.S. business leaders, including Tesla CEO Elon Musk and Nvidia chief Jensen Huang.

Japan’s Nikkei 225 gained 0.27%, while South Korea’s Kospi rose 0.38%. Australia’s S&P/ASX 200 slipped 0.16%. Hong Kong’s Hang Seng index climbed 1.32%, supported by optimism around potential progress in U.S.-China trade discussions.

Samsung shares surged more than 5%, recovering after a sharp selloff linked to a labor dispute that could lead to one of the largest strikes in the company’s history. South Korea’s finance minister warned that an extended strike could hurt economic growth, exports and financial markets.

Analysts at Goldman Sachs expect the Trump-Xi talks to focus mainly on tariffs, export controls, rare earths and semiconductors rather than a broad reset in relations. The bank said China may increase purchases of U.S. goods to avoid further tariff hikes.

Meanwhile, U.S. futures edged higher after the S&P 500 and Nasdaq closed at fresh record highs overnight, driven by continued enthusiasm surrounding technology stocks.

Upcoming Events:

  • 12:30 PM GMT – USD Core Retail Sales m/m

The post Thursday 14th May 2026: Asia Markets Mixed as Trump-Xi Summit, Samsung Strike Threat and Tech Rally Drive Investor Focus first appeared on IC Your Trading Edge | Official Blog.
Full Article

IC Markets Global – Europe Fundamental Forecast | 14 May 2026

IC Markets Global – Europe Fundamental Forecast | 14 May 2026

430485   May 14, 2026 17:00   ICMarkets   Market News  

IC Markets Global – Europe Fundamental Forecast | 14 May 2026

What happened in the Asia session?

Markets navigated lingering U.S.-Iran diplomatic hopes that tempered oil prices (WTI at $96.31 after -2.8% drop), boosting risk assets like Japan’s Nikkei and Korea’s Kospi despite no fresh macro data; however, hawkish BoJ echoes and Middle East risks kept volatility high, most impacting crude futures, tech-heavy indices (Samsung up sharply prior), and yen strength, with broader U.S. futures stable.

What does it mean for the Europe & US sessions?

Traders must monitor the fallout from yesterday’s hotter-than-expected U.S. Producer Price Index rise of 1.4% in April, coupled with weak 30-year bond auction demand, which underscores inflation risks and higher yield pressures potentially strengthening USD across pairs. Eurozone wage slowdown projections to 2.6% offer some ECB relief, but UK housing gloom and Hungary’s robust industrial data add regional volatility, advising caution on EUR, GBP, and commodity-linked moves amid no major releases today.

The Dollar Index (DXY)

Key news events today

Core Retail Sales m/m (12:30 pm GMT)

Retail Sales m/m (12:30 pm GMT)

Unemployment Claims (12:30 pm GMT)

What can we expect from DXY today?

The U.S. dollar maintained gains near a one-week high of 98.5 on the DXY index, supported by persistent Middle East geopolitical risks and lingering effects from yesterday’s stronger U.S. inflation print that bolstered Fed rate-hike bets. The greenback advanced against the yen (157.77) and euro ($1.1702), though broader momentum remains cautious ahead of key data like non-farm payrolls

Central Bank Notes:

  • The Federal Open Market Committee (FOMC) is widely expected to hold the federal funds rate target range steady at 3.50%–3.75% at its April 28–29, 2026, meeting, as oil prices remain elevated around $108 per barrel for Brent crude amid ongoing US-Israel tensions with Iran, alongside surging inflation from energy shocks, further delaying any 2026 rate cuts potentially beyond September.
  • The Committee continues to pursue maximum employment and 2% inflation goals, with the labor market showing mixed signals as nonfarm payrolls rose by 178,000 in March 2026—beating lowered expectations but driven partly by strike reversals—and the unemployment rate edged down to 4.3% from 4.4% in February.
  • Officials face heightened risks from geopolitical tensions, soaring oil prices, and accelerating inflation, with CPI jumping to 3.3% year-over-year in March 2026 from 2.4% in February due to a 10.9% monthly energy surge, headline PCE pressured higher, and core PCE estimates around 3.1% or more.
  • Economic activity continues to cool after robust Q4 2025 growth near 5%, with the Atlanta Fed GDPNow estimating Q1 2026 growth at 1.3% amid softer consumer spending, strike impacts, and labor data despite some resilience.
  • March 2026’s Summary of Economic Projections forecasts 2026 unemployment at a median around 4.4%, GDP growth revised higher, and core PCE up to 2.7%, with the dot plot still signaling one cut in 2026 to a median 3.25%–3.50% funds rate amid softer labor but inflation upticks.
  • The Committee maintains its data-dependent stance amid a mixed labor market, inflation well above target from oil shocks, and geopolitical risks, likely holding rates at 3.50%-3.75% with persistent divisions and hawkish tones on cuts.
  • The FOMC continues its adjusted quantitative tightening, with Treasury rolloff caps at $5 billion per month and agency MBS at $35 billion per month to manage reserves amid post-2025 balance sheet adjustments.
  • The FOMC continues its adjusted quantitative tightening, with Treasury rolloff caps at $5 billion per month and agency MBS at $35 billion per month to ensure ample reserves post-2025 program adjustments.
  • The next meeting is scheduled for 16 to 17  June 2026.

Next 24 Hours Bias
Medium Bearish

Gold (XAU)

Key news events today

Core Retail Sales m/m (12:30 pm GMT)

Retail Sales m/m (12:30 pm GMT)

Unemployment Claims (12:30 pm GMT)

What can we expect from Gold today?

Gold is trading in a mixed but still elevated environment today, with recent market readings putting it around the mid-$4,600s to low-$4,700s per ounce, and traders watching whether it can hold support after a recent pullback. The main drivers are shifting expectations around U.S. rates and yields, safe-haven demand tied to geopolitical risk, and some profit-taking after the strong run higher earlier in the month.

Next 24 Hours Bias   
Weak Bullish

The Euro (EUR)

Key news events today

No major news event

What can we expect from EUR today?

The euro shows limited fresh developments in available reports, with the EUR/USD exchange rate recently at around 1.1739 as of May 12, reflecting a minor 0.38% daily decline amid broader dollar strength. ECB research highlights that eurozone exporters to the US are facing only about 5% of President Trump’s tariffs so far, while the central bank held rates steady with a projected 2.6% inflation rate for 2026 amid spiking energy prices and geopolitical risks.

Central Bank Notes:

  • The Governing Council of the ECB is expected to keep the three key interest rates unchanged at its 28–29 May 2026 meeting, with the main refinancing rate near 2.15%, the marginal lending facility at 2.40%, and the deposit facility at 2.00%.
  • Headline HICP inflation is likely to remain in the 2.0–2.3% range in the early months of 2026, with the March 2026 ECB staff baseline projecting an average of 2.6% for 2026, 2.0% for 2027, and 2.1% for 2028.
  • The updated Eurosystem staff projections for 2026 paint a picture of persistent inflation overshoot, with headline inflation averages of around 2.6% in 2026, 2.0% in 2027, and 2.1% in 2028, compared with about 1.9–2.1% earlier outlooks.
  • Real GDP growth is projected at about 0.9% in 2026, 1.3% in 2027, and 1.4% in 2028, implying around 0.2–0.3% quarter‑on‑quarter expansion in Q2 2026, consistent with the resilience observed at the end of 2025.
  • The euro area unemployment rate is expected to stay near 6.4%, with strong labour‑force participation and modest wage pressures underpinning consumption resilience.
  • The Governing Council continues to stress a meeting‑by‑meeting, data‑dependent approach, focusing on the path of inflation, the functioning of monetary‑policy transmission, and the impact of external shocks (geopolitical, energy, and trade‑policy related).
  • Balance‑sheet normalization proceeds smoothly, with the APP and PEPP wind‑downs completed and the remaining stock of longer‑dated assets being allowed to run off without significant liquidity shortages.

​The next meeting is on 10 to 11 June 2026

Next 24 Hours Bias
Weak Bullish

The Swiss Franc (CHF)

Key news events today

No major news event

What can we expect from CHF today?

The Swiss franc maintains its bullish tone against majors like EUR (near 0.9187 recently) and USD, bolstered by accelerating inflation, a population-cap referendum boosting local demand, and persistent geopolitical uncertainty, though SNB interventions cap explosive upside, with firms betting on further 2026 strength.

Central Bank Notes:

  • At its monetary policy assessment on 19 March 2026, the Swiss National Bank (SNB) is widely expected to leave the policy rate unchanged at 0%, continuing the extended pause since September 2025, as the Governing Board considers current settings adequate to keep inflation near the target without resorting to negative rates.
  • Inflation data since December indicate persistent weakness, with headline CPI hovering around 0% year-on-year through early 2026 and core measures subdued at roughly 0.4%, underscoring limited price pressures and lingering, though contained, deflation risks.
  • The SNB’s updated conditional inflation forecast shows minimal change from December, with averages of about 0.2% in 2025 (now complete), 0.3% in 2026, and 0.6% in 2027 under a steady 0% policy rate. However, recent flat CPI readings may slightly lower near-term expectations, preserving scope for further easing if needed.
  • Global conditions remain challenging, marked by U.S. tariff escalations under President Trump, subdued external demand, and uncertainties in major export markets such as Europe and the U.S., prompting the SNB to exercise caution despite resilient Swiss domestic activity.
  • Sentiment in manufacturing and export sectors stays soft amid franc appreciation and weaker foreign orders, squeezing margins. Yet, overall GDP growth is expected to be around 1.5% in 2026, with unemployment edging up modestly from historic lows.
  • The SNB reaffirms its readiness to intervene via rate cuts or FX operations should deflationary pressures intensify, while emphasizing clear communication through detailed meeting minutes and coordination with global partners on currency matters.

The next meeting is on 18 June 2026.

Next 24 Hours Bias
Medium Bearish

The Pound (GBP)

Key news events today

GDP m/m (6:00 am GMT)

Prelim GDP q/q (6:00 am GMT)

What can we expect from GBP today?

The British Pound (GBP) saw limited specific developments reported precisely, but recent trading reflects ongoing caution amid UK political pressures and global factors. Building on yesterday’s trends, sterling edged lower against a stronger USD, trading around $1.351 after a 0.2% decline, while gaining slightly versus the euro at €1.155 (or EUR/GBP near 0.8659), marking its first weekly drop in six weeks.

Central Bank Notes:

  • The Bank of England’s Monetary Policy Committee (MPC) met on 29 April 2026, maintaining the Bank Rate at 3.75 per cent, with the decision details published on 30 April 2026 alongside the quarterly Monetary Policy Report. This hold follows the unanimous 9-0 vote at the prior 18 March 2026 meeting, amid persistent energy shocks from the Middle East conflict overriding earlier cut expectations. No specific vote split for April has been detailed yet, but consensus previews indicate a hold.
  • Quantitative tightening (QT) continues unchanged at the 2025 pace for gilt holdings reductions, supporting balance-sheet normalization while monitoring liquidity and maintaining restrictiveness against ongoing shocks.
  • Headline CPI inflation rose to 3.3% in March 2026 from energy and motor fuel surges due to Middle East tensions, expected to stay between 3% and 3.5% through the summer, well above the 2% target. The April Monetary Policy Report outlines scenarios in which inflation peaks above 3.5% by the end of 2026 in the baseline, then eases below 2% in three years, or reaches 6%+ in adverse cases requiring tighter policy.
  • UK growth outlook weakens further into Q2-Q3 2026 amid energy-driven cost pressures, rising unemployment risks, and softening confidence, with prior pay growth cooling now vulnerable to business pass-throughs.
  • Global risks from the Middle East conflict persist, fueling energy/commodity volatility and sterling/gilt fluctuations; MPC views direct impacts as containable if demand slackens to curb secondary inflation effects.
  • Inflation risks remain upward-biased due to energy persistence, potential wage embedding, and shock duration uncertainty, balanced against downside from economic slack and labor market softening.
  • The MPC maintains a data-dependent stance, with policy still restrictive; the April Report provides fuller shock analysis, but no easing is signaled, yet members monitor for 2% sustainability, with Governor Bailey emphasizing vigilance.
  • The next meeting is on 18 June 2026.

    Next 24 Hours Bias
    Medium Bearish


The Canadian Dollar (CAD)

Key news events today

No major news event

What can we expect from CAD today?

The Canadian dollar remains stable but slightly pressured, with USD/CAD hovering around 1.36–1.37 as forecasted earlier in the month, reflecting a balance between resilient US economic data, Bank of Canada restraint, and modest commodity support despite recent dips to four-week lows on May 12 due to risk aversion from US-Iran ceasefire concerns.

Central Bank Notes:

  • The Governing Council held the overnight rate target steady at 2.25% at its 28-29 April 2026 meeting, matching consensus expectations and prolonging the policy pause as inflation trends firmer toward target. The Bank highlighted lingering global headwinds from Middle East tensions and U.S. tariff escalations under Trump, but confirmed the stance continues fostering disinflation amid moderating energy volatility.
  • U.S. trade frictions and geopolitical strains persist in dampening sentiment, yet Canadian manufacturing PMI strengthened further in expansion, driven by robust export orders tied to sustained energy demand. Goods exports, anchored by crude oil, maintained strength through March, countering subdued capex as businesses emphasize operational buffers over expansion.
  • Economic growth extended into Q2 2026 at roughly 2.1% annualized, sustaining Q1’s momentum via resource shipments, public spending, and industrial recovery. March preliminary figures suggest resilient expansion, tempered slightly by seasonal factors and lingering supply disruptions.
  • Services PMI rose deeper into expansion territory, with gains across tech, leisure, and professional services; consumer segments showed firmer footing from wage gains, despite elevated prices curbing non-essentials. The Bank views this breadth as signaling a balanced, sustainable upturn.
  • ​National housing resales climbed modestly in March alongside stable prices, supported by steady rates and regional affordability pockets, as inventory accumulation in key markets avoids sharp imbalances. Policymakers expect gradual softening, underpinned by sound lending standards and consistent household dynamics.
  • Headline CPI held near 2.0% year-over-year in March 2026 prints, within the target band, with core metrics like CPI-trim and median easing to around 2.5% on easing food, goods, and partial shelter relief. This bolsters confidence in inflation’s durable path to 2%.
  • Officials affirmed 2.25% appropriately positions the economy for 2% inflation stability and orderly rebalancing, with cuts off the table absent growth or price setbacks. Focus shifts to Q2 momentum, core trends, and trade/geopolitical developments ahead of June.
  • The next meeting is on 10 June 2026.

Next 24 Hours Bias
Medium Bearish

Oil

Key news events today

No major news event

What can we expect from Oil today?

Oil markets are experiencing extreme volatility today due to the ongoing US-Iran conflict and disruptions in the Strait of Hormuz. Brent crude has surged past $120 per barrel amid reports of an extended blockade on Iranian ports, depleting global reserves at a record pace of 15 million barrels daily.

Next 24 Hours Bias
Medium Bullish

The post IC Markets Global – Europe Fundamental Forecast | 14 May 2026 first appeared on IC Your Trading Edge | Official Blog.
Full Article

Thursday 14th May 2026: Technical Outlook and Review

Thursday 14th May 2026: Technical Outlook and Review

430467   May 14, 2026 17:00   ICMarkets   Market News  


DXY (U.S. Dollar Index):

Potential Direction: Bullish

Overall momentum of the chart: Bearish

Price could see a short-term pullback toward the pivot before rising again toward the 1st resistance.

Pivot: 98.25

Supporting reasons: Identified as a pullback support, where renewed buying pressure could emerge to push the price higher.

1st support: 97.82

Supporting reasons: Identified as a swing low support, indicating a potential area where the price could again stabilize.

1st resistance: 98.59
Supporting reasons: Identified as a pullback resistance, indicating a potential area that could halt any further upward movement

EUR/USD:

Potential Direction: Bearish

Overall momentum of the chart: Bullish

The price could see a short-term pullback toward the pivot before continuing its bearish move down toward the 1st support.

Pivot: 1.1727

Supporting reasons: Identified as a pullback resistance, where selling pressures could intensify and potentially cap any upward retracement.

1st support: 1.1671

Supporting reasons: Identified as a support, indicating a potential level where the price could stabilize once again.

1st resistance: 1.1745

Supporting reasons: Identified as a pullback resistance that aligns with the 50% FIbonacci retracement, indicating a potential level that could cap further upward movement.

EUR/JPY:

Potential Direction: Bullish

Overall momentum of the chart: Bullish

Price could see a short-term pullback toward the pivot before rising again toward the 1st resistance.

Pivot: 184.76

Supporting reasons: Identified as a pullback support, where renewed buying pressure could emerge to push the price higher.

1st support: 184.22
Supporting reasons: Identified as a pullback support, indicating a potential area where the price could again stabilize.

1st resistance: 186.31
Supporting reasons: Identified as a pullback resistance that aligns with the 78.6% Fibonacci retracement, indicating a potential level that could cap further upward movement.

EUR/GBP:

Potential Direction: Bullish
Overall momentum of the chart: Bullish

The price could see a short-term pullback toward the pivot before rising again toward the 1st resistance.

Pivot: 0.8655

Supporting reasons: Identified as a pullback support that aligns with the 61.8% Fibonacci retracement, where renewed buying pressure could emerge to push the price higher.

1st support: 0.8630
Supporting reasons: Identified as a support, indicating a potential area where the price could stabilize once more.

1st resistance: 0.8696
Supporting reasons: Identified as an overlap resistance, indicating a potential level that could cap further upward movement.

GBP/USD:

Potential Direction: Bearish
Overall momentum of the chart: Bullish

The price could see a short-term pullback toward the pivot before continuing its bearish move down toward the 1st support.

Pivot: 1.3554

Supporting reasons: Identified as an overlap resistance, where selling pressures could intensify and potentially cap any upward retracement.

1st support: 1.3458
Supporting reasons: Identified as an overlap support, indicating a potential area where the price could stabilize once more.

1st resistance: 1.3657
Supporting reasons: Identified as a swing high resistance, indicating a potential level that could halt further upward movement.

GBP/JPY:

Potential Direction: Bullish

Overall momentum of the chart: Bullish

The price has already bounced off the pivot and may continue its bullish move toward the 1st resistance

Pivot: 212.99

Supporting reasons: Identified as an overlap support, where renewed buying pressure could emerge to push the price higher.

1st support: 211.80
Supporting reasons: Identified as a swing low support, indicating a potential level where the price could stabilize once more.

1st resistance: 215.15
Supporting reasons: Identified as a pullback resistance that aligns with the 78.6% Fibonacci retracement, indicating a potential level that could halt further upward movement.

USD/CHF:

Potential Direction: Bullish

Overall momentum of the chart: Bearish

Price could see a short-term pullback toward the pivot before rising again toward the 1st resistance.

Pivot: 0.7794

Supporting reasons: Identified as a pullback support, where renewed buying pressure could emerge to push the price higher.

1st support: 0.7760
Supporting reasons: Identified as a swing low support, indicating a potential level where the price could stabilize once again.

1st resistance: 0.7848
Supporting reasons: Identified as a swing high resistance, indicating a potential level that could cap further upward movement.

USD/JPY:

Potential Direction: Bearish

Overall momentum of the chart: Bullish

The price could see a short-term pullback toward the pivot before continuing its bearish move down toward the 1st support.

Pivot: 158.08

Supporting reasons: Identified as a pullback resistance that aligns with the 50% Fibonacci retracement, where selling pressures could intensify and potentially cap any upward retracement.

1st support: 156.90

Supporting reasons: Identified as an overlap support, indicating a strong area where buyers might return, and the price could stabilize once again.

1st resistance: 159.03

Supporting reasons: Identified as a pullback resistance. This level represents the next key area where upward movement could be capped amid increased selling pressure

USD/CAD:

Potential Direction: Bullish                                                                                                                                                           

Overall momentum of the chart: Bullish

The price has already bounced off the pivot and may continue its bullish move toward the 1st resistance

Pivot: 1.3694

Supporting reasons: Identified as an overlap support, where renewed buying pressure could emerge to push the price higher.

1st support: 1.3664

Supporting reasons: Identified as an overlap support, indicating a key level where the price could stabilize once more.

1st resistance: 1.3735

Supporting reasons: Identified as a pullback resistance, making it a possible target for bullish advances and a level where some sellers could return to cap gains

AUD/USD:

Potential Direction: Bullish

Overall momentum of the chart: Bullish

The price has already bounced off the pivot and may continue its bullish move toward the 1st resistance

Pivot: 0.7212

Supporting reasons: Identified as a pullback support that aligns with the 50% Fibonacci retracement, where renewed buying pressure could emerge to push the price higher.

1st support: 07190

Supporting reasons: Identified as a pullback support that aligns with the 50% Fibonacci retracement, this area has provided strong support historically and may attract buying interest for a potential short-term bounce

1st resistance: 0.7277

Supporting reasons: Identified as a swing resistance, indicating a potential area that could halt any further upward movement.

NZD/USD

Potential Direction: Bullish

Overall momentum of the chart: Bullish

The price has already bounced off the pivot and may continue its bullish move toward the 1st resistance

Pivot: 0.5920

Supporting reasons: Identified as a pullback support that aligns with the 50% Fibonacci retracement, where renewed buying pressure could emerge to push the price higher.

1st support: 0.5873

Supporting reasons: Identified as a pullback support, this area has provided strong support historically and may attract buying interest for a potential short-term bounce

1st resistance: 0.5991

Supporting reasons: Identified as a swing high resistance, indicating a potential area that could halt any further upward movement.

US30 (DJIA):

Potential Direction: Bullish

Overall momentum of the chart: Bullish

The price has already bounced off the pivot and may continue its bullish move toward the 1st resistance

Pivot: 49,362.50

Supporting reasons: Identified as a pullback support that aligns with the 61.8% Fibonacci retracement, where renewed buying pressure could emerge to push the price higher.

1st support: 48,894.00

Supporting reasons: Identified as a swing low support, suggesting a potential area where the price could stabilize once again.

1st resistance: 50,125.65

Supporting reasons: Identified as a swing high resistance, indicating a potential area that could halt any further upward movement.

DE40 (DAX):

Potential Direction: Bearish

Overall momentum of the chart: Bullish

The price has already reacted off the pivot and may continue its bearish move toward the 1st support.

Pivot: 24,373.32

Supporting reasons: Identified as a pullback resistance that aligns with the 38.2% Fibonacci retracement, where selling pressures could intensify and potentially cap any upward retracement.

1st support: 23,890.66

Supporting reasons: Identified as a swing low support, indicating a key level where the price could stabilize once more.

1st resistance: 24,796.67

Supporting reasons: Identified as a pullback resistance, indicating a potential area that could halt any further upward movement.

US500 (S&P 500):

Potential Direction: Bullish

Overall momentum of the chart: Bullish

Price could see a short-term pullback toward the pivot before rising again toward the 1st resistance.

Pivot: 7,424.58

Supporting reasons: Identified as a pullback support, where renewed buying pressure could emerge to push the price higher.

1st support: 7,370.10

Supporting reasons: Identified as an overlap support, indicating a potential level where the price could stabilize once again.

1st resistance: 7,485.91

Supporting reasons: Identified as a resistance that aligns with the 78.6% Fibonacci projection and the 161.8% Fibonacci extension, indicating a potential area that could halt any further upward movement.

BTC/USD (Bitcoin):

Potential Direction: Bullish

Overall momentum of the chart: Bearish

The price has already bounced off the pivot and may continue its bullish move toward the 1st resistance

Pivot: 79,5361.92

Supporting reasons: Identified as a pullback support that aligns with the 50% Fibonacci retracement, where renewed buying pressure could emerge to push the price higher.

1st support: 77,288.07

Supporting reasons: Identified as a pullback support, indicating a potential level where the price could stabilize once more.

1st resistance: 80,677.49

Supporting reasons: Identified as a pullback resistance, indicating a potential area that could halt any further upward movement.

ETH/USD (Ethereum):

Potential Direction: Bearish

Overall momentum of the chart: Bullish

The price could see a short-term pullback toward the pivot before continuing its bearish move down toward the 1st support

Pivot: 2,278.04

Supporting reasons: Identified as a pullback resistance, where selling pressures could intensify and potentially cap any upward retracement.

1st support: 2,237.61

Supporting reasons: Identified as a swing low support, indicating a potential level where the price could stabilize once more.

1st resistance: 2,319.04
Supporting reasons: Identified as an overlap resistance, indicating a potential area that could halt any further upward movement.

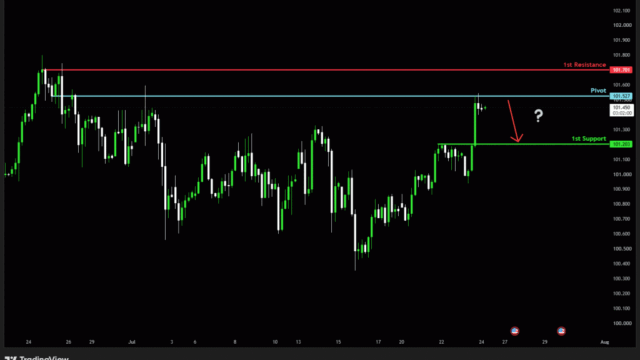
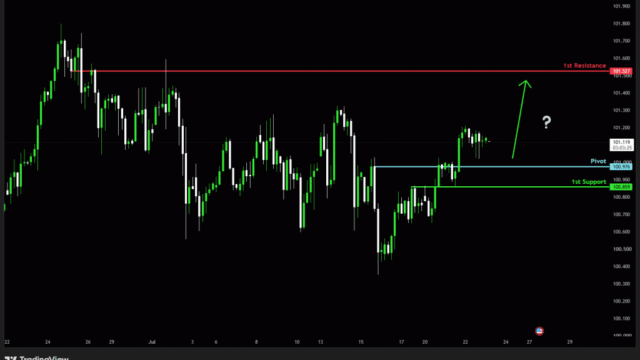
WTI/USD (Oil):

Potential Direction: Bullish

Overall momentum of the chart: Bullish

Price could see a short-term pullback toward the pivot before rising again toward the 1st resistance.

Pivot: 99.97

Supporting reasons: Identified as a pullback support, where renewed buying pressure could emerge to push the price higher.

1st support: 94.89
Supporting reasons: Identified as a pullback support, indicating a key level where the price could stabilize once more.

1st resistance: 110.90
Supporting reasons: Identified as a swing high resistance, indicating a potential area that could halt any further upward movement.

XAU/USD (GOLD):

Potential Direction: Bearish

Overall momentum of the chart: Bullish

The price could see a short-term pullback toward the pivot before continuing its bearish move down toward the 1st support

Pivot: 4,779.01

Supporting reasons: Identified as a pullback resistance, where selling pressures could intensify and potentially cap any upward retracement.

1st support: 4,646.76
Supporting reasons: Identified as an overlap support, indicating a key level where the price could stabilize once more.

1st resistance: 4,889.58
Supporting reasons: Identified as a swing high resistance, indicating a potential area that could halt any further upward movement.

The accuracy, completeness and timeliness of the information contained on this site cannot be guaranteed. IC Markets Global does not warranty, guarantee or make any representations, or assume any liability regarding financial results based on the use of the information in the site.

News, views, opinions, recommendations and other information obtained from sources outside of www.icmarkets.com, used in this site are believed to be reliable, but we cannot guarantee their accuracy or completeness. All such information is subject to change at any time without notice. IC Markets Global assumes no responsibility for the content of any linked site.

The fact that such links may exist does not indicate approval or endorsement of any material contained on any linked site. IC Markets Global is not liable for any harm caused by the transmission, through accessing the services or information on this site, of a computer virus, or other computer code or programming device that might be used to access, delete, damage, disable, disrupt or otherwise impede in any manner, the operation of the site or of any user’s software, hardware, data or property.

The post Thursday 14th May 2026: Technical Outlook and Review first appeared on IC Your Trading Edge | Official Blog.
Full Article

General Market Analysis – 14/05/26

General Market Analysis – 14/05/26

430465   May 14, 2026 16:40   ICMarkets   Market News  

US Tech Rallies Despite More Strong Inflation Data – Nasdaq up 1.2%

US equity markets finished mixed overnight, with technology stocks once again leading the charge higher despite another round of stronger-than-expected US inflation data. The S&P 500 and Nasdaq both closed at fresh record highs as investors continued to favour large-cap tech names, while the Dow Jones edged slightly lower by the close.

US producer price data came in well above expectations, reinforcing the view that the Federal Reserve is unlikely to cut interest rates in the near term. Treasury yields initially pushed higher following the release, while the US dollar gained ground against the major currencies as traders further reduced expectations for policy easing this year.

The Nasdaq rallied 1.20% to close at 26,402, while the S&P 500 gained 0.58% to 7,444. The Dow Jones slipped 0.14% to finish the session at 49,693. The US Dollar Index rose 0.18% to 98.48.

In bond markets, yields remained elevated following the inflation release, although moves moderated later in the session. The US 2-year Treasury yield closed at 3.979%, while the 10-year yield finished at 4.469%.

Oil prices fell for the first time in four sessions as traders digested the lack of fresh geopolitical developments from the Gulf region and weighed the possibility of US interest rates remaining higher for longer. Brent crude dropped 2.19% to US$105.44 per barrel, while WTI crude fell 1.34% to US$100.80.

Gold prices also drifted lower, pressured by the stronger US dollar and steady Treasury yields. Spot gold declined 0.56% to US$4,688.76 per ounce.

Yen in Focus for FX Markets Today

FX traders will be watching USDJPY very closely in the coming sessions, with price action indicating that the Bank of Japan may be active again in the market. There appears to have been a line drawn in the sand just under the 158.00 level, where the pair has topped out on multiple occasions over the course of trading yesterday and since the major intervention on May 6.Stronger US inflation numbers have again led to fundamentals pointing the way north for the pair; however, it seems that the Japanese authorities are determined to limit further yen weakness in the wake of recent intervention. USDJPY is now trading in a very tight range; however, traders are on tenterhooks, knowing that there is likely to be a huge jump in volatility at some point in the coming sessions.Stop-loss orders are likely building above 158.00 now, which could add further pressure on any offers in the market, and expectations for more aggressive action from the MOF are increasing. Whether they hit the market again from current levels or let stops get triggered before stepping in — a technique thought to have even more impact as it hurts speculative trades harder — remains to be seen, but most in the market don’t expect this status quo to last until the weekend.

Geopolitics Jostle with Data for Market Sentiment Today

Market focus today is likely to remain firmly on geopolitical headlines, with President Trump currently in China and traders continuing to monitor developments surrounding the Strait of Hormuz. Alongside the geopolitical backdrop, however, several key economic releases later in the day could also drive volatility across currency, equity, and bond markets.The London session will see reduced liquidity, with both French and Swiss markets off; however, sterling markets are likely to be busy, with key data due out shortly after the open. There is a big data drop scheduled, with GDP numbers the standout release. The market is expecting the headline month-on-month number to show a 0.1% decrease, while the quarterly preliminary data is expected to indicate a 0.6% increase.US data will also be in focus in the New York session, with Retail Sales (exp +0.5% m/m), Core Retail Sales (exp +0.7% m/m), and the Weekly Unemployment Claims numbers (exp 205k) all released close to the open.

Explore all upcoming market events in the Economic Calendar.

The post General Market Analysis – 14/05/26 first appeared on IC Your Trading Edge | Official Blog.
Full Article

IC Markets Global – Asia Fundamental Forecast | 14 May 2026

IC Markets Global – Asia Fundamental Forecast | 14 May 2026

430464   May 14, 2026 16:40   ICMarkets   Market News  

IC Markets Global – Asia Fundamental Forecast | 14 May 2026

What happened in the U.S. session?

A hotter‑than‑expected April PPI release overnight surprised markets and pushed up U.S. Treasury yields as traders priced a higher‑for‑longer Fed path, which in turn pressured rate‑sensitive equities and strengthened the dollar, while company‑specific earnings and tech/semiconductor headlines produced large moves in megacap and chip stocks; the result was mixed U.S. equity performance, a notable rise in the 10‑year Treasury yield, and activity across FX and commodity (oil) markets tied to inflation and geopolitical developments.

What does it mean for the Asia Session?

US April retail sales and weekly jobless claims due on Thursday will drive dollar direction and global risk appetite, while European central‑bank commentary (ECB speeches) and UK GDP/industrial prints will influence the DXY and GBP flows that often spill into Asian FX and equities; simultaneously, Chinese activity and inflation prints from earlier in the week will keep China‑sensitive sectors under focus, and elevated oil prices plus any new Strait of Hormuz developments can quickly shift regional sentiment and pressure Asian energy importers and bond yields.


The Dollar Index (DXY)

Key news events today

Core Retail Sales m/m (12:30 pm GMT)

Retail Sales m/m (12:30 pm GMT)

Unemployment Claims (12:30 pm GMT)

What can we expect from DXY today?

The U.S. Dollar is seeing renewed strength today as traders react to rising U.S. inflation, stronger producer price data, and expectations that the Federal Reserve may keep interest rates higher for longer. Fresh inflation data showed U.S. CPI rising to 3.8% in April, the highest level in roughly three years, mainly driven by higher energy and food prices linked to Middle East tensions and elevated oil costs. At the same time, hotter-than-expected PPI data boosted Treasury yields and reduced expectations for near-term Fed rate cuts, helping the Dollar Index (DXY) climb toward a two-week high.

Central Bank Notes:

  • The Federal Open Market Committee (FOMC) is widely expected to hold the federal funds rate target range steady at 3.50%–3.75% at its April 28–29, 2026, meeting, as oil prices remain elevated around $108 per barrel for Brent crude amid ongoing US-Israel tensions with Iran, alongside surging inflation from energy shocks, further delaying any 2026 rate cuts potentially beyond September.
  • The Committee continues to pursue maximum employment and 2% inflation goals, with the labor market showing mixed signals as nonfarm payrolls rose by 178,000 in March 2026—beating lowered expectations but driven partly by strike reversals—and the unemployment rate edged down to 4.3% from 4.4% in February.
  • Officials face heightened risks from geopolitical tensions, soaring oil prices, and accelerating inflation, with CPI jumping to 3.3% year-over-year in March 2026 from 2.4% in February due to a 10.9% monthly energy surge, headline PCE pressured higher, and core PCE estimates around 3.1% or more.
  • Economic activity continues to cool after robust Q4 2025 growth near 5%, with the Atlanta Fed GDPNow estimating Q1 2026 growth at 1.3% amid softer consumer spending, strike impacts, and labor data despite some resilience.
  • March 2026’s Summary of Economic Projections forecasts 2026 unemployment at a median around 4.4%, GDP growth revised higher, and core PCE up to 2.7%, with the dot plot still signaling one cut in 2026 to a median 3.25%–3.50% funds rate amid softer labor but inflation upticks.
  • The Committee maintains its data-dependent stance amid a mixed labor market, inflation well above target from oil shocks, and geopolitical risks, likely holding rates at 3.50%-3.75% with persistent divisions and hawkish tones on cuts.
  • The FOMC continues its adjusted quantitative tightening, with Treasury rolloff caps at $5 billion per month and agency MBS at $35 billion per month to manage reserves amid post-2025 balance sheet adjustments.
  • The next meeting is scheduled for 16 to 17 June 2026.

Next 24 Hours Bias

Medium Bearish

Gold (XAU)

Key news events today

Core Retail Sales m/m (12:30 pm GMT)

Retail Sales m/m (12:30 pm GMT)

Unemployment Claims (12:30 pm GMT)

What can we expect from Gold today?

Gold entered Thursday, trading in a tactical range as investors balance safe-haven demand from geopolitical uncertainty and strong physical flows against pressure from a firmer US dollar and rising real yields; technicals point to immediate support around $4,440 and resistance near $4,660–4,800.

Next 24 Hours Bias
Weak Bullish

The Australian Dollar (AUD)

Key news events today

Wage Price Index q/q (1:30 am GMT)

What can we expect from AUD today?

The Australian Dollar (AUD) is holding relatively strong today, although volatility remains elevated due to global inflation concerns and geopolitical tensions. The Aussie recently climbed near four-year highs against the US Dollar, supported by the hawkish stance of the Reserve Bank of Australia, which kept interest rates at a high 4.35% after multiple hikes this year. Markets continue to expect Australian rates to stay higher for longer, giving the AUD support through stronger yield demand.

Central Bank Notes:

  • The Reserve Bank of Australia (RBA) raised its cash rate by 25 basis points to 4.35% at the 5 May 2026 meeting, moving into a more restrictive stance as inflation pressures re‑accelerated and the board judged the previous 4.10% level insufficient to re‑anchor the medium‑term outlook.
  • The RBA lifted the cash rate from 4.10% to 4.35% at the 5 May meeting in an 8–1 vote, flagging that the stance is now “more restrictive” and that the Council sees a low but non‑trivial chance of further hikes if inflation risks crystallise.
  • Headline CPI has jumped to 4.6% year‑on‑year for the 12 months to March 2026, up from around 3.7% in February, with trimmed‑mean inflation still above 3.0% (about 3.3–3.8% depending on the series), keeping inflation clearly outside the 2–3% target band.
  • Recent monthly indicators remain sticky in services, housing‑related costs, and discretionary spending, with January and March data showing only modest easing and some upside surprises in housing‑price‑related components, underpinning the case for a stronger‑than‑expected May hike.
  • Global growth has been modestly revised up but remains tempered by ongoing geopolitical tensions, commodity‑price volatility, and elevated oil prices linked to the Middle East conflict, which directly feed into Australian import‑price and transport‑cost inflation.
  • Markets now price the cash rate at 4.35% in June, with futures pathways suggesting a high‑probability hold at the June meeting and only a modest chance of another 25bp hike later in 2026, contingent on further upside in CPI or services‑price data.
  • The RBA continues to emphasise its “data‑dependent” approach under the dual mandate, seeking to bring inflation back toward target without materially undershooting growth or employment, while acknowledging that the Middle East‑driven shock has shifted the path of inflation and policy.
  • The May communication leaned hawkishly neutral to hawkish, with the decision to hike by 25bp and a run‑of‑material referencing rising inflation expectations and the risk of second‑round effects, while still leaving room for a pause in June if upcoming monthly CPI and labour‑force data show a moderating trend.
  • The next meeting is on 15 to 16 June 2026.

Next 24 Hours Bias

Weak Bullish

The Kiwi Dollar (NZD)

Key news events today

No major news event

What can we expect from NZD today?

The New Zealand Dollar (NZD), also known as the “Kiwi,” is trading under mixed pressure today as global risk sentiment, rising US inflation, and expectations around the Reserve Bank of New Zealand continue to shape the market. Investors are closely watching the RBNZ’s inflation expectations data, which showed a rise in both one-year and two-year inflation forecasts, increasing speculation that the central bank could maintain a more cautious or slightly hawkish stance in the coming months.

Central Bank Notes:

  • The Reserve Bank of New Zealand’s (RBNZ) Monetary Policy Committee (MPC) is widely expected to hold the Official Cash Rate (OCR) steady at 2.25% at its 8 April 2026 Monetary Policy Review, aligning with unanimous market consensus from Reuters polls and previews.
  • The MPC continues its data-dependent “wait-and-see” approach after February’s pause, balancing stimulus from prior 325-basis-point cuts against inflation’s path back to the 2% target, with readiness for gradual normalization only if the recovery strengthens or inflation exceeds forecasts.
  • Headline CPI, last at 3.1%, is on track to re-enter the 1-3% band in Q2 2026 and hit 2% by mid-2027, aided by spare capacity, moderating wages, and softer food/fuel prices; two-year business inflation expectations have ticked up slightly to 2.37%.
  • Household spending and housing remain subdued amid cautious consumption, low net migration, and labor market softness, though easing retail rates support budgets; high-frequency GDP indicators show steadying momentum in an early recovery phase.
  • Accommodative borrowing costs from the low OCR are boosting mortgage approvals and sentiment, but business credit growth lags due to uneven confidence; overall stimulus persists below the 3% neutral rate.
  • Risks are balanced, with a favorable global environment—including stronger dairy/meat exports and a softer NZ dollar—offsetting oil shocks and prior China/US trade worries; vigilance remains on second-round inflation effects.
  • Forecasts point to potential OCR hikes starting late 2026 (e.g., December) or early 2027 to 2.50% by year-end if activity/inflation firms, but policy stays supportive if recovery unfolds gradually as expected.
  • The next meeting is on 27 May 2026.

Next 24 Hours Bias

Weak Bearish

The Japanese Yen (JPY)

Key news events today

No major news event

What can we expect from JPY today?

The Japanese Yen (JPY) remains under pressure today, as the US Dollar continues to strengthen following hotter-than-expected US inflation data. Markets are now expecting the US Federal Reserve to keep interest rates higher for longer, and some traders are even pricing in another Fed rate hike later this year. This widening interest-rate gap between the US and Japan has pushed USD/JPY back toward the key 158 level, despite recent intervention efforts by Japanese authorities to support the Yen.

Central Bank Notes:

  • The Policy Board of the Bank of Japan left the short‑term policy rate unchanged at 0.75% at the 27–28 April 2026 meeting, with markets broadly expecting the same level into May 2026 as the bank continues a data‑dependent, gradual‑normalisation stance.
  • The BOJ targets the uncollateralized overnight call rate around 0.75%, signaling that any further hikes toward 1.0% will hinge on wage‑inflation persistence, yen stability, and real‑activity data rather than a pre‑announced timetable.
  • JGB tapering continues on plan, with outright purchases trimmed by ¥400 billion quarterly through Q1 2026, then reduced to ¥200 billion from April onward, aiming for roughly ¥2–3 trillion in monthly net purchases by mid‑2026, adjustable if market or yen volatility spikes.
  • Japan’s economy posts moderate growth into Q1 2026, supported by resilient exports and prior stimulus, but the BOJ has downgraded its 2026 growth outlook as external headwinds and Middle‑East‑related shocks weigh on the pace.
  • Core CPI (ex‑fresh food) is running in the mid‑1% range y/y, with headline inflation at about 1.5% y/y in March 2026, while core‑core measures remain above 2%, reflecting sticky services‑side and wage‑driven inflation.
  • Input‑cost pressures ease from prior peaks, yet services inflation, the 2026 shunto wage deals near 5%, and expectations anchored above 2% support continued price pressures, with upside risks from further yen weakness and geopolitical spikes.
  • Near‑term real GDP may run below trend due to policy tightening and external shocks (e.g., Iran‑related energy risks), but negative real rates, wage gains, and targeted fiscal/capex support should underpin a gradual rebound in consumption and investment.
  • Medium‑term, overseas recovery, labor‑shortage‑driven wage growth, and productivity improvements are expected to keep core inflation near or above 2%, enabling the BOJ to gradually lift rates toward 1.0% in 2026–2027 if activity and wage‑inflation conditions remain aligned.
  • The next meeting is on 15 to 16 June 2026.

Next 24 Hours Bias

Strong Bearish

Oil

Key news events today

No major news event

What can we expect from Oil today?

Oil markets are trading with strong volatility today, as geopolitical tensions in the Middle East continue to dominate sentiment. Crude prices remain elevated after renewed concerns over disruptions through the Strait of Hormuz and stalled U.S.-Iran negotiations increased fears of tighter global supply. WTI crude has been fluctuating near the $98–$102 per barrel range, while Brent crude remains above the psychological $100 level.

Next 24 Hours Bias
Medium Bullish

The post IC Markets Global – Asia Fundamental Forecast | 14 May 2026 first appeared on IC Your Trading Edge | Official Blog.

Full Article


Wednesday 13th May 2026: Asia Markets Mixed as Inflation Worries, Middle East Tensions Weigh on Sentiment

Wednesday 13th May 2026: Asia Markets Mixed as Inflation Worries, Middle East Tensions Weigh on Sentiment

430440   May 13, 2026 16:00   ICMarkets   Market News  

Global Markets:

  •  Asian Stock Markets : Nikkei up 0.77%, Shanghai Composite up 0.09% Hang Seng up 0.27% ASX down 0.48%
  • Commodities : Gold at $4,709.95 (0.47%) Silver at $87.405 (2.10%), Brent Oil at $106.46 (-1.22%), WTI Oil at $100.89 (-1.27%)
  • Rates : US 10-year yield at 4.459, UK 10-year yield at 5.1040, Germany 10-year yield at 3.0966

News & Data:

  • (USD) Core CPI m/m  0.4%  to 0.3%   expected

Markets Update:

Asia-Pacific markets traded mixed on Wednesday as investors assessed a hotter-than-expected April inflation reading alongside concerns over rising oil prices and ongoing tensions in the Middle East.

Investor sentiment remained cautious after U.S. President Donald Trump described the month-old ceasefire between the U.S. and Iran as “unbelievably weak” and “on massive life support.” His remarks followed the rejection of what he called an “unacceptable” counterproposal from Tehran aimed at ending the conflict.

Adding to market uncertainty, Defense Secretary Pete Hegseth said Trump would not require congressional approval to resume military strikes on Iran. The statement came after the administration crossed the 60-day threshold under federal war powers law for obtaining authorization for military action.

Markets are also closely watching preparations for an upcoming meeting between Trump and Chinese President Xi Jinping, where trade discussions are expected to dominate.

Oil prices extended losses, with U.S. West Texas Intermediate crude falling 1.18% to $100.97 per barrel, while Brent crude slipped 1.16% to $106.52.

In Asia, South Korea’s Kospi gained 1.75%, while Japan’s Nikkei 225 rose 0.66%. Hong Kong’s Hang Seng edged 0.24% higher, while China’s CSI 300 was flat. India’s Nifty 50 added 0.25%.

Upcoming Events:

  • 12:30 PM GMT – USD Core PPI m/m

The post Wednesday 13th May 2026: Asia Markets Mixed as Inflation Worries, Middle East Tensions Weigh on Sentiment first appeared on IC Your Trading Edge | Official Blog.

Full Article

IC Markets Global – Europe Fundamental Forecast | 13 May 2026

IC Markets Global – Europe Fundamental Forecast | 13 May 2026

430439   May 13, 2026 15:40   ICMarkets   Market News  

IC Markets Global – Europe Fundamental Forecast | 13 May 2026

What happened in the Asia session?

Uncertainty around the Iran conflict and a fragile ceasefire dominated Asia-session headlines, keeping oil and energy-linked assets volatile and causing risk-off flows that pressured Asian equities and commodity FX; at the same time, the RBNZ’s quarterly Survey of Inflation Expectations (released today) and routine May datapoints from China/Australia/New Zealand kept NZD, local rates, and commodity-sensitive currencies under the microscope, while safe havens (USD, JPY, gold) benefited from the risk repricing.

What does it mean for the Europe & US sessions?

Fresh US inflation/producer‑price signals and any Eurozone data or ECB commentary that alters rate expectations, while oil and Middle East headlines continue to set the tone for energy stocks and inflation risk, together these forces are likely to keep the dollar and yields bid and raise volatility across FX, equities, and commodities as European markets open and US action approaches.

The Dollar Index (DXY)

Key news events today

Core PPI m/m (12:30 pm GMT)

PPI m/m (12:30 pm GMT)

Fed Chair Nomination Vote (Tentative)

What can we expect from DXY today?

The US Dollar is modestly firmer on Wednesday as market attention centers on the US CPI report expected near 3.7% and a key Fed nomination vote, both of which could sharply sway FX flows; this comes against a backdrop of a weak dollar in 2025, followed by intermittent 2026 rebounds driven by geopolitical risk and changing policy expectations.

Central Bank Notes:

  • The Federal Open Market Committee (FOMC) is widely expected to hold the federal funds rate target range steady at 3.50%–3.75% at its April 28–29, 2026, meeting, as oil prices remain elevated around $108 per barrel for Brent crude amid ongoing US-Israel tensions with Iran, alongside surging inflation from energy shocks, further delaying any 2026 rate cuts potentially beyond September.
  • The Committee continues to pursue maximum employment and 2% inflation goals, with the labor market showing mixed signals as nonfarm payrolls rose by 178,000 in March 2026—beating lowered expectations but driven partly by strike reversals—and the unemployment rate edged down to 4.3% from 4.4% in February.
  • Officials face heightened risks from geopolitical tensions, soaring oil prices, and accelerating inflation, with CPI jumping to 3.3% year-over-year in March 2026 from 2.4% in February due to a 10.9% monthly energy surge, headline PCE pressured higher, and core PCE estimates around 3.1% or more.
  • Economic activity continues to cool after robust Q4 2025 growth near 5%, with the Atlanta Fed GDPNow estimating Q1 2026 growth at 1.3% amid softer consumer spending, strike impacts, and labor data despite some resilience.
  • March 2026’s Summary of Economic Projections forecasts 2026 unemployment at a median around 4.4%, GDP growth revised higher, and core PCE up to 2.7%, with the dot plot still signaling one cut in 2026 to a median 3.25%–3.50% funds rate amid softer labor but inflation upticks.
  • The Committee maintains its data-dependent stance amid a mixed labor market, inflation well above target from oil shocks, and geopolitical risks, likely holding rates at 3.50%-3.75% with persistent divisions and hawkish tones on cuts.
  • The FOMC continues its adjusted quantitative tightening, with Treasury rolloff caps at $5 billion per month and agency MBS at $35 billion per month to manage reserves amid post-2025 balance sheet adjustments.
  • The FOMC continues its adjusted quantitative tightening, with Treasury rolloff caps at $5 billion per month and agency MBS at $35 billion per month to ensure ample reserves post-2025 program adjustments.
  • The next meeting is scheduled for 16 to 17  June 2026.

Next 24 Hours Bias
Medium Bearish

Gold (XAU)

Key news events today

Core PPI m/m (12:30 pm GMT)

PPI m/m (12:30 pm GMT)

Fed Chair Nomination Vote (Tentative)

What can we expect from Gold today?

Global gold was trading near the mid-$4,700s per ounce as bullion reacted to a mix of geopolitical risk in West Asia, central-bank rate expectations, and country-specific policy moves that tightened domestic supply dynamics; markets were watching US inflation data and Fed policy signals while India’s surprise increase in import duties lifted domestic prices and added near-term upward pressure on local gold rates.

Next 24 Hours Bias   
Weak Bullish

The Euro (EUR)

Key news events today

No major news event

What can we expect from EUR today?

The euro weakened modestly, trading around the low 1.17s against the dollar as markets balanced mixed euro‑area economic data, including stronger‑than‑expected inflation metrics in some pockets, against persistent expectations that the ECB will begin cutting rates in June; that policy outlook, combined with precautionary safe‑haven flows driven by geopolitical and commodity‑supply concerns, kept downward pressure on the currency.

Central Bank Notes:

  • The Governing Council of the ECB is expected to keep the three key interest rates unchanged at its 28–29 May 2026 meeting, with the main refinancing rate near 2.15%, the marginal lending facility at 2.40%, and the deposit facility at 2.00%.
  • Headline HICP inflation is likely to remain in the 2.0–2.3% range in the early months of 2026, with the March 2026 ECB staff baseline projecting an average of 2.6% for 2026, 2.0% for 2027, and 2.1% for 2028.
  • The updated Eurosystem staff projections for 2026 paint a picture of persistent inflation overshoot, with headline inflation averages of around 2.6% in 2026, 2.0% in 2027, and 2.1% in 2028, compared with about 1.9–2.1% earlier outlooks.
  • Real GDP growth is projected at about 0.9% in 2026, 1.3% in 2027, and 1.4% in 2028, implying around 0.2–0.3% quarter‑on‑quarter expansion in Q2 2026, consistent with the resilience observed at the end of 2025.
  • The euro area unemployment rate is expected to stay near 6.4%, with strong labour‑force participation and modest wage pressures underpinning consumption resilience.
  • The Governing Council continues to stress a meeting‑by‑meeting, data‑dependent approach, focusing on the path of inflation, the functioning of monetary‑policy transmission, and the impact of external shocks (geopolitical, energy, and trade‑policy related).
  • Balance‑sheet normalization proceeds smoothly, with the APP and PEPP wind‑downs completed and the remaining stock of longer‑dated assets being allowed to run off without significant liquidity shortages.

​The next meeting is on 10 to 11 June 2026

Next 24 Hours Bias
Weak Bullish

The Swiss Franc (CHF)

Key news events today

No major news event

What can we expect from CHF today?

The Swiss franc remained near recent multi-month highs as safe‑haven flows and continued euro weakness kept demand for CHF elevated; markets are watching the Swiss National Bank for any signs of selective FX intervention, while economists expect the franc’s structural strength to persist into 2026, weighing on Swiss exporters and keeping hedging demand high.

Central Bank Notes:

  • At its monetary policy assessment on 19 March 2026, the Swiss National Bank (SNB) is widely expected to leave the policy rate unchanged at 0%, continuing the extended pause since September 2025, as the Governing Board considers current settings adequate to keep inflation near the target without resorting to negative rates.
  • Inflation data since December indicate persistent weakness, with headline CPI hovering around 0% year-on-year through early 2026 and core measures subdued at roughly 0.4%, underscoring limited price pressures and lingering, though contained, deflation risks.
  • The SNB’s updated conditional inflation forecast shows minimal change from December, with averages of about 0.2% in 2025 (now complete), 0.3% in 2026, and 0.6% in 2027 under a steady 0% policy rate. However, recent flat CPI readings may slightly lower near-term expectations, preserving scope for further easing if needed.
  • Global conditions remain challenging, marked by U.S. tariff escalations under President Trump, subdued external demand, and uncertainties in major export markets such as Europe and the U.S., prompting the SNB to exercise caution despite resilient Swiss domestic activity.
  • Sentiment in manufacturing and export sectors stays soft amid franc appreciation and weaker foreign orders, squeezing margins. Yet, overall GDP growth is expected to be around 1.5% in 2026, with unemployment edging up modestly from historic lows.
  • The SNB reaffirms its readiness to intervene via rate cuts or FX operations should deflationary pressures intensify, while emphasizing clear communication through detailed meeting minutes and coordination with global partners on currency matters.

The next meeting is on 18 June 2026.

Next 24 Hours Bias
Medium Bearish

The Pound (GBP)

Key news events today

No major news event

What can we expect from GBP today?

Sterling weakened as mounting political noise around Prime Minister Keir Starmer and a pickup in UK gilt yields undermined market confidence, while a firmer US dollar and ongoing expectations for Bank of England easing capped gains; traders cited election setbacks, fiscal concerns, and dovish BoE signals as the main catalysts for the midweek move.

Central Bank Notes:

  • The Bank of England’s Monetary Policy Committee (MPC) met on 29 April 2026, maintaining the Bank Rate at 3.75 per cent, with the decision details published on 30 April 2026 alongside the quarterly Monetary Policy Report. This hold follows the unanimous 9-0 vote at the prior 18 March 2026 meeting, amid persistent energy shocks from the Middle East conflict overriding earlier cut expectations. No specific vote split for April is detailed yet, but consensus previews anticipated a hold.
  • Quantitative tightening (QT) continues unchanged at the 2025 pace for gilt holdings reductions, supporting balance-sheet normalization while monitoring liquidity and maintaining restrictiveness against ongoing shocks.
  • Headline CPI inflation rose to 3.3% in March 2026 from energy and motor fuel surges due to Middle East tensions, expected to stay between 3% and 3.5% through the summer, well above the 2% target. The April Monetary Policy Report outlines scenarios in which inflation peaks above 3.5% by the end of 2026 in the baseline, then eases below 2% in three years, or reaches 6%+ in adverse cases requiring tighter policy.
  • UK growth outlook weakens further into Q2-Q3 2026 amid energy-driven cost pressures, rising unemployment risks, and softening confidence, with prior pay growth cooling now vulnerable to business pass-throughs.
  • Global risks from the Middle East conflict persist, fueling energy/commodity volatility and sterling/gilt fluctuations; MPC views direct impacts as containable if demand slackens to curb secondary inflation effects.
  • Inflation risks remain upward-biased due to energy persistence, potential wage embedding, and shock duration uncertainty, balanced against downside from economic slack and labor market softening.
  • The MPC maintains a data-dependent stance, with policy still restrictive; the April Report provides fuller shock analysis, but no easing is signaled, yet members monitor for 2% sustainability, with Governor Bailey emphasizing vigilance.
  • The next meeting is on 18 June 2026.

    Next 24 Hours Bias
    Medium Bearish


The Canadian Dollar (CAD)

Key news events today

No major news event

What can we expect from CAD today?

The Canadian dollar maintains stability around USD/CAD 1.37, buoyed by oil price fluctuations and de-escalating US-Iran tensions that ease supply disruption fears, though persistent safe-haven demand for USD and BoC’s dovish outlook cap gains; forecasts from major banks like RBC and TD predict gradual CAD strengthening later in the year as rate differentials narrow.

Central Bank Notes:

  • The Governing Council held the overnight rate target steady at 2.25% at its 28-29 April 2026 meeting, matching consensus expectations and prolonging the policy pause as inflation trends firmer toward target. The Bank highlighted lingering global headwinds from Middle East tensions and U.S. tariff escalations under Trump, but confirmed the stance continues fostering disinflation amid moderating energy volatility.
  • U.S. trade frictions and geopolitical strains persist in dampening sentiment, yet Canadian manufacturing PMI strengthened further in expansion, driven by robust export orders tied to sustained energy demand. Goods exports, anchored by crude oil, maintained strength through March, countering subdued capex as businesses emphasize operational buffers over expansion.
  • Economic growth extended into Q2 2026 at roughly 2.1% annualized, sustaining Q1’s momentum via resource shipments, public spending, and industrial recovery. March preliminary figures suggest resilient expansion, tempered slightly by seasonal factors and lingering supply disruptions.
  • Services PMI rose deeper into expansion territory, with gains across tech, leisure, and professional services; consumer segments showed firmer footing from wage gains, despite elevated prices curbing non-essentials. The Bank views this breadth as signaling a balanced, sustainable upturn.
  • ​National housing resales climbed modestly in March alongside stable prices, supported by steady rates and regional affordability pockets, as inventory accumulation in key markets avoids sharp imbalances. Policymakers expect gradual softening, underpinned by sound lending standards and consistent household dynamics.
  • Headline CPI held near 2.0% year-over-year in March 2026 prints, within the target band, with core metrics like CPI-trim and median easing to around 2.5% on easing food, goods, and partial shelter relief. This bolsters confidence in inflation’s durable path to 2%.
  • Officials affirmed 2.25% appropriately positions the economy for 2% inflation stability and orderly rebalancing, with cuts off the table absent growth or price setbacks. Focus shifts to Q2 momentum, core trends, and trade/geopolitical developments ahead of June.
  • The next meeting is on 10 June 2026.

Next 24 Hours Bias
Medium Bearish

Oil

Key news events today

EIA Crude Oil Inventories ( 2:30 pm GMT)

What can we expect from Oil today?

Oil markets were still dominated by Middle East geopolitics disruptions around the Strait of Hormuz and evidence of strained Iranian exports kept a risk premium on crude, leaving Brent and WTI elevated and volatile; at the same time, supply-side developments (including the UAE’s exit from OPEC and OPEC+ production stance) and intermittent diplomatic signals produced rapid intraday swings as traders priced the probability of either further tightening or a near-term easing of tensions.

Next 24 Hours Bias
Medium Bullish

The post IC Markets Global – Europe Fundamental Forecast | 13 May 2026 first appeared on IC Your Trading Edge | Official Blog.

Full Article

Wednesday 13th May 2026: Technical Outlook and Review

Wednesday 13th May 2026: Technical Outlook and Review

430421   May 13, 2026 15:40   ICMarkets   Market News  


DXY (U.S. Dollar Index):

Potential Direction: Bullish

Overall momentum of the chart: Bearish

Price could see a short-term pullback toward the pivot before rising again toward the 1st resistance.

Pivot: 98.15

Supporting reasons: Identified as a pullback support, where renewed buying pressure could emerge to push the price higher.

1st support: 97.63

Supporting reasons: Identified as a swing low support, indicating a potential area where the price could again stabilize.

1st resistance: 98.59
Supporting reasons: Identified as a pullback resistance, indicating a potential area that could halt any further upward movement

EUR/USD:

Potential Direction: Bearish

Overall momentum of the chart: Bullish

The price could see a short-term pullback toward the pivot before continuing its bearish move down toward the 1st support.

Pivot: 1.1749

Supporting reasons: Identified as a pullback resistance, where selling pressures could intensify and potentially cap any upward retracement.

1st support: 1.1714

Supporting reasons: Identified as a pullback support, indicating a potential level where the price could stabilize once again.

1st resistance: 1.1786

Supporting reasons: Identified as a multi-swing high resistance, indicating a potential level that could cap further upward movement.

EUR/JPY:

Potential Direction: Bullish

Overall momentum of the chart: Bullish

Price could see a short-term pullback toward the pivot before rising again toward the 1st resistance.

Pivot: 184.76

Supporting reasons: Identified as a pullback support, where renewed buying pressure could emerge to push the price higher.

1st support: 184.22
Supporting reasons: Identified as a pullback support, indicating a potential area where the price could again stabilize.

1st resistance: 186.31
Supporting reasons: Identified as a pullback resistance that aligns with the 78.6% Fibonacci retracement, indicating a potential level that could cap further upward movement.

EUR/GBP:

Potential Direction: Bullish
Overall momentum of the chart: Bullish

The price could see a short-term pullback toward the pivot before rising again toward the 1st resistance.

Pivot: 0.8655

Supporting reasons: Identified as a pullback support that aligns with the 61.8% Fibonacci retracement, where renewed buying pressure could emerge to push the price higher.

1st support: 0.8630
Supporting reasons: Identified as a support, indicating a potential area where the price could stabilize once more.

1st resistance: 0.8696
Supporting reasons: Identified as an overlap resistance, indicating a potential level that could cap further upward movement.

GBP/USD:

Potential Direction: Bearish
Overall momentum of the chart: Bullish

The price could see a short-term pullback toward the pivot before continuing its bearish move down toward the 1st support.

Pivot: 1.3554

Supporting reasons: Identified as a pullback resistance, where selling pressures could intensify and potentially cap any upward retracement.

1st support: 1.3458
Supporting reasons: Identified as an overlap support, indicating a potential area where the price could stabilize once more.

1st resistance: 1.3657
Supporting reasons: Identified as a swing high resistance, indicating a potential level that could halt further upward movement.

GBP/JPY:

Potential Direction: Bullish

Overall momentum of the chart: Bullish

The price has already bounced off the pivot and may continue its bullish move toward the 1st resistance

Pivot: 212.99

Supporting reasons: Identified as an overlap support, where renewed buying pressure could emerge to push the price higher.

1st support: 211.80
Supporting reasons: Identified as a swing low support, indicating a potential level where the price could stabilize once more.

1st resistance: 215.15
Supporting reasons: Identified as a pullback resistance that aligns with the 78.6% Fibonacci retracement, indicating a potential level that could halt further upward movement.

USD/CHF:

Potential Direction: Bullish

Overall momentum of the chart: Bearish

Price could see a short-term pullback toward the pivot before rising again toward the 1st resistance.

Pivot: 0.7794

Supporting reasons: Identified as a pullback support, where renewed buying pressure could emerge to push the price higher.

1st support: 0.7760
Supporting reasons: Identified as a swing low support, indicating a potential level where the price could stabilize once again.

1st resistance: 0.7848
Supporting reasons: Identified as a swing high resistance, indicating a potential level that could cap further upward movement.

USD/JPY:

Potential Direction: Bearish

Overall momentum of the chart: Bullish

The price could see a short-term pullback toward the pivot before continuing its bearish move down toward the 1st support.

Pivot: 157.88

Supporting reasons: Identified as a pullback resistance that aligns with the 50% Fibonacci retracement, where selling pressures could intensify and potentially cap any upward retracement.

1st support: 156.44

Supporting reasons: Identified as an overlap support, indicating a strong area where buyers might return, and the price could stabilize once again.

1st resistance: 159.03

Supporting reasons: Identified as a pullback resistance. This level represents the next key area where upward movement could be capped amid increased selling pressure

USD/CAD:

Potential Direction: Bullish                                                                                                                                                           

Overall momentum of the chart: Bullish

The price could see a short-term pullback toward the pivot before rising again toward the 1st resistance.

Pivot: 1.3664

Supporting reasons: Identified as an overlap support, where renewed buying pressure could emerge to push the price higher.

1st support: 1.3628

Supporting reasons: Identified as an overlap support, indicating a key level where the price could stabilize once more.

1st resistance: 1.3735

Supporting reasons: Identified as a pullback resistance, making it a possible target for bullish advances and a level where some sellers could return to cap gains

AUD/USD:

Potential Direction: Bullish

Overall momentum of the chart: Bullish

The price has already bounced off the pivot and may continue its bullish move toward the 1st resistance

Pivot: 0.7212

Supporting reasons: Identified as a pullback support that aligns with the 50% Fibonacci retracement, where renewed buying pressure could emerge to push the price higher.

1st support: 07190

Supporting reasons: Identified as a pullback support that aligns with the 50% Fibonacci retracement, this area has provided strong support historically and may attract buying interest for a potential short-term bounce

1st resistance: 0.7277

Supporting reasons: Identified as a swing resistance, indicating a potential area that could halt any further upward movement.

NZD/USD

Potential Direction: Bullish

Overall momentum of the chart: Bullish

The price could see a short-term pullback toward the pivot before rising again toward the 1st resistance.

Pivot: 0.5920

Supporting reasons: Identified as a pullback support that aligns with the 50% Fibonacci retracement, where renewed buying pressure could emerge to push the price higher.

1st support: 0.5873

Supporting reasons: Identified as a pullback support, this area has provided strong support historically and may attract buying interest for a potential short-term bounce

1st resistance: 0.5991

Supporting reasons: Identified as a swing high resistance, indicating a potential area that could halt any further upward movement.

US30 (DJIA):

Potential Direction: Bullish

Overall momentum of the chart: Bullish

The price has already bounced off the pivot and may continue its bullish move toward the 1st resistance

Pivot: 49,362.50

Supporting reasons: Identified as a pullback support that aligns with the 61.8% Fibonacci retracement, where renewed buying pressure could emerge to push the price higher.

1st support: 48,894.00

Supporting reasons: Identified as a swing low support, suggesting a potential area where the price could stabilize once again.

1st resistance: 50,125.65

Supporting reasons: Identified as a swing high resistance, indicating a potential area that could halt any further upward movement.

DE40 (DAX):

Potential Direction: Bearish

Overall momentum of the chart: Bullish

The price has already reacted off the pivot and may continue its bearish move toward the 1st support.

Pivot: 24,373.32

Supporting reasons: Identified as a pullback resistance, where selling pressures could intensify and potentially cap any upward retracement.

1st support: 23,665.10

Supporting reasons: Identified as a swing low support, indicating a key level where the price could stabilize once more.

1st resistance: 25,074.47

Supporting reasons: Identified as a swing high resistance, indicating a potential area that could halt any further upward movement.

US500 (S&P 500):

Potential Direction: Bullish

Overall momentum of the chart: Bullish

The price has already bounced off the pivot and may continue its bullish move toward the 1st resistance

Pivot: 7,370.10

Supporting reasons: Identified as an overlap support, where renewed buying pressure could emerge to push the price higher.

1st support: 7,262.50

Supporting reasons: Identified as a pullback support, indicating a potential level where the price could stabilize once again.

1st resistance: 7,451.27

Supporting reasons: Identified as a resistance that aligns with the 61.8% Fibonacci projection, indicating a potential area that could halt any further upward movement.

BTC/USD (Bitcoin):

Potential Direction: Bullish

Overall momentum of the chart: Bearish

The price has already bounced off the pivot and may continue its bullish move toward the 1st resistance

Pivot: 79,508.18

Supporting reasons: Identified as a pullback support that aligns with the 38.2% Fibonacci retracement, where renewed buying pressure could emerge to push the price higher.

1st support: 77,288.07

Supporting reasons: Identified as a pullback support, indicating a potential level where the price could stabilize once more.

1st resistance: 82,811.88

Supporting reasons: Identified as a swing high resistance, indicating a potential area that could halt any further upward movement.

ETH/USD (Ethereum):

Potential Direction: Bearish

Overall momentum of the chart: Bullish

The price could see a short-term pullback toward the pivot before continuing its bearish move down toward the 1st support

Pivot: 2,318.88

Supporting reasons: Identified as a pullback resistance, where selling pressures could intensify and potentially cap any upward retracement.

1st support: 2,273.07

Supporting reasons: Identified as a swing low support, indicating a potential level where the price could stabilize once more.

1st resistance: 2,364.08
Supporting reasons: Identified as an overlap resistance, indicating a potential area that could halt any further upward movement.

WTI/USD (Oil):

Potential Direction: Bullish

Overall momentum of the chart: Bullish

Price could see a short-term pullback toward the pivot before rising again toward the 1st resistance.

Pivot: 99.97

Supporting reasons: Identified as a pullback support, where renewed buying pressure could emerge to push the price higher.

1st support: 94.89
Supporting reasons: Identified as a pullback support, indicating a key level where the price could stabilize once more.

1st resistance: 110.90
Supporting reasons: Identified as a swing high resistance, indicating a potential area that could halt any further upward movement.

XAU/USD (GOLD):

Potential Direction: Bearish

Overall momentum of the chart: Bullish

The price could see a short-term pullback toward the pivot before continuing its bearish move down toward the 1st support

Pivot: 4,779.01

Supporting reasons: Identified as a pullback resistance, where selling pressures could intensify and potentially cap any upward retracement.

1st support: 4,646.76
Supporting reasons: Identified as an overlap support, indicating a key level where the price could stabilize once more.

1st resistance: 4,889.58
Supporting reasons: Identified as a swing high resistance, indicating a potential area that could halt any further upward movement.

The accuracy, completeness and timeliness of the information contained on this site cannot be guaranteed. IC Markets Global does not warranty, guarantee or make any representations, or assume any liability regarding financial results based on the use of the information in the site.

News, views, opinions, recommendations and other information obtained from sources outside of www.icmarkets.com, used in this site are believed to be reliable, but we cannot guarantee their accuracy or completeness. All such information is subject to change at any time without notice. IC Markets Global assumes no responsibility for the content of any linked site.

The fact that such links may exist does not indicate approval or endorsement of any material contained on any linked site. IC Markets Global is not liable for any harm caused by the transmission, through accessing the services or information on this site, of a computer virus, or other computer code or programming device that might be used to access, delete, damage, disable, disrupt or otherwise impede in any manner, the operation of the site or of any user’s software, hardware, data or property.

The post Wednesday 13th May 2026: Technical Outlook and Review first appeared on IC Your Trading Edge | Official Blog.

Full Article

General Market Analysis – 13/05/26

General Market Analysis – 13/05/26

430420   May 13, 2026 15:00   ICMarkets   Market News  

Stocks Fall as Inflation Rises and Tensions Escalate – Nasdaq down 0.7%

US equity markets finished mixed overnight as investors reacted to another stronger-than-expected US inflation print. Technology stocks led the declines, dragging the Nasdaq down 0.71% to 26,088, while the S&P 500 slipped 0.16% to close at 7,400. The Dow Jones managed to edge 0.11% higher to 49,760 as defensive sectors outperformed in cautious trade. US Treasury yields moved sharply higher following the data, with the 2-year yield rising 3.8 basis points to 3.992% and the benchmark 10-year yield climbing 5 basis points to 4.463%. The move in yields helped push the US dollar broadly stronger, with the DXY gaining 0.36% to 98.31. Geopolitical concerns also remained front of mind for markets as traders continued to monitor the risk of an end to the ceasefire agreement in the Gulf. Oil prices extended their recent rally amid fears that the Strait of Hormuz could remain closed for an extended period, further tightening global supply conditions. Brent crude surged 3.18% to settle at $107.52 per barrel, while WTI crude jumped 4.10% to $102.00. Despite the elevated geopolitical tensions and stronger oil prices, gold eased back into recent trading ranges, with the precious metal slipping 0.43% to close at $4,713.65 per ounce as the stronger US dollar weighed on sentiment.

Inflation and Jobs Data Point One Way for the Fed

Last night’s CPI data came in stronger than expected, reinforcing expectations that the Federal Reserve is unlikely to deliver any rate cuts this year, and unless we see a sharp turnaround in data in the coming months, the market is now looking for the next move from the FOMC to be a hike. Friday’s jobs numbers started the move, and they were reinforced by last night’s numbers. The earliest that the market now expects a rate move is the October meeting, with the market now seeing an 18% chance that a hike could be implemented then, and just a 3% chance of a cut. However, the real moves in expectations have come for the December meeting, with chances of a 25-basis-point hike now up to 30% after last night’s data. If the CPI print is reinforced by another strong number in today’s PPI release, then traders are expecting those hike odds to increase and US yields and the dollar to start to pick up more topside momentum.

Geopolitics and Inflation Data in Play Again Today

Geopolitics is again likely to set the tone for most of the trading day today, with updates from the Middle East the most impactful, while markets will also remain highly sensitive to headlines surrounding President Trump’s trip to China, with any developments on trade negotiations likely to generate further volatility across FX, commodity, and equity markets. The Asian session will see a focus on Australian markets early in the day, with Wage Price Index (exp +0.8%) numbers due out. There is again little of note in the London session; however, in the US session, focus will turn to another key US inflation update tonight, with Producer Price Index (PPI) data due during the New York session. The market is expecting the headline month-on-month number to show a 0.5% increase, with the core data showing a 0.3% increase.

Explore all upcoming market events in the Economic Calendar.

The post General Market Analysis – 13/05/26 first appeared on IC Your Trading Edge | Official Blog.

Full Article

IC Markets Global – Asia Fundamental Forecast | 13 May 2026

IC Markets Global – Asia Fundamental Forecast | 13 May 2026

430419   May 13, 2026 15:00   ICMarkets   Market News  

IC Markets Global – Asia Fundamental Forecast | 13 May 2026

What happened in the U.S. session?

Hotter-than-expected April CPI and weak ADP jobs data, amplifying inflation fears from the Iran war’s energy shock, which pushed oil and gold sharply higher while pressuring stock futures and strengthening the dollar, highlighting persistent Fed policy caution into 2026.

What does it mean for the Asia Session?

Ongoing US-Iran tensions, as President Trump’s rejection of Tehran’s latest peace proposal has kept the Strait of Hormuz largely closed, driving oil prices up over 3% recently and creating supply fears that could spike volatility in energy markets and related equities.


The Dollar Index (DXY)

Key news events today

Core PPI m/m (12:30 pm GMT)

PPI m/m (12:30 pm GMT)

Fed Chair Nomination Vote (Tentative)

What can we expect from DXY today?

The U.S. dollar is trading in a cautious, consolidative range supported by ongoing geopolitical risk and a relatively attractive U.S. yield backdrop but capped by softer growth indicators and anticipation of the April U.S. inflation report. Against the euro, the greenback is flat, while it retains an edge over the yen and several Asian currencies as safe‑haven demand and energy‑linked risk‑off sentiment continue to underpin its value without a clear directional breakout yet.

Central Bank Notes:

  • The Federal Open Market Committee (FOMC) is widely expected to hold the federal funds rate target range steady at 3.50%–3.75% at its April 28–29, 2026, meeting, as oil prices remain elevated around $108 per barrel for Brent crude amid ongoing US-Israel tensions with Iran, alongside surging inflation from energy shocks, further delaying any 2026 rate cuts potentially beyond September.
  • The Committee continues to pursue maximum employment and 2% inflation goals, with the labor market showing mixed signals as nonfarm payrolls rose by 178,000 in March 2026—beating lowered expectations but driven partly by strike reversals—and the unemployment rate edged down to 4.3% from 4.4% in February.
  • Officials face heightened risks from geopolitical tensions, soaring oil prices, and accelerating inflation, with CPI jumping to 3.3% year-over-year in March 2026 from 2.4% in February due to a 10.9% monthly energy surge, headline PCE pressured higher, and core PCE estimates around 3.1% or more.
  • Economic activity continues to cool after robust Q4 2025 growth near 5%, with the Atlanta Fed GDPNow estimating Q1 2026 growth at 1.3% amid softer consumer spending, strike impacts, and labor data despite some resilience.
  • March 2026’s Summary of Economic Projections forecasts 2026 unemployment at a median around 4.4%, GDP growth revised higher, and core PCE up to 2.7%, with the dot plot still signaling one cut in 2026 to a median 3.25%–3.50% funds rate amid softer labor but inflation upticks.
  • The Committee maintains its data-dependent stance amid a mixed labor market, inflation well above target from oil shocks, and geopolitical risks, likely holding rates at 3.50%-3.75% with persistent divisions and hawkish tones on cuts.
  • The FOMC continues its adjusted quantitative tightening, with Treasury rolloff caps at $5 billion per month and agency MBS at $35 billion per month to manage reserves amid post-2025 balance sheet adjustments.
  • The next meeting is scheduled for 16 to 17 June 2026.

Next 24 Hours Bias

Medium Bearish

Gold (XAU)

Key news events today

Core PPI m/m (12:30 pm GMT)

PPI m/m (12:30 pm GMT)

Fed Chair Nomination Vote (Tentative)

What can we expect from Gold today?

Gold prices have been experiencing downward pressure recently amid heightened geopolitical tensions and inflation concerns. On May 11, 2026, spot gold traded at around $4,674.20 per ounce, down 1.2% from the prior close, influenced by stalled U.S.-Iran peace talks, President Trump’s rejection of Iran’s proposal, rising oil prices above $103 per barrel, and expectations of prolonged high Federal Reserve interest rates.

Next 24 Hours Bias
Weak Bullish

The Australian Dollar (AUD)

Key news events today

Wage Price Index q/q (1:30 am GMT)

What can we expect from AUD today?

The Australian Dollar (AUD) showed mixed performance, trading cautiously around 0.7220-0.7230 against the USD amid anticipation for Australia’s federal budget release scheduled for that day at 09:30 GMT. On the prior day, May 12, the AUD dipped 0.14%-0.23% to about 72.38 US cents, influenced by risk-off sentiment from renewed US-Iran tensions and broader market caution ahead of the budget, which Treasurer Jim Chalmers highlighted would address housing and tax system challenges.

Central Bank Notes:

  • The Reserve Bank of Australia (RBA) raised its cash rate by 25 basis points to 4.35% at the 5 May 2026 meeting, moving into a more restrictive stance as inflation pressures re‑accelerated and the board judged the previous 4.10% level insufficient to re‑anchor the medium‑term outlook.
  • The RBA lifted the cash rate from 4.10% to 4.35% at the 5 May meeting in an 8–1 vote, flagging that the stance is now “more restrictive” and that the Council sees a low but non‑trivial chance of further hikes if inflation risks crystallise.
  • Headline CPI has jumped to 4.6% year‑on‑year for the 12 months to March 2026, up from around 3.7% in February, with trimmed‑mean inflation still above 3.0% (about 3.3–3.8% depending on the series), keeping inflation clearly outside the 2–3% target band.
  • Recent monthly indicators remain sticky in services, housing‑related costs, and discretionary spending, with January and March data showing only modest easing and some upside surprises in housing‑price‑related components, underpinning the case for a stronger‑than‑expected May hike.
  • Global growth has been modestly revised up but remains tempered by ongoing geopolitical tensions, commodity‑price volatility, and elevated oil prices linked to the Middle East conflict, which directly feed into Australian import‑price and transport‑cost inflation.
  • Markets now price the cash rate at 4.35% in June, with futures pathways suggesting a high‑probability hold at the June meeting and only a modest chance of another 25bp hike later in 2026, contingent on further upside in CPI or services‑price data.
  • The RBA continues to emphasise its “data‑dependent” approach under the dual mandate, seeking to bring inflation back toward target without materially undershooting growth or employment, while acknowledging that the Middle East‑driven shock has shifted the path of inflation and policy.
  • The May communication leaned hawkishly neutral to hawkish, with the decision to hike by 25bp and a run‑of‑material referencing rising inflation expectations and the risk of second‑round effects, while still leaving room for a pause in June if upcoming monthly CPI and labour‑force data show a moderating trend.
  • The next meeting is on 15 to 16 June 2026.

Next 24 Hours Bias

Weak Bullish

The Kiwi Dollar (NZD)

Key news events today

No major news event

What can we expect from NZD today?

The NZD traded steadily amid a ‘risk-on’ backdrop from geopolitical de-escalation, holding near recent two-week highs around 0.5910 against the USD, while RBNZ’s data-dependent stance under Governor Anna Breman tempers aggressive hike expectations until July or later; broader forecasts from ANZ point to gradual appreciation toward fair value above 0.62 through the year.

Central Bank Notes:

  • The Reserve Bank of New Zealand’s (RBNZ) Monetary Policy Committee (MPC) is widely expected to hold the Official Cash Rate (OCR) steady at 2.25% at its 8 April 2026 Monetary Policy Review, aligning with unanimous market consensus from Reuters polls and previews.
  • The MPC continues its data-dependent “wait-and-see” approach after February’s pause, balancing stimulus from prior 325-basis-point cuts against inflation’s path back to the 2% target, with readiness for gradual normalization only if the recovery strengthens or inflation exceeds forecasts.
  • Headline CPI, last at 3.1%, is on track to re-enter the 1-3% band in Q2 2026 and hit 2% by mid-2027, aided by spare capacity, moderating wages, and softer food/fuel prices; two-year business inflation expectations have ticked up slightly to 2.37%.
  • Household spending and housing remain subdued amid cautious consumption, low net migration, and labor market softness, though easing retail rates support budgets; high-frequency GDP indicators show steadying momentum in an early recovery phase.
  • Accommodative borrowing costs from the low OCR are boosting mortgage approvals and sentiment, but business credit growth lags due to uneven confidence; overall stimulus persists below the 3% neutral rate.
  • Risks are balanced, with a favorable global environment—including stronger dairy/meat exports and a softer NZ dollar—offsetting oil shocks and prior China/US trade worries; vigilance remains on second-round inflation effects.
  • Forecasts point to potential OCR hikes starting late 2026 (e.g., December) or early 2027 to 2.50% by year-end if activity/inflation firms, but policy stays supportive if recovery unfolds gradually as expected.
  • The next meeting is on 27 May 2026.

Next 24 Hours Bias

Weak Bearish

The Japanese Yen (JPY)

Key news events today

No major news event

What can we expect from JPY today?

The currency remains under pressure from multiple prior interventions (late April to early May) that propped it up temporarily from 160+ levels to around 155-157 against the dollar, though gains often faded due to wide interest rate gaps, steady BoJ rates at 0.75%, and global factors like oil prices.

Central Bank Notes:

  • The Policy Board of the Bank of Japan left the short‑term policy rate unchanged at 0.75% at the 27–28 April 2026 meeting, with markets broadly expecting the same level into May 2026 as the bank continues a data‑dependent, gradual‑normalisation stance.
  • The BOJ targets the uncollateralized overnight call rate around 0.75%, signaling that any further hikes toward 1.0% will hinge on wage‑inflation persistence, yen stability, and real‑activity data rather than a pre‑announced timetable.
  • JGB tapering continues on plan, with outright purchases trimmed by ¥400 billion quarterly through Q1 2026, then reduced to ¥200 billion from April onward, aiming for roughly ¥2–3 trillion in monthly net purchases by mid‑2026, adjustable if market or yen volatility spikes.
  • Japan’s economy posts moderate growth into Q1 2026, supported by resilient exports and prior stimulus, but the BOJ has downgraded its 2026 growth outlook as external headwinds and Middle‑East‑related shocks weigh on the pace.
  • Core CPI (ex‑fresh food) is running in the mid‑1% range y/y, with headline inflation at about 1.5% y/y in March 2026, while core‑core measures remain above 2%, reflecting sticky services‑side and wage‑driven inflation.
  • Input‑cost pressures ease from prior peaks, yet services inflation, the 2026 shunto wage deals near 5%, and expectations anchored above 2% support continued price pressures, with upside risks from further yen weakness and geopolitical spikes.
  • Near‑term real GDP may run below trend due to policy tightening and external shocks (e.g., Iran‑related energy risks), but negative real rates, wage gains, and targeted fiscal/capex support should underpin a gradual rebound in consumption and investment.
  • Medium‑term, overseas recovery, labor‑shortage‑driven wage growth, and productivity improvements are expected to keep core inflation near or above 2%, enabling the BOJ to gradually lift rates toward 1.0% in 2026–2027 if activity and wage‑inflation conditions remain aligned.
  • The next meeting is on 15 to 16 June 2026.

Next 24 Hours Bias

Strong Bearish

Oil

Key news events today

EIA Crude Oil Inventories ( 2:30 pm GMT)

What can we expect from Oil today?

Oil markets are consolidating after a sharp April rally, with Brent and WTI remaining in the low‑ to mid‑$100s region on residual fears of Strait‑of‑Hormuz disruptions and U.S.–Iran tensions, tempered by expectations of ample global supply later in the year; traders are watching Middle‑East diplomacy, floating‑storage levels, and U.S. inventory data for signals on whether the current tightness is structural or a temporary geopolitical premium.

Next 24 Hours Bias
Medium Bullish

The post IC Markets Global – Asia Fundamental Forecast | 13 May 2026 first appeared on IC Your Trading Edge | Official Blog.

Full Article

Forward · Rewind
