430398 May 12, 2026 17:40 ICMarkets Market News

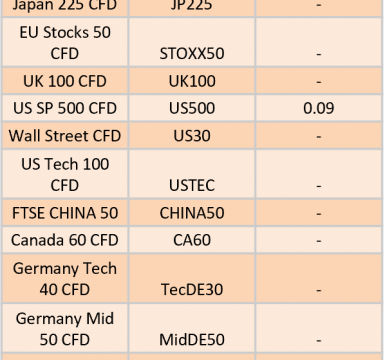
The post Ex-Dividend 13/05/2026 first appeared on IC Your Trading Edge | Official Blog.
430395 May 12, 2026 16:00 ICMarkets Market News
Markets are poised for more moves in financial markets over the next few sessions as fundamental updates are released alongside a continuous stream of geopolitical updates on the Middle East. For the moment news from the Middle East is likely to dictate the major short term moves in FX, but fundamental updates out of the US this week will have a big say in the medium term and long term moves in the dollar.
We have major inflation numbers out of the US this week with both the CPI and PPI data due out and although the CPI will probably capture the initial reaction earlier in the week and big surprises in the PPI numbers released on Wednesday could see more impact on the majors. The headline month-on-month PPI number is expected to show a 0.5% increase while the more stable Core data is expected to come in with a 0.3% increase, with both indicating more inflationary pressure on the US economy. If these numbers reinforce a strong CPI print on Tuesday, then we could see topside moves in the dollar start to pick up, whereas if we see weaker prints, traders are expecting to see more weakening for the greenback.
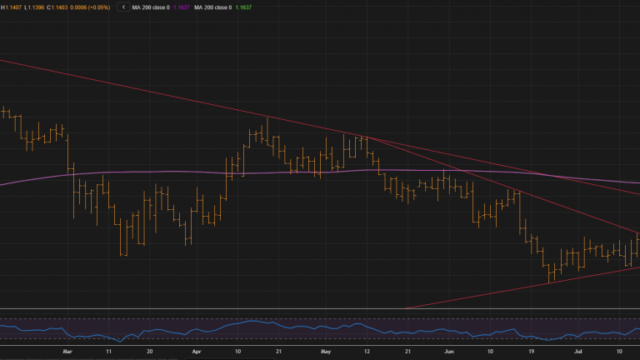
The Euro is sitting near range highs and a weaker print, which will probably be more of a surprise to the market given the current environment could see it break through resistance near 1.1800 to challenge the key psychological level at 1.2000. However, stronger numbers, especially if coming in line with strong CPI data and increased geopolitical tensions should see the dollar drive higher and Euro break back down through support levels around 1.1730 to push back into levels seen throughout April.
Resistance 2: 1.1848 – April High
Resistance 1: 1.1790 – Trendline Resistance
Support 1: 1.1727 – Trendline Support
Support 2: 1.1682 – 200 Day Moving Average

The accuracy, completeness and timeliness of the information contained on this site cannot be guaranteed. IC Markets Global does not warranty, guarantee or make any representations, or assume any liability regarding financial results based on the use of the information in the site.
News, views, opinions, recommendations and other information obtained from sources outside of www.icmarkets.com, used in this site are believed to be reliable, but we cannot guarantee their accuracy or completeness. All such information is subject to change at any time without notice. IC Markets Global assumes no responsibility for the content of any linked site.
The fact that such links may exist does not indicate approval or endorsement of any material contained on any linked site. IC Markets Global is not liable for any harm caused by the transmission, through accessing the services or information on this site, of a computer virus, or other computer code or programming device that might be used to access, delete, damage, disable, disrupt or otherwise impede in any manner, the operation of the site or of any user’s software, hardware, data or property.
The post Trade the Euro on the US PPI Data Release first appeared on IC Your Trading Edge | Official Blog.
430394 May 12, 2026 15:40 ICMarkets Market News
IC Markets Global – Europe Fundamental Forecast | 12 May 2026
What happened in the Asia session?
Australia’s Federal Budget 2026-27 unveiling and anticipation around India’s April CPI data release. The Australian budget, delivered by Treasurer Jim Chalmers at 7:30 pm AEST (11:30 UTC), highlighted a $45 billion improvement in the bottom line over four years through spending restraint amid inflation pressures, alongside reforms to housing tax incentives, capital gains, negative gearing, NDIS cuts, and boosted defense spending to $887 billion over a decade.
What does it mean for the Europe & US sessions?
U.S.-Iran tensions are stalling talks, driving oil prices higher, and prompting Goldman Sachs to delay its Fed rate-cut forecasts to December 2026 due to persistent inflation pressures. Wall Street futures remain subdued amid this geopolitical risk, while AI optimism supports S&P 500 year-end targets from HSBC at 7,650 and RBC at 7,900, with recent April jobs data showing resilient employment at 4.3% unemployment.
The Dollar Index (DXY)
Key news events today
Core CPI m/m (12:30 pm GMT)
CPI m/m (12:30 pm GMT)
CPI y/y (12:30 pm GMT)
Fed Chair Nomination Vote (Tentative)
What can we expect from DXY today?
The US dollar remained subdued, trading near six-week lows on the DXY at approximately 97.7-98.2, driven by persistent hopes for a US-Iran peace agreement that diminishes its safe-haven appeal and expectations of Federal Reserve easing amid upcoming CPI data and leadership changes. This caps a challenging period for the greenback, with earlier safe-haven gains from Middle East tensions now fading, positioning it for potential further declines if global growth accelerates and other central banks hold steady.
Central Bank Notes:
Next 24 Hours Bias
Medium Bearish
Gold (XAU)
Key news events today
Core CPI m/m (12:30 pm GMT)
CPI m/m (12:30 pm GMT)
CPI y/y (12:30 pm GMT)
Fed Chair Nomination Vote (Tentative)
What can we expect from Gold today?
Gold is trading in a volatile, consolidating range today, after a sharp prior correction tied to geopolitical easing and hawkish‑leaning central‑bank signals. Spot gold is hovering around the mid‑4,600s USD per ounce, down from recent highs as investors reassess safe‑haven demand amid reduced tensions over the Strait of Hormuz and a firm‑talk backdrop from major central banks.
Next 24 Hours Bias
Medium Bullish
The Euro (EUR)
Key news events today
No major news event
What can we expect from EUR today?
Today, the euro is slightly under pressure against the dollar despite a broadly positive domestic backdrop, as Middle‑East‑related risk‑off flows and dollar strength dominate FX flows while the ECB’s expected June rate cut looms; at the same time, higher but still‑moderate inflation, improving investor confidence, and a robust manufacturing sector are helping underpin the euro‑area economy and limiting the downside in EUR.
Central Bank Notes:
The next meeting is on 10 to 11 June 2026
Next 24 Hours Bias
Weak Bullish
The Swiss Franc (CHF)
Key news events today
No major news event
What can we expect from CHF today?
The Swiss franc remains one of the strongest major currencies, supported by safe-haven demand, firmer Swiss inflation, and expectations that the SNB will stay cautious rather than cut rates aggressively. The main story today is continued CHF resilience: it is still benefiting from market uncertainty, while euro and dollar weakness have kept the franc elevated.
Central Bank Notes:
The next meeting is on 18 June 2026.
Next 24 Hours Bias
Medium Bullish
The Pound (GBP)
Key news events today
No major news event
What can we expect from GBP today?
The pound remained relatively steady with no major breaking news, continuing a resilient monthly performance where it hit multi-month highs versus the dollar earlier in May, supported by ebbing USD momentum and positive UK retail sales data from March; however, lingering BoE rate cut probabilities priced at around 80% for near-term moves and political/economic uncertainties capped upside potential, keeping GBP/USD near 1.33 levels amid broader forex caution.
Central Bank Notes:
Next 24 Hours Bias
Medium Bullish
The Canadian Dollar (CAD)
Key news events today
No major news event
What can we expect from CAD today?
The Canadian dollar (CAD) shows stability around USD/CAD levels of 1.36–1.37 today, May 12, 2026, amid forecasts of modest weakness in the near term due to resilient U.S. economic data and commodity influences. Recent market snapshots indicate CAD/USD trading near 0.734, with prediction markets active for intraday rates as of early May 12.
Central Bank Notes:
Next 24 Hours Bias
Weak Bullish
Oil
Key news events today
API Crude Oil Stock ( 8:30 pm GMT)
What can we expect from Oil today?
Oil prices are surging today amid escalating US-Iran tensions, with Brent crude futures up 0.29% at $104.51 per barrel and WTI at $98.38, as President Trump rejects Iran’s peace offer and describes the ceasefire as on “life support,” prolonging the effective closure of the Strait of Hormuz.
Next 24 Hours Bias
Medium Bullish
The post IC Markets Global – Europe Fundamental Forecast | 12 May 2026 first appeared on IC Your Trading Edge | Official Blog.
430375 May 12, 2026 15:00 ICMarkets Market News
Potential Direction: Bearish
Overall momentum of the chart: Bearish
The price has already reacted off the pivot and may continue its bearish move toward the 1st support.
Pivot: 98.27
Supporting reasons: Identified as a pullback resistance, where selling pressures could intensify and potentially cap any upward retracement.
1st support: 97.63
Supporting reasons: Identified as a swing low support, indicating a potential area where the price could again stabilize.
1st resistance: 99.00
Supporting reasons: Identified as an overlap resistance, indicating a potential area that could halt any further upward movement

Potential Direction: Bullish
Overall momentum of the chart: Bullish
The price has already bounced off the pivot and may continue its bullish move toward the 1st resistance
Pivot: 1.1749
Supporting reasons: Identified as an overlap support, where renewed buying pressure could emerge to push the price higher.
1st support: 1.1716
Supporting reasons: Identified as a pullback support, indicating a potential level where the price could stabilize once again.
1st resistance: 1.1811
Supporting reasons: Identified as a pullback resistance that aligns with the 78.6% Fibonacci retracement, indicating a potential level that could cap further upward movement.

Potential Direction: Bearish
Overall momentum of the chart: Bullish
The price could see a short-term pullback toward the pivot before rising again toward the 1st resistance.
Pivot: 184.76
Supporting reasons: Identified as a pullback support, where renewed buying pressure could emerge to push the price higher.
1st support: 182.22
Supporting reasons: Identified as a pullback support, indicating a potential area where the price could again stabilize.
1st resistance: 186.31
Supporting reasons: Identified as a pullback resistance that aligns with the 78.6% Fibonacci retracement, indicating a potential level that could cap further upward movement.

Potential Direction: Bullish
Overall momentum of the chart: Bullish
The price could see a short-term pullback toward the pivot before rising again toward the 1st resistance.
Pivot: 0.8642
Supporting reasons: Identified as a pullback support, where renewed buying pressure could emerge to push the price higher.
1st support: 0.8617
Supporting reasons: Identified as an overlap support, indicating a potential area where the price could stabilize once more.
1st resistance: 0.8676
Supporting reasons: Identified as an overlap resistance that aligns with the 61.8% Fibonacci retracement, indicating a potential level that could cap further upward movement.

Potential Direction: Bullish
Overall momentum of the chart: Bullish
The price could see a short-term pullback toward the pivot before rising again toward the 1st resistance.
Pivot: 1.3554
Supporting reasons: Identified as a pullback support, where renewed buying pressure could emerge to push the price higher.
1st support: 1.3458
Supporting reasons: Identified as a swing low support, indicating a potential area where the price could stabilize once more.
1st resistance: 1.3657
Supporting reasons: Identified as a swing high resistance, indicating a potential level that could halt further upward movement.

Potential Direction: Bullish
Overall momentum of the chart: Bullish
The price could see a short-term pullback toward the pivot before rising again toward the 1st resistance.
Pivot: 213.55
Supporting reasons: Identified as a pullback support, where renewed buying pressure could emerge to push the price higher.
1st support: 212.99
Supporting reasons: Identified as an overlap support, indicating a potential level where the price could stabilize once more.
1st resistance: 215.15
Supporting reasons: Identified as a pullback resistance that aligns with the 78.6% Fibonacci retracement, indicating a potential level that could halt further upward movement.

Potential Direction: Bearish
Overall momentum of the chart: Bearish
The price could see a short-term pullback toward the pivot before continuing its bearish move down toward the 1st support.
Pivot: 0.7800
Supporting reasons: Identified as a pullback resistance that aligns with the 50% Fibonacci retracement, where selling pressures could intensify and potentially cap any upward retracement.
1st support: 0.7760
Supporting reasons: Identified as a swing low support, indicating a potential level where the price could stabilize once again.
1st resistance: 0.7848
Supporting reasons: Identified as a swing high resistance, indicating a potential level that could cap further upward movement.

Potential Direction: Bearish
Overall momentum of the chart: Bullish
The price could see a short-term pullback toward the pivot before continuing its bearish move down toward the 1st support.
Pivot: 157.88
Supporting reasons: Identified as a pullback resistance that aligns with the 50% Fibonacci retracement, where selling pressures could intensify and potentially cap any upward retracement.
1st support: 156.44
Supporting reasons: Identified as an overlap support, indicating a strong area where buyers might return, and the price could stabilize once again.
1st resistance: 159.03
Supporting reasons: Identified as a pullback resistance. This level represents the next key area where upward movement could be capped amid increased selling pressure

Potential Direction: Bullish
Overall momentum of the chart: Bullish
The price could see a short-term pullback toward the pivot before rising again toward the 1st resistance.
Pivot: 1.3641
Supporting reasons: Identified as an overlap support, where renewed buying pressure could emerge to push the price higher.
1st support: 1.3550
Supporting reasons: Identified as a swing low support, indicating a key level where the price could stabilize once more.
1st resistance: 1.3704
Supporting reasons: Identified as a pullback resistance, making it a possible target for bullish advances and a level where some sellers could return to cap gains

Potential Direction: Bullish
Overall momentum of the chart: Bullish
The price could see a short-term pullback toward the pivot before rising again toward the 1st resistance.
Pivot: 0.7212
Supporting reasons: Identified as a pullback support that aligns with the 50% Fibonacci retracement, where renewed buying pressure could emerge to push the price higher.
1st support: 07190
Supporting reasons: Identified as a pullback support that aligns with the 50% Fibonacci retracement, this area has provided strong support historically and may attract buying interest for a potential short-term bounce
1st resistance: 0.7277
Supporting reasons: Identified as a swing resistance, indicating a potential area that could halt any further upward movement.

Potential Direction: Bullish
Overall momentum of the chart: Bullish
The price could see a short-term pullback toward the pivot before rising again toward the 1st resistance.
Pivot: 0.5920
Supporting reasons: Identified as a pullback support that aligns with the 50% Fibonacci retracement, where renewed buying pressure could emerge to push the price higher.
1st support: 0.5873
Supporting reasons: Identified as a pullback support, this area has provided strong support historically and may attract buying interest for a potential short-term bounce
1st resistance: 0.5991
Supporting reasons: Identified as a swing high resistance, indicating a potential area that could halt any further upward movement.

Potential Direction: Bullish
Overall momentum of the chart: Bullish
The price has already bounced off the pivot and may continue its bullish move toward the 1st resistance
Pivot: 49,362.50
Supporting reasons: Identified as a pullback support that aligns with the 61.8% Fibonacci retracement, where renewed buying pressure could emerge to push the price higher.
1st support: 48,894.00
Supporting reasons: Identified as a swing low support, suggesting a potential area where the price could stabilize once again.
1st resistance: 50,125.65
Supporting reasons: Identified as a swing high resistance, indicating a potential area that could halt any further upward movement.

Potential Direction: Bearish
Overall momentum of the chart: Bullish
The price could see a short-term pullback toward the pivot before continuing its bearish move down toward the 1st support
Pivot: 24,373.32
Supporting reasons: Identified as a pullback resistance, where selling pressures could intensify and potentially cap any upward retracement.
1st support: 23,665.10
Supporting reasons: Identified as a swing low support, indicating a key level where the price could stabilize once more.
1st resistance: 25,074.47
Supporting reasons: Identified as a swing high resistance, indicating a potential area that could halt any further upward movement.

Potential Direction: Bullish
Overall momentum of the chart: Bullish
The price could see a short-term pullback toward the pivot before rising again toward the 1st resistance.
Pivot: 7,370.10
Supporting reasons: Identified as an overlap support, where renewed buying pressure could emerge to push the price higher.
1st support: 7,262.50
Supporting reasons: Identified as a pullback support, indicating a potential level where the price could stabilize once again.
1st resistance: 7,451.27
Supporting reasons: Identified as a resistance that aligns with the 61.8% Fibonacci projection, indicating a potential area that could halt any further upward movement.

Potential Direction: Bullish
Overall momentum of the chart: Bearish
The price has already bounced off the pivot and may continue its bullish move toward the 1st resistance
Pivot: 79,508.18
Supporting reasons: Identified as a pullback support that aligns with the 38.2% Fibonacci retracement, where renewed buying pressure could emerge to push the price higher.
1st support: 77,288.07
Supporting reasons: Identified as a pullback support, indicating a potential level where the price could stabilize once more.
1st resistance: 82,811.88
Supporting reasons: Identified as a swing high resistance, indicating a potential area that could halt any further upward movement.

Potential Direction: Bearish
Overall momentum of the chart: Bullish
The price could see a short-term pullback toward the pivot before continuing its bearish move down toward the 1st support
Pivot: 2,362.22
Supporting reasons: Identified as an overlap resistance, where selling pressures could intensify and potentially cap any upward retracement.
1st support: 2,273.07
Supporting reasons: Identified as an overlap support, indicating a potential level where the price could stabilize once more.
1st resistance: 2,452.87
Supporting reasons: Identified as a swing high resistance, indicating a potential area that could halt any further upward movement.

Potential Direction: Bearish
Overall momentum of the chart: Bullish
The price could see a short-term pullback toward the pivot before continuing its bearish move down toward the 1st support
Pivot: 101.24
Supporting reasons: Identified as a pullback resistance that aligns with the 61.8% Fibonacci retracement, where selling pressures could intensify and potentially cap any upward retracement.
1st support: 94.89
Supporting reasons: Identified as a pullback support, indicating a key level where the price could stabilize once more.
1st resistance: 110.90
Supporting reasons: Identified as a swing high resistance, indicating a potential area that could halt any further upward movement.

Potential Direction: Bearish
Overall momentum of the chart: Bullish
The price could see a short-term pullback toward the pivot before continuing its bearish move down toward the 1st support
Pivot: 4,793.62
Supporting reasons: Identified as a pullback resistance that aligns with the 127.2% Fibonacci extension, where selling pressures could intensify and potentially cap any upward retracement.
1st support: 4,660.24
Supporting reasons: Identified as an overlap support, indicating a key level where the price could stabilize once more.
1st resistance: 4,889.58
Supporting reasons: Identified as a swing high resistance, indicating a potential area that could halt any further upward movement.

The accuracy, completeness and timeliness of the information contained on this site cannot be guaranteed. IC Markets Global does not warranty, guarantee or make any representations, or assume any liability regarding financial results based on the use of the information in the site.
News, views, opinions, recommendations and other information obtained from sources outside of www.icmarkets.com, used in this site are believed to be reliable, but we cannot guarantee their accuracy or completeness. All such information is subject to change at any time without notice. IC Markets Global assumes no responsibility for the content of any linked site.
The fact that such links may exist does not indicate approval or endorsement of any material contained on any linked site. IC Markets Global is not liable for any harm caused by the transmission, through accessing the services or information on this site, of a computer virus, or other computer code or programming device that might be used to access, delete, damage, disable, disrupt or otherwise impede in any manner, the operation of the site or of any user’s software, hardware, data or property.
The post Tuesday 12th May 2026: Technical Outlook and Review first appeared on IC Your Trading Edge | Official Blog.
430374 May 12, 2026 15:00 ICMarkets Market News
Asia-Pacific markets traded mixed on Tuesday as investors brushed aside renewed concerns over the fragile U.S.-Iran ceasefire. President Donald Trump warned that the truce was on “massive life support” after Iran reportedly delivered an unacceptable response to Washington’s proposal aimed at ending the conflict.
Trump compared the ceasefire’s condition to a critically ill patient with only a “1% chance of living,” raising fears that tensions in the Middle East could escalate further. Despite the uncertainty, regional markets showed varied reactions.
Japan’s Nikkei 225 gained 0.19%, while the broader Topix index rose 0.27%. However, South Korea’s Kospi reversed earlier gains and dropped more than 3% after hitting a record high on Monday. The small-cap Kosdaq declined over 4%, while Australia’s S&P/ASX 200 slipped 0.82%. Hong Kong’s Hang Seng index edged up 0.47%, and China’s CSI 300 remained flat.
Japan’s 10-year government bond yield climbed to 2.545%, its highest level since 1997, after Bank of Japan minutes indicated some policymakers favored raising interest rates soon.
In the U.S., futures markets were slightly positive after the S&P 500 and Nasdaq reached fresh record highs overnight, supported by strong technology stocks despite rising oil prices and geopolitical tensions.
The post Tuesday 12th May 2026: Asia-Pacific Markets Mixed as Trump Raises Doubts Over U.S.-Iran Ceasefire first appeared on IC Your Trading Edge | Official Blog.
430372 May 12, 2026 14:40 ICMarkets Market News
US Stocks Edge Higher Despite Increasing Tensions – Dow up 0.2%
US equity markets finished modestly higher overnight, although sentiment remained cautious as investors continued to monitor developments in the Middle East and the increasing risk of renewed hostilities. President Trump’s warning that the current ceasefire agreement is “on life support” reignited concerns around potential energy supply disruptions and the inflationary impact of elevated oil prices, keeping traders on edge throughout the session.
The Dow Jones gained 0.19% to close at 49,704, while the S&P 500 also added 0.19% to finish at 7,412. The Nasdaq underperformed slightly but still edged 0.10% higher to close at 26,274, as technology stocks remained relatively resilient despite higher bond yields.
US Treasury yields pushed higher across the curve as markets reassessed the outlook for Federal Reserve policy ahead of tonight’s key inflation release. The US 2-year yield rose 6.9 basis points to 3.954%, while the benchmark 10-year yield climbed 5.9 basis points to 4.414%. The stronger yield environment also helped support the US dollar, with the USD Index rising 0.05% to 97.95.
Energy markets again remained a major focus as traders continued to monitor updates on the Gulf, with crude oil prices extending recent gains as the Strait of Hormuz remained largely closed, fuelling ongoing concerns around global supply constraints. Brent crude rose 3.15% to settle at $104.50 per barrel, while WTI crude gained 3.20% to finish at $98.45 per barrel.
Gold prices also moved higher in volatile trade, supported by geopolitical uncertainty and inflation concerns, with the precious metal rising 0.44% to close at $4,736.17 an ounce.
Strangely, the major precious metal markets have been relatively quiet over the past couple of months despite the high levels of geopolitical concern brought about by the conflict in the Middle East and the subsequent surge in oil prices. Intra-day volatility has still been high, but both gold and silver have largely been trading in line with dollar moves rather than as haven products, and have remained in relatively restricted ranges. Certainly, the huge moves north, and subsequent corrections, that both saw in Q1 will have had some impact on this behaviour, but traders are starting to pay more attention again to both products, with silver breaking out to fresh multi-month highs in trading yesterday and now gold threatening to do the same. If we see gold drive through the recent high near $4,765 in the coming sessions, we could see it break much higher, especially if supported by weaker US data later today, with the next topside target now around the $5,000 level.
Geopolitical updates will continue to dominate investor focus today. However, on the macroeconomic front, with little else on the calendar for most of the day, attention now turns squarely toward tonight’s US CPI inflation data. The data is expected to be pivotal for near-term Federal Reserve expectations, especially given last week’s stronger-than-expected jobs numbers. Another sticky inflation print could see markets further scale back interest rate cut expectations, potentially pushing any easing hopes later into the year or removing them from the outlook altogether. The market is expecting to see the headline month-on-month number fall from last month’s 0.9% increase to a 0.6% increase this month, with the crucial year-on-year number rising to a 3.7% increase. Core data is expected to show a 0.3% monthly increase and the annual figure is expected to come in at 2.7%. Confirmation of Kevin Warsh’s nomination as the next Fed Chair is also expected to come through during the session. However, this is only likely to impact markets if it is not confirmed.
Explore all upcoming market events in the Economic Calendar.
The post General Market Analysis – 12/05/26 first appeared on IC Your Trading Edge | Official Blog.
430371 May 12, 2026 14:40 ICMarkets Market News
IC Markets Global – Asia Fundamental Forecast | 12 May 2026
What happened in the U.S. session?
U.S. markets traded cautiously overnight amid stalled U.S.-Iran talks, boosting oil prices amid supply fears, while Friday’s robust April jobs data (115k added, 4.3% unemployment) reinforced economic strength but delayed rate cut hopes; oil was most impacted, with equities pausing after records and USD firming slightly.
What does it mean for the Asia Session?
Asian markets are heading into Tuesday in a fragile, oil‑driven risk‑on mood, with traders watching for renewed escalations in the Iran–US conflict, fresh Asia‑wide economic data, and any updates on US trade tariffs or Chinese stimulus, all of which are likely to drive volatility in regional equities, bonds, and currencies throughout the APAC session.
The Dollar Index (DXY)
Key news events today
Core CPI m/m (12:30 pm GMT)
CPI m/m (12:30 pm GMT)
CPI y/y (12:30 pm GMT)
Fed Chair Nomination Vote (Tentative)
What can we expect from DXY today?
The US Dollar showed mixed performance amid ongoing geopolitical tensions and market volatility. Recent reports indicate the Dollar Index (DXY) faced pressure from a weakening Indian Rupee, which hit levels around 94.88–95.18 per USD following Indian PM Narendra Modi’s speech on forex conservation and rising crude oil prices above $105 per barrel, driven by US-Iran conflict escalation.
Central Bank Notes:
Next 24 Hours Bias
Medium Bearish
Gold (XAU)
Key news events today
Core CPI m/m (12:30 pm GMT)
CPI m/m (12:30 pm GMT)
CPI y/y (12:30 pm GMT)
Fed Chair Nomination Vote (Tentative)
What can we expect from Gold today?
Gold is consolidating in the mid‑4,700s USD per ounce after a sharp run‑up and a subsequent 2‑month correction, with prices still significantly higher than a year ago and supported by strong central‑bank demand, ongoing geopolitical risk, and its role as a portfolio diversifier amid rising bond‑equity correlations. Market focus is on near‑term U.S. data and Fed‑rate expectations, as well as Middle East headlines, which are keeping volatility elevated but preventing any sustained breakdown below key support around the low‑4,500s.
Next 24 Hours Bias
Medium Bullish
The Australian Dollar (AUD)
Key news events today
No major news event
What can we expect from AUD today?
The AUD has trended strongly in early May 2026, hovering near multi-year highs around 0.718-0.72 amid favorable global risk sentiment, softer oil prices, and expectations of steady or tighter RBA policy, though volatility looms from domestic CPI and geopolitical developments. Traders eyed potential tests of 0.72 resistance, with earlier strength tied to robust Australian growth and labor data outweighing occasional USD safe-haven bids.
Central Bank Notes:
Next 24 Hours Bias
Medium Bullish
The Kiwi Dollar (NZD)
Key news events today
No major news event
What can we expect from NZD today?
The New Zealand dollar is trading in a relatively firm, recovery‑oriented range versus the US dollar and other majors, underpinned by a mix of easing geopolitical risk, modestly upbeat domestic data, and lingering expectations for a July rate hike from the Reserve Bank of New Zealand.
Central Bank Notes:
Next 24 Hours Bias
Medium Bullish
The Japanese Yen (JPY)
Key news events today
No major news event
What can we expect from JPY today?
The Japanese Yen strengthened notably against the USD following multiple suspected interventions by Tokyo authorities, with USD/JPY dropping from 160+ levels to around 156 amid holiday-season operations costing up to ¥5.4 trillion ($34.5 billion). While BOJ’s hawkish hold and officials’ threats of further action curbed downside pressures from U.S. rate hike expectations and oil-driven inflation.
Central Bank Notes:
Next 24 Hours Bias
Medium Bearish
Oil
Key news events today
API Crude Oil Stock ( 8:30 pm GMT)
What can we expect from Oil today?
Oil markets on 12 May 2026 are slightly calming after months of extreme volatility driven by Middle‑East conflict and a near‑blockage of the Strait of Hormuz, with Brent crude pulling back from its April spike into the low‑ to mid‑90‑dollar range on hopes of a US–Iran deal to end hostilities and reopen key shipping lanes.
Next 24 Hours Bias
Medium Bullish
The post IC Markets Global – Asia Fundamental Forecast | 12 May 2026 first appeared on IC Your Trading Edge | Official Blog.
430350 May 11, 2026 17:40 ICMarkets Market News

The post Ex-Dividend 12/05/2026 first appeared on IC Your Trading Edge | Official Blog.
430349 May 11, 2026 16:40 ICMarkets Market News
Asia-Pacific markets traded mixed Monday as rising oil prices and escalating tensions between the U.S. and Iran weighed on investor sentiment. South Korea’s Kospi surged to a fresh record at the open, outperforming regional peers despite concerns over a prolonged Middle East conflict.
Investor worries intensified after U.S. President Donald Trump rejected Iran’s latest proposal aimed at ending the war. According to Iran’s semi-official Tasnim news agency, Tehran’s counteroffer called for a ceasefire across all fronts and the removal of sanctions. Trump, however, dismissed the proposal as “totally unacceptable” in a Truth Social post.
Israeli Prime Minister Benjamin Netanyahu also warned that the conflict was “not over,” emphasizing ongoing efforts by the U.S. and Israel to curb Iran’s nuclear ambitions. The situation has further disrupted global energy markets, especially after Iran reportedly closed the Strait of Hormuz, a key global oil shipping route.
Oil prices jumped sharply, with West Texas Intermediate crude rising 3.94% to $99.18 per barrel, while Brent crude climbed 3.49% to $104.83.
South Korea’s Kospi gained 4.70%, boosted by a 10.74% rally in SK Hynix. Meanwhile, Japan’s Nikkei 225 traded slightly lower, Australia’s ASX 200 fell 0.83%, China’s CSI 300 rose 0.58%, and Hong Kong’s Hang Seng slipped 0.48%.
The post Monday 11th May 2026: Asia Markets Mixed as Oil Surges on Escalating U.S.-Iran Tensions; Kospi Hits Record High first appeared on IC Your Trading Edge | Official Blog.
430348 May 11, 2026 16:40 ICMarkets Market News
IC Markets Global – Europe Fundamental Forecast | 11 May 2026
What happened in the Asia session?
Fresh spike in Middle‑East risk after Trump rejected Iran’s latest peace proposal, which lifted oil prices sharply and kept global risk‑off sentiment elevated despite solid prior‑week gains on Wall Street. China’s April CPI and PPI data, released in the same window, confirmed that inflation is stabilizing off earlier deflation prints but with producer‑price pressures rising, reinforcing concerns about input‑cost‑driven margin squeeze and keeping central‑bank policy on a cautious path.
What does it mean for the Europe & US sessions?
Traders should focus on escalating US-Iran tensions, driving oil prices up $3 per barrel amid a deadlock over the Strait of Hormuz, alongside a resilient US jobs report showing 115K jobs added in April, exceeding forecasts, while consumer sentiment hits a record low of 48.2 due to high energy costs and tariffs.
The Dollar Index (DXY)
Key news events today
No major news event
What can we expect from DXY today?
The US dollar is trading slightly firmer as strong US April jobs data and fragile truce talks with Iran bolster demand for the world’s main safe‑haven currency; the dollar index sits near 98, reflecting a modest rebound from a recent ten‑week low, while markets await the next US inflation print that could influence both rate‑cut expectations and the greenback’s near‑term path.
Central Bank Notes:
Next 24 Hours Bias
Medium Bearish
Gold (XAU)
Key news events today
No major news event
What can we expect from Gold today?
Gold is trading in a tight consolidation range following a recent recovery from multi‑month lows, with spot prices hovering around the mid‑$4,000 per ounce bracket and key support near $4,500–$4,470. The market is in a short‑term stand‑off, as traders weigh persistent inflation, geopolitical risks, and central‑bank demand against the prospect of further U.S. macro data and potential policy shifts, leaving gold in a volatile but structurally supported mode for the week ahead.
Next 24 Hours Bias
Medium Bullish
The Euro (EUR)
Key news events today
No major news event
What can we expect from EUR today?
The euro gained ground versus the dollar (hovering around EUR/USD 1.18-1.20 levels), supported by improved investor sentiment, robust manufacturing data, and ECB hawkishness amid Middle East risks and de-dollarization trends, though global uncertainties as high oil prices loom.
Central Bank Notes:
The next meeting is on 10 to 11 June 2026
Next 24 Hours Bias
Weak Bullish
The Swiss Franc (CHF)
Key news events today
No major news event
What can we expect from CHF today?
Today’s Swiss franc news is mostly bullish for CHF: the currency remains near its strongest levels in years, helped by safe-haven demand and a recent rise in Swiss inflation to 0.6% in April. That inflation surprise has reduced immediate pressure on the Swiss National Bank to ease policy further, so the franc is likely to stay supported unless risk sentiment improves sharply or the SNB signals a more dovish stance.
Central Bank Notes:
The next meeting is on 18 June 2026.
Next 24 Hours Bias
Medium Bullish
The Pound (GBP)
Key news events today
No major news event
What can we expect from GBP today?
The pound is being driven today by a broadly firmer sterling tone after last week’s Bank of England decision, with markets still leaning on the idea that rates may need to stay higher for longer. At the same time, the dollar has eased a bit, which has helped GBP stay supported, while traders are also watching UK political and fiscal risks that could limit further gains.
Central Bank Notes:
Next 24 Hours Bias
Medium Bullish
The Canadian Dollar (CAD)
Key news events today
No major news event
What can we expect from CAD today?
The Canadian dollar (CAD) weakened slightly against the US dollar on Monday, May 11, 2026, trading near 1.3785 USD/CAD and approaching a five-month low amid anticipation for key inflation data due Tuesday. This decline, down about 0.1%, reflects growing bearish pressure from moving averages and speculators’ increased short positions, now at their highest since December.
Central Bank Notes:
Next 24 Hours Bias
Weak Bullish
Oil
Key news events today
No major news event
What can we expect from Oil today?
Oil prices are sharply higher on Monday, as Middle East tensions remain front and center for the market. Brent crude rose to around $104–105 per barrel, while West Texas Intermediate (WTI) climbed to about $95, reflecting renewed fears of supply disruption linked to the ongoing conflict between Iran, Israel, and the United States.
Next 24 Hours Bias
Medium Bullish
The post IC Markets Global – Europe Fundamental Forecast | 11 May 2026 first appeared on IC Your Trading Edge | Official Blog.
430347 May 11, 2026 16:00 ICMarkets Market News
IC Markets Global – Asia Fundamental Forecast | 11 May 2026
What happened in the U.S. session?
The jobs report, as the primary macroeconomic data release, showed nonfarm payrolls rising by 115,000, beating expectations of around 55,000-62,000, while the unemployment rate held steady at 4.3%, signaling labor market resilience amid signs of slowing hiring and rising part-time work for economic reasons. Escalating U.S.-Iran tensions also dominated headlines, with renewed hostilities threatening a fragile ceasefire and impacting oil supply routes like the Strait of Hormuz, alongside chip stock rebounds and anticipation for upcoming inflation data.
What does it mean for the Asia Session?
Asian traders should focus on three big themes on Monday, 11 May 2026: China inflation, Japan’s yen intervention risk, and the wider risk tone from Middle East tensions and US macro headlines. China’s April CPI and PPI are due on Monday morning in Asia, and a soft print could reinforce expectations for more policy support from Beijing.
The Dollar Index (DXY)
Key news events today
No major news event
What can we expect from DXY today?
The dollar remains under pressure heading into a data-heavy week featuring US CPI, retail sales, and existing home sales releases, alongside BoJ updates and potential Trump-Xi talks. Pair movements include EUR/USD up 0.51% near 1.1786, GBP/USD gaining 0.52% to 1.3628, and USD/JPY down 0.14% at 156.69, reflecting broad greenback softening. Forecasts suggest DXY trading between 90-100 through 2026’s remainder, with H2 bias lower amid de-escalation hopes.
Central Bank Notes:
Next 24 Hours Bias
Medium Bearish
Gold (XAU)
Key news events today
No major news event
What can we expect from Gold today?
Gold is range-bound in a critical decision zone ($4,715–$4,725) after rebounding above $4,700, supported by mixed U.S. economic signals, persistent inflation concerns, and geopolitical uncertainties like U.S.–Iran tensions, though analysts warn of volatility with downside risks to $4,500 or upside tests near $4,850 ahead of key data releases.
Next 24 Hours Bias
Medium Bullish
The Australian Dollar (AUD)
Key news events today
No major news event
What can we expect from AUD today?
The Australian dollar is holding near four‑year highs against the US dollar, consolidating around the mid‑0.72 area after a recent rally fueled by cooling Middle‑East tensions, strong commodity‑linked fundamentals, and expectations of a hawkish‑leaning RBA hike later this week. Markets remain sensitive to the RBA’s policy tone and the broader US‑dollar risk‑sentiment complex, positioning the AUD for either a test of stronger resistance near 0.73 or a pause in its current uptrend.
Central Bank Notes:
Next 24 Hours Bias
Medium Bullish
The Kiwi Dollar (NZD)
Key news events today
No major news event
What can we expect from NZD today?
The New Zealand Dollar (NZD) saw limited specific updates based on the most recent available market reports, but it continued building on recent gains amid ongoing global risk sentiment and domestic economic signals. Trading around 0.594-0.597 against the USD, the kiwi hovered near recent two-month highs after a positive jobs report showed unemployment dipping to 5.3% in Q1, bolstering hopes for a Reserve Bank of New Zealand (RBNZ) rate hike later in the year.
Central Bank Notes:
Next 24 Hours Bias
Medium Bullish
The Japanese Yen (JPY)
Key news events today
No major news event
What can we expect from JPY today?
The Japanese Yen remains under pressure near USD/JPY 156-157 levels following a series of interventions in late April and early May, where authorities spent billions to halt declines past 160 amid speculative selling and oil-driven USD strength; traders are on high alert for further action from Tokyo, tempered by BOJ’s cautious stance and global risk-off moods, with no major new catalysts reported today but ongoing volatility expected into the week.
Central Bank Notes:
Next 24 Hours Bias
Medium Bearish
Oil
Key news events today
No major news event
What can we expect from Oil today?
Oil markets on Monday show continued volatility driven by US-Iran tensions over the Strait of Hormuz, with crude prices like WTI dipping toward $90-98 per barrel amid speculation of a potential peace deal or MoU to reopen shipping routes. Bonny Light and other grades have fallen sharply from recent highs around $114, influenced by record US oil exports filling supply gaps and easing fear premiums, though Iranian attacks on vessels and UAE terminals keep risks elevated.
Next 24 Hours Bias
Medium Bullish
The post IC Markets Global – Asia Fundamental Forecast | 11 May 2026 first appeared on IC Your Trading Edge | Official Blog.
430331 May 11, 2026 16:00 ICMarkets Market News
Potential Direction: Bullish
Overall momentum of the chart: Bearish
The price has already bounced off the pivot and may continue its bullish move toward the 1st resistance
Pivot: 97.87
Supporting reasons: Identified as an overlap support that aligns with the 50% Fiboancci retracement, where renewed buying pressure could emerge to push the price higher.
1st support: 95.80
Supporting reasons: Identified as a swing low support, indicating a potential area where the price could again stabilize.
1st resistance: 99.14
Supporting reasons: Identified as an overlap resistance, indicating a potential area that could halt any further upward movement

Potential Direction: Bearish
Overall momentum of the chart: Bullish
The price could see a short-term pullback toward the pivot before continuing its bearish move down toward the 1st support.
Pivot: 1.1808
Supporting reasons: Identified as an overlap resistance that aligns with the 61.8% Fibonacci retracement, where selling pressures could intensify and potentially cap any upward retracement.
1st support: 1.1631
Supporting reasons: Identified as a pullback support, indicating a potential level where the price could stabilize once again
1st resistance: 1.2044
Supporting reasons: Identified as a swing high resistance, indicating a potential level that could cap further upward movement.

Potential Direction: Bearish
Overall momentum of the chart: Bearish
The price could see a short-term pullback toward the pivot before continuing its bearish move down toward the 1st support.
Pivot: 186.13
Supporting reasons: Identified as a pullback resistance that aligns with the 78.6% Fibonacci retracement, where selling pressures could intensify and potentially cap any upward retracement.
1st support: 181.98
Supporting reasons: Identified as an overlap support, indicating a potential area where the price could again stabilize.
1st resistance: 187.92
Supporting reasons: Identified as a swing high resistance, indicating a potential level that could cap further upward movement.

Potential Direction: Bearish
Overall momentum of the chart: Bullish
The price could see a short-term pullback toward the pivot before continuing its bearish move down toward the 1st support.
Pivot: 0.8654
Supporting reasons: Identified as a pullback resistance, where selling pressures could intensify and potentially cap any upward retracement.
1st support: 0.8574
Supporting reasons: Identified as an overlap support that aligns with the 127.2% Fibonacci extension, indicating a potential area where the price could stabilize once more.
1st resistance: 0.8687
Supporting reasons: Identified as a pullback resistance, indicating a potential level that could cap further upward movement.

Potential Direction: Bullish
Overall momentum of the chart: Bullish
The price could make a short-term pullback toward the pivot before rising again toward the 1st resistance
Pivot: 1.3574
Supporting reasons: Identified as a pullback support, where renewed buying pressure could emerge to push the price higher.
1st support: 1.3461
Supporting reasons: Identified as an overlap support, indicating a potential area where the price could stabilize once more.
1st resistance: 1.3860
Supporting reasons: Identified as a swing high resistance, indicating a potential level that could halt further upward movement.

Potential Direction: Bearish
Overall momentum of the chart: Bullish
The price has already reacted off the pivot and may continue its bearish move toward the 1st support.
Pivot: 213.96
Supporting reasons: Identified as a pullback resistance, where selling pressures could intensify and potentially cap any upward retracement.
1st support: 209.64
Supporting reasons: Identified as an overlap support, indicating a potential level where the price could stabilize once more.
1st resistance: 216.63
Supporting reasons: Identified as a swing high resistance, indicating a potential level that could halt further upward movement.

Potential Direction: Bearish
Overall momentum of the chart: Bearish
The price could see a short-term pullback toward the pivot before continuing its bearish move down toward the 1st support.
Pivot: 0.7778
Supporting reasons: Identified as a pullback resistance, where selling pressures could intensify and potentially cap any upward retracement.
1st support: 0.7649
Supporting reasons: Identified as a swing low support that aligns with the 161.8% Fibonacci extension, indicating a potential level where the price could stabilize once again.
1st resistance: 0.7835
Supporting reasons: Identified as an overlap resistance, indicating a potential level that could cap further upward movement.

Potential Direction: Bearish
Overall momentum of the chart: Bullish
The price has already reacted off the pivot and may continue its bearish move toward the 1st support.
Pivot: 157.72
Supporting reasons: Identified as an overlap resistance, where selling pressures could intensify and potentially cap any upward retracement.
1st support: 154.24
Supporting reasons: Identified as an overlap support, indicating a strong area where buyers might return, and the price could stabilize once again.
1st resistance: 160.49
Supporting reasons: Identified as a swing high resistance. This level represents the next key area where upward movement could be capped amid increased selling pressure

Potential Direction: Bearish
Overall momentum of the chart: Bearish
The price could see a short-term pullback toward the pivot before continuing its bearish move down toward the 1st support.
Pivot: 1.3732
Supporting reasons: Identified as a pullback resistance that aligns with the 50% Fibonacci retracement, where selling pressures could intensify and potentially cap any upward retracement.
1st support: 1.3578
Supporting reasons: Identified as a swing low support, indicating a key level where the price could stabilize once more.
1st resistance: 1.3859
Supporting reasons: Identified as a pullback resistance that aligns with the 78.6% Fibonacci retracement, making it a possible target for bullish advances and a level where some sellers could return to cap gains

Potential Direction: Bullish
Overall momentum of the chart: Bullish
The price could make a short-term pullback toward the pivot before rising again toward the 1st resistance
Pivot: 07187
Supporting reasons: Identified as a pullback support, where renewed buying pressure could emerge to push the price higher.
1st support: 0.7104
Supporting reasons: Identified as an overlap support, this area has provided strong support historically and may attract buying interest for a potential short-term bounce
1st resistance: 0.7295
Supporting reasons: Identified as a resistance that aligns with the 161.8% Fibonacci extension, indicating a potential area that could halt any further upward movement.
Potential Direction: Bullish
Overall momentum of the chart: Bullish
The price could make a short-term pullback toward the pivot before rising again toward the 1st resistance
Pivot: 0.5920
Supporting reasons: Identified as a pullback support, where renewed buying pressure could emerge to push the price higher.
1st support: 0.5853
Supporting reasons: Identified as a pullback support, this area has provided strong support historically and may attract buying interest for a potential short-term bounce
1st resistance: 0.6079
Supporting reasons: Identified a swing high resistance, indicating a potential area that could halt any further upward movement.

Potential Direction: Bullish
Overall momentum of the chart: Bullish
The price could make a short-term pullback toward the pivot before rising again toward the 1st resistance
Pivot: 48,824.60
Supporting reasons: Identified as an overlap support, where renewed buying pressure could emerge to push the price higher.
1st support: 47,747.57
Supporting reasons: Identified as a pullback support, suggesting a potential area where the price could stabilize once again.
1st resistance: 50,477.23
Supporting reasons: Identified as a swing high resistance, indicating a potential area that could halt any further upward movement.
Potential Direction: Bearish
Overall momentum of the chart: Bullish
The price has already reacted off the pivot and may continue its bearish move toward the 1st support.
Pivot: 24,805.50
Supporting reasons: Identified as a pullback resistance, where selling pressures could intensify and potentially cap any upward retracement.
1st support: 23,332.36
Supporting reasons: Identified as a pullback support, indicating a key level where the price could stabilize once more.
1st resistance: 25,451.76
Supporting reasons: Identified as a swing high resistance, indicating a potential area that could halt any further upward movement.

Potential Direction: Bullish
Overall momentum of the chart: Bullish
The price could make a short-term pullback toward the pivot before rising again toward the 1st resistance.
Pivot: 7,147.89
Supporting reasons: Identified as a pullback support, where renewed buying pressure could emerge to push the price higher.
1st support: 7,013.90
Supporting reasons: Identified as a pullback support, indicating a potential level where the price could stabilize once again.
1st resistance: 7,451.23
Supporting reasons: Identified as a resistance that aligns with the 161.8% Fibonacci extension, indicating a potential area that could halt any further upward movement.

Potential Direction: Bullish
Overall momentum of the chart: Bullish
The price could make a short-term pullback toward the pivot before rising again toward the 1st resistance.
Pivot: 78,616.60
Supporting reasons: Identified as an overlap support, where renewed buying pressure could emerge to push the price higher.
1st support: 74,631.06
Supporting reasons: Identified as an overlap support, indicating a potential level where the price could stabilize once more.
1st resistance: 85,026.77
Supporting reasons: Identified as a pullback resistance that aligns with the 61.8% Fibonacci retracement, indicating a potential area that could halt any further upward movement.
Potential Direction: Bearish
Overall momentum of the chart: Bullish
The price could see a short-term pullback toward the pivot before continuing its bearish move down toward the 1st support.
Pivot: 2,424.98
Supporting reasons: Identified as a multi-swing high resistance, where selling pressures could intensify and potentially cap any upward retracement.
1st support: 2,200.69
Supporting reasons: Identified as an overlap support, indicating a potential level where the price could stabilize once more.
1st resistance: 2,618.80
Supporting reasons: Identified as a pullback resistance that aligns with the 50% Fibonacci retracmemt, indicating a potential area that could halt any further upward movement.

Potential Direction: Bullish
Overall momentum of the chart: Bullish
The price has already bounced off the pivot and may continue its bullish move toward the 1st resistance
Pivot: 87.53
Supporting reasons: Identified as an overlap support, where renewed buying pressure could emerge to push the price higher.
1st support: 73.75
Supporting reasons: Identified as a pullback support, indicating a key level where the price could stabilize once more.
1st resistance: 119.24
Supporting reasons: Identified as a pullback resistance, indicating a potential area that could halt any further upward movement.

Potential Direction: Bullish
Overall momentum of the chart: Bullish
The price has already bounced off the pivot and may continue its bullish move toward the 1st resistance
Pivot: 4,929.22
Supporting reasons: Identified as a pullback support, where renewed buying pressure could emerge to push the price higher.
1st support: 4,367.70
Supporting reasons: Identified as an overlap support, indicating a key level where the price could stabilize once more.
1st resistance: 48,62.42
Supporting reasons: Identified as an overlap resistance, indicating a potential area that could halt any further upward movement.

The accuracy, completeness and timeliness of the information contained on this site cannot be guaranteed. IC Markets Global does not warranty, guarantee or make any representations, or assume any liability regarding financial results based on the use of the information in the site.
News, views, opinions, recommendations and other information obtained from sources outside of www.icmarkets.com, used in this site are believed to be reliable, but we cannot guarantee their accuracy or completeness. All such information is subject to change at any time without notice. IC Markets Global assumes no responsibility for the content of any linked site.
The fact that such links may exist does not indicate approval or endorsement of any material contained on any linked site. IC Markets Global is not liable for any harm caused by the transmission, through accessing the services or information on this site, of a computer virus, or other computer code or programming device that might be used to access, delete, damage, disable, disrupt or otherwise impede in any manner, the operation of the site or of any user’s software, hardware, data or property.
The post Monday 11th May 2026: Technical Outlook and Review first appeared on IC Your Trading Edge | Official Blog.