Articles
Wednesday 20th May 2026: Technical Outlook and Review
430714 May 20, 2026 18:00 ICMarkets Market News
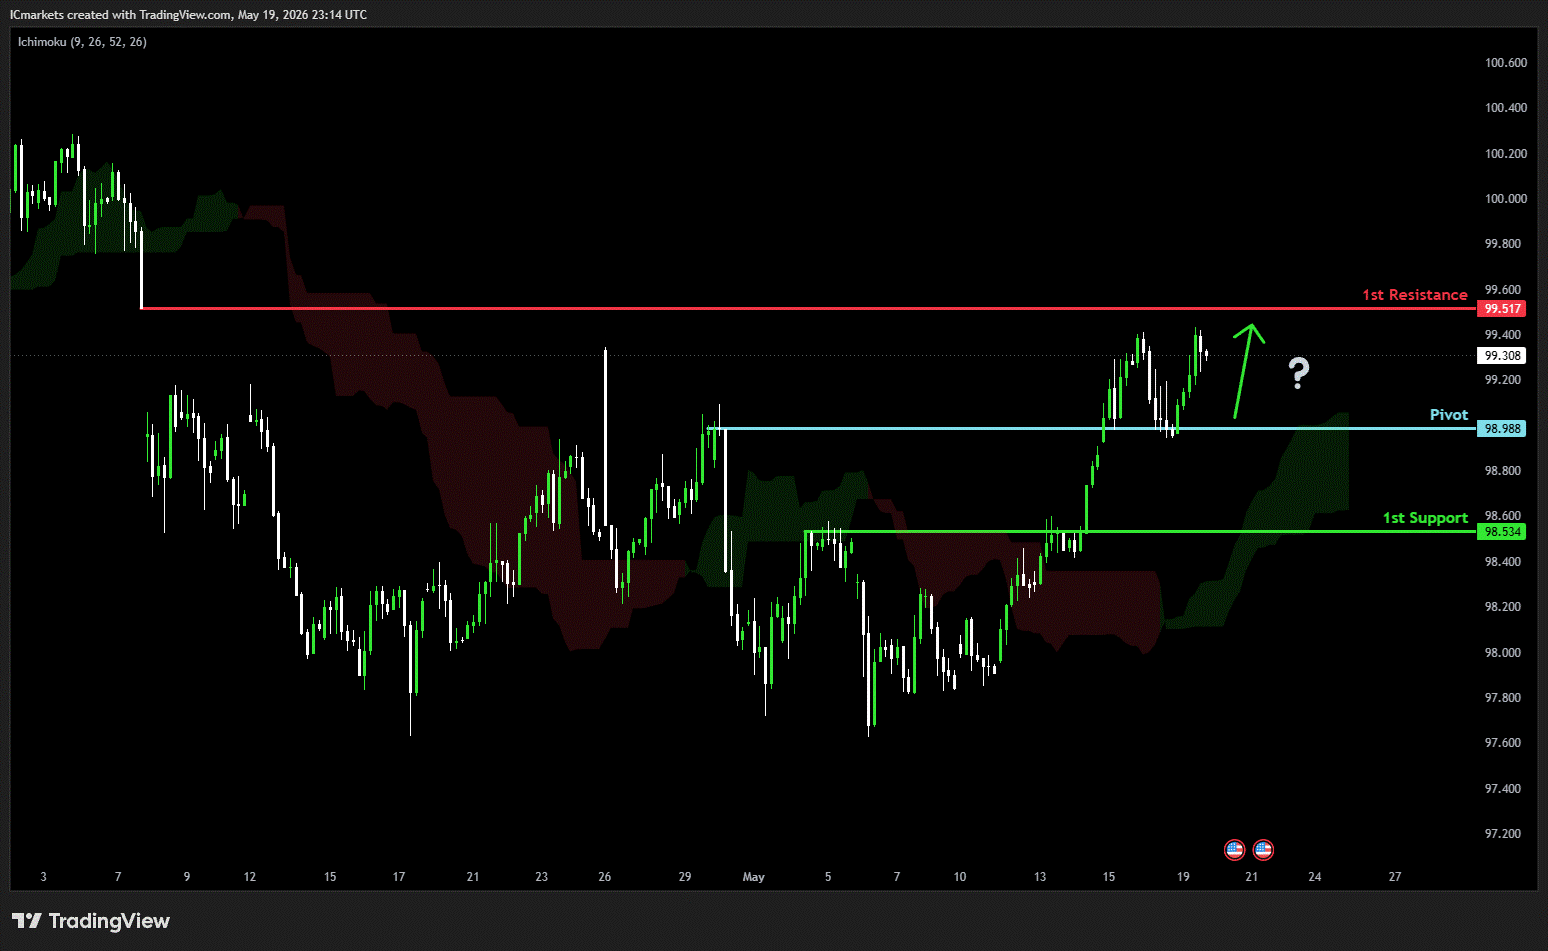
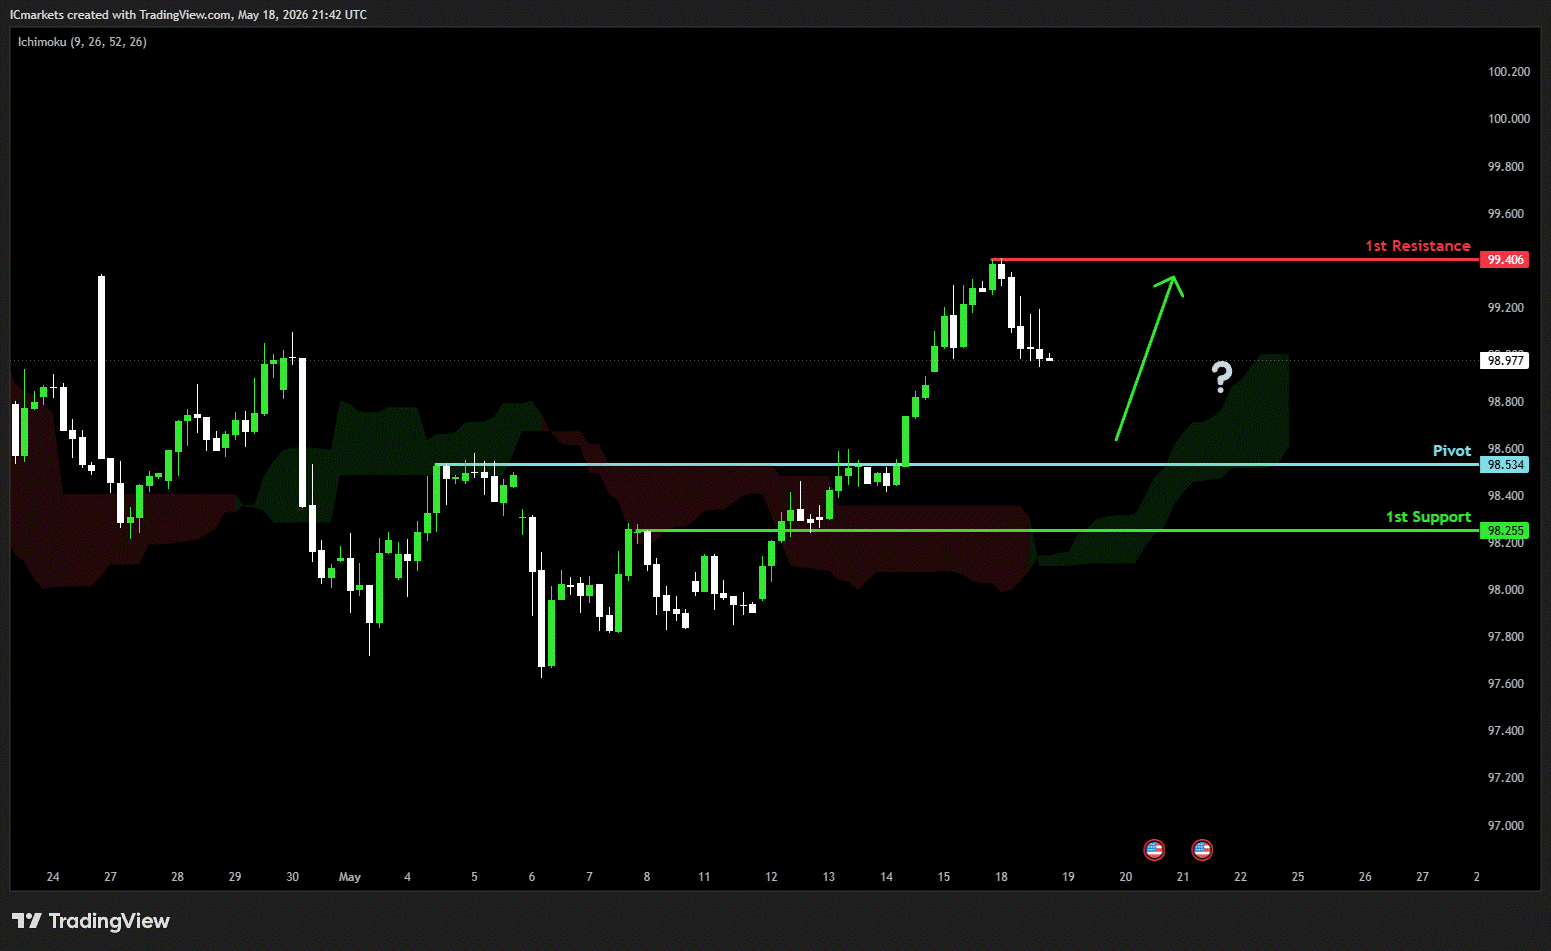
DXY (U.S. Dollar Index):
Potential Direction: Bullish
Overall momentum of the chart: Bearish
The price has already bounced off the pivot and may continue its bullish move toward the 1st resistance
Pivot: 98.98
Supporting reasons: Identified as an overlap support, where renewed buying pressure could emerge to push the price higher.
1st support: 98.53
Supporting reasons: Identified as a pullback support, indicating a potential area where the price could again stabilize.
1st resistance: 99.51
Supporting reasons: Identified as a swing high resistance, indicating a potential area that could halt any further upward movement
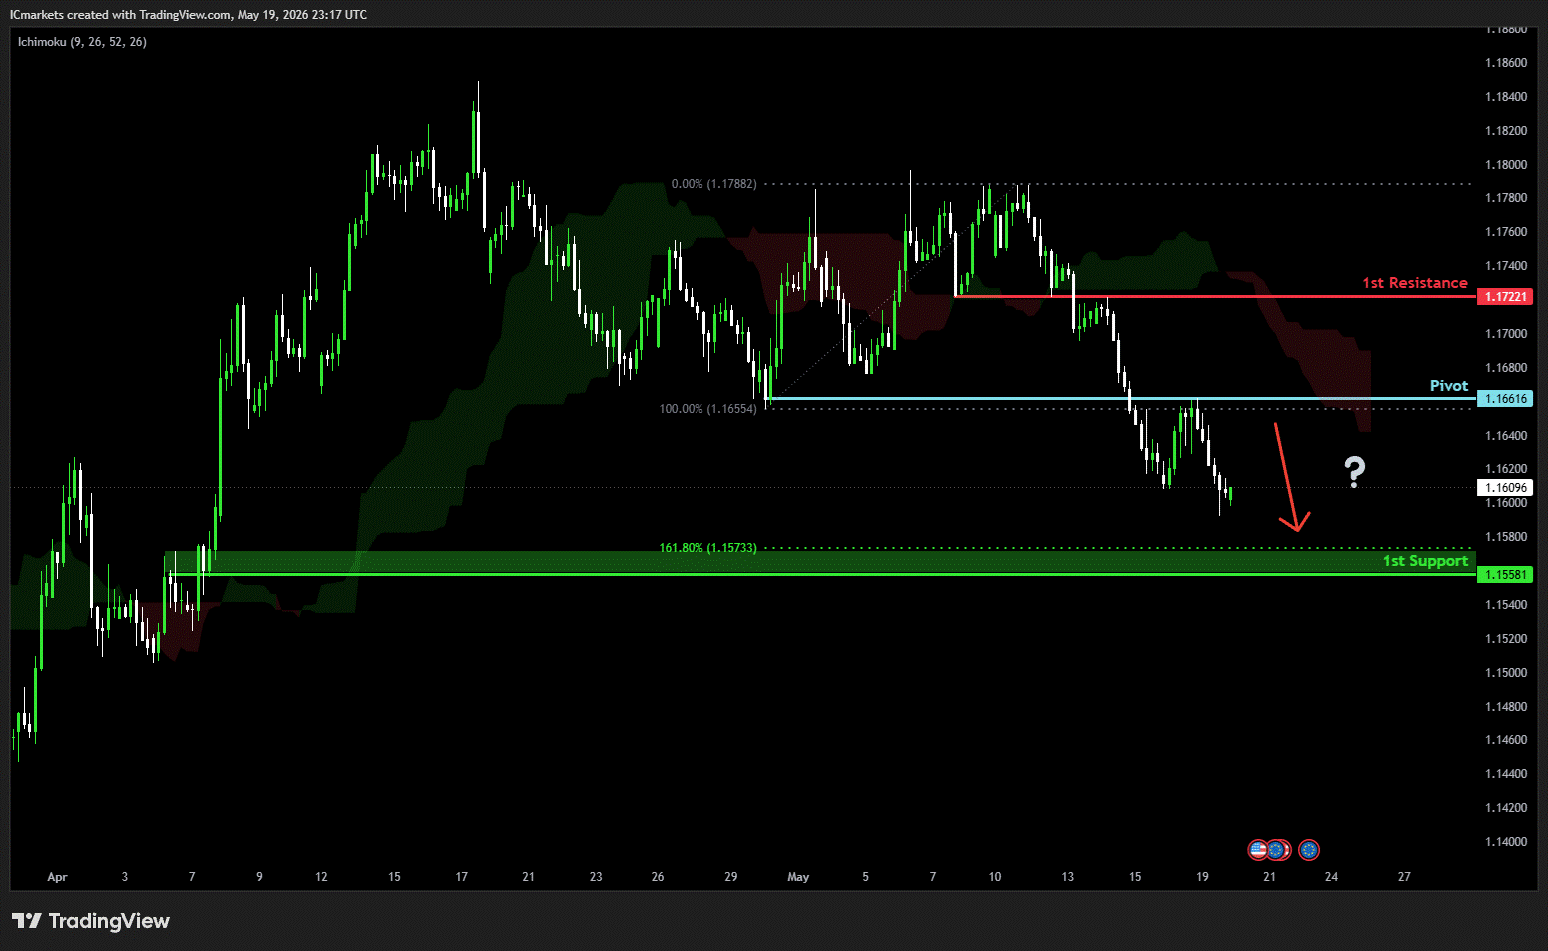
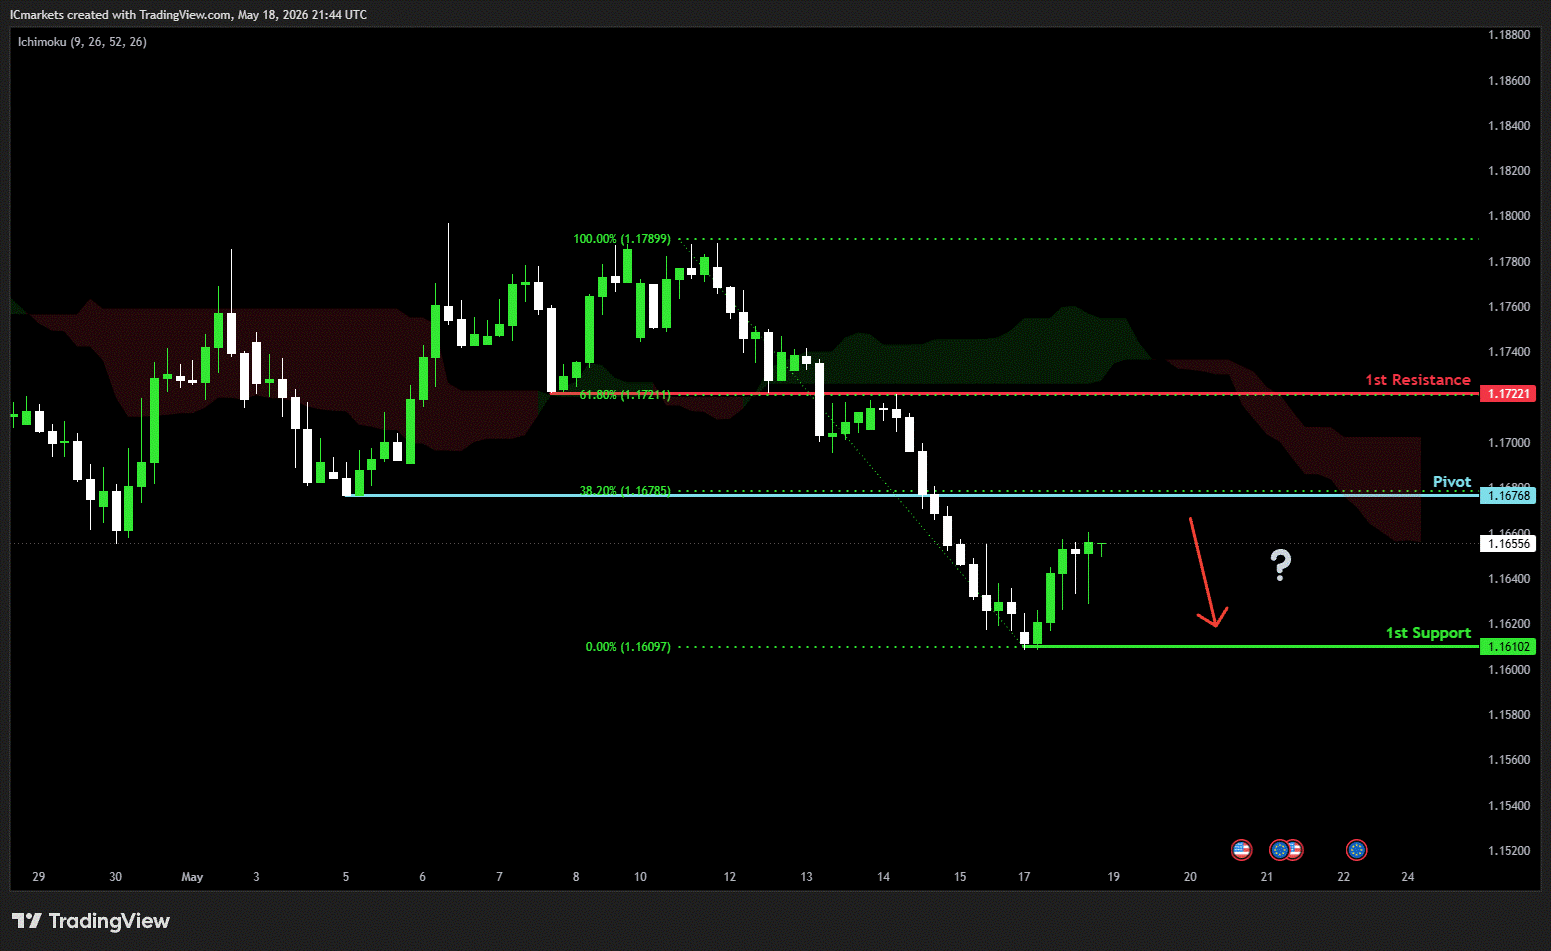
EUR/USD:
Potential Direction: Bearish
Overall momentum of the chart: Bullish
The price has already reacted off the pivot and may continue its bearish move toward the 1st support.
Pivot: 1.1661
Supporting reasons: Identified as an overlap resistance, where selling pressures could intensify and potentially cap any upward retracement.
1st support: 1.1558
Supporting reasons: Identified as a pullback support that aligns with the 161.8% FIbonacci extension, indicating a potential level where the price could stabilize once again.
1st resistance: 1.1722
Supporting reasons: Identified as an overlap resistance, indicating a potential level that could cap further upward movement.
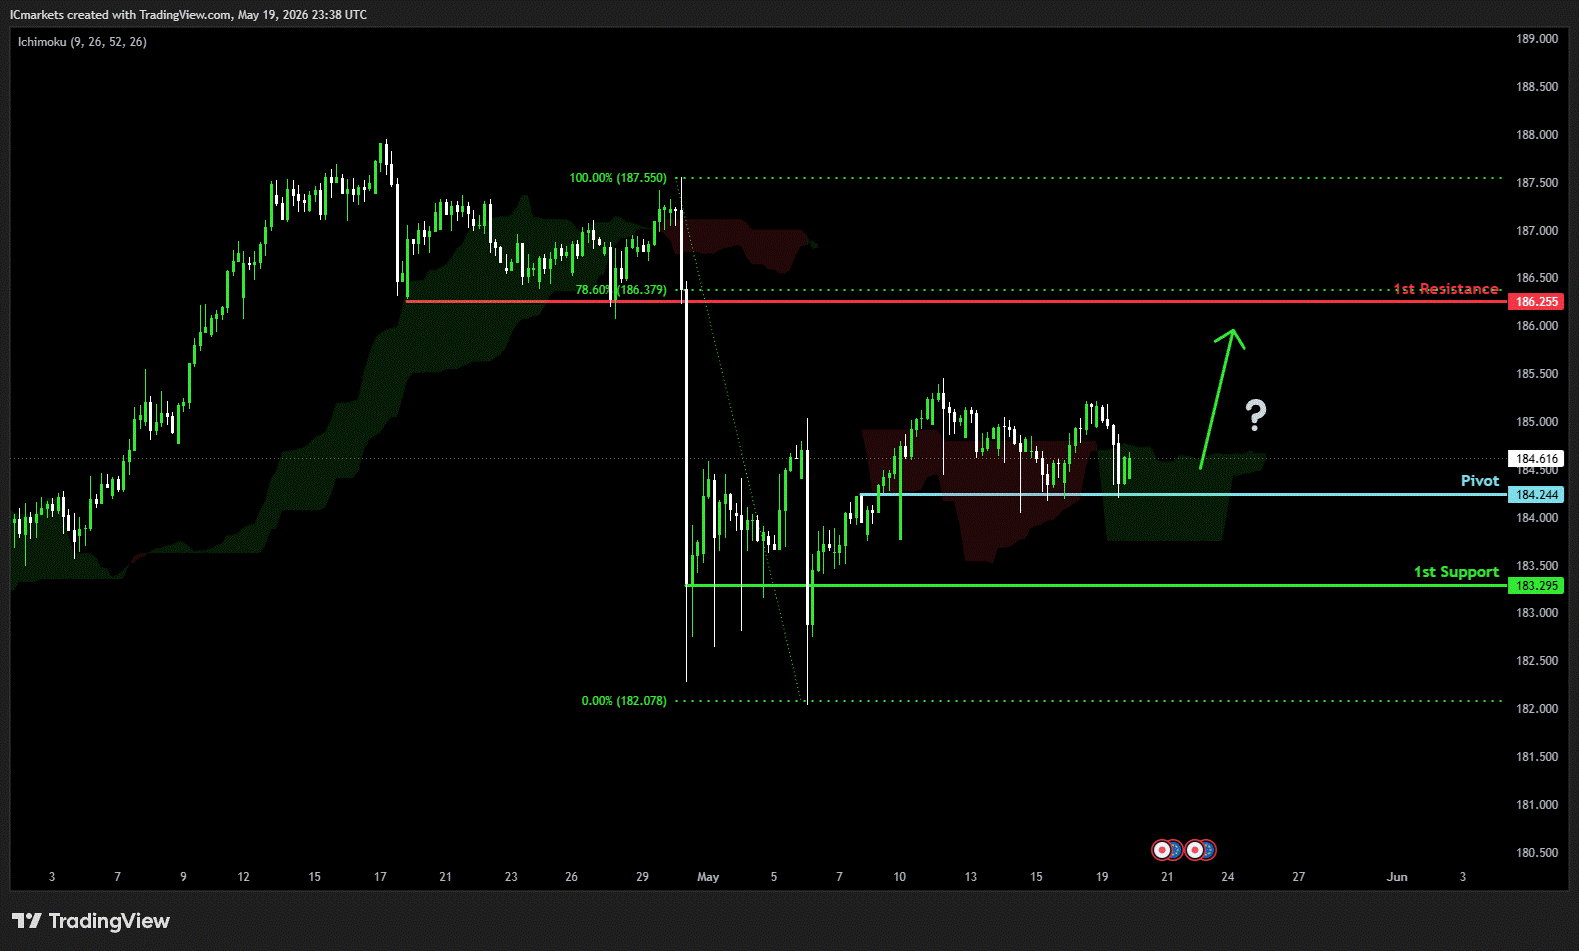
EUR/JPY:
Potential Direction: Bullish
Overall momentum of the chart: Bullish
The price has already bounced off the pivot and may continue its bullish move toward the 1st resistance
Pivot: 184.24
Supporting reasons: Identified as an overlap support, where renewed buying pressure could emerge to push the price higher.
1st support: 183.29
Supporting reasons: Identified as a pullback support, indicating a potential area where the price could again stabilize.
1st resistance: 186.25
Supporting reasons: Identified as a swing high resistance that aligns with the 78.6% FIbonacci retracement, indicating a potential level that could cap further upward movement.
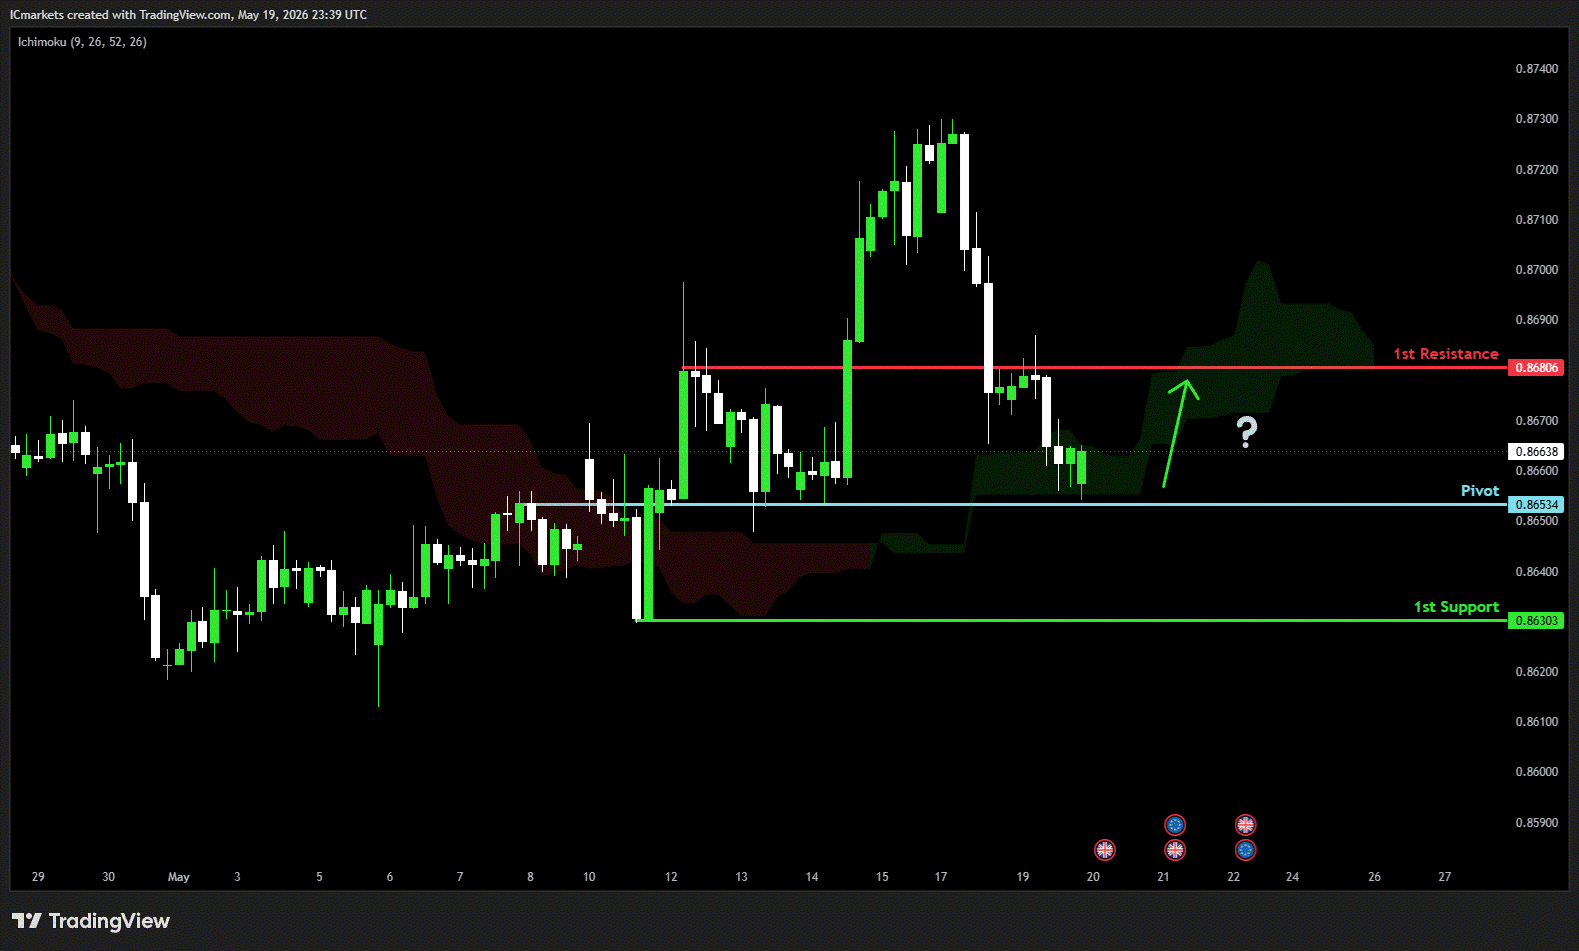
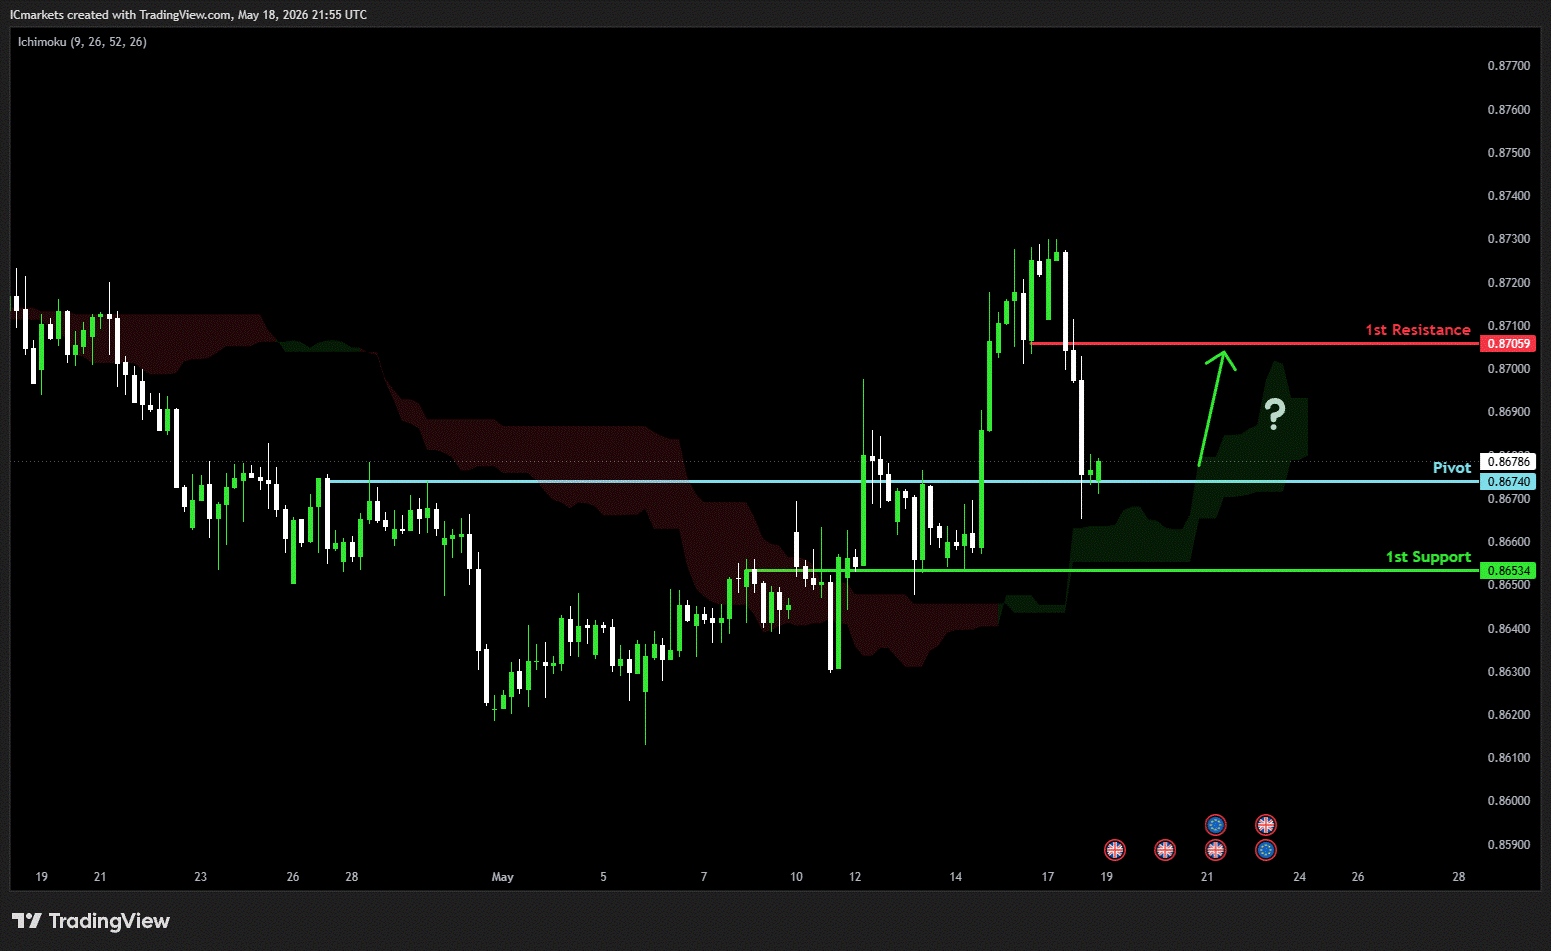
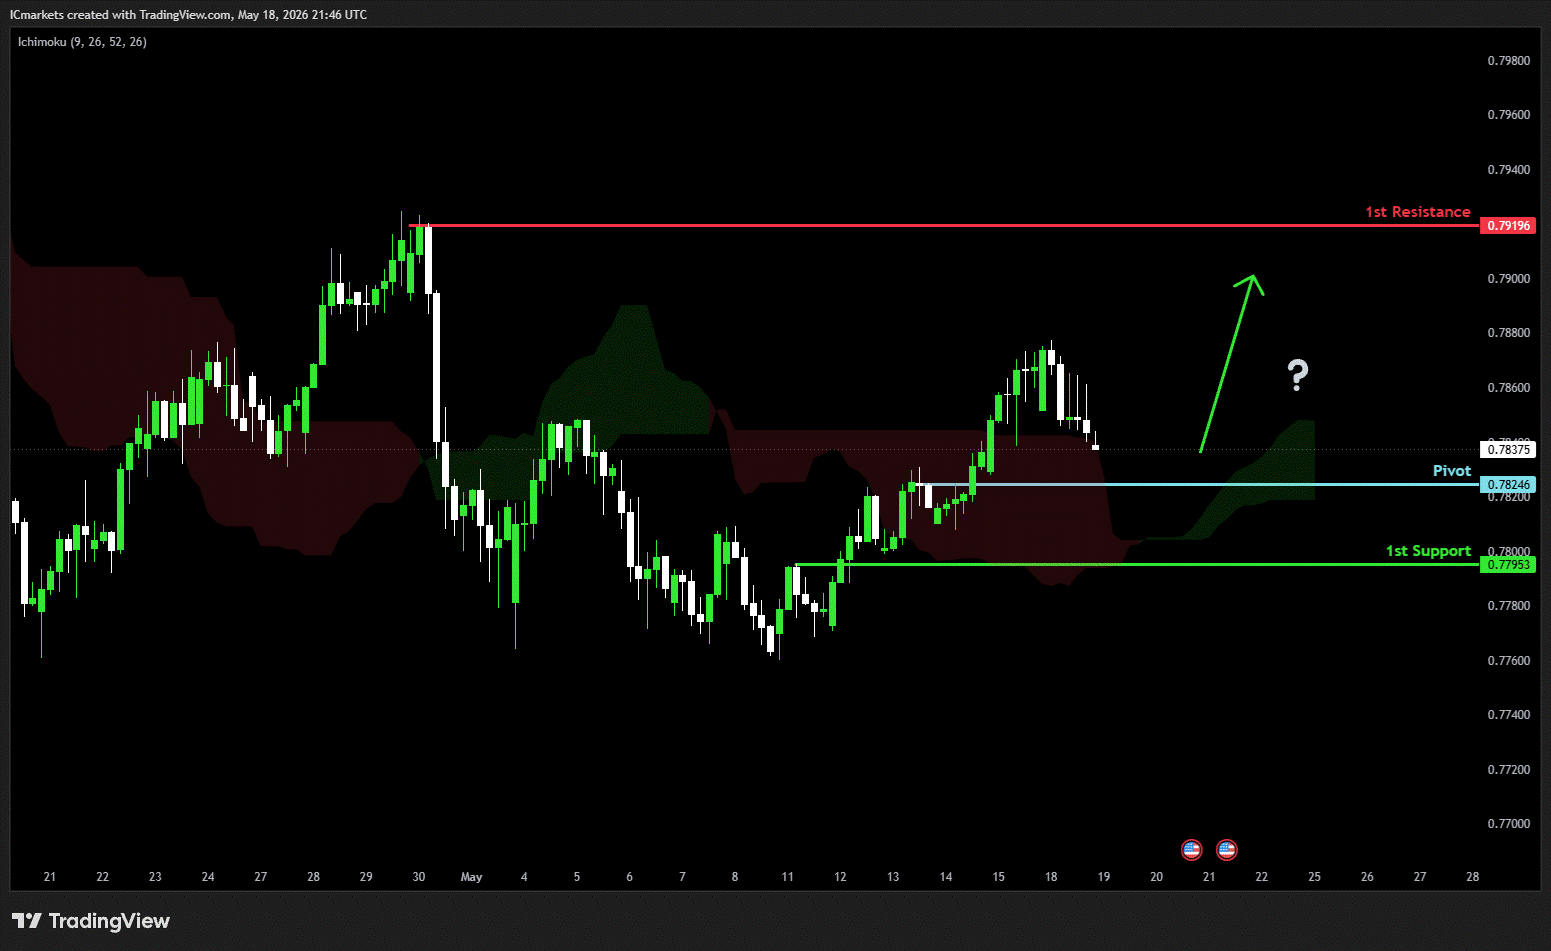
EUR/GBP:
Potential Direction: Bullish
Overall momentum of the chart: Bullish
The price has already bounced off the pivot and may continue its bullish move toward the 1st resistance
Pivot: 0.8653
Supporting reasons: Identified as an overlap support, where renewed buying pressure could emerge to push the price higher.
1st support: 0.8630
Supporting reasons: Identified as a swing low support, indicating a potential area where the price could stabilize once more.
1st resistance: 0.8680
Supporting reasons: Identified as an overlap resistance, indicating a potential level that could cap further upward movement.
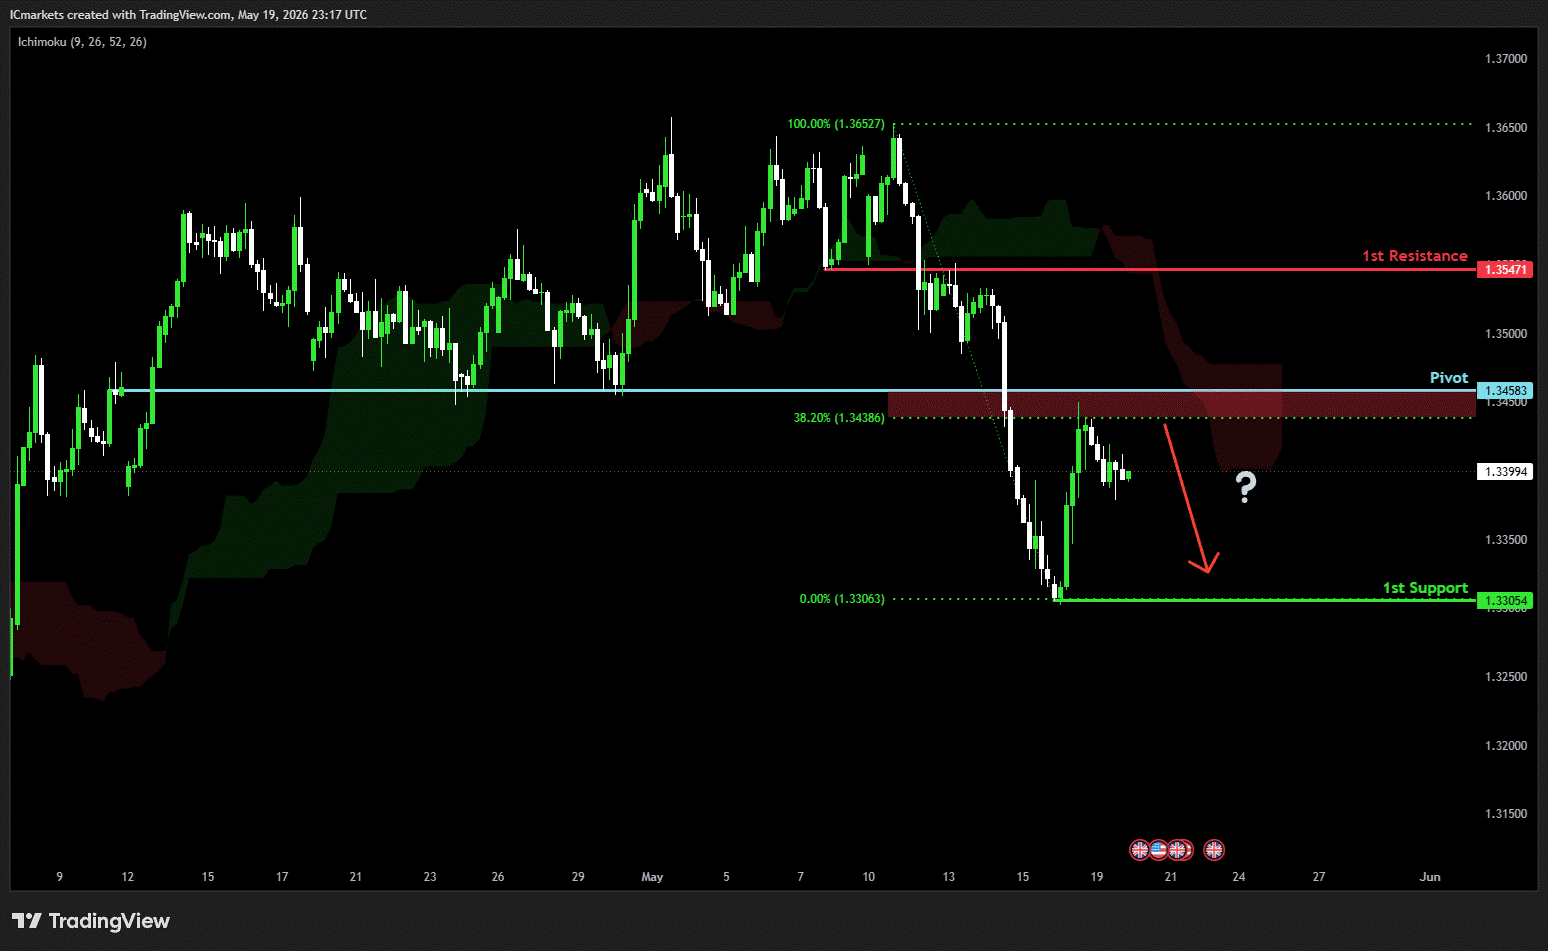
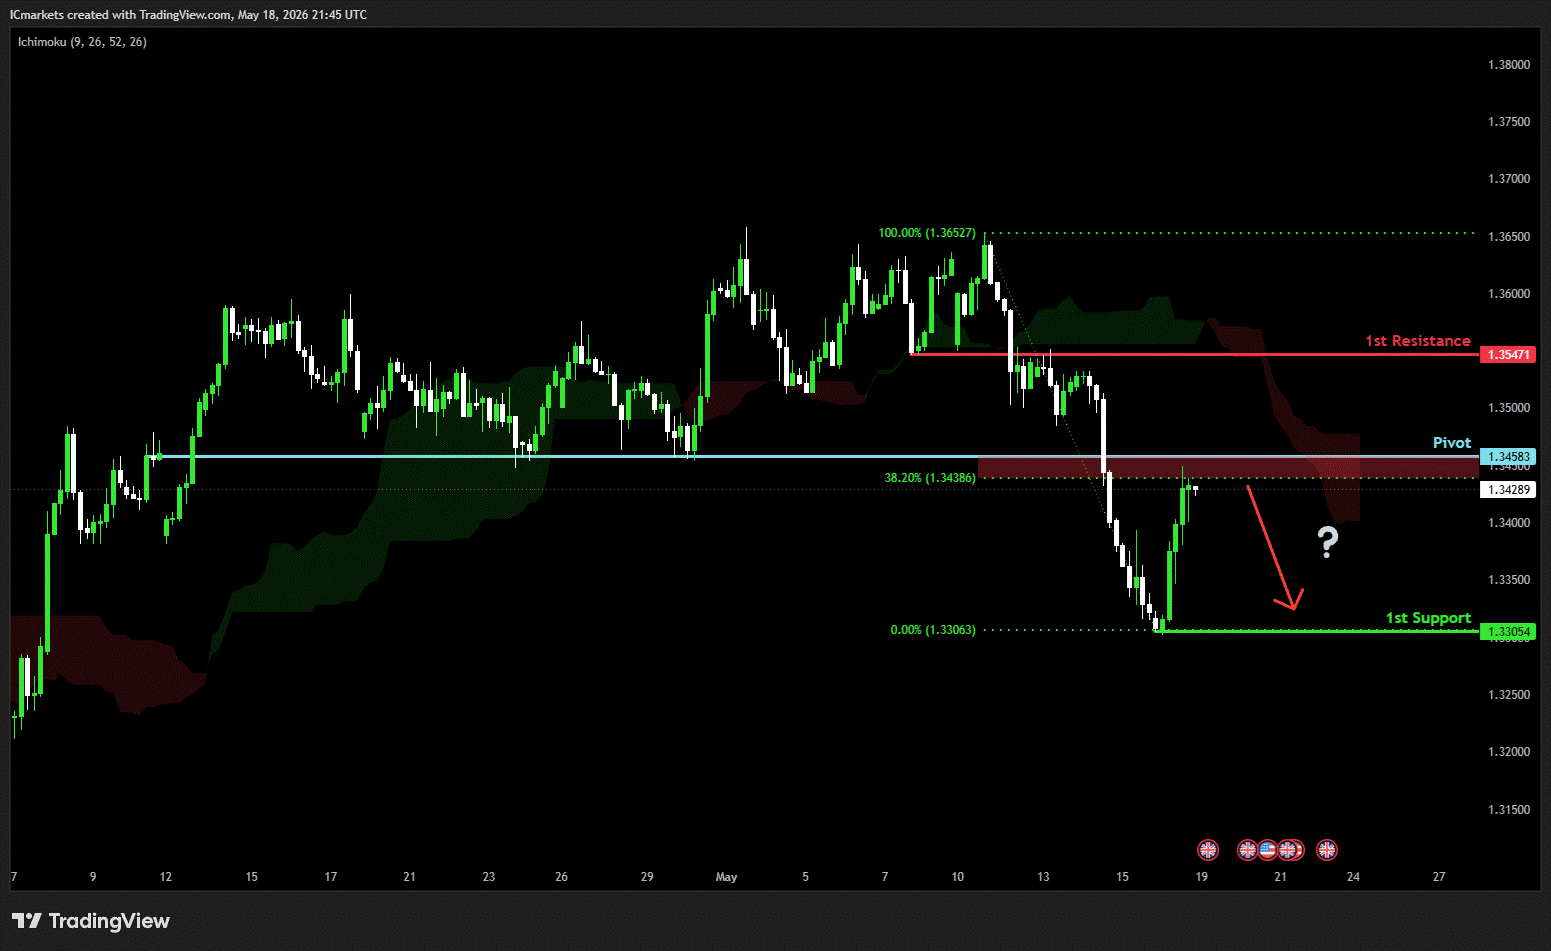
GBP/USD:
Potential Direction: Bearish
Overall momentum of the chart: Bullish
The price has already reacted off the pivot and may continue its bearish move toward the 1st support.
Pivot: 1.3458
Supporting reasons: Identified as a pullback resistance that aligns with the 38.2% Fibonacci retracement, where selling pressures could intensify and potentially cap any upward retracement.
1st support: 1.3305
Supporting reasons: Identified as a swing low support, indicating a potential area where the price could stabilize once more.
1st resistance: 1.3547
Supporting reasons: Identified as an overlap resistance, indicating a potential level that could halt further upward movement.
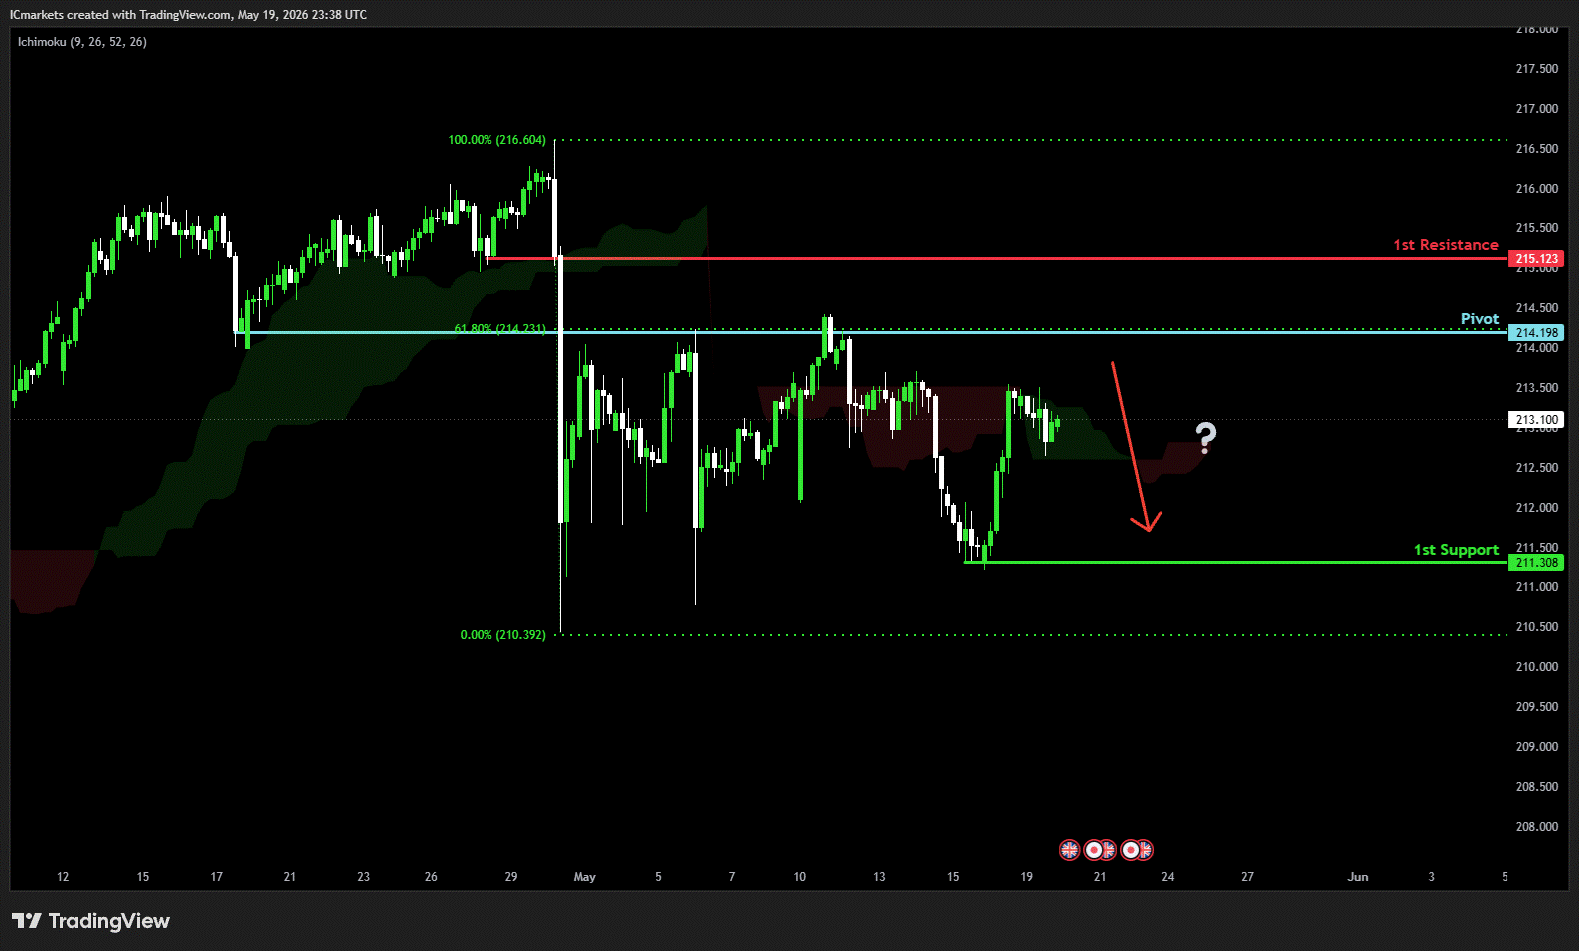
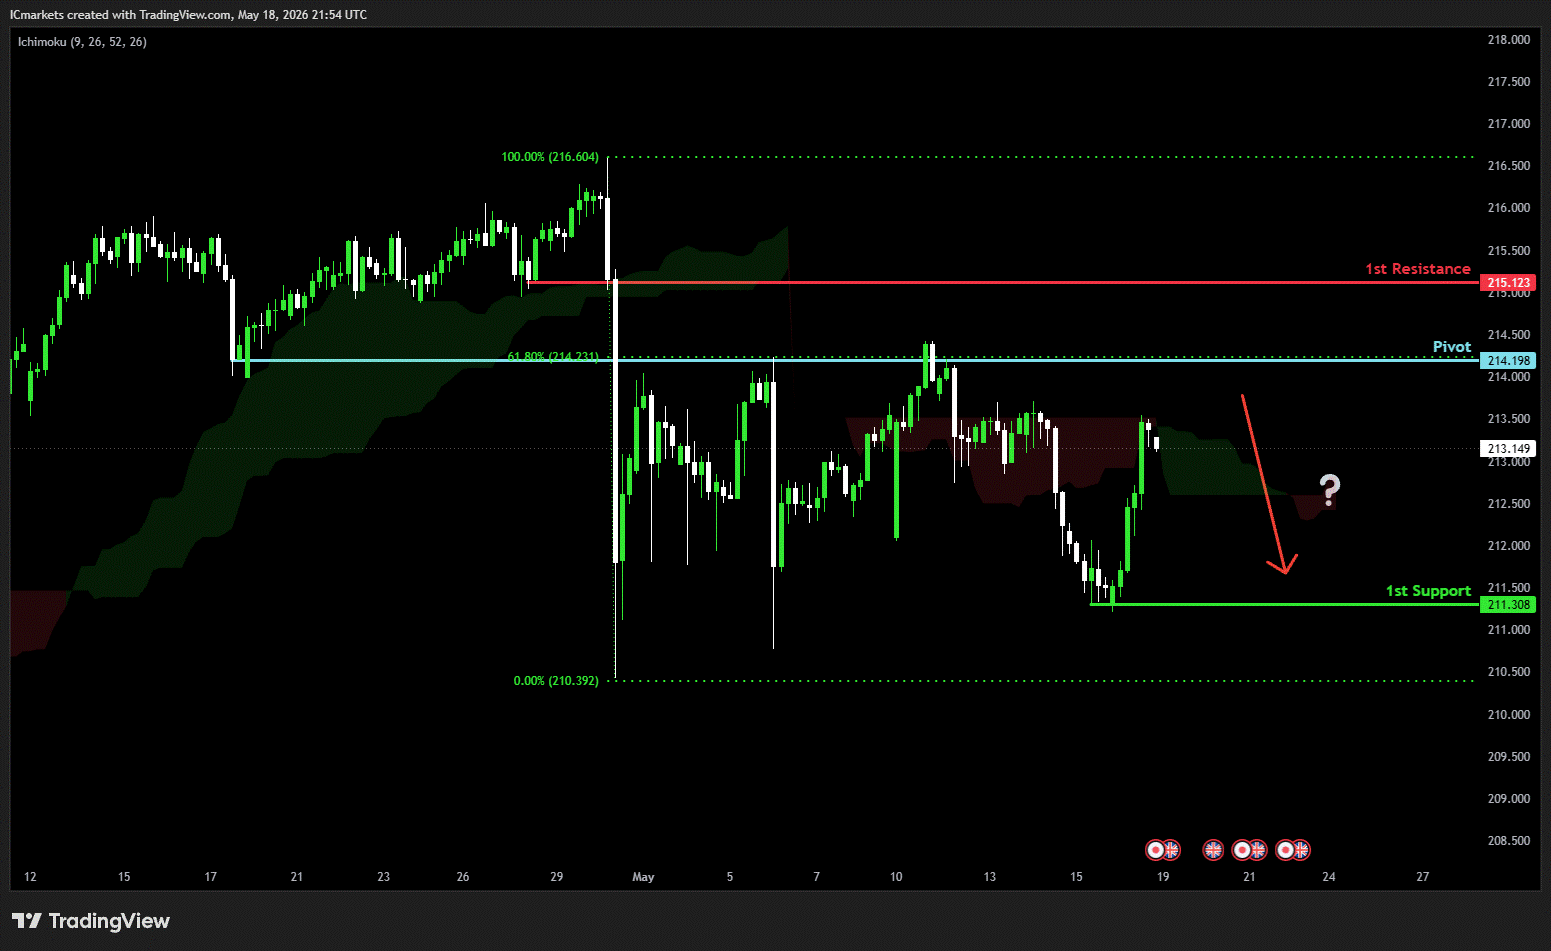
GBP/JPY:
Potential Direction: Bearish
Overall momentum of the chart: Bullish
The price has already reacted off the pivot and may continue its bearish move toward the 1st support.
Pivot: 214.19
Supporting reasons: Identified as a pullback resistance that aligns with the 61.8% Fibonacci retracement, where selling pressures could intensify and potentially cap any upward retracement.
1st support: 211.30
Supporting reasons: Identified as a swing low support, indicating a potential level where the price could stabilize once more.
1st resistance: 215.12
Supporting reasons: Identified as a pullback resistance, indicating a potential level that could halt further upward movement.
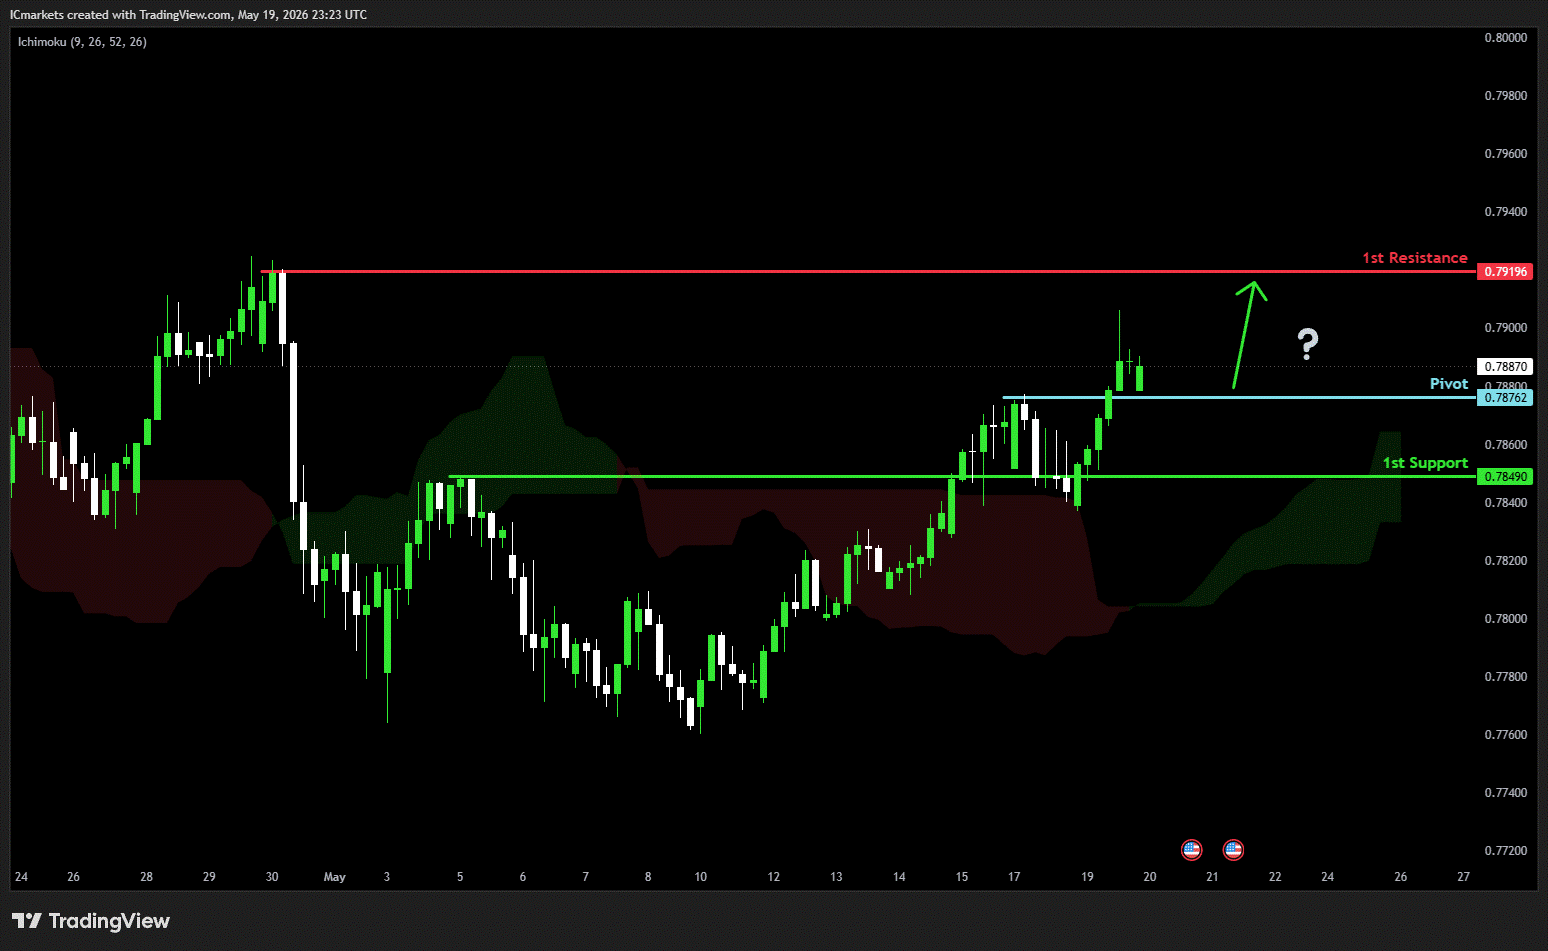
USD/CHF:
Potential Direction: Bullish
Overall momentum of the chart: Bearish
Price could see a short-term pullback toward the pivot before rising again toward the 1st resistance.
Pivot: 0.7876
Supporting reasons: Identified as a pullback support, where renewed buying pressure could emerge to push the price higher.
1st support: 0.7849
Supporting reasons: Identified as a pullback support, indicating a potential level where the price could stabilize once again.
1st resistance: 0.7919
Supporting reasons: Identified as a swing high resistance, indicating a potential level that could cap further upward movement.
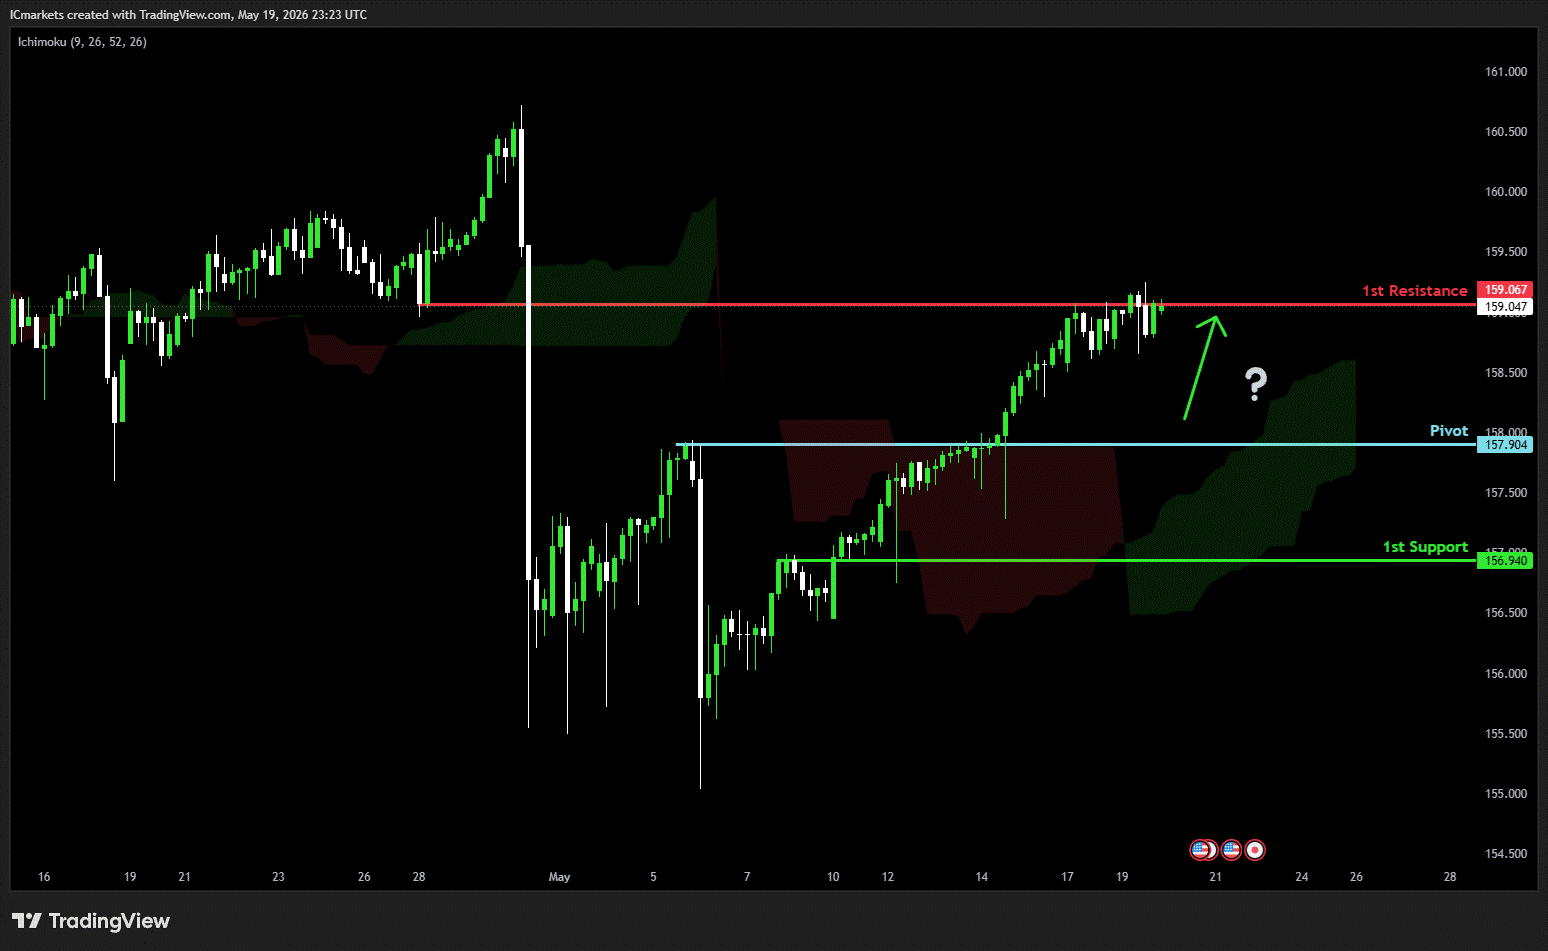
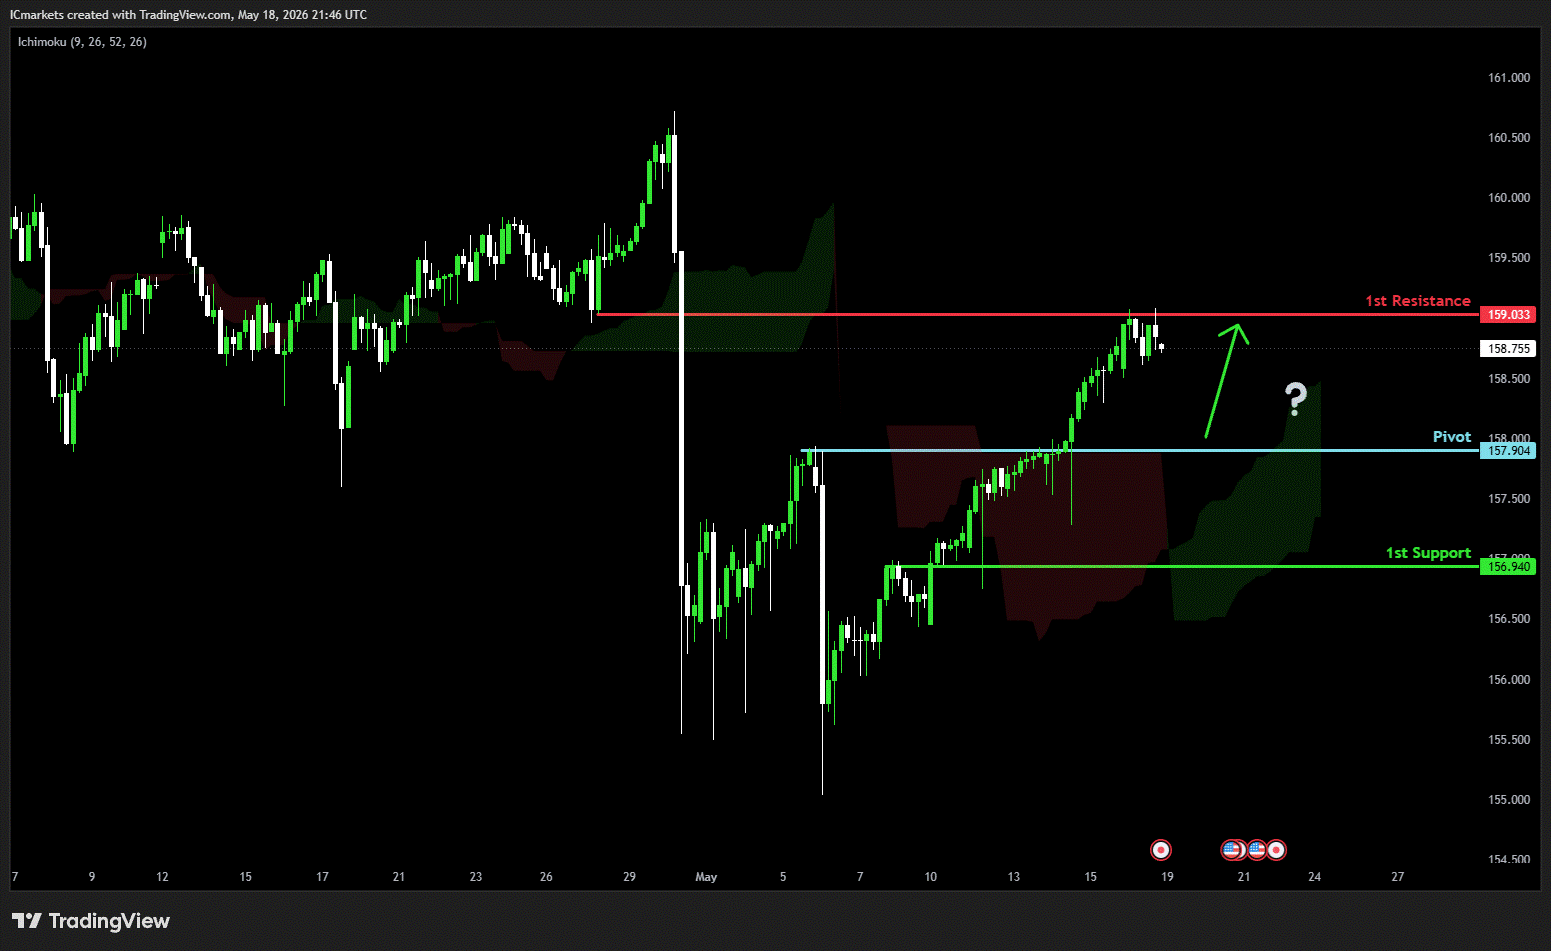
USD/JPY:
Potential Direction: Bullish
Overall momentum of the chart: Bullish
The price could see a short-term pullback toward the pivot before continuing its bearish move down toward the 1st support.
Pivot: 157.90
Supporting reasons: Identified as a pullback resistance, where selling pressures could intensify and potentially cap any upward retracement.
1st support: 156.94
Supporting reasons: Identified as an overlap support, indicating a strong area where buyers might return, and the price could stabilize once again.
1st resistance: 159.04
Supporting reasons: Identified as an overlap resistance. This level represents the next key area where upward movement could be capped amid increased selling pressure
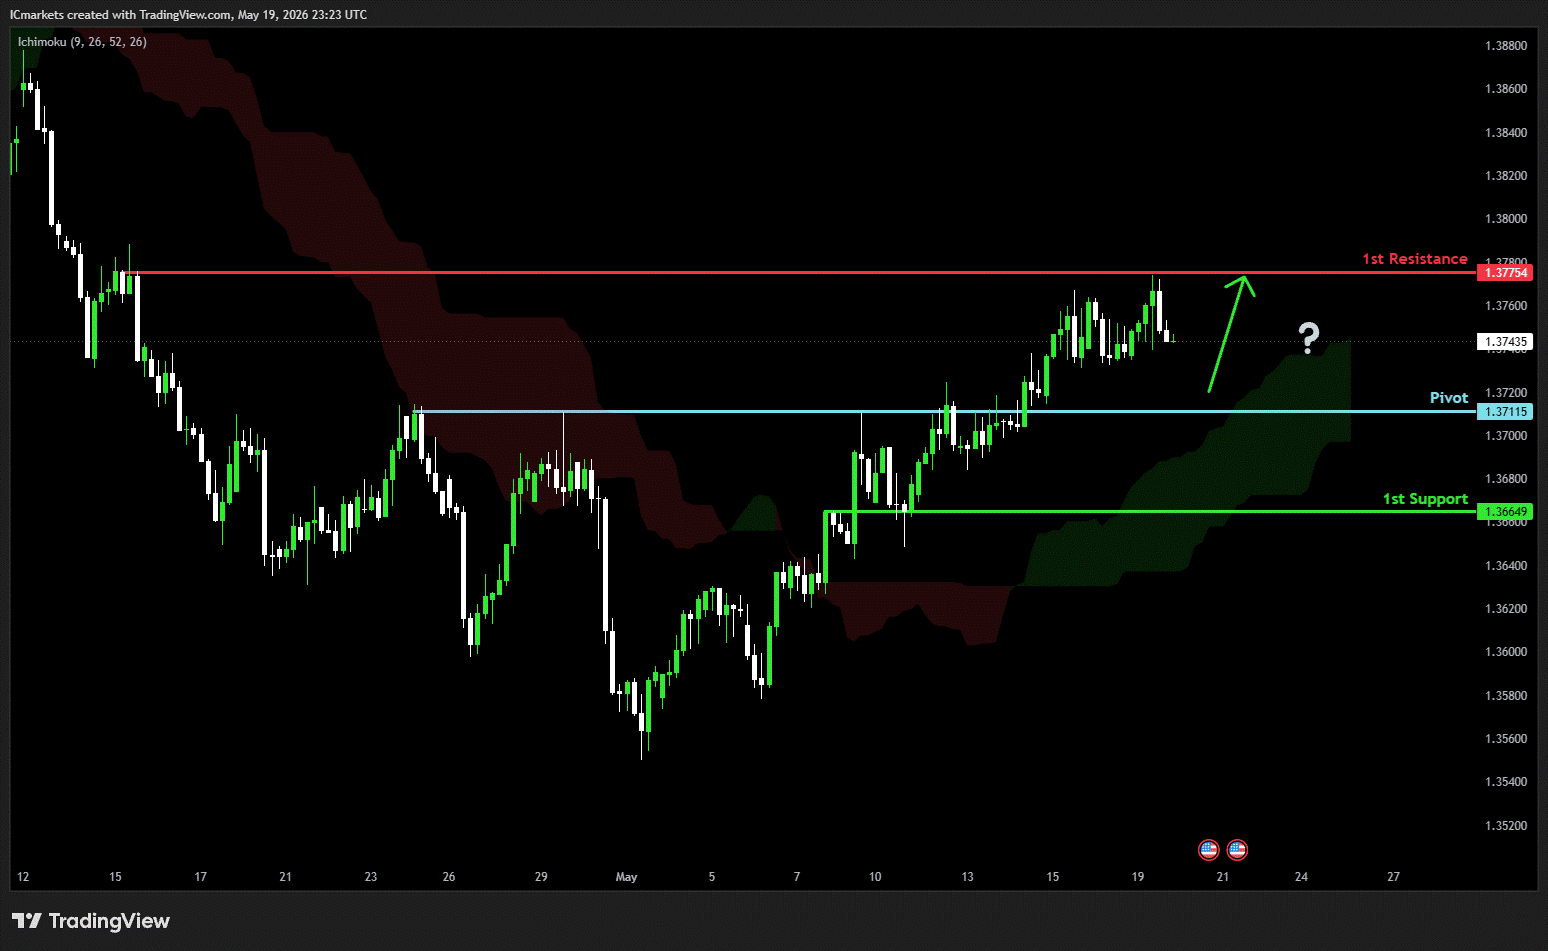
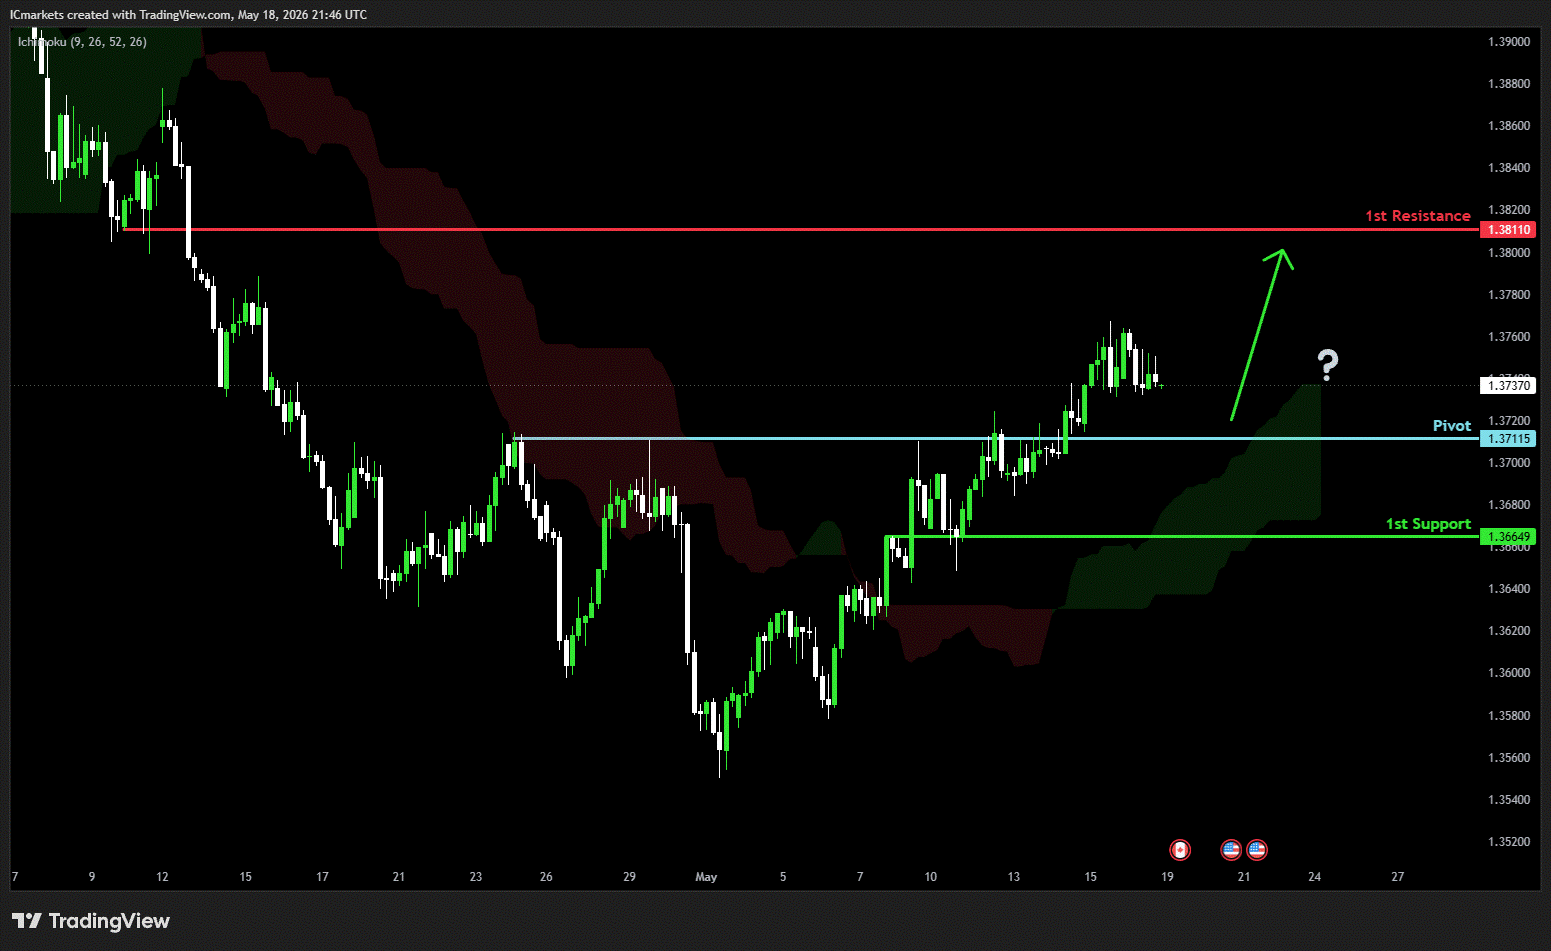
USD/CAD:
Potential Direction: Bullish
Overall momentum of the chart: Bullish
The price could see a short-term pullback toward the pivot before continuing its bearish move down toward the 1st support.
Pivot: 1.3711
Supporting reasons: Identified as a pullback support, where renewed buying pressure could emerge to push the price higher.
1st support: 1.3664
Supporting reasons: Identified as an overlap support, indicating a key level where the price could stabilize once more.
1st resistance: 1.3775
Supporting reasons: Identified as a pullback resistance, making it a possible target for bullish advances and a level where some sellers could return to cap gains
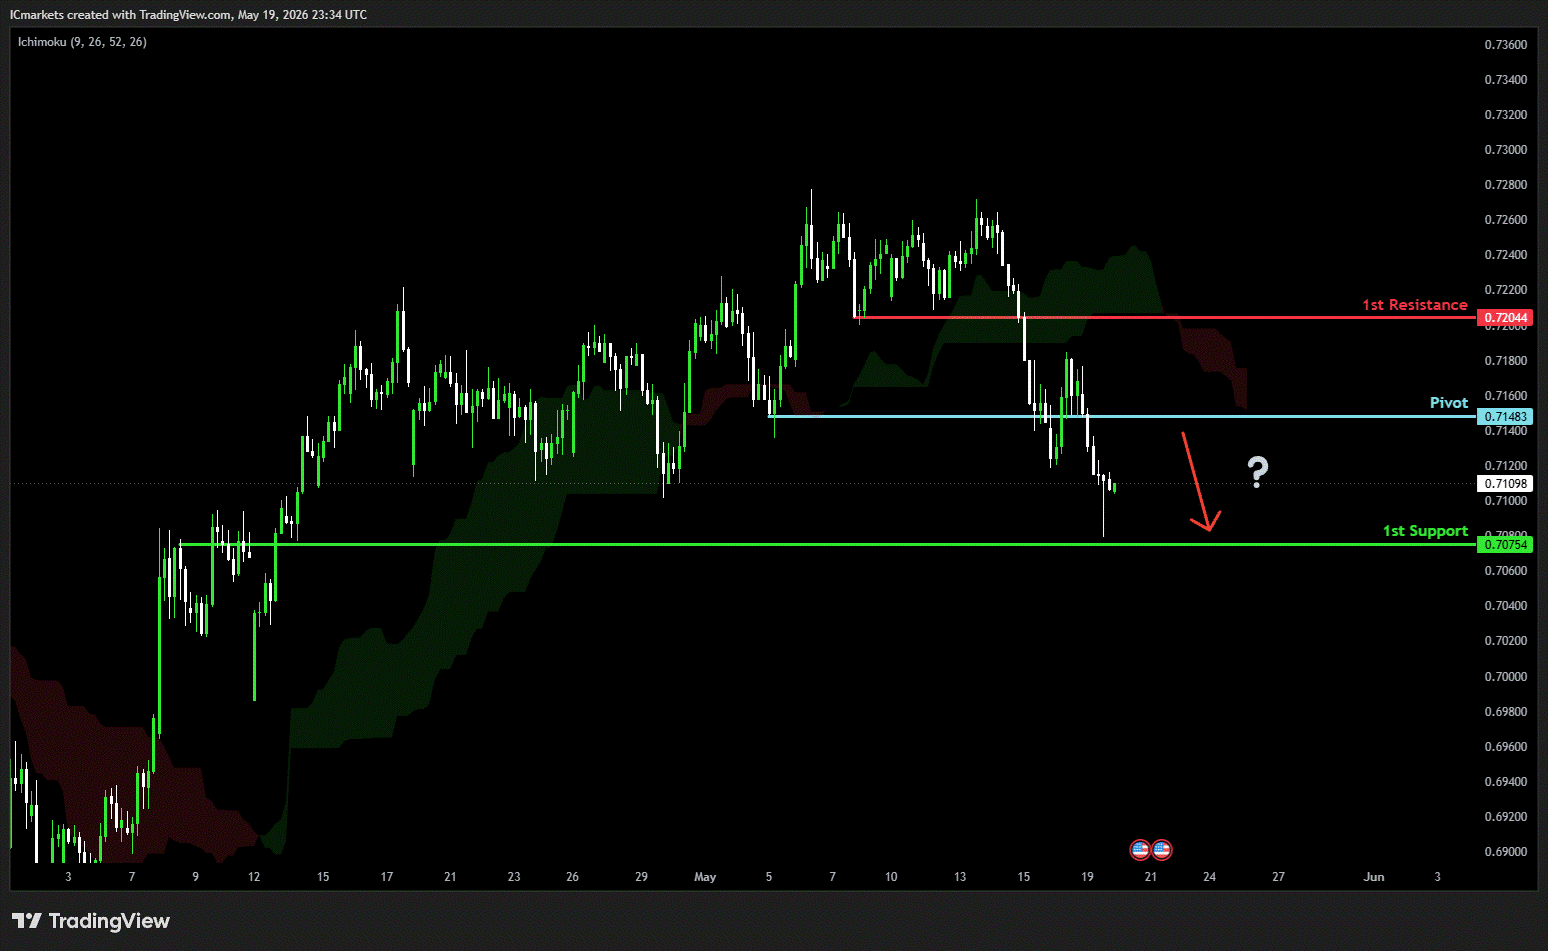
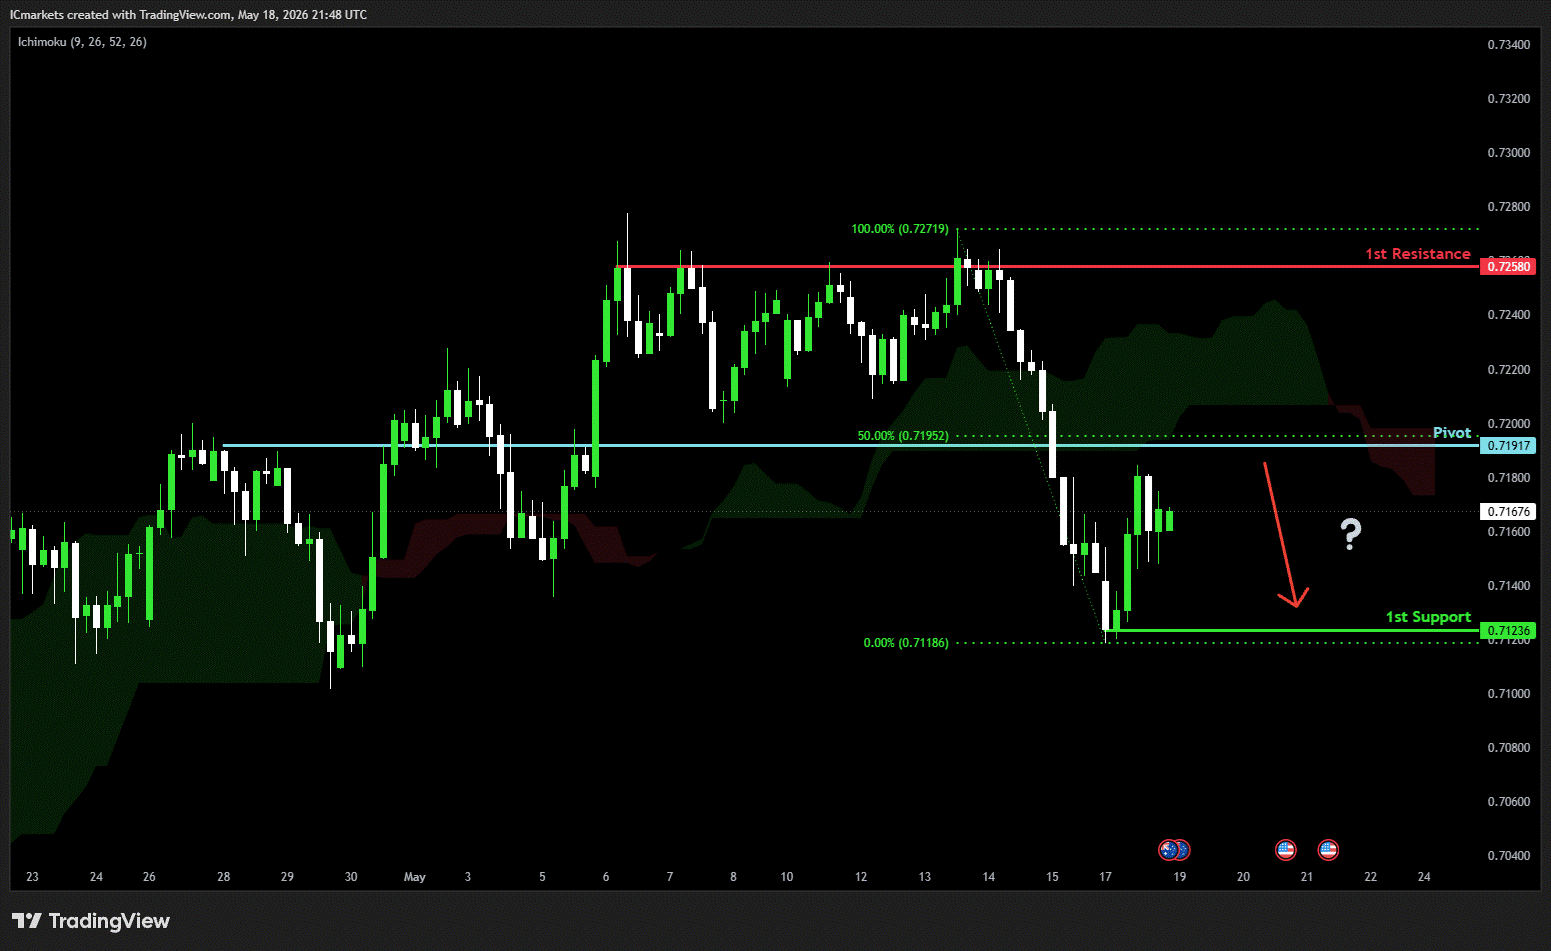
AUD/USD:
Potential Direction: Bearish
Overall momentum of the chart: Bullish
The price could see a short-term pullback toward the pivot before continuing its bearish move down toward the 1st support.
Pivot: 0.7148
Supporting reasons: Identified as a pullback resistance, where selling pressures could intensify and potentially cap any upward retracement.
1st support: 0.7075
Supporting reasons: Identified as a pullback support, this area has provided strong support historically and may attract buying interest for a potential short-term bounce
1st resistance: 0.7204
Supporting reasons: Identified as a pullback resistance, indicating a potential area that could halt any further upward movement.
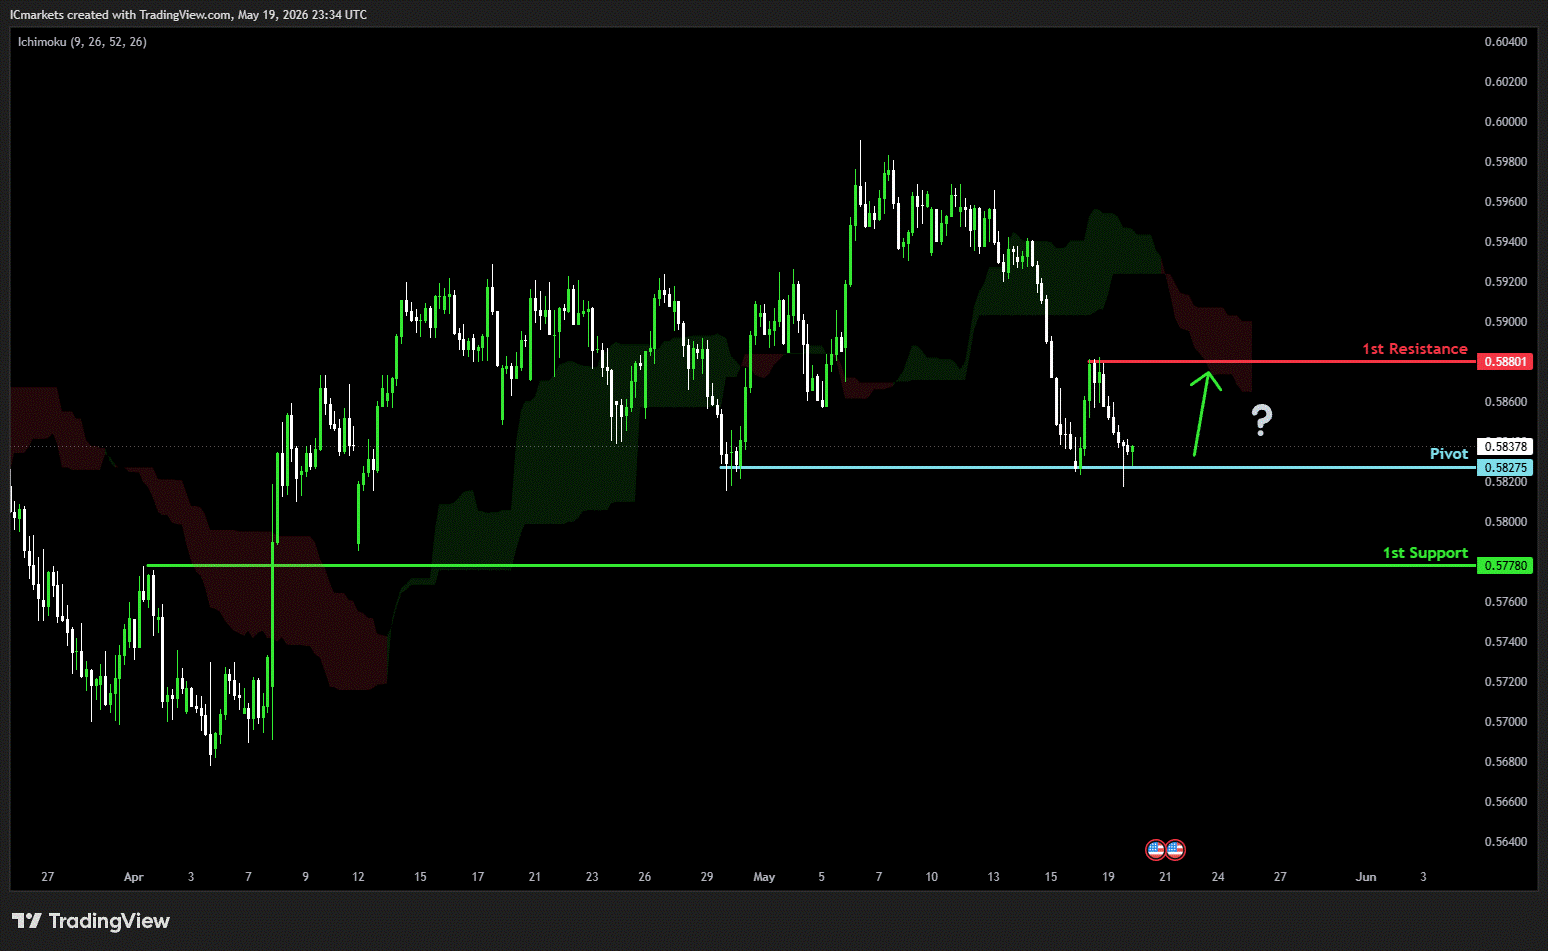
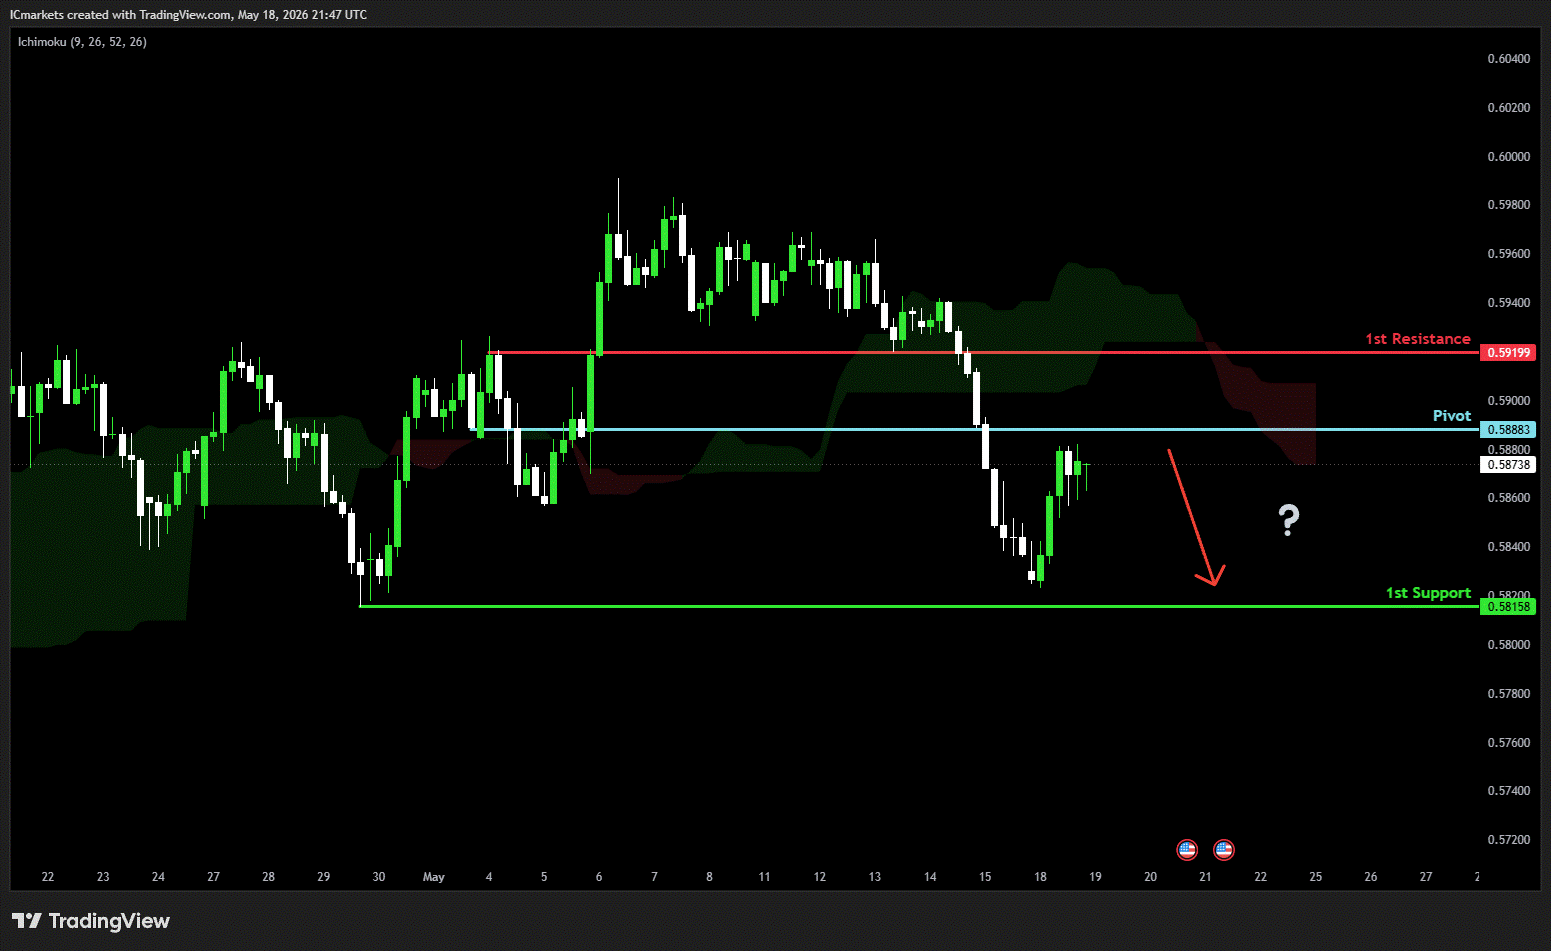
NZD/USD
Potential Direction: Bullish
Overall momentum of the chart: Bullish
The price could see a short-term pullback toward the pivot before continuing its bearish move down toward the 1st support.
Pivot: 0.5827
Supporting reasons: Identified as a multi swing low support, where renewed buying pressure could emerge to push the price higher.
1st support: 0.5778
Supporting reasons: Identified as a pullback support, this area has provided strong support historically and may attract buying interest for a potential short-term bounce
1st resistance: 0.5880
Supporting reasons: Identified as a swing high resistance, indicating a potential area that could halt any further upward movement.
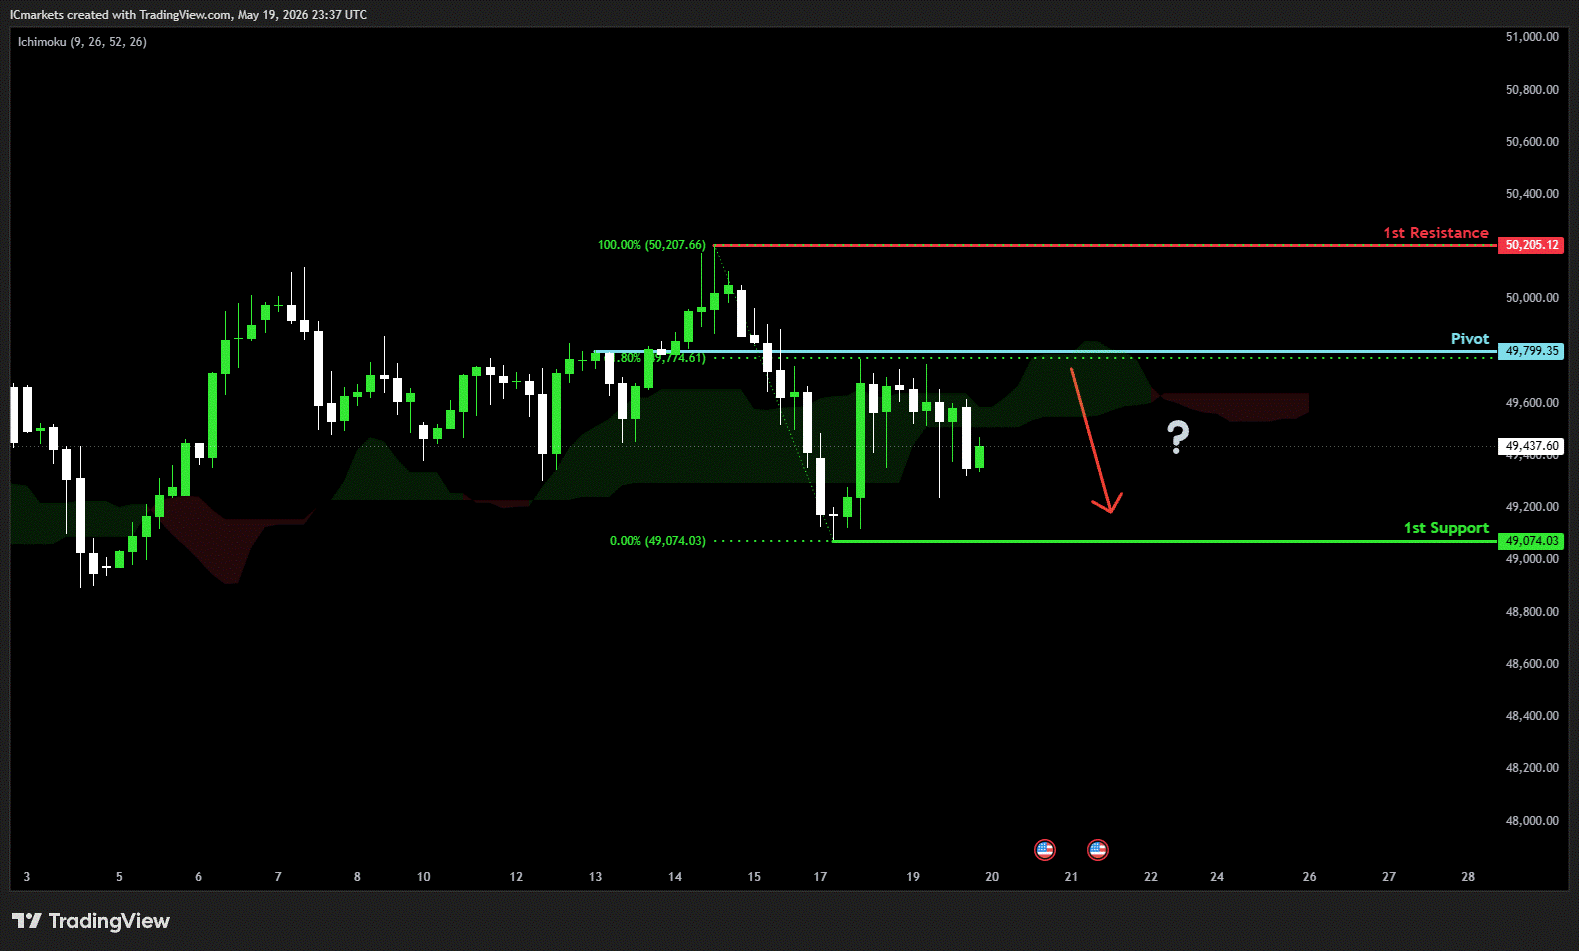
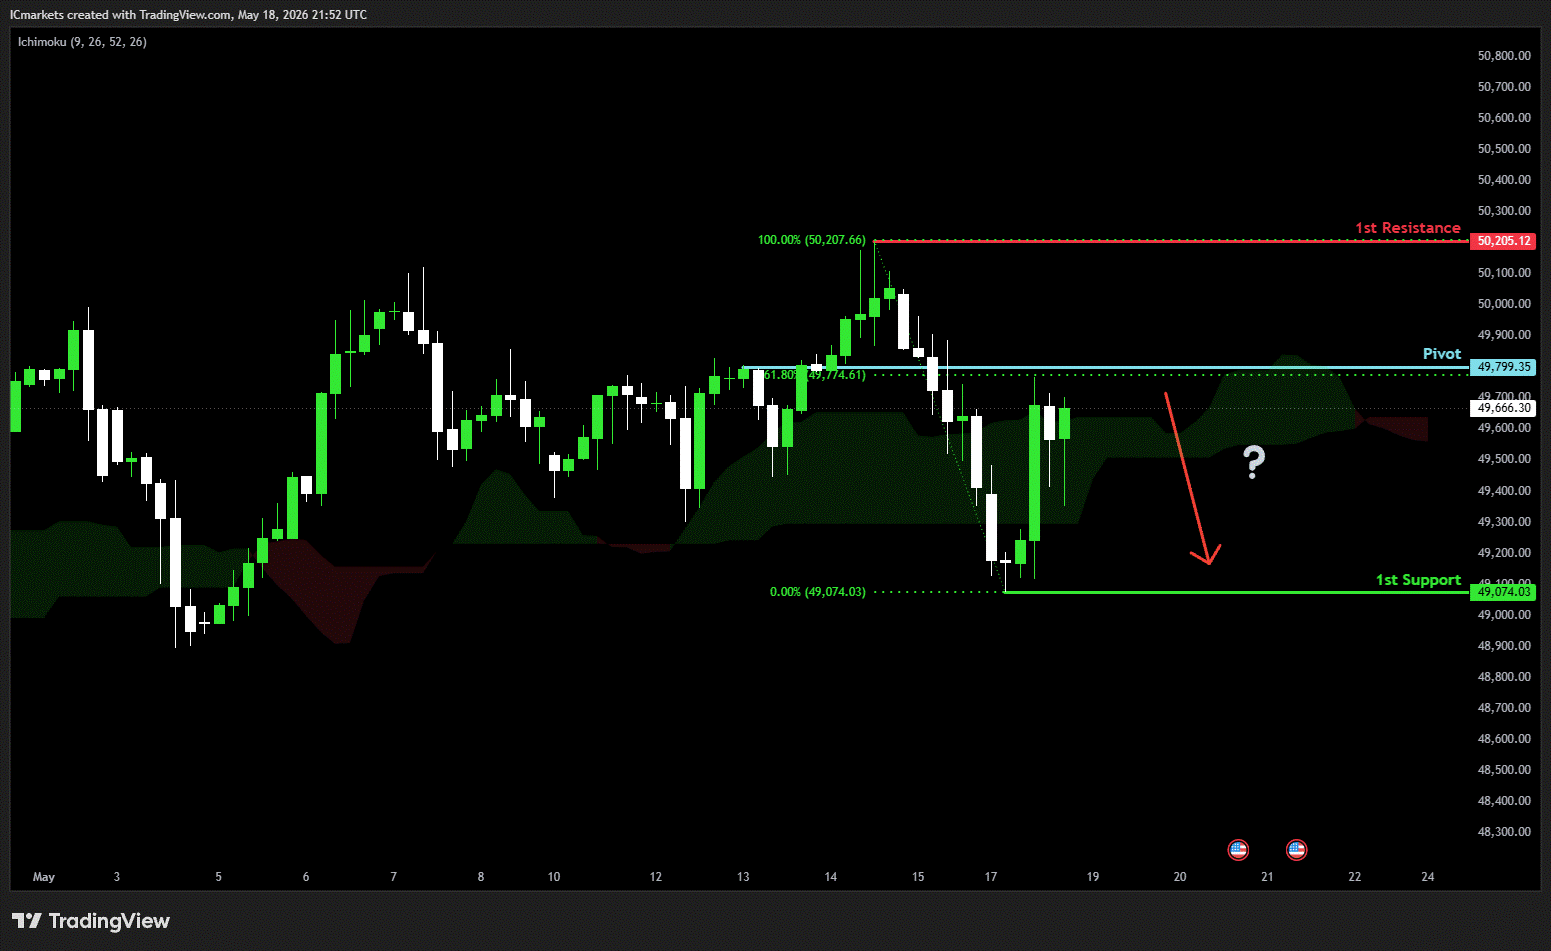
US30 (DJIA):
Potential Direction: Bullish
Overall momentum of the chart: Bullish
The price could see a short-term pullback toward the pivot before continuing its bearish move down toward the 1st support.
Pivot: 49,799.35
Supporting reasons: Identified as a pullback resistance that aligns with the 61.8% Fibonacci retracement, where selling pressures could intensify and potentially cap any upward retracement.
1st support: 49,074.03
Supporting reasons: Identified as a swing low support, suggesting a potential area where the price could stabilize once again.
1st resistance: 50,205.12
Supporting reasons: Identified as a swing high resistance, indicating a potential area that could halt any further upward movement.
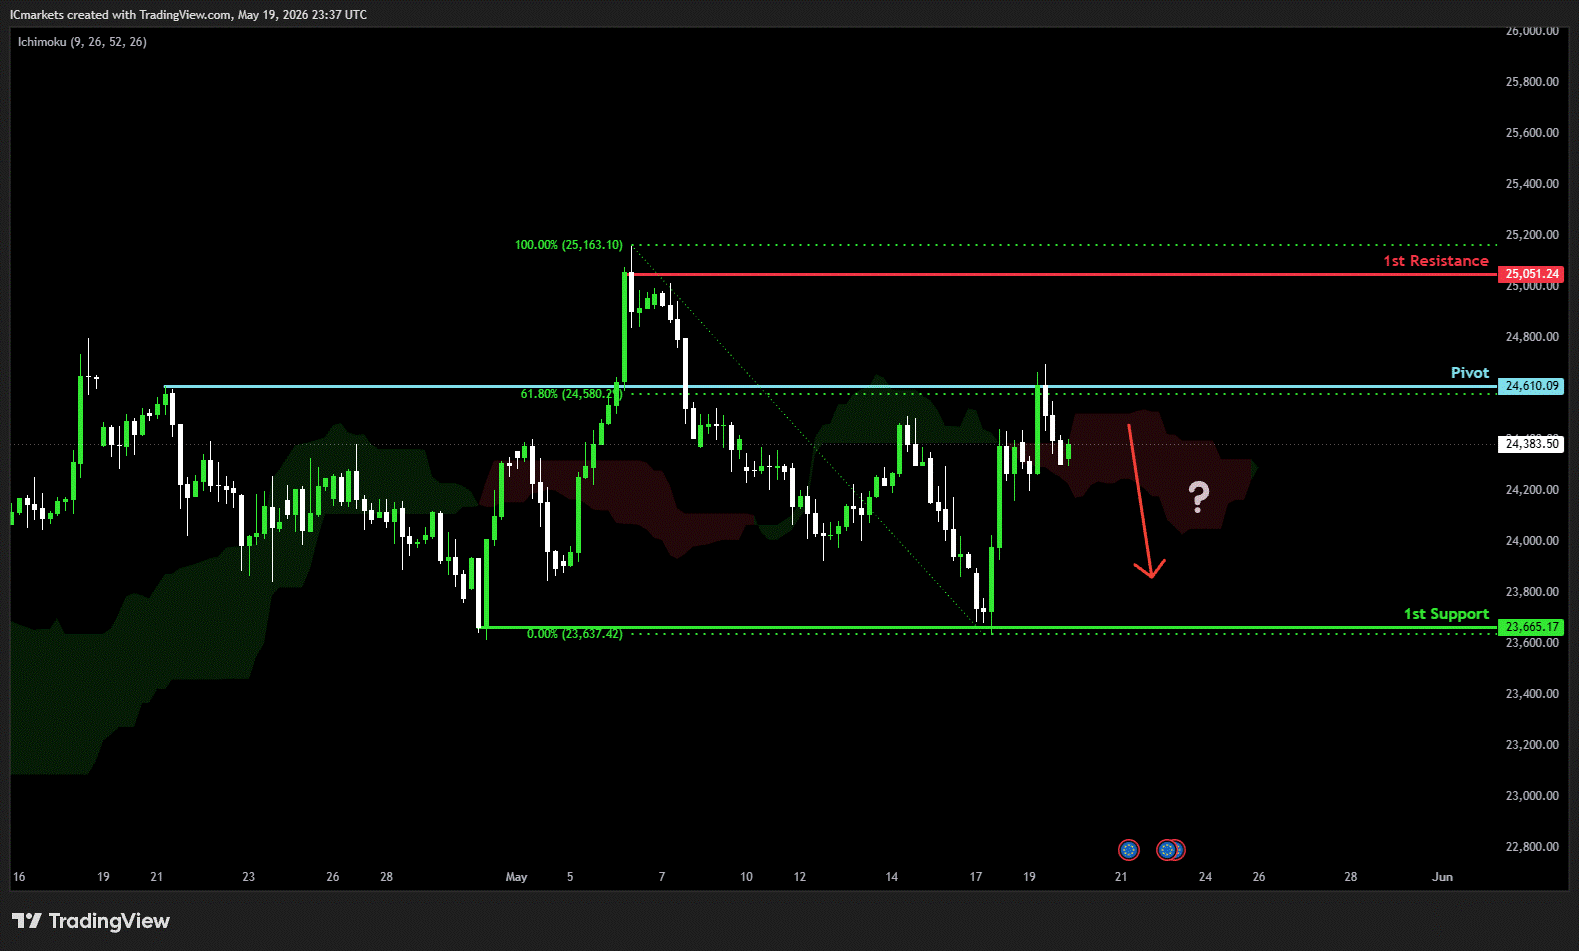
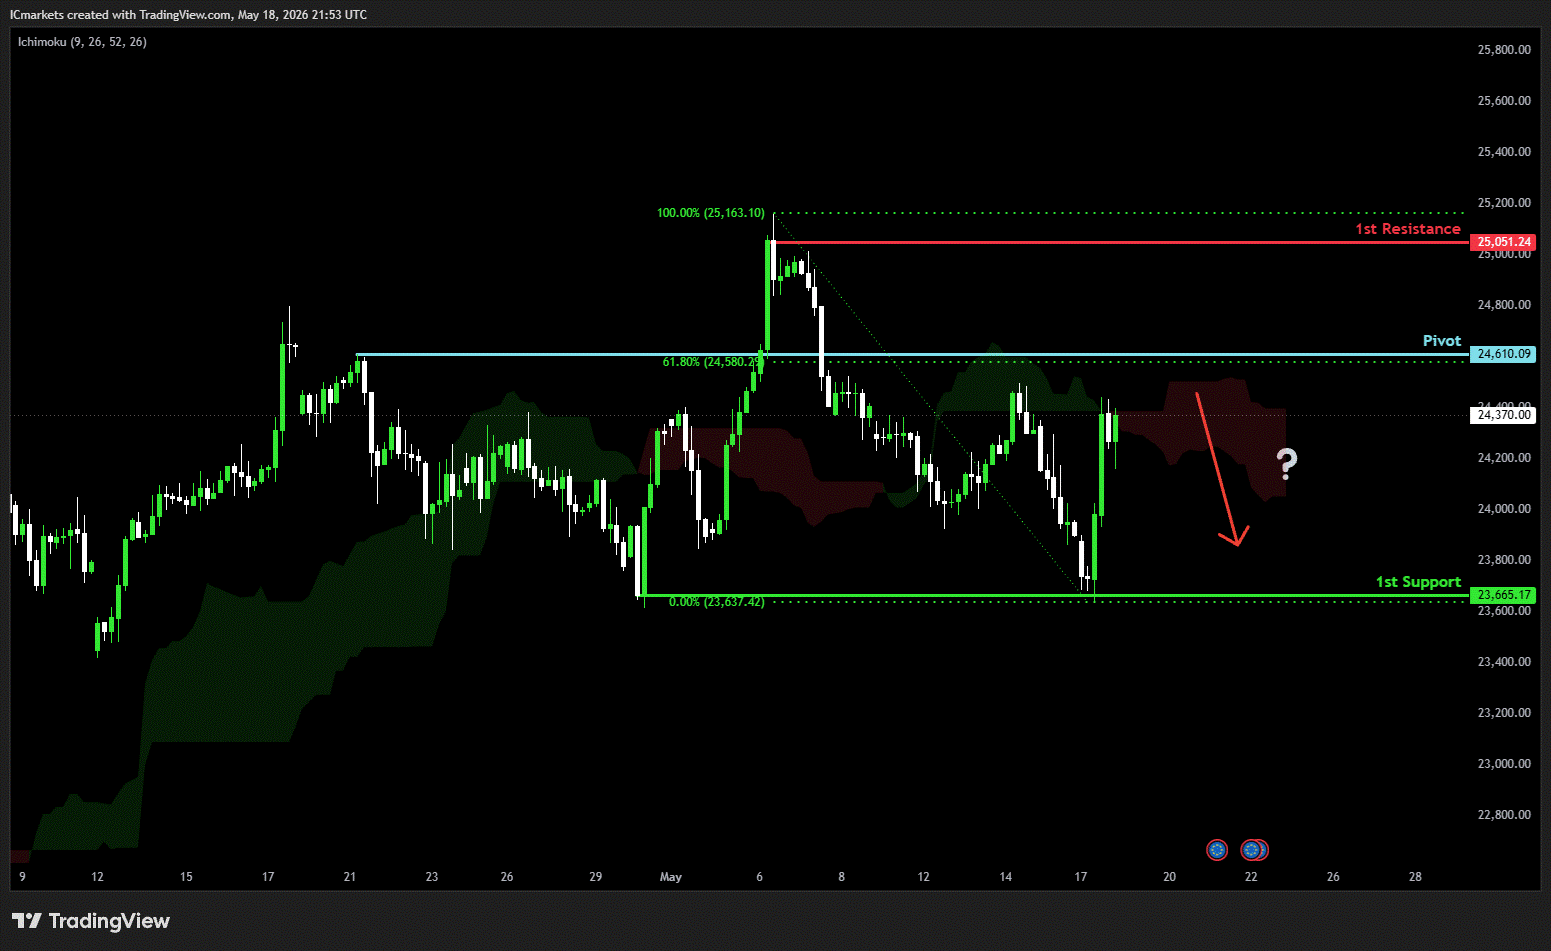
DE40 (DAX):
Potential Direction: Bearish
Overall momentum of the chart: Bullish
The price has already reacted off the pivot and may continue its bearish move toward the 1st support.
Pivot: 24,610.24
Supporting reasons: Identified as a pullback resistance that aligns with the 61.8% Fibonacci retracement, where selling pressures could intensify and potentially cap any upward retracement.
1st support: 23,665.17
Supporting reasons: Identified as a multi-swing low support, indicating a key level where the price could stabilize once more.
1st resistance: 25,051.24
Supporting reasons: Identified as a swing high resistance, indicating a potential area that could halt any further upward movement.
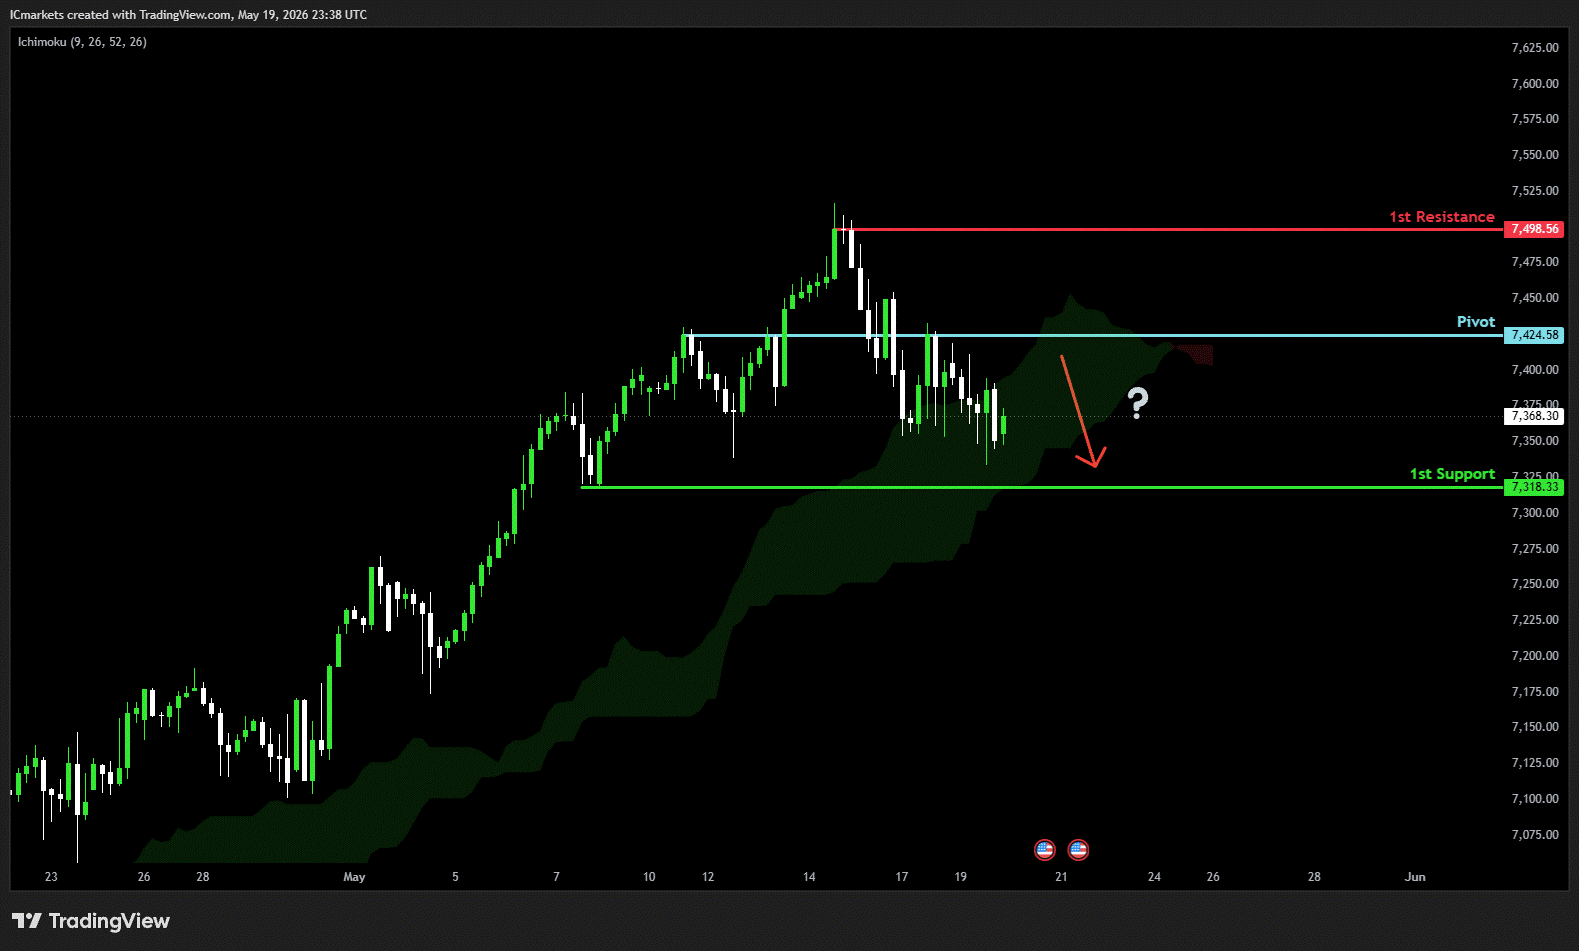
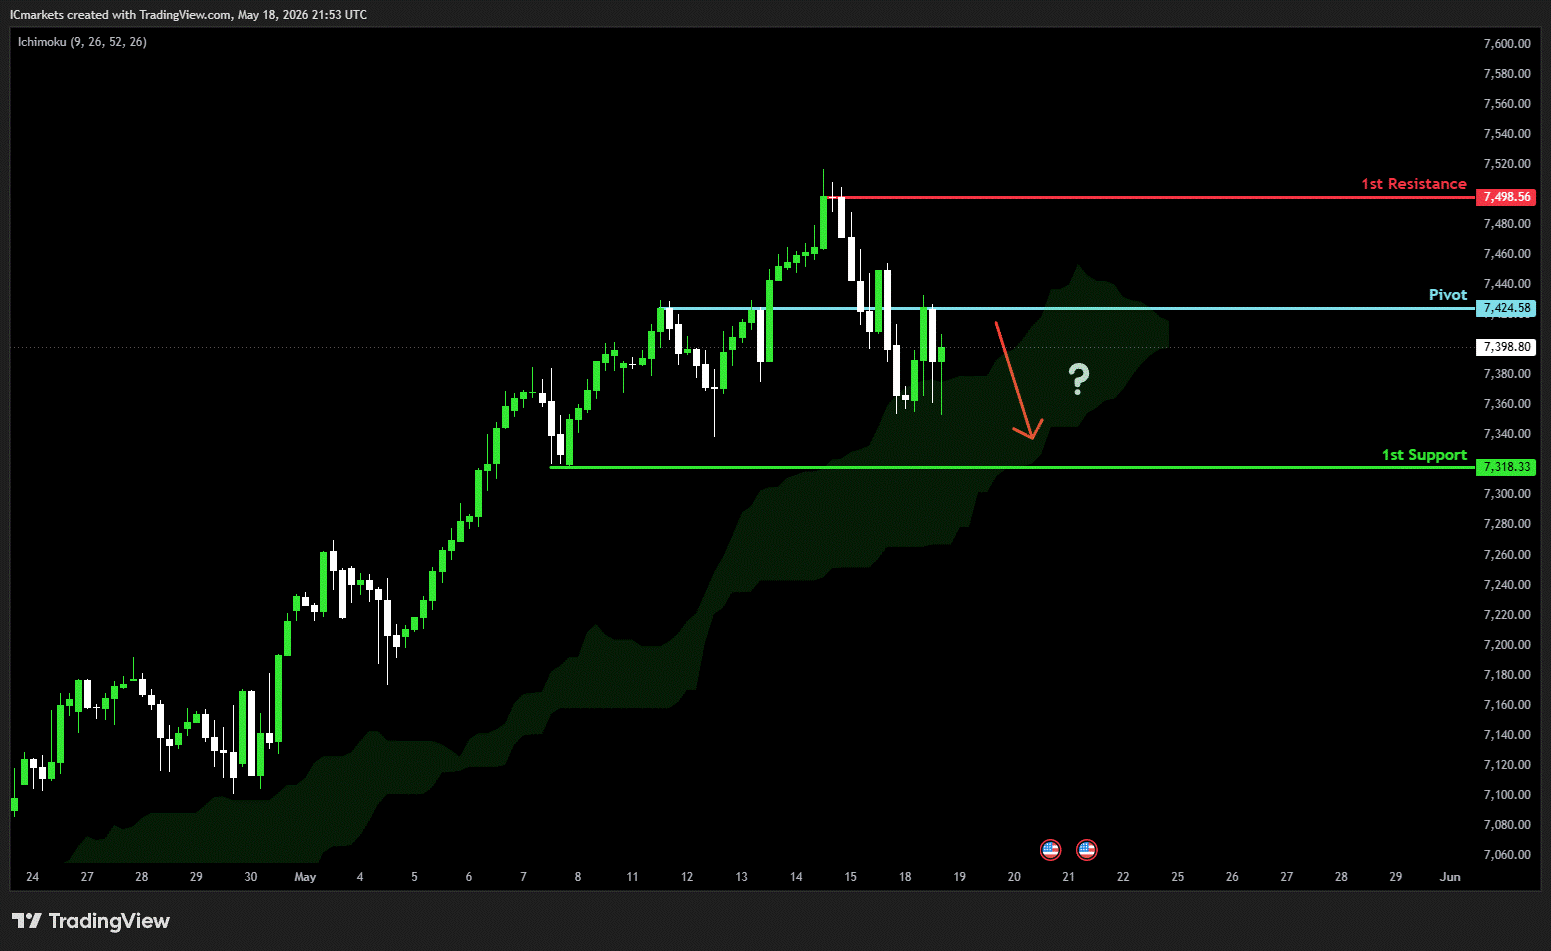
US500 (S&P 500):
Potential Direction: Bearish
Overall momentum of the chart: Bullish
The price has already reacted off the pivot and may continue its bearish move toward the 1st support.
Pivot: 7,424.58
Supporting reasons: Identified as a pullback resistance, where selling pressures could intensify and potentially cap any upward retracement.
1st support: 7,318.33
Supporting reasons: Identified as a swing low support, indicating a potential level where the price could stabilize once again.
1st resistance: 7,498.56
Supporting reasons: Identified as a swing high resistance, indicating a potential area that could halt any further upward movement.
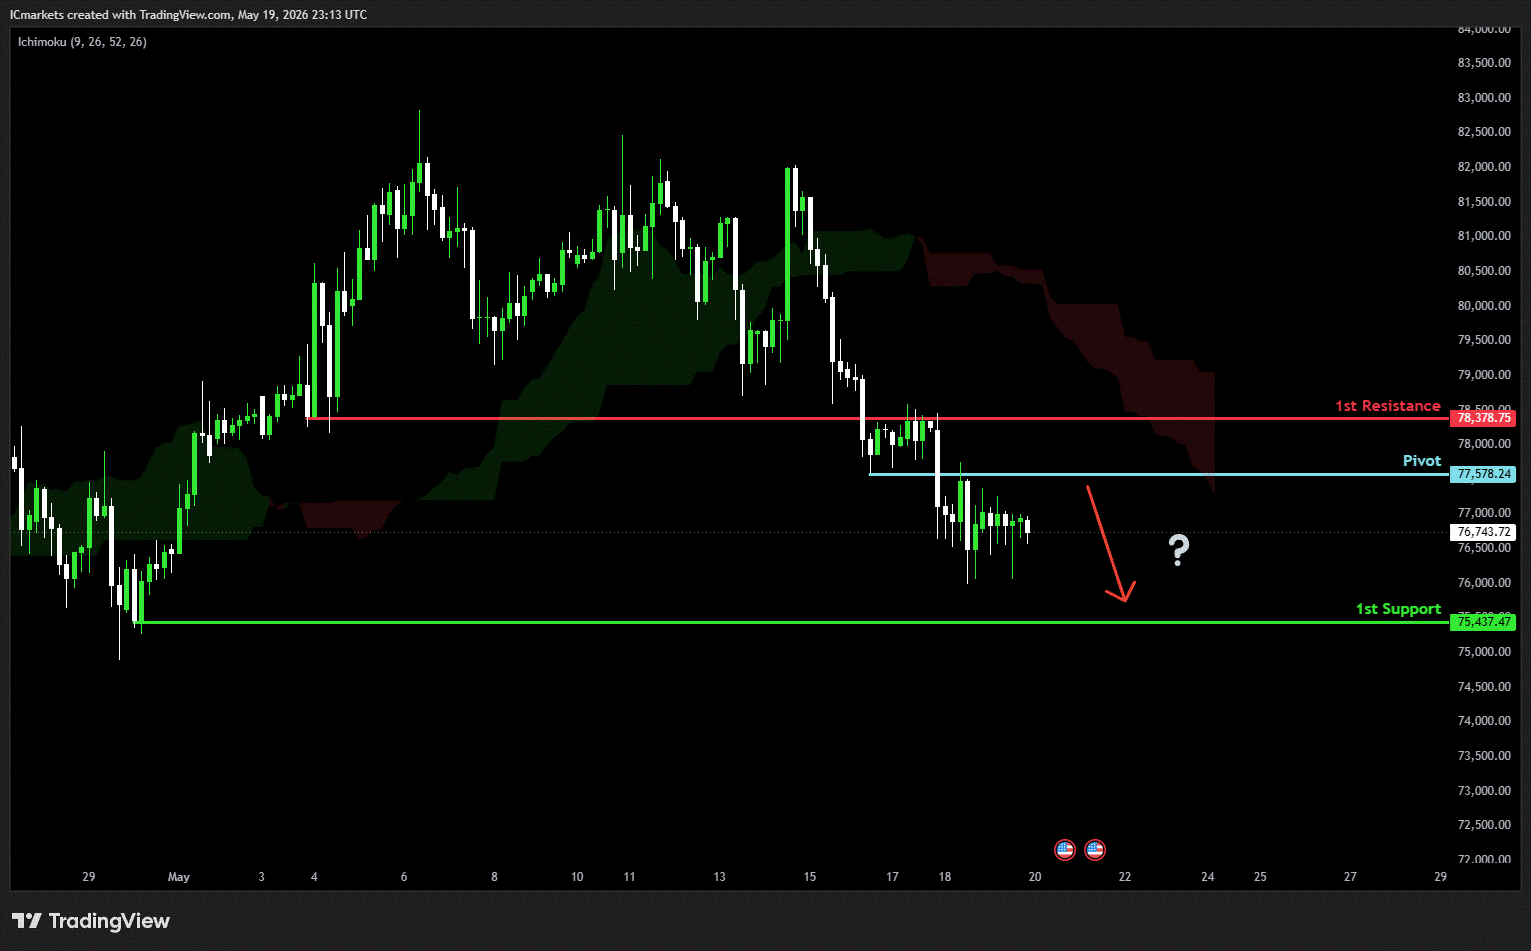
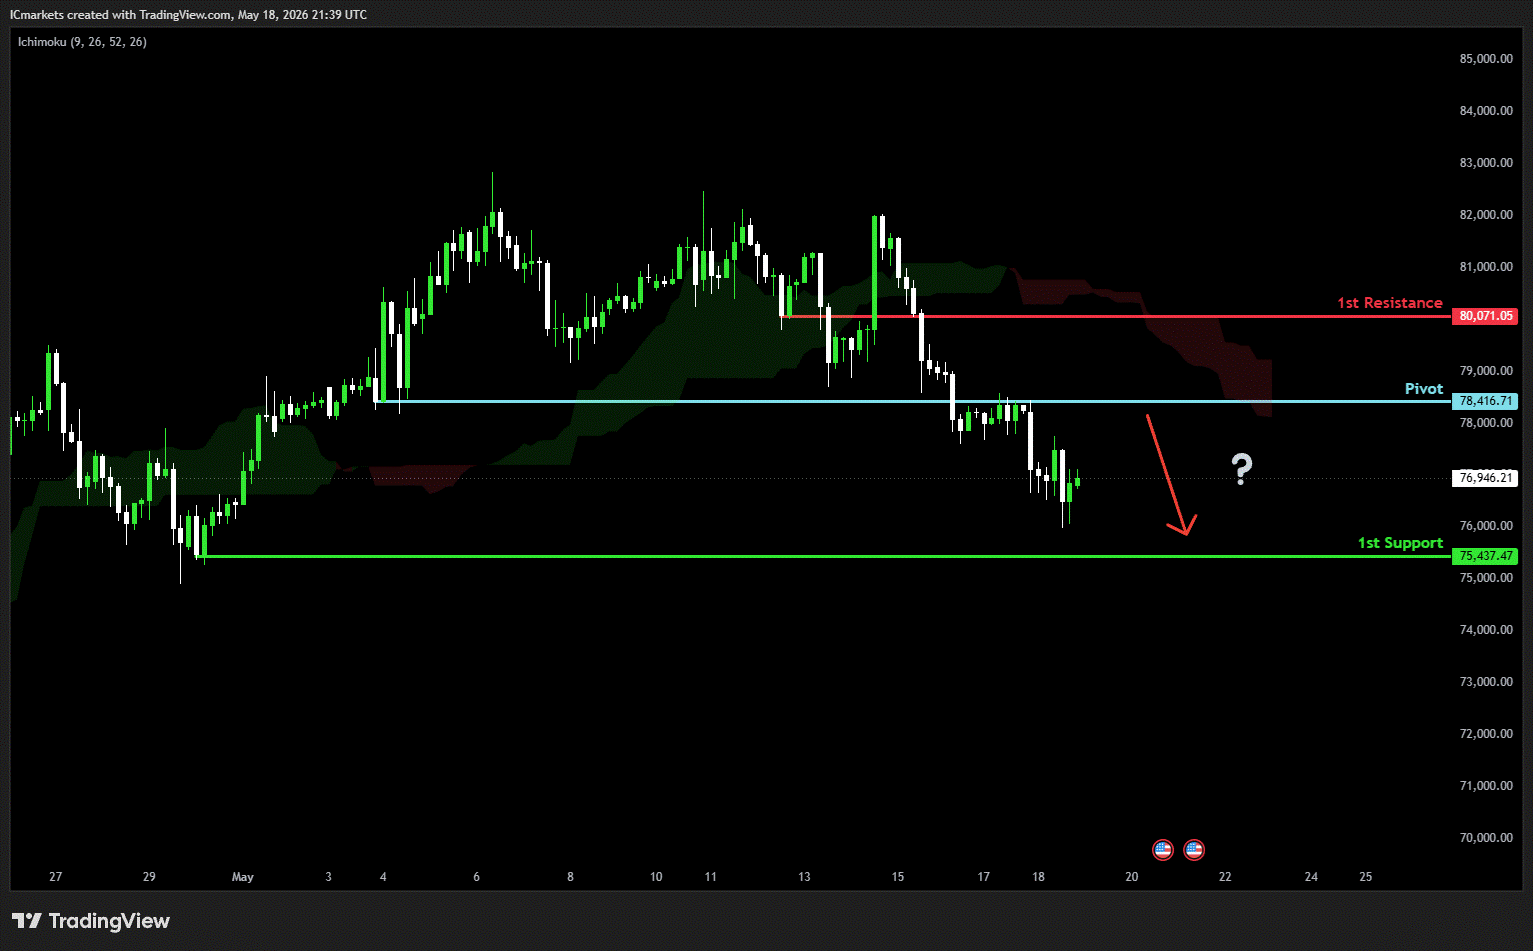
BTC/USD (Bitcoin):
Potential Direction: Bearish
Overall momentum of the chart: Bearish
The price has already reacted off the pivot and may continue its bearish move toward the 1st support.
Pivot: 77,578.24
Supporting reasons: Identified as a pullback resistance, where selling pressures could intensify and potentially cap any upward retracement.
1st support: 75,437.47
Supporting reasons: Identified as a swing low support, indicating a potential level where the price could stabilize once more.
1st resistance: 78,378.75
Supporting reasons: Identified as an overlap resistance, indicating a potential area that could halt any further upward movement.
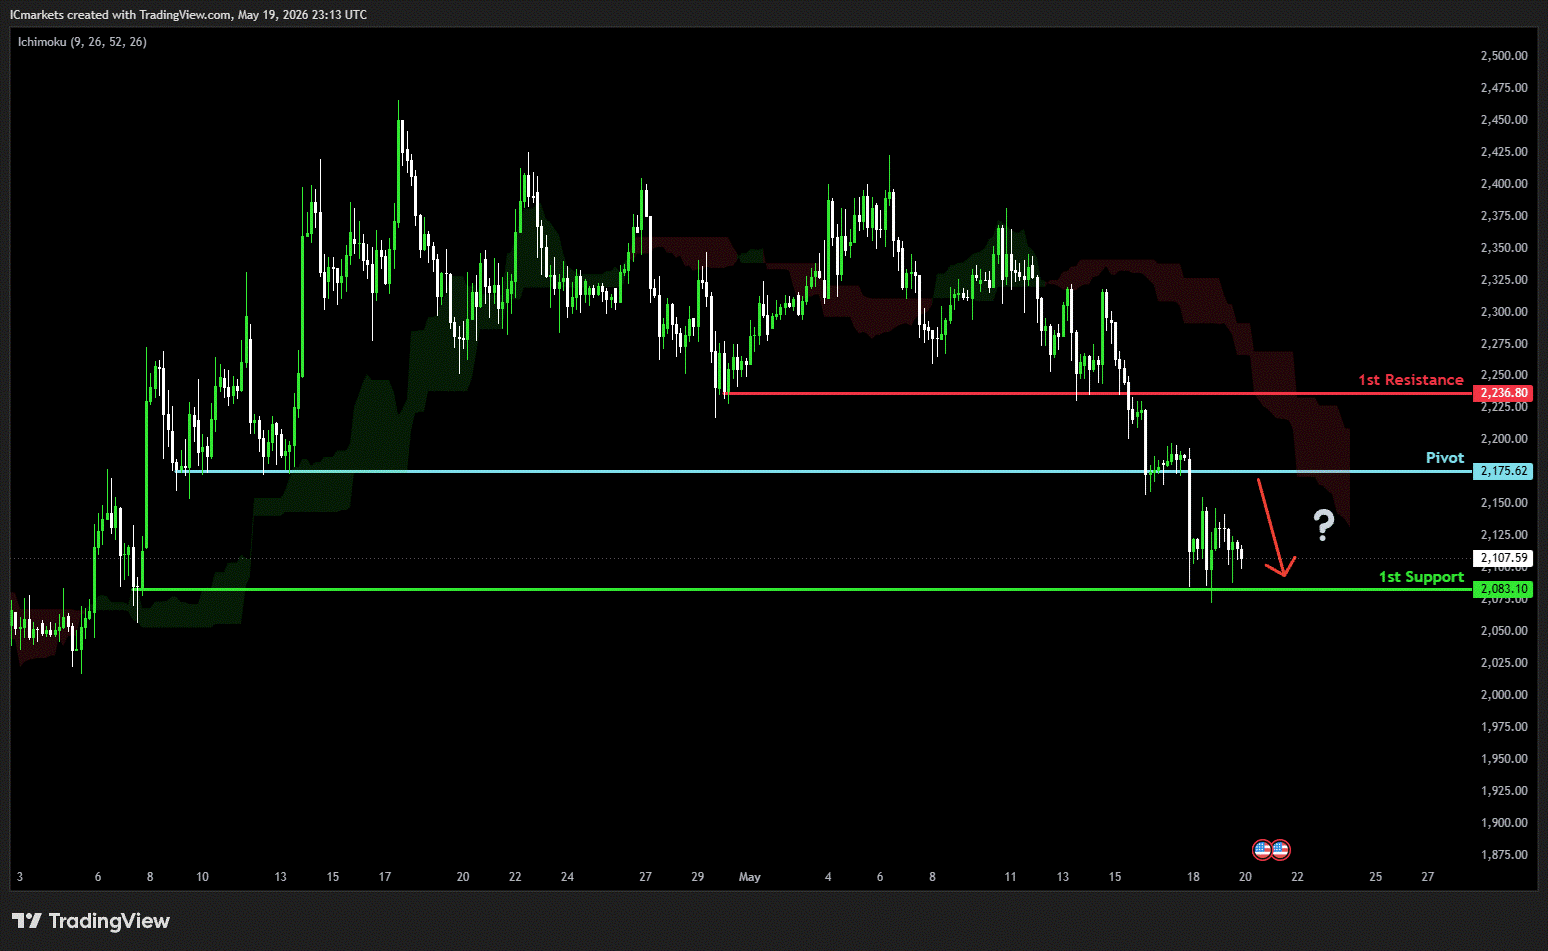
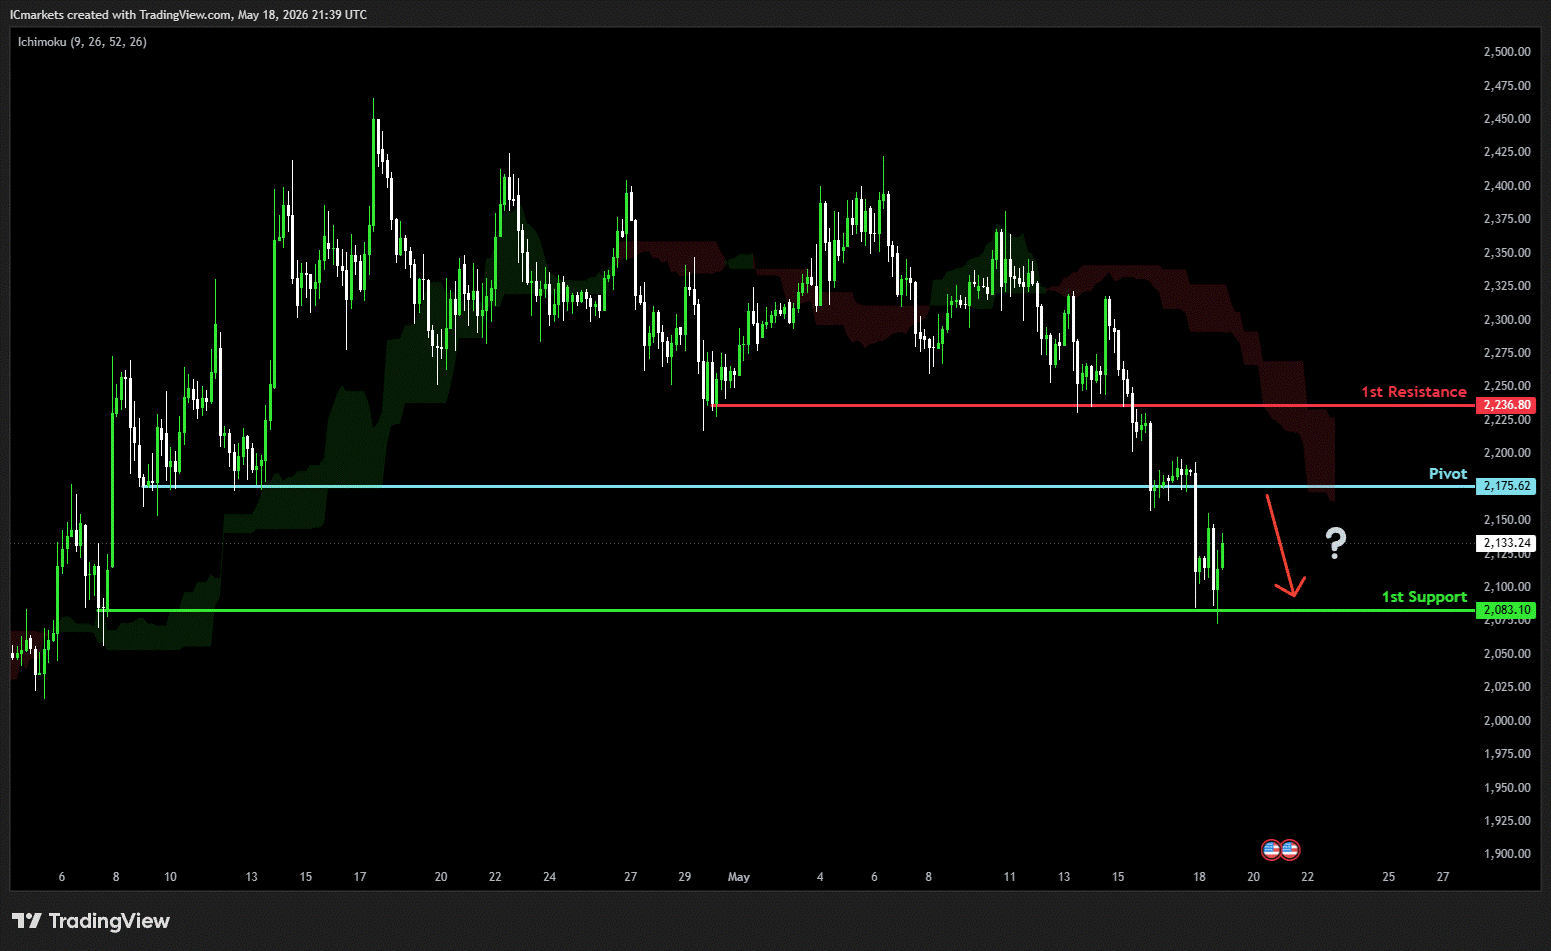
ETH/USD (Ethereum):
Potential Direction: Bearish
Overall momentum of the chart: Bullish
The price could see a short-term pullback toward the pivot before continuing its bearish move down toward the 1st support.
Pivot: 2,175.62
Supporting reasons: Identified as a pullback resistance, where selling pressures could intensify and potentially cap any upward retracement.
1st support: 2,083.10
Supporting reasons: Identified as a swing low support, indicating a potential level where the price could stabilize once more.
1st resistance: 2,236.80
Supporting reasons: Identified as a pullback resistance, indicating a potential area that could halt any further upward movement.
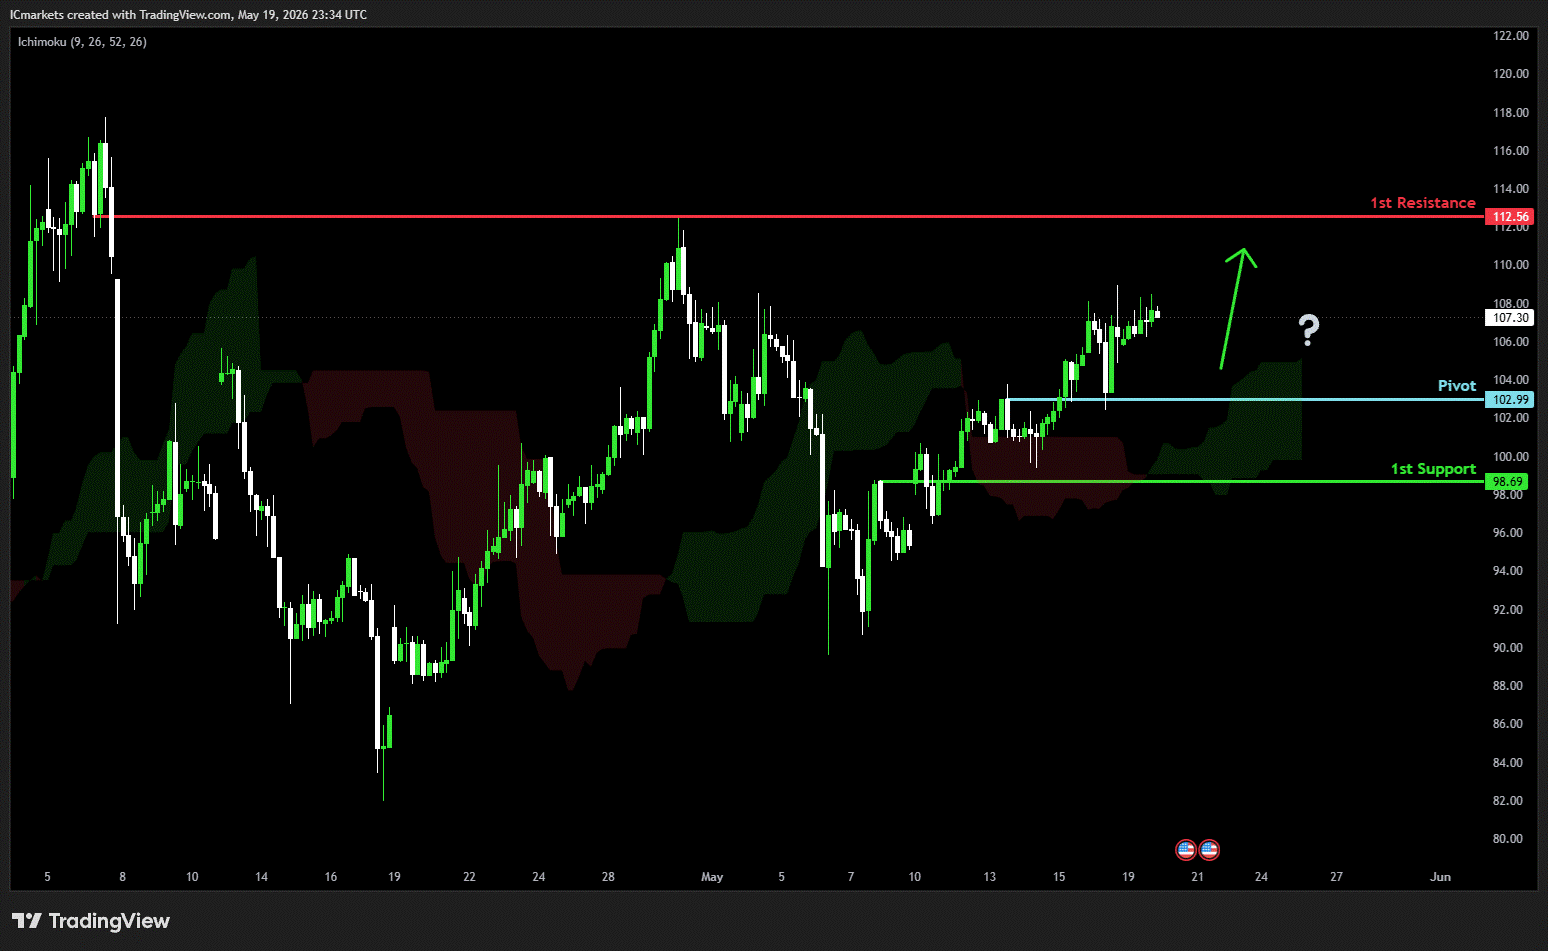
WTI/USD (Oil):
Potential Direction: Bullish
Overall momentum of the chart: Bullish
The price has already bounced off the pivot and may continue its bullish move toward the 1st resistance
Pivot: 102.99
Supporting reasons: Identified as an overlap support, where renewed buying pressure could emerge to push the price higher.
1st support: 98.69
Supporting reasons: Identified as a pullback support, indicating a key level where the price could stabilize once more.
1st resistance: 112.56
Supporting reasons: Identified as an overlap resistance, indicating a potential area that could halt any further upward movement.
XAU/USD (GOLD):
Potential Direction: Bearish
Overall momentum of the chart: Bullish
The price could see a short-term pullback toward the pivot before continuing its bearish move down toward the 1st support
Pivot: 4,522.41
Supporting reasons: Identified as a pullback resistance, where selling pressures could intensify and potentially cap any upward retracement.
1st support: 4,459.57
Supporting reasons: Identified as an overlap support, indicating a key level where the price could stabilize once more.
1st resistance: 4,571.44
Supporting reasons: Identified as a swing high resistance, indicating a potential area that could halt any
The accuracy, completeness and timeliness of the information contained on this site cannot be guaranteed. IC Markets Global does not warranty, guarantee or make any representations, or assume any liability regarding financial results based on the use of the information in the site.
News, views, opinions, recommendations and other information obtained from sources outside of www.icmarkets.com, used in this site are believed to be reliable, but we cannot guarantee their accuracy or completeness. All such information is subject to change at any time without notice. IC Markets Global assumes no responsibility for the content of any linked site.
The fact that such links may exist does not indicate approval or endorsement of any material contained on any linked site. IC Markets Global is not liable for any harm caused by the transmission, through accessing the services or information on this site, of a computer virus, or other computer code or programming device that might be used to access, delete, damage, disable, disrupt or otherwise impede in any manner, the operation of the site or of any user’s software, hardware, data or property.
The post Wednesday 20th May 2026: Technical Outlook and Review first appeared on IC Your Trading Edge | Official Blog.

General Market Analysis – 20/05/26
430713 May 20, 2026 17:40 ICMarkets Market News
Stocks Hit Again on Inflation Fears – Dow down 0.65%
US equity markets extended their recent decline overnight as persistent inflation concerns continued to pressure global bond markets and further erode expectations of a Federal Reserve rate cut this year. Rising Treasury yields weighed heavily on risk sentiment throughout the session, with all three major US indices closing lower. The Dow Jones fell 0.65% to finish at 49,363, while the S&P 500 declined 0.67% to 7,353 and the Nasdaq underperformed again, sliding 0.84% to close at 25,870 as higher yields continued to weigh on growth and technology stocks.
US Treasury yields pushed sharply higher across the curve, reinforcing the market’s “higher for longer” interest rate outlook. The benchmark US 2-year yield rose 7.5 basis points to 4.119%, while the 10-year yield climbed 7.9 basis points to 4.666%. The move higher in yields helped support the US dollar, with the US Dollar Index advancing 0.12% to 99.31 against the major currencies.
Oil markets experienced another volatile trading session as investors attempted to assess the latest geopolitical developments in the Gulf region. Sentiment remained finely balanced between concerns over potential renewed US military action and hopes that diplomatic negotiations may still prevail. Brent crude eased 1.04% to settle at $110.94 per barrel, while WTI crude slipped 0.36% to $104.00.
Gold came under renewed selling pressure overnight, falling 1.84% to close at $4,482.61 an ounce as the combination of a stronger US dollar and higher Treasury yields reduced demand for the precious metal.
Bond Moves Driving Markets
US Treasury yields have risen sharply over the past week as stronger inflation data, higher oil prices, and ongoing geopolitical tensions forced markets to reassess expectations for Federal Reserve policy, and those moves have resonated around other products over the last few days. The US 10-year yield pushed toward 4.6%, while the 30-year yield climbed above 5% to its highest level since 2007, reflecting growing concerns that inflation will remain elevated for longer. As yields have moved higher, expectations for Fed rate cuts this year have been scaled back significantly, with markets now anticipating rates could remain elevated well into 2027. Traders are now preparing for more volatility in markets as the week moves on, with the dollar likely to push higher and stocks to move further south if yields remain elevated or drive higher still.
UK Data and Fed Minutes Ahead for Markets Today
Traders are expecting another busy day ahead, with geopolitical headlines likely to remain a key driver of market sentiment while some key data and central bank updates will provide some distraction. Asian markets are set to open on the back foot again after another tough day on Wall Street yesterday, and there is little on the calendar to distract them from overnight moves. The London session will see a focus on UK markets again when the CPI data (exp +3.0%) is released early in the day, with traders expecting plenty of volatility in the pound again around the event. The New York session is quiet again in the early part of the day, with just the Weekly Crude Oil Inventory data (exp -2.5 mio barrels) due on the data front. However, markets are expected to liven up towards the end of the day when the latest FOMC Meeting Minutes are released, which should provide further insight into the Federal Reserve’s policy outlook and the path for interest rates moving forward.
Explore all upcoming market events in the Economic Calendar.
The post General Market Analysis – 20/05/26 first appeared on IC Your Trading Edge | Official Blog.
IC Markets Global – Asia Fundamental Forecast | 20 May 2026
430712 May 20, 2026 17:40 ICMarkets Market News
IC Markets Global – Asia Fundamental Forecast | 20 May 2026
What happened in the U.S. session?
Markets were shaped by persistent inflation concerns, a neutral‑to‑hawkish Fed‑speaker tone, and an API‑reported crude draw that kept oil bid despite a near‑term easing of Iran‑strike risk; this mix pushed U.S. Treasury yields higher, underpinned the dollar, and weighed heaviest on tech and rate‑sensitive equities while keeping crude‑price‑linked instruments and energy‑sector stocks relatively supported.
What does it mean for the Asia Session?
Asian traders on May 20, 2026, face a binary day centered on Nvidia’s earnings after the U.S. close, which could drive an 8–10% move in the stock and ripple through Asia’s chip sector, particularly Taiwan and South Korea. Simultaneously, Middle East tensions remain the dominant macro driver: President Trump paused planned Iran strikes and signaled serious negotiations, causing oil to dip from peaks but still trade elevated at Brent ~$109/barrel, which continues to cap risk appetite across equity markets.
The Dollar Index (DXY)
Key news events today
FOMC Meeting Minutes(6:00 pm GMT)
What can we expect from DXY today?
The dollar today is being pulled in two directions: it still has support from firmer U.S. yields, resilient domestic data, and the prospect of a more cautious Fed, but gains are being restrained by better risk appetite after US-Iran negotiation headlines eased some safe-haven demand. For a trader, that means the near-term tone is still bullish-leaning but vulnerable to headline-driven pullbacks, especially if geopolitical tension eases further or if markets start to price out the Fed-hike risk.
Central Bank Notes:
- The Federal Open Market Committee (FOMC) is widely expected to hold the federal funds rate target range steady at 3.50%–3.75% at its April 28–29, 2026, meeting, as oil prices remain elevated around $108 per barrel for Brent crude amid ongoing US-Israel tensions with Iran, alongside surging inflation from energy shocks, further delaying any 2026 rate cuts potentially beyond September.
- The Committee continues to pursue maximum employment and 2% inflation goals, with the labor market showing mixed signals as nonfarm payrolls rose by 178,000 in March 2026—beating lowered expectations but driven partly by strike reversals—and the unemployment rate edged down to 4.3% from 4.4% in February.
- Officials face heightened risks from geopolitical tensions, soaring oil prices, and accelerating inflation, with CPI jumping to 3.3% year-over-year in March 2026 from 2.4% in February due to a 10.9% monthly energy surge, headline PCE pressured higher, and core PCE estimates around 3.1% or more.
- Economic activity continues to cool after robust Q4 2025 growth near 5%, with the Atlanta Fed GDPNow estimating Q1 2026 growth at 1.3% amid softer consumer spending, strike impacts, and labor data despite some resilience.
- March 2026’s Summary of Economic Projections forecasts 2026 unemployment at a median around 4.4%, GDP growth revised higher, and core PCE up to 2.7%, with the dot plot still signaling one cut in 2026 to a median 3.25%–3.50% funds rate amid softer labor but inflation upticks.
- The Committee maintains its data-dependent stance amid a mixed labor market, inflation well above target from oil shocks, and geopolitical risks, likely holding rates at 3.50%-3.75% with persistent divisions and hawkish tones on cuts.
- The FOMC continues its adjusted quantitative tightening, with Treasury rolloff caps at $5 billion per month and agency MBS at $35 billion per month to manage reserves amid post-2025 balance sheet adjustments.
- The next meeting is scheduled for 16 to 17 June 2026.
Next 24 Hours Bias
Medium Bullish
Gold (XAU)
Key news events today
FOMC Meeting Minutes(6:00 pm GMT)
What can we expect from Gold today?
Gold’s latest move is a pullback after a very strong run, with recent price action showing investors taking profits as risk appetite improves and the market searches for a new catalyst. At the same time, the metal is still supported by macro forces such as dollar weakness and investment demand, so the tone is more like consolidation than a clear trend reversal.
Next 24 Hours Bias
Weak Bearish
The Australian Dollar (AUD)
Key news events today
Monetary Policy Meeting Minutes (1:30 am GMT)
What can we expect from AUD today?
The Australian dollar is being pressured by weaker risk sentiment, while domestic policy expectations continue to provide a floor. Recent commentary suggests the RBA has kept its cash rate at 3.60% and emphasized that future decisions will depend on incoming data, while markets have at times priced in roughly even odds of a rate increase as soon as May 2026.
Central Bank Notes:
- The Reserve Bank of Australia (RBA) raised its cash rate by 25 basis points to 4.35% at the 5 May 2026 meeting, moving into a more restrictive stance as inflation pressures re‑accelerated and the board judged the previous 4.10% level insufficient to re‑anchor the medium‑term outlook.
- The RBA lifted the cash rate from 4.10% to 4.35% at the 5 May meeting in an 8–1 vote, flagging that the stance is now “more restrictive” and that the Council sees a low but non‑trivial chance of further hikes if inflation risks crystallise.
- Headline CPI has jumped to 4.6% year‑on‑year for the 12 months to March 2026, up from around 3.7% in February, with trimmed‑mean inflation still above 3.0% (about 3.3–3.8% depending on the series), keeping inflation clearly outside the 2–3% target band.
- Recent monthly indicators remain sticky in services, housing‑related costs, and discretionary spending, with January and March data showing only modest easing and some upside surprises in housing‑price‑related components, underpinning the case for a stronger‑than‑expected May hike.
- Global growth has been modestly revised up but remains tempered by ongoing geopolitical tensions, commodity‑price volatility, and elevated oil prices linked to the Middle East conflict, which directly feed into Australian import‑price and transport‑cost inflation.
- Markets now price the cash rate at 4.35% in June, with futures pathways suggesting a high‑probability hold at the June meeting and only a modest chance of another 25bp hike later in 2026, contingent on further upside in CPI or services‑price data.
- The RBA continues to emphasise its “data‑dependent” approach under the dual mandate, seeking to bring inflation back toward target without materially undershooting growth or employment, while acknowledging that the Middle East‑driven shock has shifted the path of inflation and policy.
- The May communication leaned hawkishly neutral to hawkish, with the decision to hike by 25bp and a run‑of‑material referencing rising inflation expectations and the risk of second‑round effects, while still leaving room for a pause in June if upcoming monthly CPI and labour‑force data show a moderating trend.
- The next meeting is on 15 to 16 June 2026.
Next 24 Hours Bias
Medium Bullish
The Kiwi Dollar (NZD)
Key news events today
No major news event
What can we expect from NZD today?
The New Zealand dollar recently traded around $0.594, holding near a two-week high despite geopolitical uncertainty from renewed US-Iran tensions in the Strait of Hormuz, which caused some volatility in early May 2026. While the currency has gained ground for two consecutive weeks, market expectations for Reserve Bank of New Zealand tightening have softened, with traders now pricing less than a 34% probability of a rate hike in May (down from over 60% previously), though a July increase remains fully priced in as rising energy costs fuel inflation concerns.
Central Bank Notes:
- The Reserve Bank of New Zealand’s (RBNZ) Monetary Policy Committee (MPC) is widely expected to hold the Official Cash Rate (OCR) steady at 2.25% at its 8 April 2026 Monetary Policy Review, aligning with unanimous market consensus from Reuters polls and previews.
- The MPC continues its data-dependent “wait-and-see” approach after February’s pause, balancing stimulus from prior 325-basis-point cuts against inflation’s path back to the 2% target, with readiness for gradual normalization only if the recovery strengthens or inflation exceeds forecasts.
- Headline CPI, last at 3.1%, is on track to re-enter the 1-3% band in Q2 2026 and hit 2% by mid-2027, aided by spare capacity, moderating wages, and softer food/fuel prices; two-year business inflation expectations have ticked up slightly to 2.37%.
- Household spending and housing remain subdued amid cautious consumption, low net migration, and labor market softness, though easing retail rates support budgets; high-frequency GDP indicators show steadying momentum in an early recovery phase.
- Accommodative borrowing costs from the low OCR are boosting mortgage approvals and sentiment, but business credit growth lags due to uneven confidence; overall stimulus persists below the 3% neutral rate.
- Risks are balanced, with a favorable global environment—including stronger dairy/meat exports and a softer NZ dollar—offsetting oil shocks and prior China/US trade worries; vigilance remains on second-round inflation effects.
- Forecasts point to potential OCR hikes starting late 2026 (e.g., December) or early 2027 to 2.50% by year-end if activity/inflation firms, but policy stays supportive if recovery unfolds gradually as expected.
- The next meeting is on 27 May 2026.
Next 24 Hours Bias
Medium Bearish
The Japanese Yen (JPY)
Key news events today
No major news event
What can we expect from JPY today?
Japanese yen is trading weakly near four‑decade lows versus the U.S. dollar, with USD/JPY around 158–159, after a brief rally. Post-intervention speculation faded, and broader differentials in interest rates and policy‑tightness favor the greenback; renewed verbal warnings from Japanese officials and the possibility of further under‑the‑radar intervention have failed to change the structural narrative of yen underperformance, leaving the currency vulnerable to further downside unless the Bank of Japan credibly steps up its hiking path or risk‑off flows suddenly favor safe‑haven JPY.
Central Bank Notes:
- The Policy Board of the Bank of Japan left the short‑term policy rate unchanged at 0.75% at the 27–28 April 2026 meeting, with markets broadly expecting the same level into May 2026 as the bank continues a data‑dependent, gradual‑normalisation stance.
- The BOJ targets the uncollateralized overnight call rate around 0.75%, signaling that any further hikes toward 1.0% will hinge on wage‑inflation persistence, yen stability, and real‑activity data rather than a pre‑announced timetable.
- JGB tapering continues on plan, with outright purchases trimmed by ¥400 billion quarterly through Q1 2026, then reduced to ¥200 billion from April onward, aiming for roughly ¥2–3 trillion in monthly net purchases by mid‑2026, adjustable if market or yen volatility spikes.
- Japan’s economy posts moderate growth into Q1 2026, supported by resilient exports and prior stimulus, but the BOJ has downgraded its 2026 growth outlook as external headwinds and Middle‑East‑related shocks weigh on the pace.
- Core CPI (ex‑fresh food) is running in the mid‑1% range y/y, with headline inflation at about 1.5% y/y in March 2026, while core‑core measures remain above 2%, reflecting sticky services‑side and wage‑driven inflation.
- Input‑cost pressures ease from prior peaks, yet services inflation, the 2026 shunto wage deals near 5%, and expectations anchored above 2% support continued price pressures, with upside risks from further yen weakness and geopolitical spikes.
- Near‑term real GDP may run below trend due to policy tightening and external shocks (e.g., Iran‑related energy risks), but negative real rates, wage gains, and targeted fiscal/capex support should underpin a gradual rebound in consumption and investment.
- Medium‑term, overseas recovery, labor‑shortage‑driven wage growth, and productivity improvements are expected to keep core inflation near or above 2%, enabling the BOJ to gradually lift rates toward 1.0% in 2026–2027 if activity and wage‑inflation conditions remain aligned.
- The next meeting is on 15 to 16 June 2026.
Next 24 Hours Bias
Weak Bearish
Oil
Key news events today
EIA Crude Oil Inventories (2:30 pm GMT)
What can we expect from Oil today?
Oil remains elevated because the market is balancing a severe supply disruption from the Middle East against slower normalizing production elsewhere. Brent and WTI have been volatile, but the dominant theme is still constrained supply, falling inventories, and ongoing geopolitical risk, which are keeping crude near the $100-plus area rather than letting it cool off.
Next 24 Hours Bias
Strong Bullish
The post IC Markets Global – Asia Fundamental Forecast | 20 May 2026 first appeared on IC Your Trading Edge | Official Blog.
Trade AUDUSD on the Australian Employment Data
430709 May 20, 2026 15:00 ICMarkets Market News
Australian dollar traders are preparing for more moves in the currency on Thursday morning as key employment numbers are delivered to the market. The data has been very volatile over the last several months with most surprises coming to the topside. The market is expecting to see an increase of 16.7k jobs in March with the Unemployment Rate remaining steady at 4.3% and any deviations from those expectations should see some moves in the currency which has looked particularly fragile in last week or so.
The AUDUSD has dropped over 2.5% since recording an annual high at the beginning of the month after the RBA raised rates as a resurgent dollar and increased global growth fears bought about by the continuing stalemate in the Middle East have led to some strong moves south. It has found some support around the 71-cent level but anything lower than expecting in the data, or a jump in the Unemployment Rate should see this recent trend continue with the next target the long-term trendline around 0.7000. Any thing stronger than expected should see a rally in the pair but in the current conditions expect rallies to be sold into anywhere near overnight highs under 0.7200.
Resistance 2: 0.7277 – 2026 High and Trendline Resistance
Resistance 1: 0.7200 – Previous Support Line
Support 1: 0.6995 – Trendline Support
Support 2: 0.6824 – Long Term Trendline Support
The accuracy, completeness and timeliness of the information contained on this site cannot be guaranteed. IC Markets Global does not warranty, guarantee or make any representations, or assume any liability regarding financial results based on the use of the information in the site.
News, views, opinions, recommendations and other information obtained from sources outside of www.icmarkets.com, used in this site are believed to be reliable, but we cannot guarantee their accuracy or completeness. All such information is subject to change at any time without notice. IC Markets Global assumes no responsibility for the content of any linked site.
The fact that such links may exist does not indicate approval or endorsement of any material contained on any linked site. IC Markets Global is not liable for any harm caused by the transmission, through accessing the services or information on this site, of a computer virus, or other computer code or programming device that might be used to access, delete, damage, disable, disrupt or otherwise impede in any manner, the operation of the site or of any user’s software, hardware, data or property.
The post Trade AUDUSD on the Australian Employment Data first appeared on IC Your Trading Edge | Official Blog.
Ex-Dividend 20/05/2026
430683 May 19, 2026 17:40 ICMarkets Market News
The post Ex-Dividend 20/05/2026 first appeared on IC Your Trading Edge | Official Blog.
Trade Cable on the FOMC Meeting Minutes
430680 May 19, 2026 16:40 ICMarkets Market News
This week’s FOMC Meeting Minutes release are shaping up to be one of the bigger trading opportunities for FX traders for the week. There is very little else in the way of tier 1 risk events for the US on the macroeconomic calendar and to add a bit more spice to proceedings the new Fed Chair Kevin Warsh is being sworn in on Friday. Extra focus will come on the minutes this week after strong inflation readings last week, the CPI data, which came in higher than expected at +3.8% y/y and the PPI number which also smashed expectations at +1.4% m/m, pushed US yields higher across the curve, pulling back hopes of a rate cut from the Fed this year and prompted many to start looking for hikes as the next move.
The last meeting resulting in the FOMC keeping rates on hold for the third consecutive meeting, something that was close to 100% priced in, however the fact that three members objected to including an easing bias in the statement caused some controversy and that will be the focus for many when the minutes come out this week. Anything indicating that the committee could be turning more hawkish, would likely see further appreciation for both yields and the dollar whilst anything indicating that there is still a strong dovish bias could see some corrections in recent moves.
Cable is again looking well set up from a technical perspective for a decent move on the back of the minutes release having found some support down near 1.3300 over the last couple of sessions. However, a strong hawkish indication from the minutes, or notes that the committee will be closely watching inflation data should see the dollar rally and Cable take a hit back towards those support levels. Anything more neutral and staying inline with the dovish bias, could see the dollar take a hit and Cable drive back higher.
Resistance 2: 1.3843 – Long Term Trendline Resistance
Resistance 1: 1.3658 – May High and Trendline Resistance
Support 1: 1.3300 – May Low and Trendline Support
Support 2: 1.3156 – 2026 Low
The accuracy, completeness and timeliness of the information contained on this site cannot be guaranteed. IC Markets Global does not warranty, guarantee or make any representations, or assume any liability regarding financial results based on the use of the information in the site.
News, views, opinions, recommendations and other information obtained from sources outside of www.icmarkets.com, used in this site are believed to be reliable, but we cannot guarantee their accuracy or completeness. All such information is subject to change at any time without notice. IC Markets Global assumes no responsibility for the content of any linked site.
The fact that such links may exist does not indicate approval or endorsement of any material contained on any linked site. IC Markets Global is not liable for any harm caused by the transmission, through accessing the services or information on this site, of a computer virus, or other computer code or programming device that might be used to access, delete, damage, disable, disrupt or otherwise impede in any manner, the operation of the site or of any user’s software, hardware, data or property.
The post Trade Cable on the FOMC Meeting Minutes first appeared on IC Your Trading Edge | Official Blog.
Tuesday 19th May 2026: Asia Markets Rise as Trump Delays Iran Strike, Oil Prices Ease
430678 May 19, 2026 15:00 ICMarkets Market News
Global Markets:
- Asian Stock Markets : Nikkei down 0.70%, Shanghai Composite up 0.02% Hang Seng up 0.20% ASX up 0.93%
- Commodities : Gold at $4,544.50 (-0.31%) Silver at $76.570 (-1.13%), Brent Oil at $109.98 (-1.97%), WTI Oil at $102.80 (-1.53%)
- Rates : US 10-year yield at 4.604, UK 10-year yield at 5.1090, Germany 10-year yield at 3.1614
News & Data:
- (EUR) Italian Trade Balance 4.71B to 5.25B expected
Markets Update:
Asia-Pacific markets opened mostly higher Tuesday as oil prices eased slightly after U.S. President Donald Trump postponed a planned military strike on Iran, calming investor concerns over an immediate escalation in the Middle East. Brent crude futures for July delivery fell 2.09% to $109.76 per barrel, while West Texas Intermediate crude slipped 0.75% to $107.84 per barrel. Despite the pullback, oil prices remained elevated as tensions in the region persisted.
Investors also focused on Japan’s first-quarter GDP data, which showed the economy expanded at an annualized 2.1%, beating Reuters estimates of 1.7% and improving from 1.3% in the previous quarter. However, analysts noted the figures did not fully reflect the impact of the Iran conflict that began in late February. Japan’s Nikkei 225 erased earlier gains to trade slightly lower, while the Topix rose 0.61%.
South Korea’s Kospi dropped 3.86% and the Kosdaq fell 3.40% ahead of a summit between Japanese Prime Minister Sanae Takaichi and South Korean President Lee Jae Myung. Australia’s S&P/ASX 200 climbed 0.89%, while Hong Kong’s Hang Seng gained 0.26%. Meanwhile, Standard Chartered shares rose after the bank raised its long-term return targets and announced workforce reductions.
Upcoming Events:
- 12:30 PM GMT – CAD CPI m/m
The post Tuesday 19th May 2026: Asia Markets Rise as Trump Delays Iran Strike, Oil Prices Ease first appeared on IC Your Trading Edge | Official Blog.
IC Markets Global – Europe Fundamental Forecast | 19 May 2026
430677 May 19, 2026 14:40 ICMarkets Market News
IC Markets Global – Europe Fundamental Forecast | 19 May 2026
What happened in the Asia session?
Today’s Asia session was dominated by weak Chinese economic data (industrial production and retail sales both missed sharply), Japan’s below-expected Q1 GDP, and escalating U.S.-Iran geopolitical tensions that sent oil prices surging over 7% and pushed the 10-year Treasury yield to 4.63%. The Australian dollar (AUD/USD) was hit hardest, falling on dovish RBA minutes and China’s slowdown, while the Chinese yuan (CNY/CNH) and Japanese yen (JPY) also weakened on growth concerns.
What does it mean for the Europe & US sessions?
Traders should start the European and U.S. sessions watching German PPI, UK employment and wage data, and euro‑area trade and inflation releases to gauge the inflation‑growth mix; in the U.S., the NAHB housing‑market index, mortgage‑related data, and Fed‑speaker commentary will be the primary drivers of intraday risk‑sentiment, and Treasury‑yield moves, all against a backdrop of elevated global inflation and G7‑level policy coordination chatter.
The Dollar Index (DXY)
Key news events today
Pending Home Sales m/m (2:00 pm GMT)
What can we expect from DXY today?
The US dollar is modestly weaker today, held back by softer US data and expectations that the Federal Reserve may limit further tightening, even as the currency stays relatively strong against many emerging‑market units. Ongoing inflation and geopolitical narratives are keeping the dollar sensitive to shifts in risk appetite and Fed communication.
Central Bank Notes:
- The Federal Open Market Committee (FOMC) is widely expected to hold the federal funds rate target range steady at 3.50%–3.75% at its April 28–29, 2026, meeting, as oil prices remain elevated around $108 per barrel for Brent crude amid ongoing US-Israel tensions with Iran, alongside surging inflation from energy shocks, further delaying any 2026 rate cuts potentially beyond September.
- The Committee continues to pursue maximum employment and 2% inflation goals, with the labor market showing mixed signals as nonfarm payrolls rose by 178,000 in March 2026—beating lowered expectations but driven partly by strike reversals—and the unemployment rate edged down to 4.3% from 4.4% in February.
- Officials face heightened risks from geopolitical tensions, soaring oil prices, and accelerating inflation, with CPI jumping to 3.3% year-over-year in March 2026 from 2.4% in February due to a 10.9% monthly energy surge, headline PCE pressured higher, and core PCE estimates around 3.1% or more.
- Economic activity continues to cool after robust Q4 2025 growth near 5%, with the Atlanta Fed GDPNow estimating Q1 2026 growth at 1.3% amid softer consumer spending, strike impacts, and labor data despite some resilience.
- March 2026’s Summary of Economic Projections forecasts 2026 unemployment at a median around 4.4%, GDP growth revised higher, and core PCE up to 2.7%, with the dot plot still signaling one cut in 2026 to a median 3.25%–3.50% funds rate amid softer labor but inflation upticks.
- The Committee maintains its data-dependent stance amid a mixed labor market, inflation well above target from oil shocks, and geopolitical risks, likely holding rates at 3.50%-3.75% with persistent divisions and hawkish tones on cuts.
- The FOMC continues its adjusted quantitative tightening, with Treasury rolloff caps at $5 billion per month and agency MBS at $35 billion per month to manage reserves amid post-2025 balance sheet adjustments.
- The FOMC continues its adjusted quantitative tightening, with Treasury rolloff caps at $5 billion per month and agency MBS at $35 billion per month to ensure ample reserves post-2025 program adjustments.
- The next meeting is scheduled for 16 to 17 June 2026.
Next 24 Hours Bias
Medium Bullish
Gold (XAU)
Key news events today
Pending Home Sales m/m (2:00 pm GMT)
What can we expect from Gold today?
On Tuesday, global gold remained strong and mixed across venues as safe-haven buying from geopolitical and macro uncertainty continued to support prices, with spot levels trading in the mid-four-thousand-dollar-per-ounce area after recent record highs earlier in 2026. Market commentary noted some profit‑taking and intraday retracement from recent peaks while analysts continued to point to upside risks from ongoing geopolitical tensions, inflation concerns, and central‑bank policy uncertainty that could keep gold well bid through the near term.
Next 24 Hours Bias
Weak Bearish
The Euro (EUR)
Key news events today
No major news event
What can we expect from EUR today?
Today’s euro-related news is dominated less by a single currency-market shock and more by policy and political developments across the EU that could affect the euro area’s outlook. The most notable items are legislative progress in the European Parliament and ongoing external risks, especially geopolitical tensions that can influence energy, trade, and investor sentiment across Europe.
Central Bank Notes:
- The Governing Council of the ECB is expected to keep the three key interest rates unchanged at its 28–29 May 2026 meeting, with the main refinancing rate near 2.15%, the marginal lending facility at 2.40%, and the deposit facility at 2.00%.
- Headline HICP inflation is likely to remain in the 2.0–2.3% range in the early months of 2026, with the March 2026 ECB staff baseline projecting an average of 2.6% for 2026, 2.0% for 2027, and 2.1% for 2028.
- The updated Eurosystem staff projections for 2026 paint a picture of persistent inflation overshoot, with headline inflation averages of around 2.6% in 2026, 2.0% in 2027, and 2.1% in 2028, compared with about 1.9–2.1% earlier outlooks.
- Real GDP growth is projected at about 0.9% in 2026, 1.3% in 2027, and 1.4% in 2028, implying around 0.2–0.3% quarter‑on‑quarter expansion in Q2 2026, consistent with the resilience observed at the end of 2025.
- The euro area unemployment rate is expected to stay near 6.4%, with strong labour‑force participation and modest wage pressures underpinning consumption resilience.
- The Governing Council continues to stress a meeting‑by‑meeting, data‑dependent approach, focusing on the path of inflation, the functioning of monetary‑policy transmission, and the impact of external shocks (geopolitical, energy, and trade‑policy related).
- Balance‑sheet normalization proceeds smoothly, with the APP and PEPP wind‑downs completed and the remaining stock of longer‑dated assets being allowed to run off without significant liquidity shortages.
The next meeting is on 10 to 11 June 2026
Next 24 Hours Bias
Weak Bearish
The Swiss Franc (CHF)
Key news events today
No major news event
What can we expect from CHF today?
The Swiss Franc remains the strongest performer among G10 currencies in 2026, reinforced by its role as the ultimate safe-haven asset amid geopolitical tensions and trade disruptions. Swiss companies expect the Franc to strengthen modestly further against the Euro (targeting ~0.91 by year-end) due to anticipated Euro weakness and global market volatility, though UBS economists project a slightly firmer Euro at 0.95.
Central Bank Notes:
- At its monetary policy assessment on 19 March 2026, the Swiss National Bank (SNB) is widely expected to leave the policy rate unchanged at 0%, continuing the extended pause since September 2025, as the Governing Board considers current settings adequate to keep inflation near the target without resorting to negative rates.
- Inflation data since December indicate persistent weakness, with headline CPI hovering around 0% year-on-year through early 2026 and core measures subdued at roughly 0.4%, underscoring limited price pressures and lingering, though contained, deflation risks.
- The SNB’s updated conditional inflation forecast shows minimal change from December, with averages of about 0.2% in 2025 (now complete), 0.3% in 2026, and 0.6% in 2027 under a steady 0% policy rate. However, recent flat CPI readings may slightly lower near-term expectations, preserving scope for further easing if needed.
- Global conditions remain challenging, marked by U.S. tariff escalations under President Trump, subdued external demand, and uncertainties in major export markets such as Europe and the U.S., prompting the SNB to exercise caution despite resilient Swiss domestic activity.
- Sentiment in manufacturing and export sectors stays soft amid franc appreciation and weaker foreign orders, squeezing margins. Yet, overall GDP growth is expected to be around 1.5% in 2026, with unemployment edging up modestly from historic lows.
- The SNB reaffirms its readiness to intervene via rate cuts or FX operations should deflationary pressures intensify, while emphasizing clear communication through detailed meeting minutes and coordination with global partners on currency matters.
The next meeting is on 18 June 2026.
Next 24 Hours Bias
Weak Bearish
The Pound (GBP)
Key news events today
Claimant Count Change (6:00 am GMT)
Average Earnings Index 3m/y (6:00 am GMT)
What can we expect from GBP today?
The British pound has been experiencing volatility in recent months, with sterling weakening in early April 2026 as the dollar stayed firm amid White House deadline concerns related to the U.S.-Iran conflict, with GBP/USD hovering near $1.3234. The pound has faced ongoing pressure from UK fiscal concerns, political uncertainty around Prime Minister Keir Starmer’s leadership, and doubts over labor market data showing unemployment rising to 5%.
Central Bank Notes:
- The Bank of England’s Monetary Policy Committee (MPC) met on 29 April 2026, maintaining the Bank Rate at 3.75 per cent, with the decision details published on 30 April 2026 alongside the quarterly Monetary Policy Report. This hold follows the unanimous 9-0 vote at the prior 18 March 2026 meeting, amid persistent energy shocks from the Middle East conflict overriding earlier cut expectations. No specific vote split for April has been detailed yet, but consensus previews indicate a hold.
- Quantitative tightening (QT) continues unchanged at the 2025 pace for gilt holdings reductions, supporting balance-sheet normalization while monitoring liquidity and maintaining restrictiveness against ongoing shocks.
- Headline CPI inflation rose to 3.3% in March 2026 from energy and motor fuel surges due to Middle East tensions, expected to stay between 3% and 3.5% through the summer, well above the 2% target. The April Monetary Policy Report outlines scenarios in which inflation peaks above 3.5% by the end of 2026 in the baseline, then eases below 2% in three years, or reaches 6%+ in adverse cases requiring tighter policy.
- UK growth outlook weakens further into Q2-Q3 2026 amid energy-driven cost pressures, rising unemployment risks, and softening confidence, with prior pay growth cooling now vulnerable to business pass-throughs.
- Global risks from the Middle East conflict persist, fueling energy/commodity volatility and sterling/gilt fluctuations; MPC views direct impacts as containable if demand slackens to curb secondary inflation effects.
- Inflation risks remain upward-biased due to energy persistence, potential wage embedding, and shock duration uncertainty, balanced against downside from economic slack and labor market softening.
- The MPC maintains a data-dependent stance, with policy still restrictive; the April Report provides fuller shock analysis, but no easing is signaled, yet members monitor for 2% sustainability, with Governor Bailey emphasizing vigilance.
- The next meeting is on 18 June 2026.
Next 24 Hours Bias
Weak Bullish
The Canadian Dollar (CAD)
Key news events today
CPI m/m (12:30 pm GMT)
Common CPI y/y (12:30 pm GMT)
Median CPI y/y (12:30 pm GMT)
Trimmed CPI y/y (12:30 pm GMT)
What can we expect from CAD today?
The Canadian dollar is under renewed pressure on Tuesday, slipping close to a one‑month low against the U.S. dollar as the greenback strengthens amid higher global bond yields and weaker risk appetite. This has extended the loonie’s recent losing streak, with markets focused on U.S. monetary‑policy expectations and geopolitical tensions rather than any major Canadian‑specific data released today, leaving the currency range‑bound near the 1.37–1.38 USD/CAD area.
Central Bank Notes:
- The Governing Council held the overnight rate target steady at 2.25% at its 28-29 April 2026 meeting, matching consensus expectations and prolonging the policy pause as inflation trends firmer toward target. The Bank highlighted lingering global headwinds from Middle East tensions and U.S. tariff escalations under Trump, but confirmed the stance continues fostering disinflation amid moderating energy volatility.
- U.S. trade frictions and geopolitical strains persist in dampening sentiment, yet Canadian manufacturing PMI strengthened further in expansion, driven by robust export orders tied to sustained energy demand. Goods exports, anchored by crude oil, maintained strength through March, countering subdued capex as businesses emphasize operational buffers over expansion.
- Economic growth extended into Q2 2026 at roughly 2.1% annualized, sustaining Q1’s momentum via resource shipments, public spending, and industrial recovery. March preliminary figures suggest resilient expansion, tempered slightly by seasonal factors and lingering supply disruptions.
- Services PMI rose deeper into expansion territory, with gains across tech, leisure, and professional services; consumer segments showed firmer footing from wage gains, despite elevated prices curbing non-essentials. The Bank views this breadth as signaling a balanced, sustainable upturn.
- National housing resales climbed modestly in March alongside stable prices, supported by steady rates and regional affordability pockets, as inventory accumulation in key markets avoids sharp imbalances. Policymakers expect gradual softening, underpinned by sound lending standards and consistent household dynamics.
- Headline CPI held near 2.0% year-over-year in March 2026 prints, within the target band, with core metrics like CPI-trim and median easing to around 2.5% on easing food, goods, and partial shelter relief. This bolsters confidence in inflation’s durable path to 2%.
- Officials affirmed 2.25% appropriately positions the economy for 2% inflation stability and orderly rebalancing, with cuts off the table absent growth or price setbacks. Focus shifts to Q2 momentum, core trends, and trade/geopolitical developments ahead of June.
- The next meeting is on 10 June 2026.
Next 24 Hours Bias
Medium Bullish
Oil
Key news events today
API Crude Oil Stock (8:30 pm GMT)
What can we expect from Oil today?
Oil prices fell today, with Brent crude dropping 2.63% to $109.15 per barrel after gaining ground earlier in the month amid Middle East tensions. This decline comes despite ongoing concerns about the prolonged closure of the Strait of Hormuz, which remains effectively shut and is severely disrupting global energy shipments. The broader market remains volatile as President Trump dismissed Iran’s latest peace proposal as “entirely unacceptable,” casting doubt on the ceasefire that has been on “life support” for ten weeks.
Next 24 Hours Bias
Strong Bullish
The post IC Markets Global – Europe Fundamental Forecast | 19 May 2026 first appeared on IC Your Trading Edge | Official Blog.
Tuesday 19th May 2026: Technical Outlook and Review
430659 May 19, 2026 14:40 ICMarkets Market News
DXY (U.S. Dollar Index):
Potential Direction: Bullish
Overall momentum of the chart: Bearish
Price could see a short-term pullback toward the pivot before rising again toward the 1st resistance.
Pivot: 98.54
Supporting reasons: Identified as a pullback support, where renewed buying pressure could emerge to push the price higher.
1st support: 98.25
Supporting reasons: Identified as a swing low support, indicating a potential area where the price could again stabilize.
1st resistance: 99.40
Supporting reasons: Identified as a swing high resistance, indicating a potential area that could halt any further upward movement
EUR/USD:
Potential Direction: Bearish
Overall momentum of the chart: Bullish
The price could see a short-term pullback toward the pivot before continuing its bearish move down toward the 1st support.
Pivot: 1.1676
Supporting reasons: Identified as a pullback resistance that aligns with the 38.2% FIbonacci retracement, where selling pressures could intensify and potentially cap any upward retracement.
1st support: 1.1610
Supporting reasons: Identified as a swing low support, indicating a potential level where the price could stabilize once again.
1st resistance: 1.1722
Supporting reasons: Identified as an overlap resistance that aligns with the 61.8% FIbonacci retracement, indicating a potential level that could cap further upward movement.
EUR/JPY:
Potential Direction: Bullish
Overall momentum of the chart: Bullish
The price has already bounced off the pivot and may continue its bullish move toward the 1st resistance
Pivot: 184.24
Supporting reasons: Identified as an overlap support, where renewed buying pressure could emerge to push the price higher.
1st support: 183.29
Supporting reasons: Identified as a pullback support, indicating a potential area where the price could again stabilize.
1st resistance: 186.25
Supporting reasons: Identified as a swing high resistance that aligns with the 78.6% FIbonacci retracement, indicating a potential level that could cap further upward movement.
EUR/GBP:
Potential Direction: Bullish
Overall momentum of the chart: Bullish
The price could see a short-term pullback toward the pivot before rising again toward the 1st resistance.
Pivot: 0.8674
Supporting reasons: Identified as a pullback support, where renewed buying pressure could emerge to push the price higher.
1st support: 0.8654
Supporting reasons: Identified as an overlap support, indicating a potential area where the price could stabilize once more.
1st resistance: 0.8705
Supporting reasons: Identified as a pullback resistance, indicating a potential level that could cap further upward movement.
GBP/USD:
Potential Direction: Bearish
Overall momentum of the chart: Bullish
The price could see a short-term pullback toward the pivot before continuing its bearish move down toward the 1st support.
Pivot: 1.3458
Supporting reasons: Identified as a pullback resistance that aligns with the 38.2% Fibonacci retracement, where selling pressures could intensify and potentially cap any upward retracement.
1st support: 1.3305
Supporting reasons: Identified as a swing low support, indicating a potential area where the price could stabilize once more.
1st resistance: 1.3547
Supporting reasons: Identified as an overlap resistance, indicating a potential level that could halt further upward movement.
GBP/JPY:
Potential Direction: Bearish
Overall momentum of the chart: Bullish
The price could see a short-term pullback toward the pivot before continuing its bearish move down toward the 1st support.
Pivot: 214.19
Supporting reasons: Identified as a pullback resistance that aligns with the 61.8% Fibonacci retracement, where selling pressures could intensify and potentially cap any upward retracement.
1st support: 211.30
Supporting reasons: Identified as a swing low support, indicating a potential level where the price could stabilize once more.
1st resistance: 215.12
Supporting reasons: Identified as a pullback resistance, indicating a potential level that could halt further upward movement.
USD/CHF:
Potential Direction: Bullish
Overall momentum of the chart: Bearish
Price could see a short-term pullback toward the pivot before rising again toward the 1st resistance.
Pivot: 0.7824
Supporting reasons: Identified as a pullback support, where renewed buying pressure could emerge to push the price higher.
1st support: 0.7795
Supporting reasons: Identified as a pullback support, indicating a potential level where the price could stabilize once again.
1st resistance: 0.7919
Supporting reasons: Identified as a swing high resistance, indicating a potential level that could cap further upward movement.
USD/JPY:
Potential Direction: Bullish
Overall momentum of the chart: Bullish
The price could see a short-term pullback toward the pivot before continuing its bearish move down toward the 1st support.
Pivot: 157.90
Supporting reasons: Identified as a pullback resistance, where selling pressures could intensify and potentially cap any upward retracement.
1st support: 156.94
Supporting reasons: Identified as an overlap support, indicating a strong area where buyers might return, and the price could stabilize once again.
1st resistance: 159.03
Supporting reasons: Identified as an overlap resistance. This level represents the next key area where upward movement could be capped amid increased selling pressure
USD/CAD:
Potential Direction: Bullish
Overall momentum of the chart: Bullish
The price could see a short-term pullback toward the pivot before continuing its bearish move down toward the 1st support.
Pivot: 1.3711
Supporting reasons: Identified as a pullback support, where renewed buying pressure could emerge to push the price higher.
1st support: 1.3664
Supporting reasons: Identified as an overlap support, indicating a key level where the price could stabilize once more.
1st resistance: 1.3811
Supporting reasons: Identified as a pullback resistance, making it a possible target for bullish advances and a level where some sellers could return to cap gains
AUD/USD:
Potential Direction: Bearish
Overall momentum of the chart: Bullish
The price could see a short-term pullback toward the pivot before continuing its bearish move down toward the 1st support.
Pivot: 0.7191
Supporting reasons: Identified as a pullback resistance that aligns with the 50% Fibonacci retracement, where selling pressures could intensify and potentially cap any upward retracement.
1st support: 0.7123
Supporting reasons: Identified as a swing low support, this area has provided strong support historically and may attract buying interest for a potential short-term bounce
1st resistance: 0.7258
Supporting reasons: Identified as a swing resistance, indicating a potential area that could halt any further upward movement.
NZD/USD
Potential Direction: Bearish
Overall momentum of the chart: Bullish
The price could see a short-term pullback toward the pivot before continuing its bearish move down toward the 1st support.
Pivot: 0.5888
Supporting reasons: Identified as a pullback resistance, where selling pressures could intensify and potentially cap any upward retracement.
1st support: 0.5815
Supporting reasons: Identified as a swing low support, this area has provided strong support historically and may attract buying interest for a potential short-term bounce
1st resistance: 0.5919
Supporting reasons: Identified as a pullback resistance, indicating a potential area that could halt any further upward movement.
US30 (DJIA):
Potential Direction: Bullish
Overall momentum of the chart: Bullish
The price could see a short-term pullback toward the pivot before continuing its bearish move down toward the 1st support.
Pivot: 49,799.35
Supporting reasons: Identified as a pullback resistance that aligns with the 61.8% Fibonacci retracement, where selling pressures could intensify and potentially cap any upward retracement.
1st support: 49,074.03
Supporting reasons: Identified as a swing low support, suggesting a potential area where the price could stabilize once again.
1st resistance: 50,205.12
Supporting reasons: Identified as a swing high resistance, indicating a potential area that could halt any further upward movement.
DE40 (DAX):
Potential Direction: Bearish
Overall momentum of the chart: Bullish
The price could see a short-term pullback toward the pivot before continuing its bearish move down toward the 1st support.
Pivot: 24,610.24
Supporting reasons: Identified as a pullback resistance that aligns with the 61.8% Fibonacci retracement, where selling pressures could intensify and potentially cap any upward retracement.
1st support: 23,665.17
Supporting reasons: Identified as a multi-swing low support, indicating a key level where the price could stabilize once more.
1st resistance: 25,051.24
Supporting reasons: Identified as a swing high resistance, indicating a potential area that could halt any further upward movement.
US500 (S&P 500):
Potential Direction: Bearish
Overall momentum of the chart: Bullish
The price could see a short-term pullback toward the pivot before continuing its bearish move down toward the 1st support.
Pivot: 7,424.58
Supporting reasons: Identified as a pullback resistance, where selling pressures could intensify and potentially cap any upward retracement.
1st support: 7,318.33
Supporting reasons: Identified as a swing low support, indicating a potential level where the price could stabilize once again.
1st resistance: 7,498.56
Supporting reasons: Identified as a swing high resistance, indicating a potential area that could halt any further upward movement.
BTC/USD (Bitcoin):
Potential Direction: Bearish
Overall momentum of the chart: Bearish
The price could see a short-term pullback toward the pivot before continuing its bearish move down toward the 1st support.
Pivot: 78,416.71
Supporting reasons: Identified as a pullback resistance, where selling pressures could intensify and potentially cap any upward retracement.
1st support: 75,437.47
Supporting reasons: Identified as a swing low support, indicating a potential level where the price could stabilize once more.
1st resistance: 80,071.05
Supporting reasons: Identified as a pullback resistance, indicating a potential area that could halt any further upward movement.
ETH/USD (Ethereum):
Potential Direction: Bearish
Overall momentum of the chart: Bullish
The price could see a short-term pullback toward the pivot before continuing its bearish move down toward the 1st support.
Pivot: 2,175.62
Supporting reasons: Identified as a pullback resistance, where selling pressures could intensify and potentially cap any upward retracement.
1st support: 2,083.10
Supporting reasons: Identified as a swing low support, indicating a potential level where the price could stabilize once more.
1st resistance: 2,236.80
Supporting reasons: Identified as a pullback resistance, indicating a potential area that could halt any further upward movement.
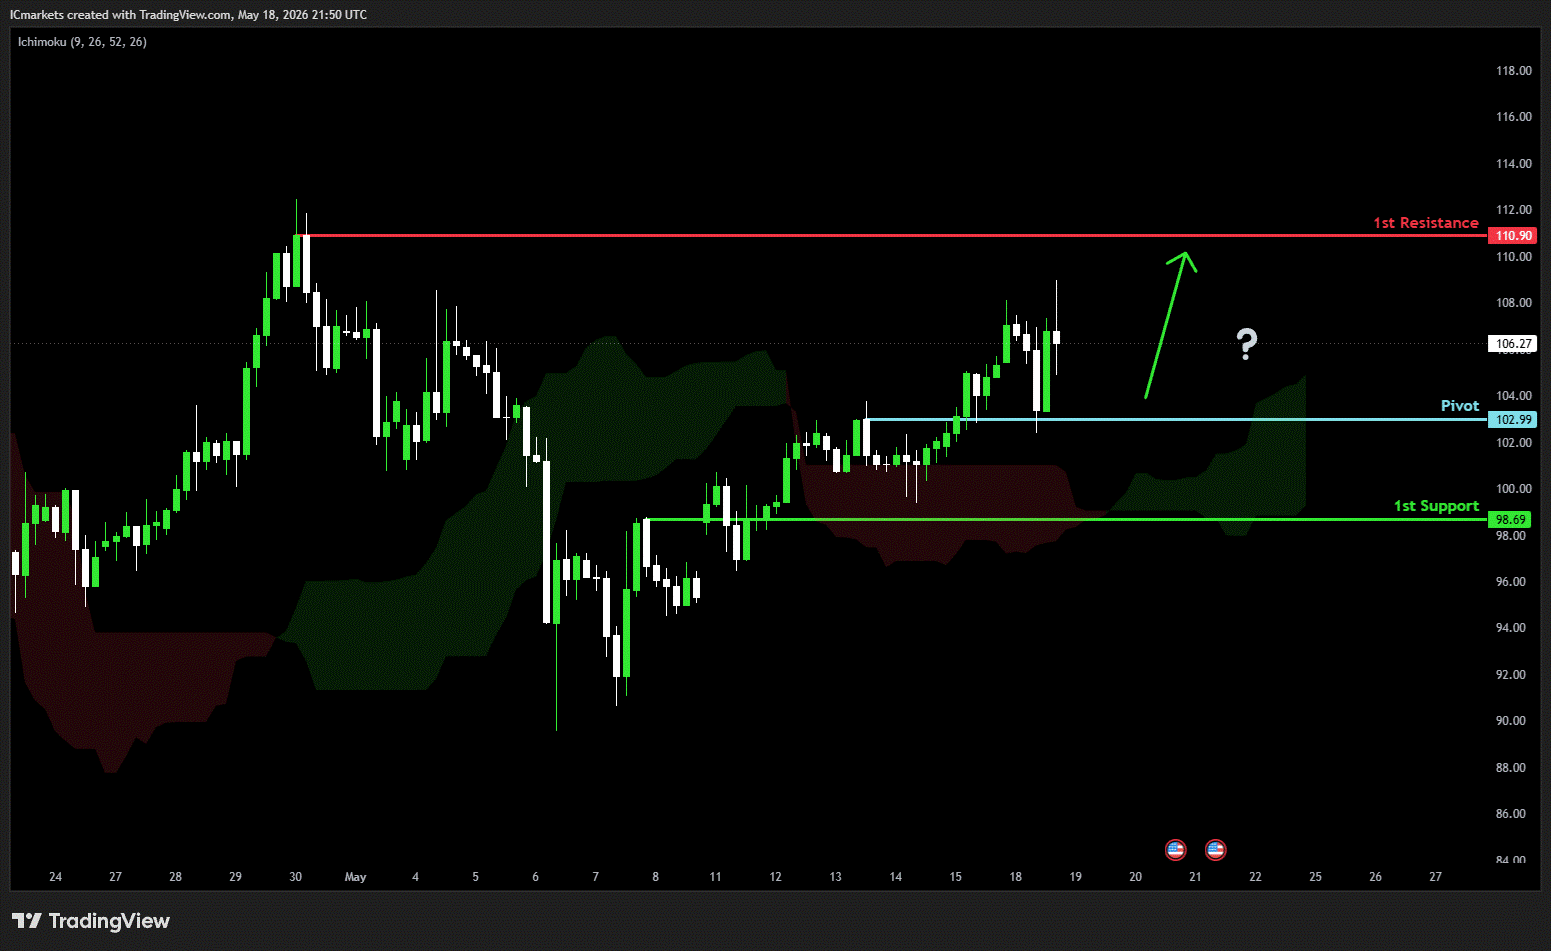
WTI/USD (Oil):
Potential Direction: Bullish
Overall momentum of the chart: Bullish
The price has already bounced off the pivot and may continue its bullish move toward the 1st resistance
Pivot: 102.99
Supporting reasons: Identified as an overlap support, where renewed buying pressure could emerge to push the price higher.
1st support: 98.69
Supporting reasons: Identified as a pullback support, indicating a key level where the price could stabilize once more.
1st resistance: 110.90
Supporting reasons: Identified as a swing high resistance, indicating a potential area that could halt any further upward movement.
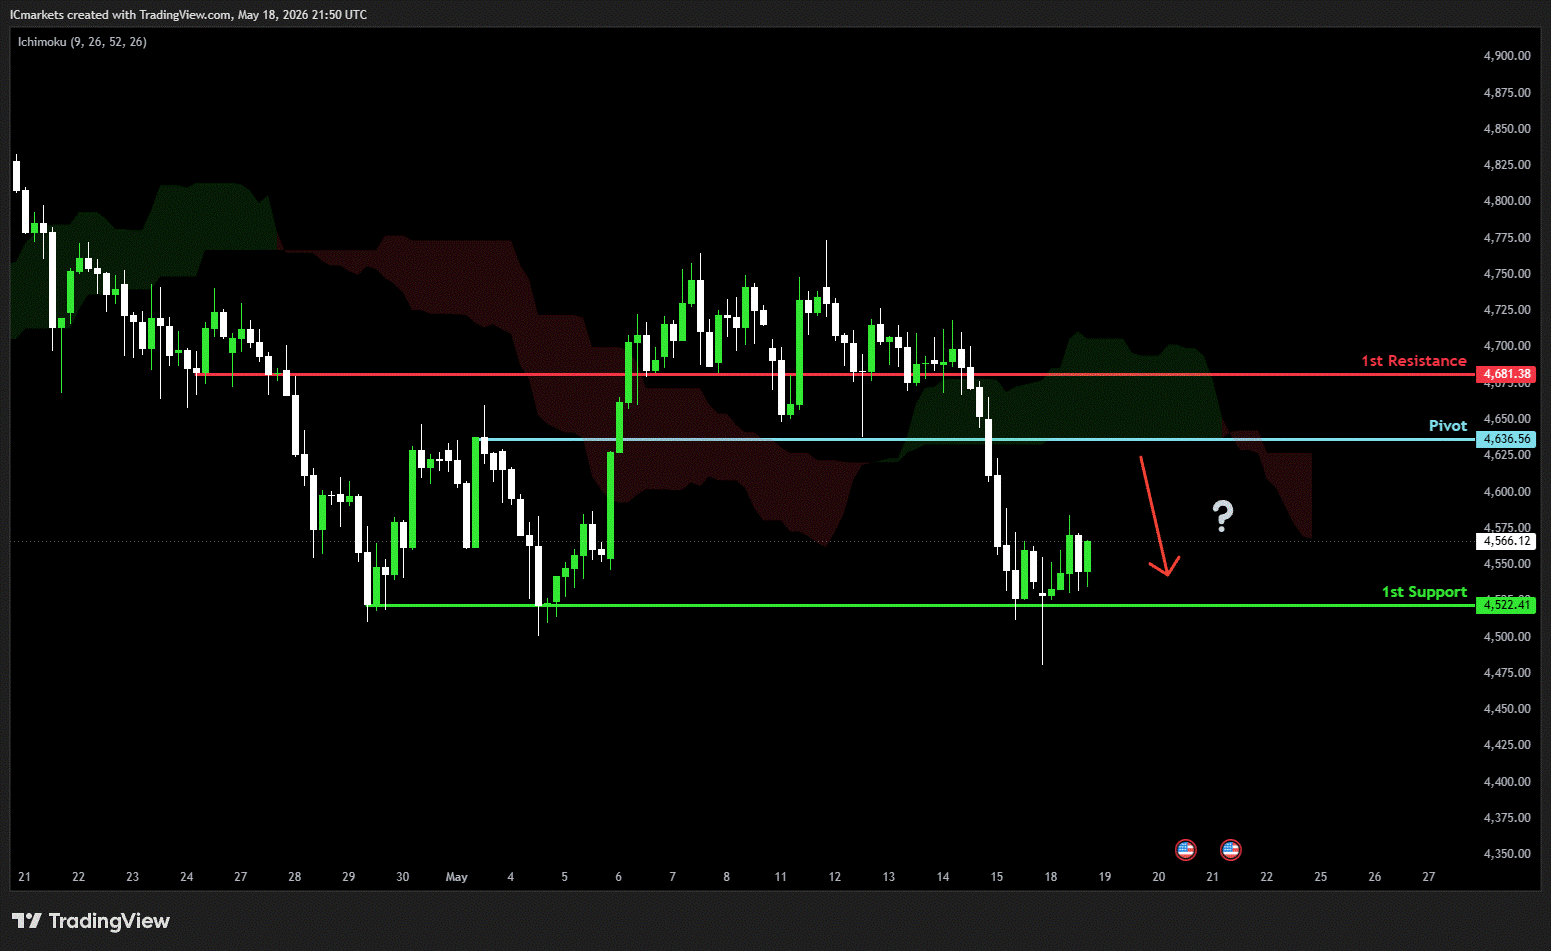
XAU/USD (GOLD):
Potential Direction: Bearish
Overall momentum of the chart: Bullish
The price could see a short-term pullback toward the pivot before continuing its bearish move down toward the 1st support
Pivot: 4,636.56
Supporting reasons: Identified as a pullback resistance, where selling pressures could intensify and potentially cap any upward retracement.
1st support: 4,522.41
Supporting reasons: Identified as a swing low support, indicating a key level where the price could stabilize once more.
1st resistance: 4,681.38
Supporting reasons: Identified as a pullback resistance, indicating a potential area that could halt any further upward movement.
The accuracy, completeness and timeliness of the information contained on this site cannot be guaranteed. IC Markets Global does not warranty, guarantee or make any representations, or assume any liability regarding financial results based on the use of the information in the site.
News, views, opinions, recommendations and other information obtained from sources outside of www.icmarkets.com, used in this site are believed to be reliable, but we cannot guarantee their accuracy or completeness. All such information is subject to change at any time without notice. IC Markets Global assumes no responsibility for the content of any linked site.
The fact that such links may exist does not indicate approval or endorsement of any material contained on any linked site. IC Markets Global is not liable for any harm caused by the transmission, through accessing the services or information on this site, of a computer virus, or other computer code or programming device that might be used to access, delete, damage, disable, disrupt or otherwise impede in any manner, the operation of the site or of any user’s software, hardware, data or property.
The post Tuesday 19th May 2026: Technical Outlook and Review first appeared on IC Your Trading Edge | Official Blog.
General Market Analysis – 19/05/26
430657 May 19, 2026 14:00 ICMarkets Market News
US Stocks Mixed as Trump Holds Off Attack – Nasdaq down 0.5%
US equity markets finished mixed overnight after President Trump indicated he would delay a planned strike on Iran to allow further negotiations to continue, helping ease immediate geopolitical tensions and steady broader market sentiment. The Dow Jones managed to outperform, rising 0.32% to close at 49,686, while weakness across the technology sector weighed on the broader indices. The S&P 500 slipped 0.07% to finish at 7,403, with the Nasdaq underperforming once again, falling 0.51% to close at 26,090.
US Treasury yields edged slightly lower across the curve, although both the 2-year and 10-year yields remain near recent highs as markets continue to assess the inflationary implications of elevated oil prices and ongoing geopolitical uncertainty. The US 2-year yield fell 2.5 basis points to 4.044%, while the benchmark 10-year yield eased 0.6 basis points to 4.587%. Despite the modest pullback in yields, investors remain cautious around the outlook for central bank policy should inflationary pressures persist.
The US dollar also softened against the majors following several sessions of strong gains, with the US Dollar Index declining 0.30% to 98.99 as traders reduced defensive positioning slightly after the easing in Middle East tensions.
Commodity markets remained volatile throughout the session. Oil prices initially surged to fresh monthly highs before giving back some gains later in the day as traders weighed the reduced immediate risk of supply disruption. Brent crude finished little changed, slipping 0.05% to settle at $109.19 per barrel, while WTI crude rose a further 1.75% to $107.51. Gold prices also pushed higher, with the precious metal gaining 0.58% to $4,566.67 as the dollar pulled back.
All Eyes Back on the Middle East
Global market headlines last week saw a brief divergence from the Middle East as President Trump and his delegation made their trip to China; however, focus is firmly back on the Iran-US conflict at the start of this trading week. News that fresh negotiations are taking place — delaying a planned US attack — led to a small recovery rally in some markets overnight, with major currencies in general gaining at the expense of the dollar as some haven flows receded. However, other markets are now treating these updates with a more ‘glass half empty’ approach as investors seek clarity on a reopening of the Strait of Hormuz. Expect more volatility in the sessions ahead today, but for now, it seems that oil prices will remain elevated and stocks vulnerable until we see confirmation, and then actual proof, that the Strait is back open and marine traffic is flowing again in significant numbers.
UK and Canadian Markets in Focus Later in the Trading Day
Attention in the coming sessions will remain firmly focused on developments out of the Middle East, although traders will also be closely monitoring several key economic releases today. In the Asian session, traders will watch the release of the RBA Monetary Policy Meeting Minutes for further insight into the central bank’s policy outlook, while, later in the day, key data out of both the UK and Canada should see volatility in local markets. The initial focus in the European session will be on UK markets, with key employment data due out. Claimant Count Change (exp +23.1k), Average Earnings Index (exp 3.8% 3m/y), and Unemployment Rate figures (exp 4.9%) will be released, with markets expecting to see moves in the pound around the event. Meanwhile, the North American session will feature Canadian CPI data (exp +0.7% m/m, +2.6% y/y) alongside US Pending Home Sales numbers (exp 1.0%).
Explore all upcoming market events in the Economic Calendar.
The post General Market Analysis – 19/05/26 first appeared on IC Your Trading Edge | Official Blog.
IC Markets Global – Asia Fundamental Forecast | 19 May 2026
430656 May 19, 2026 14:00 ICMarkets Market News
IC Markets Global – Asia Fundamental Forecast | 19 May 2026
What happened in the U.S. session?
Geopolitical escalation between the U.S. and Iran dominated market headlines, with President Trump issuing stark warnings that intensified fears of a broader Middle East conflict. This triggered a classic risk-off reaction: oil prices surged above $107 for WTI and $110 for Brent as traders priced in potential supply disruptions from the Strait of Hormuz, while equity markets tumbled with the Nasdaq leading declines at -1.54% due to its rate-sensitive tech exposure.
What does it mean for the Asia Session?
Asian traders should position for a session dominated by residual Middle‑East tension in oil and equities, alongside cautious positioning around global bond‑yield levels and a stream of regional data, including Japanese industrial‑output prints and Singapore‑dollar bill auctions; higher‑for‑longer rates and an energy‑driven slowdown in some Asia‑Pacific economies mean that risk‑on moves are likely to be selective and heavily tied to any news on Iran‑related supply‑risk or fresh guidance from major central banks.
The Dollar Index (DXY)
Key news events today
Pending Home Sales m/m (2:00 pm GMT)
What can we expect from DXY today?
The U.S. dollar is trading on a broadly firm tone today, Tuesday, extending gains after last week’s stronger‑than‑expected U.S. inflation data re‑ignited expectations of fewer near‑term Federal Reserve rate cuts and possibly even a hawkish repricing later in 2026. Against many majors, the greenback is hovering near one‑week highs on the DXY index, with yields on U.S. Treasuries holding just above recent levels, underpinning demand for dollar‑denominated assets.
Central Bank Notes:
- The Federal Open Market Committee (FOMC) is widely expected to hold the federal funds rate target range steady at 3.50%–3.75% at its April 28–29, 2026, meeting, as oil prices remain elevated around $108 per barrel for Brent crude amid ongoing US-Israel tensions with Iran, alongside surging inflation from energy shocks, further delaying any 2026 rate cuts potentially beyond September.
- The Committee continues to pursue maximum employment and 2% inflation goals, with the labor market showing mixed signals as nonfarm payrolls rose by 178,000 in March 2026—beating lowered expectations but driven partly by strike reversals—and the unemployment rate edged down to 4.3% from 4.4% in February.
- Officials face heightened risks from geopolitical tensions, soaring oil prices, and accelerating inflation, with CPI jumping to 3.3% year-over-year in March 2026 from 2.4% in February due to a 10.9% monthly energy surge, headline PCE pressured higher, and core PCE estimates around 3.1% or more.
- Economic activity continues to cool after robust Q4 2025 growth near 5%, with the Atlanta Fed GDPNow estimating Q1 2026 growth at 1.3% amid softer consumer spending, strike impacts, and labor data despite some resilience.
- March 2026’s Summary of Economic Projections forecasts 2026 unemployment at a median around 4.4%, GDP growth revised higher, and core PCE up to 2.7%, with the dot plot still signaling one cut in 2026 to a median 3.25%–3.50% funds rate amid softer labor but inflation upticks.
- The Committee maintains its data-dependent stance amid a mixed labor market, inflation well above target from oil shocks, and geopolitical risks, likely holding rates at 3.50%-3.75% with persistent divisions and hawkish tones on cuts.
- The FOMC continues its adjusted quantitative tightening, with Treasury rolloff caps at $5 billion per month and agency MBS at $35 billion per month to manage reserves amid post-2025 balance sheet adjustments.
- The next meeting is scheduled for 16 to 17 June 2026.
Next 24 Hours Bias
Medium Bullish
Gold (XAU)
Key news events today
Pending Home Sales m/m (2:00 pm GMT)
What can we expect from Gold today?
Gold on Tuesday is trading in the $4,540–$4,586 per ounce range, down slightly from Monday’s $4,585.65 but still significantly above pre-2026 levels after a dramatic 41% surge from May 2025 to May 2026. The metal has been volatile year-to-date, hitting an all-time high near $5,608 in late January on safe-haven buying from geopolitical risks and Trump’s tariff escalations, then crashing 17% in February on panic selling after Trump nominated Kevin Warsh for Fed chair.
Next 24 Hours Bias
Weak Bearish
The Australian Dollar (AUD)
Key news events today
Monetary Policy Meeting Minutes (1:30 am GMT)
What can we expect from AUD today?
The Australian dollar is trading near 0.708–0.710 versus the US dollar, consolidating after a recent rally toward four‑year highs fueled by solid commodity prices, a relatively hawkish Reserve Bank of Australia, and easing Middle East tensions. The currency remains one of the stronger G10 performers this year, underpinned by expectations of a wider‑than‑peers interest‑rate cushion and a still‑resilient outlook for China‑linked resource demand, while equity‑market stability and a modestly softer US dollar are preventing any sharp pull‑back today.
Central Bank Notes:
- The Reserve Bank of Australia (RBA) raised its cash rate by 25 basis points to 4.35% at the 5 May 2026 meeting, moving into a more restrictive stance as inflation pressures re‑accelerated and the board judged the previous 4.10% level insufficient to re‑anchor the medium‑term outlook.
- The RBA lifted the cash rate from 4.10% to 4.35% at the 5 May meeting in an 8–1 vote, flagging that the stance is now “more restrictive” and that the Council sees a low but non‑trivial chance of further hikes if inflation risks crystallise.
- Headline CPI has jumped to 4.6% year‑on‑year for the 12 months to March 2026, up from around 3.7% in February, with trimmed‑mean inflation still above 3.0% (about 3.3–3.8% depending on the series), keeping inflation clearly outside the 2–3% target band.
- Recent monthly indicators remain sticky in services, housing‑related costs, and discretionary spending, with January and March data showing only modest easing and some upside surprises in housing‑price‑related components, underpinning the case for a stronger‑than‑expected May hike.
- Global growth has been modestly revised up but remains tempered by ongoing geopolitical tensions, commodity‑price volatility, and elevated oil prices linked to the Middle East conflict, which directly feed into Australian import‑price and transport‑cost inflation.
- Markets now price the cash rate at 4.35% in June, with futures pathways suggesting a high‑probability hold at the June meeting and only a modest chance of another 25bp hike later in 2026, contingent on further upside in CPI or services‑price data.
- The RBA continues to emphasise its “data‑dependent” approach under the dual mandate, seeking to bring inflation back toward target without materially undershooting growth or employment, while acknowledging that the Middle East‑driven shock has shifted the path of inflation and policy.
- The May communication leaned hawkishly neutral to hawkish, with the decision to hike by 25bp and a run‑of‑material referencing rising inflation expectations and the risk of second‑round effects, while still leaving room for a pause in June if upcoming monthly CPI and labour‑force data show a moderating trend.
- The next meeting is on 15 to 16 June 2026.
Next 24 Hours Bias
Medium Bullish
The Kiwi Dollar (NZD)
Key news events today
No major news event
What can we expect from NZD today?
The New Zealand dollar is hovering around 0.5940–0.5950 against the US dollar, experiencing modest pressure after US inflation data came in hotter than expected at 3.8% year-over-year for April, which bolstered the greenback by reinforcing the Federal Reserve’s restrictive policy stance. Despite this headwind, the NZD has found some support from better-than-foreseen Chinese economic indicators, New Zealand’s largest trading partner, helping the currency hold above the late-April lows near 0.5930.
Central Bank Notes:
- The Reserve Bank of New Zealand’s (RBNZ) Monetary Policy Committee (MPC) is widely expected to hold the Official Cash Rate (OCR) steady at 2.25% at its 8 April 2026 Monetary Policy Review, aligning with unanimous market consensus from Reuters polls and previews.
- The MPC continues its data-dependent “wait-and-see” approach after February’s pause, balancing stimulus from prior 325-basis-point cuts against inflation’s path back to the 2% target, with readiness for gradual normalization only if the recovery strengthens or inflation exceeds forecasts.
- Headline CPI, last at 3.1%, is on track to re-enter the 1-3% band in Q2 2026 and hit 2% by mid-2027, aided by spare capacity, moderating wages, and softer food/fuel prices; two-year business inflation expectations have ticked up slightly to 2.37%.
- Household spending and housing remain subdued amid cautious consumption, low net migration, and labor market softness, though easing retail rates support budgets; high-frequency GDP indicators show steadying momentum in an early recovery phase.
- Accommodative borrowing costs from the low OCR are boosting mortgage approvals and sentiment, but business credit growth lags due to uneven confidence; overall stimulus persists below the 3% neutral rate.
- Risks are balanced, with a favorable global environment—including stronger dairy/meat exports and a softer NZ dollar—offsetting oil shocks and prior China/US trade worries; vigilance remains on second-round inflation effects.
- Forecasts point to potential OCR hikes starting late 2026 (e.g., December) or early 2027 to 2.50% by year-end if activity/inflation firms, but policy stays supportive if recovery unfolds gradually as expected.
- The next meeting is on 27 May 2026.
Next 24 Hours Bias
Medium Bearish
The Japanese Yen (JPY)
Key news events today
No major news event
What can we expect from JPY today?
The Japanese yen is trading modestly weaker against the US dollar around the mid‑158 area, after a sharp but short‑lived intervention‑driven rally in late April pushed the pair below 156. Persistent divergence in US and Japanese monetary‑policy expectations keeps the yen under pressure, with traders watching for another potential intervention trigger if USD/JPY approaches the 160 zone again.
Central Bank Notes:
- The Policy Board of the Bank of Japan left the short‑term policy rate unchanged at 0.75% at the 27–28 April 2026 meeting, with markets broadly expecting the same level into May 2026 as the bank continues a data‑dependent, gradual‑normalisation stance.
- The BOJ targets the uncollateralized overnight call rate around 0.75%, signaling that any further hikes toward 1.0% will hinge on wage‑inflation persistence, yen stability, and real‑activity data rather than a pre‑announced timetable.
- JGB tapering continues on plan, with outright purchases trimmed by ¥400 billion quarterly through Q1 2026, then reduced to ¥200 billion from April onward, aiming for roughly ¥2–3 trillion in monthly net purchases by mid‑2026, adjustable if market or yen volatility spikes.
- Japan’s economy posts moderate growth into Q1 2026, supported by resilient exports and prior stimulus, but the BOJ has downgraded its 2026 growth outlook as external headwinds and Middle‑East‑related shocks weigh on the pace.
- Core CPI (ex‑fresh food) is running in the mid‑1% range y/y, with headline inflation at about 1.5% y/y in March 2026, while core‑core measures remain above 2%, reflecting sticky services‑side and wage‑driven inflation.
- Input‑cost pressures ease from prior peaks, yet services inflation, the 2026 shunto wage deals near 5%, and expectations anchored above 2% support continued price pressures, with upside risks from further yen weakness and geopolitical spikes.
- Near‑term real GDP may run below trend due to policy tightening and external shocks (e.g., Iran‑related energy risks), but negative real rates, wage gains, and targeted fiscal/capex support should underpin a gradual rebound in consumption and investment.
- Medium‑term, overseas recovery, labor‑shortage‑driven wage growth, and productivity improvements are expected to keep core inflation near or above 2%, enabling the BOJ to gradually lift rates toward 1.0% in 2026–2027 if activity and wage‑inflation conditions remain aligned.
- The next meeting is on 15 to 16 June 2026.
Next 24 Hours Bias
Weak Bearish
Oil
Key news events today
API Crude Oil Stock (8:30 pm GMT)
What can we expect from Oil today?
Crude oil is trading higher on Tuesday, with Brent around the mid‑100s and WTI just above 100 dollars per barrel, as traders maintain a geopolitical risk premium tied to the fragile US–Iran ceasefire and the conditional openness of the Strait of Hormuz. Despite the ceasefire, global inventories have tightened to roughly 100 days of demand and are projected to drift lower, while prediction‑market participants still see meaningful upside risk if the conflict re‑escalates or shipping through Hormuz is disrupted again.
Next 24 Hours Bias
Strong Bullish
The post IC Markets Global – Asia Fundamental Forecast | 19 May 2026 first appeared on IC Your Trading Edge | Official Blog.
Ex-Dividend 19/05/2026
430632 May 18, 2026 17:40 ICMarkets Market News
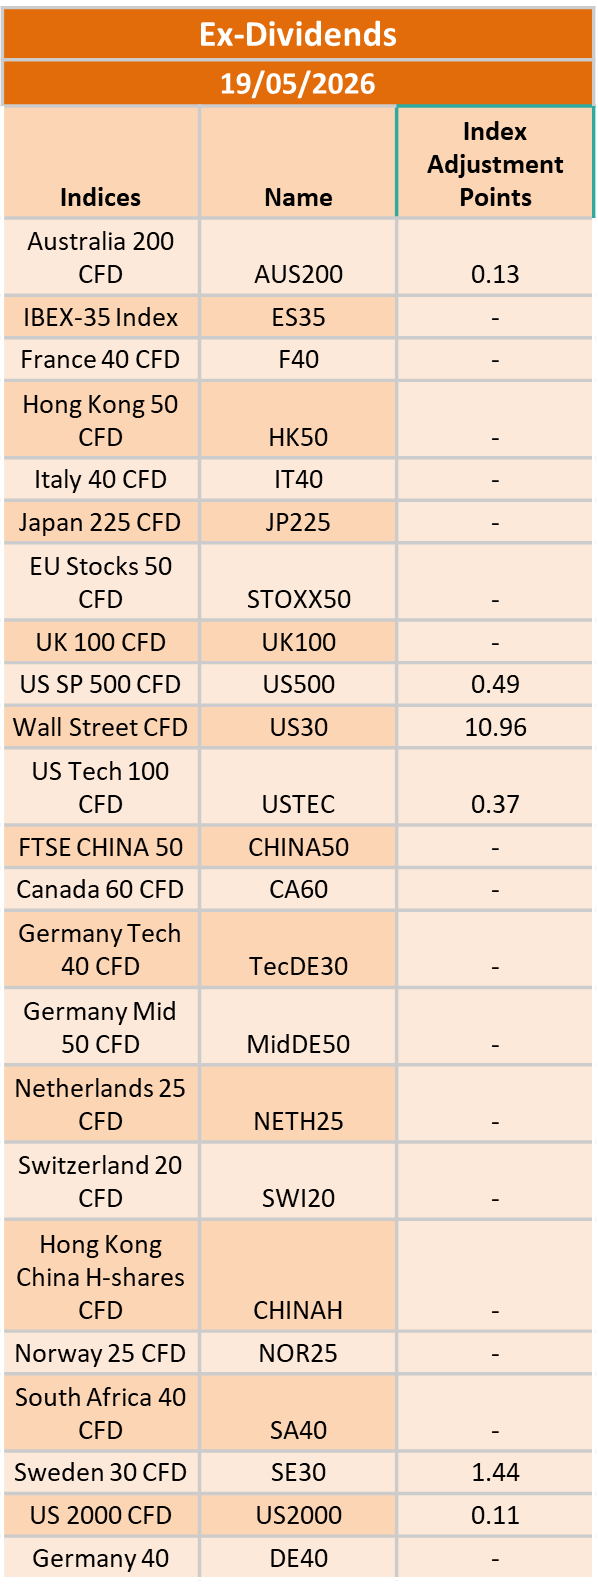
The post Ex-Dividend 19/05/2026 first appeared on IC Your Trading Edge | Official Blog.