Market News

Forex Market News .. collected from serval sources, all in one place for you to review.
[most entries here, will be auto-removed after 90 days]

US February trade balance -57.30 billion vs -61.00 billion expected

  • Prior -54.50 billion
  • Exports 314.8 billion vs 302.2 billion prior
  • Imports 372.1 billion vs 356.9 billion prior

The February increase in the goods and services deficit reflected an increase in the goods deficit of $2.5 billion to $84.6 billion and a decrease in the services surplus of $0.2 billion to $27.3 billion.Year-to-date, the goods and services deficit decreased $136.1 billion, or 54.8 percent, from the same period in 2025. Exports increased $62.6 billion or 11.3 percent. Imports decreased $73.5 billion or 9.2 percent.

The US International Trade in Goods and Services report, commonly known as the trade balance report, is a monthly economic indicator jointly released by the US Census Bureau and the Bureau of Economic Analysis. It measures…

Read source

Canada February trade balance -5.74B vs -2.25B expected

  • Prior was -3.65B (revised to -$4.18B)
  • Exports 66.31B vs 62.488B prior
  • Imports 72.05B vs 66.13B prior

Canada's merchandise trade activity increased sharply, with imports rising 8.4% and exports increasing 6.4%.

There were some big swings in gold that made this report look worse than it was. Excluding unwrought gold, silver, and platinum group metals, and their alloys—a product group largely composed of unwrought gold—imports rose 5.8%, while exports were up 5.5%.

The other thing skewing this data (and yesterday's Canadian data) was auto production shutdowns that extended into January then rebounded in February. As a result, imports of motor vehicle engines and motor vehicle parts rose +7.5%.

There is going to be a big improvement in March given…

Read source

US initial jobless claims 202K vs 212K estimate

The weekly initial and continuing claims shows:

  • Initial jobless claims 202K vs 212K estimate. Prior week revised to 211K from 210K
  • 4 week moving average of initial jobless claims 207.75K versus 210.75K last week.
  • Continuing claims 1.841M vs 1.839M estimate.
  • 4 week moving average of continuing claims 1.839M vs 1.846M last week.

The dominant theme is a "low-hire, low-fire" . The data reflects stability in the labor market amid a low-firing backdrop combined with slowing hiring.

Low claims don't mean the labor market is entirely healthy. Hiring can slow at the same time layoffs remain low, creating a market where people who have jobs keep them but people looking for work struggle to find new opportunities.

However this data is not reflective of a…

Read source

Iran claims to have targeted US-linked steel and aluminum facilities in the Gulf region

The comments are coming from the IRGC in saying that they have targeted US-linked steel and aluminum facilities in Gulf states. Adding that these strikes are just a "warning" for now. And if Iranian facilities and industries are hit again, the IRGC vows that "the next response will be more painful".

Despite what Trump claims about the war winding down, Iran certainly doesn't agree to that rhetoric. As mentioned earlier, there is still a lot of uncertainty up in the air.

The US may pull back and gradually wind down any military operations, but what about Israel? Besides that, Iran is not likely to stop hostilities especially when US ground troops are continuing to maintain presence around the region.

But more importantly for markets, all of…

Read source

US March Challenger layoffs 60.620k vs 48.307k prior
US-based employers announced 60,602 job cuts in March, some 25% higher than what was seen in February. That being said, it is down roughly 78% from the 275,240 cuts announced during the same month last year. But as you can remember, that owed much to Trump and Elon Musk's DOGE initiative at the time.

"Removing the wave of federal layoffs announced in February and March of last year, job cut announcements in 2026 are closely following the pattern of 2025. Last year it was government, retail, and technology. This year, it’s technology, transportation, and healthcare."

The tech sector continues to be the one leading layoffs, with another 18,720 job cuts in March. The total in the sector for 2026 is already at 52,050 layoffs year-to-date. That…

Read source

OPEC+ set to weigh further oil production increase on Sunday – report

The report says that OPEC+ is likely to weigh a further increase in oil production when the bloc convenes on Sunday. That so as to position themselves to add more barrels if and when the Strait of Hormuz reopens for business.

As a reminder, the bloc already agreed to a 206k bpd output boost for April when they met in March. That meeting was a bit of a tricky one with it having took place on 1 March, just as the US-Iran conflict broke out that very same weekend.

One of the sources is cited as saying that "we need to react, at least on paper" with another source saying that "the market requires every barrel that can be produced".

As things stand, only Saudi Arabia and the UAE has some meaningful means to bypass the Strait of Hormuz. But even…

Read source

Thursday 2nd April 2026: Technical Outlook and Review

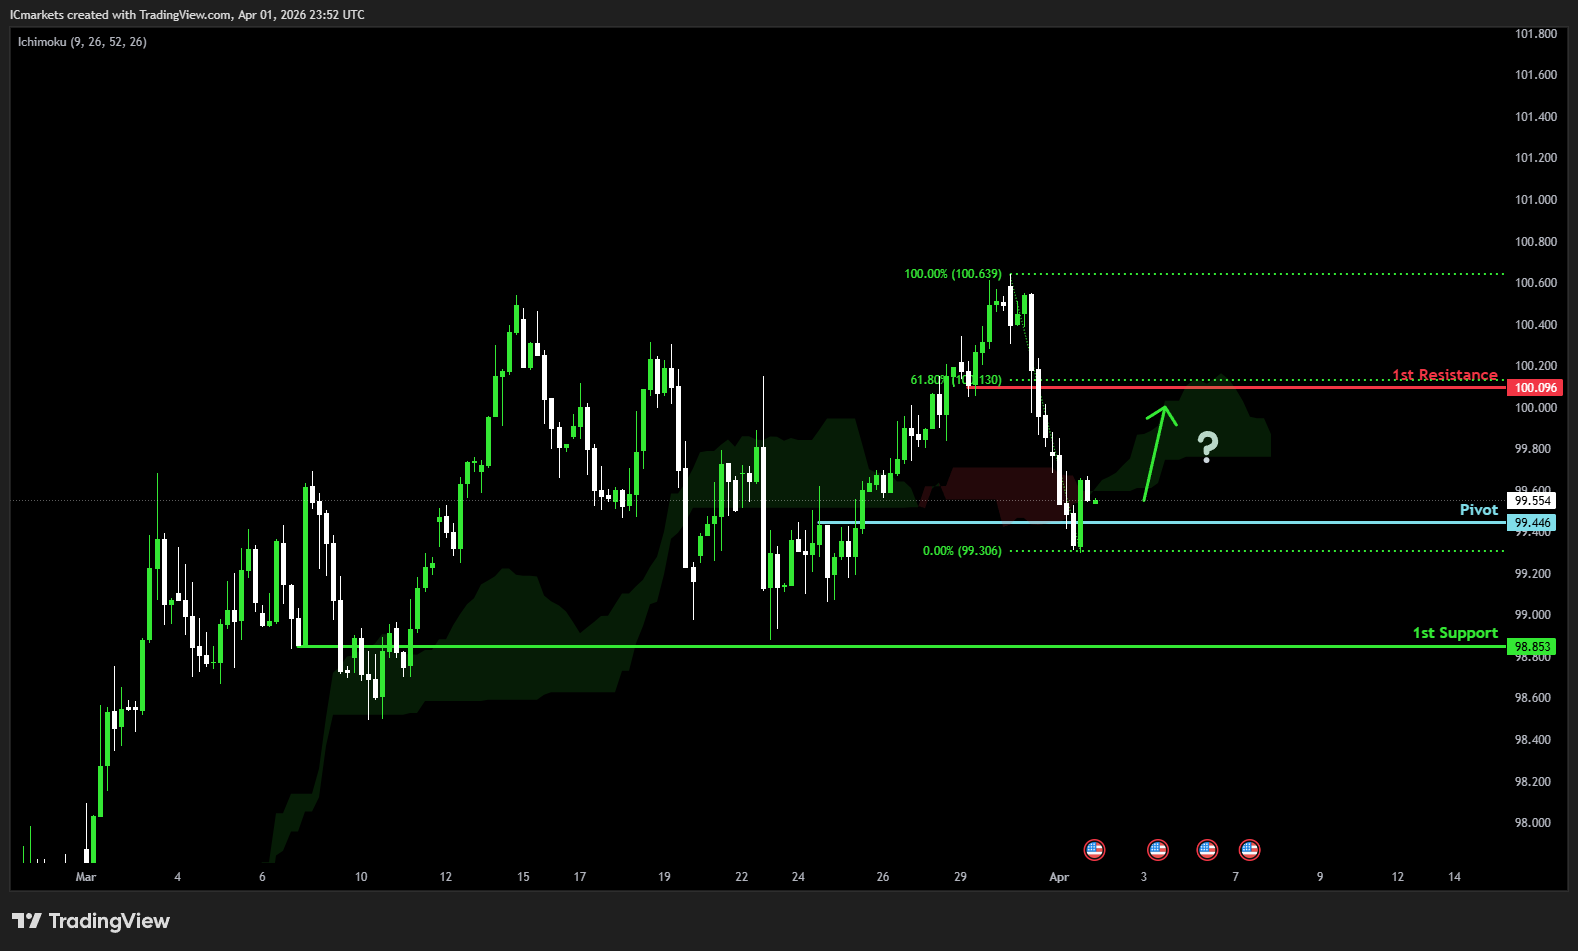
  DXY (U.S. Dollar Index):

Potential Direction: Bullish

Overall momentum of the chart: Bearish

The price could see a short-term pullback toward the pivot before rising again toward the 1st resistance.

Pivot: 99.44

Supporting reasons: Identified as a pullback support, where renewed buying pressure could emerge to push the price higher.

1st support: 98.85

Supporting reasons: Identified as a pullback support, indicating a potential area where the price could again stabilize.

1st resistance: 100.09
Supporting reasons: Identified as a pullback resistance that aligns with the 61.8% Fibonacci retracement, indicating a potential area that could halt any further upward movement

EUR/USD:

Potential Direction:…

Read source

IC Markets Global – Asia Fundamental Forecast | 02 April 2026

IC Markets Global – Asia Fundamental Forecast | 02 April 2026

What happened in the U.S. session?

Markets were primarily driven by renewed optimism that the U.S.–Iran conflict is nearing a de‑escalation phase, as President Trump signaled a near‑term withdrawal of forces and a possible “Hormuz‑off‑ramp,” which triggered a broad risk‑on move and pulled oil prices off their recent highs. This helped U.S. equities (especially the S&P 500 and Nasdaq) extend their strong rally, pushed Treasury yields lower amid rebuilt rate‑cut expectations, and most noticeably impacted oil futures and energy‑sensitive assets.

What does it mean for the Asia Session?

Renewed volatility around the Strait of Hormuz and energy markets, mixed China PMI data with…

Read source

IC Markets Global – Europe Fundamental Forecast | 02 April 2026

IC Markets Global – Europe Fundamental Forecast | 02 April 2026

What happened in the Asia session?

Today’s Asia‑session move centered on fading but still fragile US‑Iran escalation fears, which lifted regional equities after several days of war‑risk‑driven selling, while domestic macro signals, especially Japan’s tightening‑biased Tankan‑area narrative, kept the yen firm and curbed aggressive risk‑taking.

What does it mean for the Europe & US sessions?

Today’s actionable backdrop for traders is a mix of elevated macro riskdriven by Iran‑linked oil prices and “mild stagflation” warnings alongside still‑bullish but fragile European equity positioning and a U.S. market that is cautiously pricing slower‑than‑hoped rate cuts as inflation and…

Read source

General Market Analysis – 2/04/26

Markets Rally on Peace Hopes – Nasdaq up 1.16%

US equity markets pushed higher again in the latest session, extending the recent rally as optimism continued to build that the conflict in the Middle East may be approaching a resolution. The Dow Jones rose 0.48% to close at 46,565, while the S&P 500 gained 0.72% to finish at 6,575. The tech-heavy Nasdaqoutperformed, climbing 1.16% to settle at 21,840. In fixed income markets, US Treasury yields edged higher following stronger-than-expected ISM PMI data, which printed at its highest level since August 2022, highlighting ongoing resilience in the US economy. The 2-year yield rose 0.7 basis points to 3.800%, while the 10-year yield added 0.2 basis points to 4.319%. In currency markets, the…

Read source