Articles

AUD/CAD needs to extend gains above 0.9450/60 or downside risks will increase – Scotiabank
216623 March 31, 2022 21:17 FXStreet Market News
AUD/CAD rally rums out of momentum around 0.9450. The pair needs to extend its race higher above this region to enjoy further gains, economists at Scotiabank report.
AUD/CAD rally is starting to flag
“Choppier price action and waning bullish momentum suggest the AUD rally is starting to flag. A narrow range (so far) this week rather supports that impression.”
“AUD/CAD is still finding demand on short-term dips but will have to extend gains above 0.9450/60 sooner rather than later (by next week, we estimate) in order to extend gains or downside risks will increase for a test of support in the mid-0.92s (40-day MA).”
Full Article
CAD/MXN to drop towards 15.60 on a weekly close under major support at 15.89 – Scotiabank
216622 March 31, 2022 21:17 FXStreet Market News
CAD/MXN tests major weekly support at 15.89. A weekly close below here would open up additional losses to the 15.60 area, economists at Scotiabank report.
CAD/MXN to recover some ground on a weekly close above 15.89
“A weekly close below 15.89 should be enough to maintain pressure on the CAD in the near-term and drive the cross back to the 15.60 area – lows from the middle of last year.”
“If 15.89 holds through the close of the week, the CAD/MXN may be able to recover some ground but a move back above 16.20/25 is needed to confer any sort of near-term technical strength on this market.”
Full Article
EUR/CAD to alleviate downside pressure on a break past 1.4250 – Scotiabank
216621 March 31, 2022 21:12 FXStreet Market News
EUR/CAD has reached the 1.37 level. The pair may consolidate but downside risks remain, economists at Scotiabank report.
Minor EUR/CAD rallies are liable to attract better selling interest
“We could certainly see some consolidation in the EUR in the short run but absent a more significant rebound – back through 1.4250 – medium-term risks will remain geared towards low, or lower, levels prevailing.”
“A high close on the week may signal more short-term gains/consolidation but trend momentum oscillators are bearishly aligned across medium, long and very long-term timeframes, meaning minor EUR rallies are liable to attract better selling interest.”
Full Article
EUR/USD: Close above 1.11 needed to maintain the bullish tone – Scotiabank
216620 March 31, 2022 21:12 FXStreet Market News
EUR/USD has endured a correction, slipping from resistance at 1.1180 to below 1.11. Economists at Socitbank highlight that the world’s most popular currency pair needs to close above the 1.11 level to resume its gains.
EUR’s picture still looks positive
“Price action over Tue/Wed still leaves the EUR picture looking relatively positive, but a close above 1.11 may be needed to maintain the recently bullish tone.”
“The 50-day MA at 1.1180 will act as resistance alongside 1.1190/00.”
“Support is 1.1090/00 followed by 1.1070/75 and the mid-1.10s.”
Full Article
GBP/USD to suffer further weakness in the coming day on a dip below 1.31 – Scotiabank
216619 March 31, 2022 21:09 FXStreet Market News
GBP/USD holds unchanged in narrow trading. Economists at Scotiabank expect cable to move downward as there is little room to rebuild the Bank of England’s (BoE) expectations.
Break under 1.31 faces limited support until 1.3050/60
“With a quiet data and events calendar ahead meaning that there is little to rebuild BoE expectations on next week, we may see further GBP weakness in the coming day.”
“A resumption of bearish pressure that sees the GBP break under the 1.31 zone faces limited support until 1.3050/60, the Tuesday lows.”
“Resistance past yesterday’s peak of ~1.3180 is the 1.32 figure area.”
Full Article
Russia Central Bank Reserves $ down to $604.4B from previous $643.2B
216618 March 31, 2022 21:09 FXStreet Market News
Information on these pages contains forward-looking statements that involve risks and uncertainties. Markets and instruments profiled on this page are for informational purposes only and should not in any way come across as a recommendation to buy or sell in these assets. You should do your own thorough research before making any investment decisions. FXStreet does not in any way guarantee that this information is free from mistakes, errors, or material misstatements. It also does not guarantee that this information is of a timely nature. Investing in Open Markets involves a great deal of risk, including the loss of all or a portion of your investment, as well as emotional distress. All risks, losses and costs associated with investing, including total loss of principal, are your responsibility. The views and opinions expressed in this article are those of the authors and do not necessarily reflect the official policy or position of FXStreet nor its advertisers. The author will not be held responsible for information that is found at the end of links posted on this page.
If not otherwise explicitly mentioned in the body of the article, at the time of writing, the author has no position in any stock mentioned in this article and no business relationship with any company mentioned. The author has not received compensation for writing this article, other than from FXStreet.
FXStreet and the author do not provide personalized recommendations. The author makes no representations as to the accuracy, completeness, or suitability of this information. FXStreet and the author will not be liable for any errors, omissions or any losses, injuries or damages arising from this information and its display or use. Errors and omissions excepted.
The author and FXStreet are not registered investment advisors and nothing in this article is intended to be investment advice.
EUR/USD Forecast: Buying opportunity? Euro exits overbought territory, weak US data to trigger rise
216617 March 31, 2022 21:02 FXStreet Market News
- EUR/USD has been losing ground amid a souring market mood.
- Weak US data is set to trigger a breather in dollar gains.
- Thursday’s four-hour chart is painting a bullish picture.
One step down, now two steps up? EUR/USD has endured a much-needed correction, slipping from resistance at 1.1180 to below 1.11, and now it seems poised to resume its gains.
The US reported a worse-than-expected increase in jobless claims, 202,000, while Personal Income edged up by only 0.2% in February, worse than 0.5% projected.
Perhaps the greatest dollar downer is the Core Personal Consumption Expenditure (Core PCE) which came out at 5.4% YoY in February vs. 5.5% predicted. If inflation is not as hot as previously thought, perhaps there is no urge to raise rates fast? That seems to be thinking.
On the other side of the pond, inflation figures from Italy and France joined Germany and Spain in reporting elevated price gains. The eurozone inflation figures for March are due out on Friday.
Discussing economic figures in detail means that Russia’s war in Ukraine is not in the driver’s seat ~ at least not on Thursday. Russia seems to have somewhat reduced its shelling in the Kyiv region, but continues battling in full force in the east of the country.
Turkey insists on progress in negotiations, but the warring sides have yet to confirm it – and there is no ceasefire in sight. The fact that fighting continues is weighing on the euro, but the longer the war remains limited, the stronger the relief rally for the common currency.
All in all, EUR/USD has room to resume its gains.
EUR/USD Technical Analysis
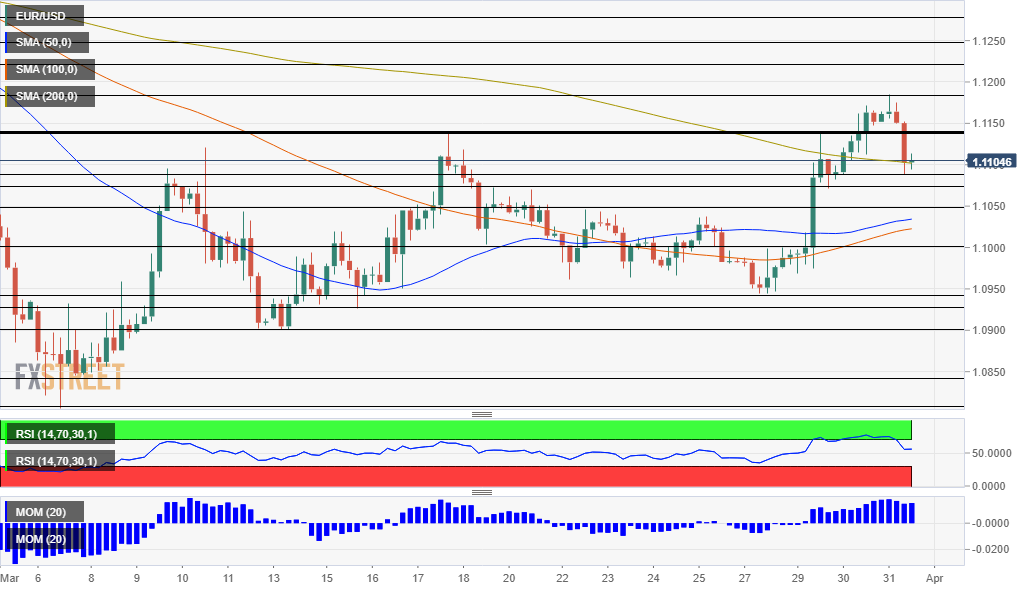
Euro/dollar has refused to drop below the 200 Simple Moving Average (SMA) on the four-hour chart, while momentum remains to the upside. As mentioned earlier, the RSI is below 70, thus outside overbought conditions. All conditions are in place for a fresh upswing.
The mid-March top of 1.1140 is the first resistance line, followed by the fresh top of 1.1180. It is followed by 1.1230 and 1.1250.
Support is at the daily low of 1.1085, followed by 1.1070 and 1.1050.
Full Article
USD/JPY remains on the defensive below 122.00 mark, moves little post-US macro data
216616 March 31, 2022 21:02 FXStreet Market News
- A combination of diverging forces failed to provide any impetus to USD/JPY on Thursday.
- Fading hopes for diplomacy in Ukraine underpinned the safe-haven JPY and capped gains.
- The emergence of aggressive USD buying extended support and helped limit the downside.
The USD/JPY pair seesawed between tepid gains/minor losses through the early North American session and held steady around the 121.80-121.85 region post-US macro data.
Speculations that authorities would intervene and respond to the recent sharp decline in the Japanese yen, along with fading hopes for diplomacy in Ukraine, acted as a headwind for the USD/JPY pair. Bearish traders further took cues from the ongoing decline in the US Treasury bond yields, though resurgent US dollar demand helped limit the downside for spot prices, at least for the time being.
Following the recent fall to a nearly two-week low, the USD made a solid comeback amid acceptance that the Fed would hike interest rates by 50 bps at the next two meetings to combat high inflation. The market bets were reaffirmed by Thursday’s release of the US Core PCE Price Index, which accelerated to a 5.4% YoY rate in February from the 5.2% reported in the previous month.
This, however, was slightly below consensus estimates pointing to a reading of 5.5%. Additional details revealed that Personal Spending decelerated sharply and rose 0.2% in February, though was offset by an upward revision of the previous month’s increase from 2.1% to 2.7%. Separately, the US Weekly Initial Jobless Claims also missed expectations and edged higher to 202K from 188K.
The mixed economic data did little to impress the USD bulls or provide any meaningful impetus to the USD/JPY pair. That said, it will still be prudent to wait for strong follow-through selling below the weekly low, around the 121.20-121.15 region, before positioning for an extension of this week’s sharp pullback from the highest level since August 2015, around the 125.10 region.
Thursday’s US economic docket also features the release of Chicago PMI, though is likely to pass unnoticed as the focus remains glued to developments surrounding the Russia-Ukraine saga. Apart from this, trades will take cues from the US bond yields, which will influence the USD price dynamics and produce some short-term opportunities around the USD/JPY pair.
Technical levels to watch
Full Article
US Dollar Index Price Analysis: Solid support emerges at 97.70
216615 March 31, 2022 20:56 FXStreet Market News
- DXY’s downside failed to break below the 97.70 region.
- Further recovery looks to regain 99.00 and above.
The index reclaims ground lost in the last couple of sessions and regains the area beyond 98.00 the figure on Thursday.
DXY manages well to rebound from the decent contention area in the 97.70 zone and the ongoing rebound is expected to target the 99.00 neighbourhood and above in the near term.
The current bullish stance in the index remains supported by the 6-month line near 96.20, while the longer-term outlook for the dollar is seen constructive while above the 200-day SMA at 94.83.
Full Article
Top 3 Price Prediction Bitcoin, Ethereum, Ripple: Crypto search for support with global markets on the back foot
216611 March 31, 2022 20:56 FXStreet Market News
- Bitcoin price stands to shed at least 3% of market value, dropping below $46,000.
- Ethereum price undergoes rejection and is set to fall back towards $3,000.
- XRP price traps bulls with bears on the cusp of performing a bull trap towards below $0.8000
Bitcoin price, Ethereum and other cryptocurrencies are currently just off the highs of March and looking solid on positive news and a breakthrough in the peace talks between Russia and Ukraine. But sentiment has shifted during the European session on Wednesday, following data showing inflation in some countries in the eurozone approaching double digits, and this has pulled markets’ attention back to the problem of rising price pressures. With EURUSD off the lows, and equity markets tanking, a significant tailwind that was helping cryptocurrencies could be set to fade and even turn into a headwind, as cold water is dampening any further beliefs of a truce or peace deal.
Bitcoin price underwent double rejection and is set to drop 3% as bears take control briefly
Bitcoin (BTC) price looks heavy as bulls could not maximise the relief rally on Tuesday. Instead, they got rejected twice against the 200-day Simple Moving Average (SMA) around $48,413.27 and even a close above the monthly R1 at $47,851.97 proved to be too much. With morale amongst bulls fading, expect to see more and more profit-taking that will trigger a spiral to the downside.
Thus, BTC price stands to look for support where bulls will need to step in not to let their rally be broken. Seeing the steepness of the move in the past few days, expect to see a decline back to either $45,261.84 or $44,088.73. Two levels that were already marked up in the past have proven they were a challenge to break above, so the current drop in price action would be a good test to see if they hold any support in return now.
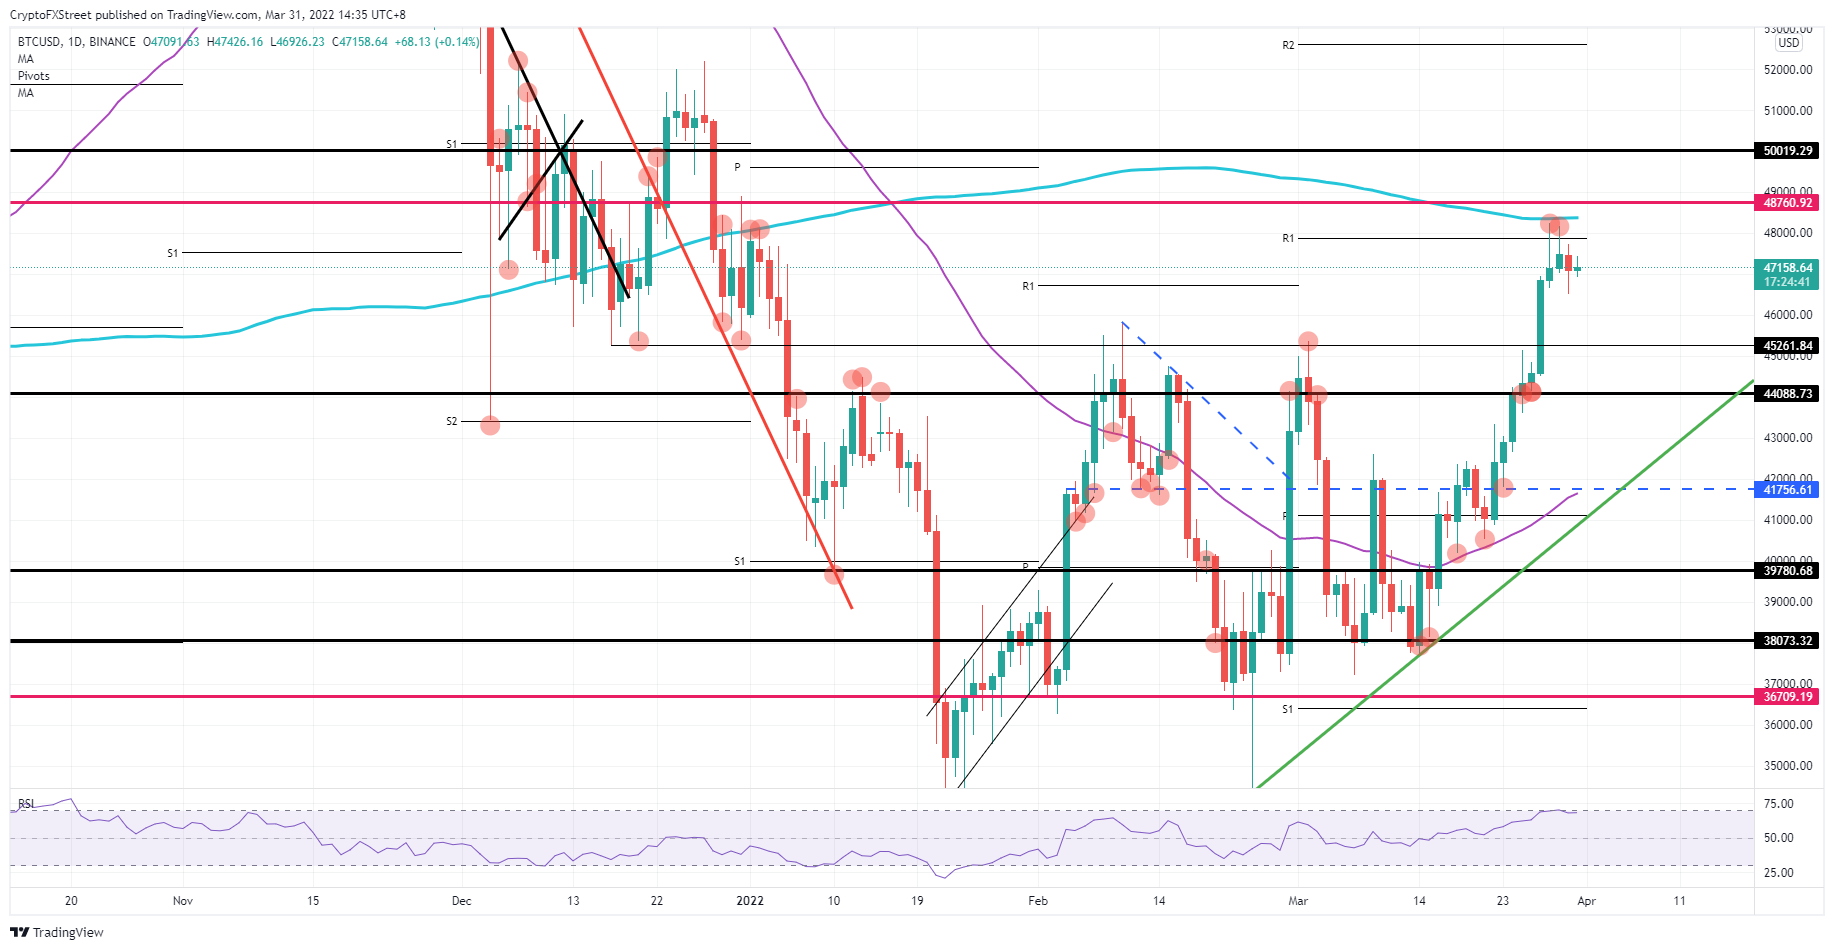
BTC/USD daily chart
As talks continue once again, market expectations are set to increase, and investors will want to see more guarantees than just a headline reading things are going to be fine. Bulls and investors will now probably only be prepared to jump in when a cease-fire is guaranteed and a solid, detailed deal is on the table. That could see the price jumping above $50,000 towards $50,0019.29 as bulls pierce through the 200-day SMA, and $48,760.92 is taken out.
Ethereum price hits curb at 200-day SMA and see bulls getting squeezed against the trend line
Ethereum (ETH) price was set for a steep trajectory towards $5,000.00, but instead, the past few hours have been proven to be a challenge for them as cold water was poured on global market sentiment. The ASIA PAC session indices tanked over 1% after the Nasdaq closed off yesterday with a similar loss. When one of the current technical supportive elements breaks, expect to see a flight to safe havens with investors pulling their money out of Ethereum price.
ETH price is still supported by $3,391.52, the monthly R1 resistance and the green ascending trend line – all three very close to one another. Expect to see pressure mounting further throughout the day, resulting in a break to the downside. When ETH price slips below the green ascending trend line, a drop of around 10% will be seen before bulls step in at around $3,018.55 – not only to defend the 3,000.00 psychological level but also to defend morale as a too-large correction would spook investors out of ETH.
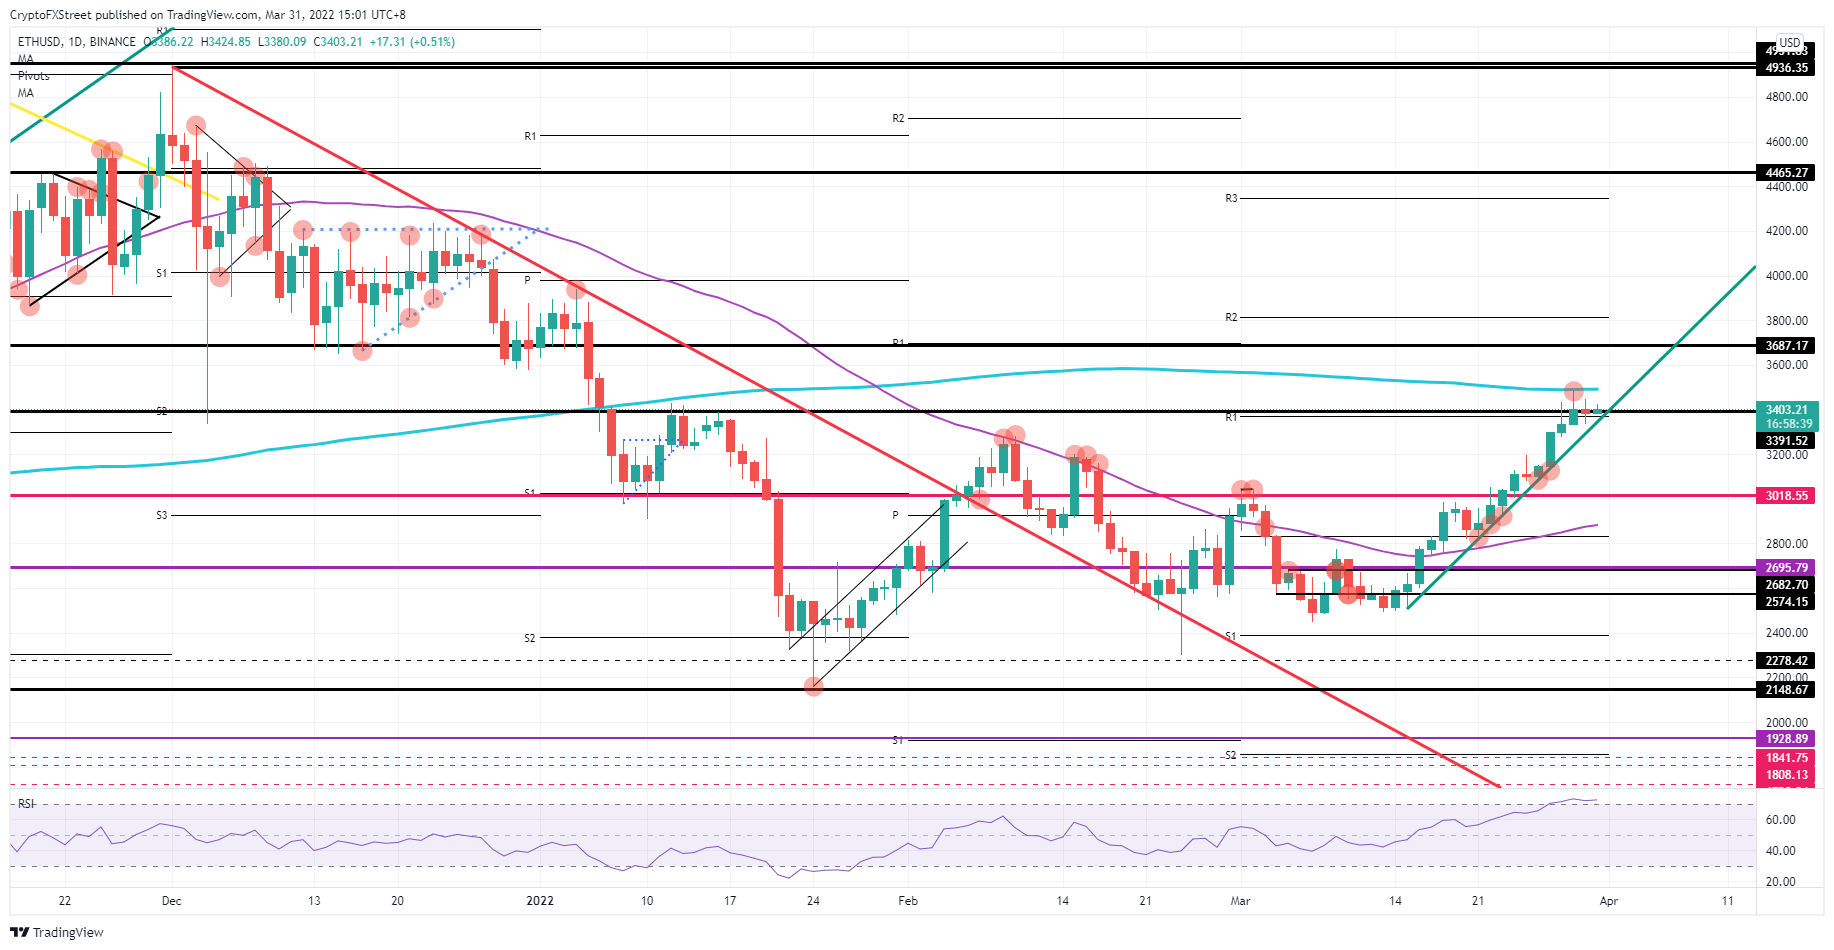
ETH/USD daily chart
A false break could see bulls rush in more quickly to defend the rally turning it into a bear trap. That would see an influx of more bulls and the price pop to $3,687.17 as the demand on the buy-side enlarges even further. With this move, the room is open for a rally up to $5,000.00 in the coming weeks.
XRP price undergoes consolidation as market sentiment shifts to risk-off
Ripple (XRP) price has bulls popping the champagne corks on Monday as the price pierced through the 200-day SMA above $0.90. That party got underway a bit too early as markets began to doubt if the news on Tuesday was an actual breakthrough, as opposed to a feign by Russia to enable a reshuffle in its military actions. Forty-eight hours later, it looks to be the latter as troops move towards the Donbass and promises to ease up on bombing and shelling have not been kept on the field.
XRP price keeps investors puzzled, which is reflected in the price action, with XRP price hovering between $0.8390 and $0.8791. From there, XRP price could still go either way, but seeing the reaction in the Nasdaq last night, and the drop in the Hang Seng and Topix this morning, expect to see XRP price moving to the downside. That would mean a break below $0.8390 and XRP price shedding value towards $0.7843, as no actual anchor points sit to the downside.
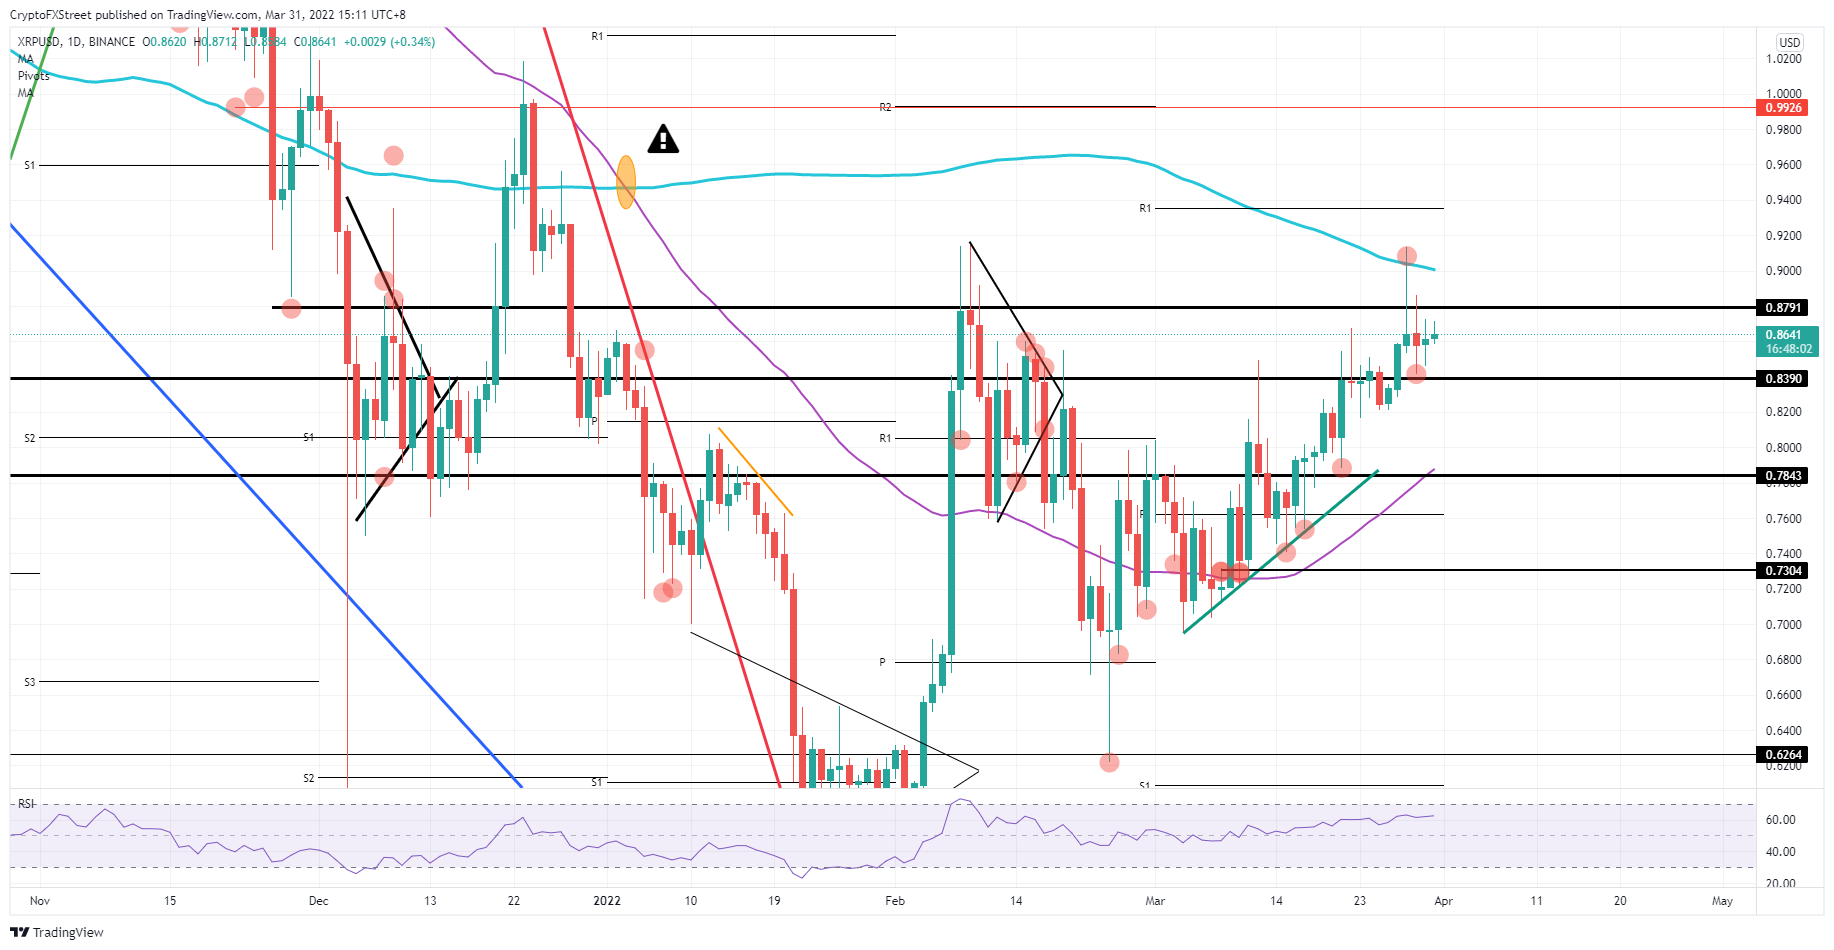
XRP/USD daily chart
As the price already rebounded once-off $0.8390, a second test could be proven the correct one and see bulls jumping into XRP price, ramping up price towards – and punching through $0.8791. The 200-day SMA is just a few inches away and could be broken to the upside as the dollar looks to be fading for a third straight day. That would see XRP strengthening all the way up towards $1.00.
Full Article
United States Personal Consumption Expenditures – Price Index (YoY) came in at 6.4% below forecasts (6.7%) in February
216610 March 31, 2022 20:45 FXStreet Market News
Information on these pages contains forward-looking statements that involve risks and uncertainties. Markets and instruments profiled on this page are for informational purposes only and should not in any way come across as a recommendation to buy or sell in these assets. You should do your own thorough research before making any investment decisions. FXStreet does not in any way guarantee that this information is free from mistakes, errors, or material misstatements. It also does not guarantee that this information is of a timely nature. Investing in Open Markets involves a great deal of risk, including the loss of all or a portion of your investment, as well as emotional distress. All risks, losses and costs associated with investing, including total loss of principal, are your responsibility. The views and opinions expressed in this article are those of the authors and do not necessarily reflect the official policy or position of FXStreet nor its advertisers. The author will not be held responsible for information that is found at the end of links posted on this page.
If not otherwise explicitly mentioned in the body of the article, at the time of writing, the author has no position in any stock mentioned in this article and no business relationship with any company mentioned. The author has not received compensation for writing this article, other than from FXStreet.
FXStreet and the author do not provide personalized recommendations. The author makes no representations as to the accuracy, completeness, or suitability of this information. FXStreet and the author will not be liable for any errors, omissions or any losses, injuries or damages arising from this information and its display or use. Errors and omissions excepted.
The author and FXStreet are not registered investment advisors and nothing in this article is intended to be investment advice.
US: Weekly Initial Jobless Claims rise to 202K vs. 197K expected
216609 March 31, 2022 20:45 FXStreet Market News
Information on these pages contains forward-looking statements that involve risks and uncertainties. Markets and instruments profiled on this page are for informational purposes only and should not in any way come across as a recommendation to buy or sell in these assets. You should do your own thorough research before making any investment decisions. FXStreet does not in any way guarantee that this information is free from mistakes, errors, or material misstatements. It also does not guarantee that this information is of a timely nature. Investing in Open Markets involves a great deal of risk, including the loss of all or a portion of your investment, as well as emotional distress. All risks, losses and costs associated with investing, including total loss of principal, are your responsibility. The views and opinions expressed in this article are those of the authors and do not necessarily reflect the official policy or position of FXStreet nor its advertisers. The author will not be held responsible for information that is found at the end of links posted on this page.
If not otherwise explicitly mentioned in the body of the article, at the time of writing, the author has no position in any stock mentioned in this article and no business relationship with any company mentioned. The author has not received compensation for writing this article, other than from FXStreet.
FXStreet and the author do not provide personalized recommendations. The author makes no representations as to the accuracy, completeness, or suitability of this information. FXStreet and the author will not be liable for any errors, omissions or any losses, injuries or damages arising from this information and its display or use. Errors and omissions excepted.
The author and FXStreet are not registered investment advisors and nothing in this article is intended to be investment advice.
Full Article