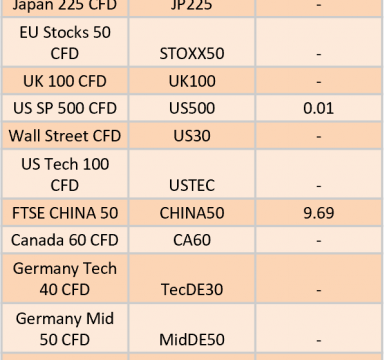
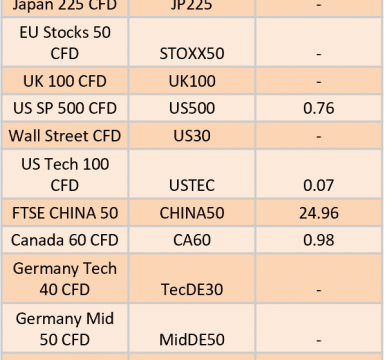
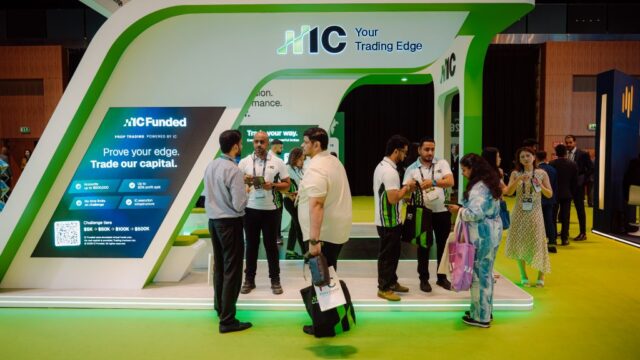
423902 November 26, 2025 17:14 ICMarkets Market News

The post Ex-Dividend 27/11/2025 first appeared on IC Markets | Official Blog.
423901 November 26, 2025 16:39 ICMarkets Market News
IC Markets Global – Asia Fundamental Forecast | 26 November 2025
What happened in the U.S. session?
During the U.S. session overnight, a significant rally in U.S. stock indices driven by renewed expectations of a Federal Reserve rate cut in December, supported by comments from Fed officials about rising labor market risks and a more accommodative policy stance. Major macroeconomic data releases included retail sales, producer price data for September, consumer confidence for November, and home price indices, with delayed releases due to the recent government shutdown.
What does it mean for the Asia Session?
RBNZ delivering a more hawkish message than expected could spark volatility in Antipodean currencies. Australia’s new monthly CPI format introduces uncertainty around data quality and interpretation. UK budget execution risk remains high given the fiscal constraints. The absence of US GDP data removes a key anchor for market expectations. Continued Fed dovish repricing supports risk assets and Asian equities. China property stimulus speculation could lift sentiment for property developers and domestically-focused stocks.
The Dollar Index (DXY)
Key news events today
Unemployment Claims (1:30 pm GMT)
Core Durable Goods Orders m/m (1:30 pm GMT)
Durable Goods Orders m/m (1:30 pm GMT)
CB Consumer Confidence (Tentative)
What can we expect from DXY today?
The US Dollar faces a pivotal trading day with the Dollar Index (DXY) hovering near the 100 level amid heightened expectations of a Federal Reserve rate cut in December. Key drivers include dovish Fed signals, important economic data releases (jobless claims, durable goods orders), and significant global events, including the RBNZ rate decision, UK Autumn Budget, and ECB Financial Stability Review. Markets are pricing approximately 75-81% probability of a 25 basis point rate cut at the December FOMC meeting, up sharply from around 42% just a week ago.
Central Bank Notes:
Next 24 Hours Bias
Medium Bullish
Gold (XAU)
Key news events today
Unemployment Claims (1:30 pm GMT)
Core Durable Goods Orders m/m (1:30 pm GMT)
Durable Goods Orders m/m (1:30 pm GMT)
CB Consumer Confidence (Tentative)
What can we expect from Gold today?
Gold is expected to range trade between $4,000 and $4,160-$4,200 in the near term, with the December Fed rate cut probability remaining the primary directional driver. A break above $4,200 with momentum could see gold retest October highs, while weak data surprising to the upside or hawkish Fed rhetoric could push prices toward the $3,950-$4,000 support zone. The combination of Wednesday’s data releases, Thanksgiving liquidity reduction, and ongoing geopolitical developments creates a potentially volatile environment for precious metals traders heading into month-end.
Next 24 Hours Bias
Medium Bearish
The Australian Dollar (AUD)
Key news events today
CPI y/y (12:30 am GMT)
What can we expect from AUD today?
The Australian dollar faces a pivotal session with the inaugural complete monthly CPI release taking center stage. A reading at or above 3.6% would reinforce expectations that the RBA will maintain its cautious, hold-steady approach, providing modest support for the currency. Conversely, a softer inflation print could revive rate cut speculation and push AUD/USD toward the lower end of its range near 0.6400. Traders should also monitor the RBNZ decision and US economic data for secondary catalysts throughout the session.
Central Bank Notes:
Next 24 Hours Bias
Medium Bearish
The Kiwi Dollar (NZD)
Key news events today
Official Cash Rate (1:00 am GMT)
RBNZ Monetary Policy Statement (1:00 am GMT)
RBNZ Rate Statement (1:00 am GMT)
RBNZ Press Conference (2:00 am GMT)
RBNZ Gov Hawkesby Speaks (8:10 pm GMT)
Retail Sales q/q (9:45 pm GMT)
What can we expect from NZD today?
Wednesday represents a pivotal moment for New Zealand’s monetary policy landscape. The widely expected 25 basis point rate cut to 2.25% will cap an unprecedented easing cycle that has delivered 325 basis points of cuts since August 2024. The decision comes as the New Zealand economy struggles with weak growth, elevated unemployment, and persistent inflation near the top of the target band.
The New Zealand dollar remains under pressure near seven-month lows around 0.5610, weighed down by aggressive RBNZ easing, monetary policy divergence with the US Federal Reserve, and broader global risk sentiment favoring the USD.
Central Bank Notes:
Next 24 Hours Bias
Medium Bearish
The Japanese Yen (JPY)
Key news events today
No major news events
What can we expect from JPY today?
The Japanese yen enters Wednesday at a critical juncture, trading around 156 per dollar after recovering slightly from 10-month lows. The currency faces conflicting pressures: downward pressure from PM Takaichi’s ¥21.3 trillion stimulus package and fiscal concerns, but upward support from intensifying intervention warnings and rising expectations for a December BoJ rate hike. Traders are positioning cautiously ahead of Tokyo CPI data on Thursday and watching the 158-160 zone as the likely intervention trigger.
Central Bank Notes:
Next 24 Hours Bias
Weak Bearish
Oil
Key news events today
EIA Crude Oil Inventories ( 2:30 pm GMT)
What can we expect from Oil today?
Crude oil prices have experienced significant downward pressure as markets head into Wednesday. WTI crude settled at approximately $57.72 per barrel while Brent crude dropped to around $62.15 per barrel on Tuesday, representing notable declines of 1.9% and 1.9% respectively. This marks oil’s lowest levels in approximately five weeks, with WTI down over 14% year-to-date and Brent falling roughly 12.5% from year-ago levels.
Next 24 Hours Bias
Medium Bearish
The post IC Markets Global – Asia Fundamental Forecast | 26 November 2025 first appeared on IC Markets | Official Blog.
423900 November 26, 2025 16:39 ICMarkets Market News
US Stocks Push Higher Again on Rate Cut Hopes – Dow up 1.4%
US stock indices pushed higher again overnight, marking a third consecutive day of gains as Fed rate-cut expectations continued to firm. The Dow led the move with a strong 1.43% rise to finish at 47,112, the S&P 500 gained 0.91%, closing at 6,765, while the Nasdaq added 0.67% to end the session at 23,025. The improving risk sentiment saw Treasury yields ease back further, with the 2-year yield falling 2.7 basis points to 3.45% and the 10-year slipping 3.1 basis points to close at 3.994%, comfortably below the key 4% level. The US dollar also weakened against the majors, the DXY falling 0.34% to 99.80. In commodities, oil prices extended their decline, with Brent dropping 1.20% to settle at $62.61 and WTI sliding 1.26% to $58.10, as optimism around potential progress in resolving the Russia–Ukraine conflict continued to weigh on prices. Gold eased slightly, dipping 0.14% to trade at $4,130.01 as it remained confined within its recent range.
Dollar Plays Catch Up with Fed Rates and Yields
The dollar at last played a bit of catch-up with both Fed rate-cut expectations and bond yields in trading yesterday as it fell against the majors, dropping just over 0.3% on the day. While estimates for a Fed rate cut have jumped from below 40% to above 85% in the last week, and the 10-year yield has dropped from well above 4.10% to under 4%, the dollar had remained resolutely strong, but yesterday’s trading saw the first dip against the majors. Traders are expecting more volatility in the sessions ahead today, with more data from the US due and Thanksgiving holiday trading conditions looming. However, some feel that the huge move in expectations may be overdone, with little really changed on the fundamentals except some updates from Fed officials, and that the FX market may be right to keep the greenback at relatively high levels.
Hectic Day on the Macroeconomic Calendar
It is shaping up to be a particularly busy session across global markets today, with key economic data, central bank decisions, and fiscal updates scheduled throughout the day. There is a heavy focus on antipodean markets in the Asian session today, with Australian CPI data (exp. +3.6% y/y) due out shortly before the Reserve Bank of New Zealand announces its latest rate call, where it is firmly expected to cut by 25 basis points. The London session will see the initial focus on the continent, with the ECB Stability Report due out early in the piece, before focus jumps across the channel to the UK for HM Treasury’s Autumn Forecast Statement. The New York session sees more data crammed in ahead of the Thanksgiving Day holiday, with the weekly unemployment claims numbers (exp. 226k), durable goods data (exp. +0.2% m/m, core +0.5% m/m), and Chicago update (exp. 43.9) all set for release. There were some rumours earlier in the week that we may see a delayed Core PCE Price Index release today, but that has failed to materialize.
The post General Market Analysis – 26/11/25 first appeared on IC Markets | Official Blog.
423898 November 26, 2025 16:14 ICMarkets Market News
Asian stock markets are trading sharply higher on Wednesday, extending Tuesday’s gains and taking strong cues from Wall Street. Renewed optimism about a possible US Federal Reserve rate cut in December—driven by softer US economic data and dovish remarks from Fed officials—has boosted sentiment across the region. Reports showed a steep drop in US consumer confidence for November and weaker-than-expected retail sales growth for September. According to CME Group’s FedWatch Tool, the probability of a quarter-point rate cut next month has surged to 82.7 percent from 50.1 percent a week earlier.
Australian shares are significantly higher, with the S&P/ASX 200 climbing above 8,600, supported by broad gains led by technology stocks, while gold miners lag. Major miners like Rio Tinto, BHP, and Fortescue are advancing, and tech names such as Block, Zip, and Appen are also posting strong gains. Banks are trading firmer as well. However, gold miners are mostly weak. In economic data, total construction work in Australia fell 0.7 percent in Q3, missing expectations.
Japan’s Nikkei 225 is surging more than 2 percent to above 49,600, with strong gains across exporters, financials, and tech firms. Major names including SoftBank, Panasonic, Sony, and major banks are all advancing.
Elsewhere in Asia, South Korea, Taiwan, Hong Kong, Singapore, and others are also higher. Wall Street finished strongly overnight, while European markets are also trading in positive territory. Crude oil prices, however, slipped on renewed Russia-Ukraine peace signals.
Upcoming Events:
The post Wednesday 26th November 2025: Asian Markets Rally on Fed Cut Optimism and Strong Global Cues first appeared on IC Markets | Official Blog.
423897 November 26, 2025 16:14 ICMarkets Market News
IC Markets Global – Europe Fundamental Forecast | 26 November 2025
What happened in the Asia session?
The Asia session was dominated by the divergence between Australian and New Zealand monetary policy expectations. Australia’s sticky inflation data reinforces the RBA’s cautious stance, while New Zealand’s slowing economy continues to warrant further RBNZ easing. The AUD/NZD cross benefited from this policy divergence, with potential for further upside if the RBNZ signals more cuts ahead. Global risk sentiment remained supported by increased confidence in a December Fed rate cut following dovish comments from Fed Governor Waller and San Francisco Fed’s Daly.
What does it mean for the Europe & US sessions?
With the US Thanksgiving holiday on Thursday and early market close on Friday, liquidity will thin considerably. Today represents the last full trading day with both European and US markets open simultaneously this week. Position sizing should account for potentially amplified moves in thin conditions. The outgoing interim governor’s press conference will provide final guidance before Anna Bremen takes over on December 1.
The Dollar Index (DXY)
Key news events today
Unemployment Claims (1:30 pm GMT)
Core Durable Goods Orders m/m (1:30 pm GMT)
Durable Goods Orders m/m (1:30 pm GMT)
CB Consumer Confidence (Tentative)
What can we expect from DXY today?
The US dollar is under pressure today, falling approximately 0.5% to trade near 99.75-99.80 on the Dollar Index (DXY) after a series of disappointing US economic data on Tuesday cemented expectations for a December Federal Reserve rate cut. Markets are now pricing in an 83% probability of a 25 basis point rate reduction at the December 9-10 FOMC meeting, up sharply from around 50% just a week ago. Today’s session features critical releases including US jobless claims, durable goods orders, and the Fed Beige Book, alongside major central bank decisions from the RBNZ and the UK Autumn Budget.
Central Bank Notes:
Next 24 Hours Bias
Weak Bullish
Gold (XAU)
Key news events today
Unemployment Claims (1:30 pm GMT)
Core Durable Goods Orders m/m (1:30 pm GMT)
Durable Goods Orders m/m (1:30 pm GMT)
CB Consumer Confidence (Tentative)
What can we expect from Gold today?
Gold enters Wednesday holding firm around $4,130–$4,140, supported by surging Fed rate cut expectations (now above 80% for December), weaker U.S. economic data, and ongoing geopolitical uncertainty surrounding the Russia-Ukraine conflict. Today’s U.S. durable goods orders and jobless claims data will be critical in shaping near-term price direction, with stronger-than-expected readings potentially capping gains while soft data could push gold toward the $4,155–$4,200 resistance zone.
Next 24 Hours Bias
Medium Bullish
The Euro (EUR)
Key news events today
ECB Financial Stability Review (9:00 am GMT)
ECB President Lagarde Speaks (5:00 am GMT)
Autumn Forecast Statement (12:30 pm GMT)
What can we expect from EUR today?
The Euro faces a mixed environment today: supportive factors include steady ECB policy, stable inflation near target, resilient services sector growth, and upgraded growth forecasts. Headwinds include manufacturing weakness, global trade uncertainty, and a relatively firm US dollar. Traders will closely watch Lagarde’s speech and the Financial Stability Review for any shifts in ECB guidance or risk assessment that could move the currency.
Central Bank Notes:
Next 24 Hours Bias
Weak Bearish
The Swiss Franc (CHF)
Key news events today
No major news event
What can we expect from CHF today?
The Swiss franc enters today’s session in a consolidating mode, with no major Swiss economic data releases scheduled. Market participants will focus on broader risk sentiment and developments from the US economic calendar, including unemployment claims and durable goods orders that may influence USD/CHF direction[attached image]. The RBNZ rate decision overnight and ECB President Lagarde’s speech later today could also indirectly impact CHF through euro cross-rate dynamics.
Central Bank Notes:
Next 24 Hours Bias
Weak Bearish
The Pound (GBP)
Key news events today
No major news event
What can we expect from GBP today?
The British pound faces a pivotal day with Chancellor Rachel Reeves delivering the Autumn Budget amid challenging economic conditions. Sterling is trading around 1.3100-1.3180 against the US dollar and near 1.1375 against the euro, with traders heavily positioned for downside through options markets.
The budget must address a £20-30 billion fiscal hole through tax increases while maintaining credibility with bond markets. UK inflation has cooled to 3.6% in October, raising expectations for an 80% probability of a Bank of England rate cut in December.
Central Bank Notes:
Next 24 Hours Bias
Weak Bearish
The Canadian Dollar (CAD)
Key news events today
No major news event
What can we expect from CAD today?
The Canadian dollar is experiencing a challenging period, trading near seven-month lows. Key factors weighing on the currency include: the Bank of Canada holding rates at 2.25% with signals that the easing cycle may be over; weak retail sales and modest economic growth projections (1.1–1.2%); soft oil prices removing a traditional support for the loonie; and ongoing U.S. tariff pressures despite President Trump quietly holding off on additional tariffs.
Central Bank Notes:
Next 24 Hours Bias
Medium Bearish
Oil
Key news events today
EIA Crude Oil Inventories ( 2:30 pm GMT)
What can we expect from Oil today?
Oil prices are trading near one-month lows as markets assess progress toward a Russia-Ukraine peace deal that could ease sanctions on Russian crude exports and add significant supply to an already oversupplied market. WTI
is hovering around $58 per barrel, while Brent is trading just above $62 per barrel. The dominant theme driving oil markets today is the combination of geopolitical de-escalation and bearish supply fundamentals expected through 2026.
Next 24 Hours Bias
Medium Bearish
The post IC Markets Global – Europe Fundamental Forecast | 26 November 2025 first appeared on IC Markets | Official Blog.
423883 November 26, 2025 16:00 ICMarkets Market News
Potential Direction: Bullish
Overall momentum of the chart: Bearish
The price could see a short-term pullback toward the pivot before rising again toward the 1st resistance.
Pivot: 99.54
Supporting reasons: Identified as a pullback support that aligns closely with the 61.8% Fibonacci retracement, where renewed buying pressure could emerge to push the price higher.
1st support: 99.29
Supporting reasons: Identified as an overlap support, indicating a potential area where the price could again stabilize.
1st resistance: 99.98
Supporting reasons: Identified as a pullback resistance, indicating a potential area that could halt any further upward movement

Potential Direction: Bearish
Overall momentum of the chart: Bearish
The price could see a short-term pullback toward the pivot before continuing its bearish move down toward the 1st support.
Pivot: 1.1581
Supporting reasons: Identified as an overlap resistance, where selling pressures could intensify and potentially cap any upward retracement.
1st support: 1.1539
Supporting reasons: Identified as a pullback support, indicating a potential level where the price could stabilize once again.
1st resistance: 1.1623
Supporting reasons: Identified as a pullback resistance, indicating a potential level that could cap further upward movement.

Potential Direction: Bullish
Overall momentum of the chart: Bullish
The price could see a short-term pullback toward the pivot before rising again toward the 1st resistance.
Pivot: 179.93
Supporting reasons: Identified as a pullback support, where renewed buying pressure could emerge to push the price higher.
1st support: 178.67
Supporting reasons: Identified as a pullback support that aligns with the 50% Fibonacci retracement, indicating a potential area where the price could again stabilize.
1st resistance: 181.69
Supporting reasons: Identified as a swing high resistance, indicating a potential level that could cap further upward movement.

Potential Direction: Bearish
Overall momentum of the chart: Bullish
The price has already reacted off the pivot and may continue its bearish move toward the 1st support
Pivot: 0.8799
Supporting reasons: Identified as an overlap resistance, where selling pressures could intensify and potentially cap any upward retracement
1st support: 0.8751
Supporting reasons: Identified as an overlap support, indicating a potential area where the price could stabilize once more.
1st resistance: 0.8865
Supporting reasons: Identified as a swing high resistance, indicating a potential level that could cap further upward movement.

Potential Direction: Bullish
Overall momentum of the chart: Bullish
The price could see a short-term pullback toward the pivot before rising again toward the 1st resistance.
Pivot: 1.3106
Supporting reasons: Identified as a pullback support that aligns with the 61.8% Fibonacci retracement, where renewed buying pressure could emerge to push the price higher.
1st support: 1.3012
Supporting reasons: Identified as a swing low support, indicating a potential area where the price could stabilize once more.
1st resistance: 1.3214
Supporting reasons: Identified as a swing high resistance, indicating a potential level that could halt further upward movement.

Potential Direction: Bullish
Overall momentum of the chart: Bullish
The price could see a short-term pullback toward the pivot before rising again toward the 1st resistance.
Pivot: 204.86
Supporting reasons: Identified as an overlap support, where renewed buying pressure could emerge to push the price higher.
1st support: 203.09
Supporting reasons: Identified as a pullback support, indicating a potential level where the price could stabilize once more.
1st resistance: 206.85
Supporting reasons: Identified as a swing high resistance, indicating a potential level that could halt further upward movement.

Potential Direction: Bullish
Overall momentum of the chart: Bearish
The price could see a short-term pullback toward the pivot before rising again toward the 1st resistance.
Pivot: 0.8030
Supporting reasons: Identified as a pullback support, where renewed buying pressure could emerge to push the price higher.
1st support: 0.7987
Supporting reasons: Identified as a pullback support that aligns with the 50% Fibonacci retracement, indicating a potential level where the price could stabilize once again.
1st resistance: 0.8109
Supporting reasons: Identified as a swing high resistance, indicating a potential level that could cap further upward movement.

Potential Direction: Bullish
Overall momentum of the chart: Bullish
The price could see a short-term pullback toward the pivot before rising again toward the 1st resistance.
Pivot: 155.02
Supporting reasons: Identified as an overlap support, where renewed buying pressure could emerge to push the price higher.
1st support: 154.08
Supporting reasons: Identified as an overlap support, indicating a strong area where buyers might return, and the price could stabilize once again.
1st resistance: 157.61
Supporting reasons: Identified as a swing high resistance. This level represents the next key area where upward movement could be capped amid increased selling pressure

Potential Direction: Bullish
Overall momentum of the chart: Bearish
The price could fall toward the pivot and could make a short-term pullback toward this level before rising again toward the 1st resistance.
Pivot: 1.4073
Supporting reasons: Identified as a pullback support that aligns with the 38.2% Fibonacci retracement, where renewed buying pressure could emerge to push the price higher.
1st support: 1.4034
Supporting reasons: Identified as a pullback support that aligns with the 61.8% Fibonacci retracement, indicating a key level where the price could stabilize once more.
1st resistance: 1.4134
Supporting reasons: Identified as a swing high resistance, making it a possible target for bullish advances and a level where some sellers could return to cap gains

Potential Direction: Bearish
Overall momentum of the chart: Bullish
The price could see a short-term pullback toward the pivot before continuing its bearish move down toward the 1st support.
Pivot: 0.6480
Supporting reasons: Identified as a pullback resistance that aligns with the 38.2% Fibonacci retracement, where selling pressures could intensify and potentially cap any upward retracement.
1st support: 0.6421
Supporting reasons: Identified as a swing low support, this area has provided strong support historically and may attract buying interest for a potential short-term bounce
1st resistance: 0.6519
Supporting reasons: Identified as an overlap resistance that aligns with the 61.8% Fibonacci retracement, indicating a potential area that could halt any further upward movement.

Potential Direction: Bearish
Overall momentum of the chart: Bullish
The price could see a short-term pullback toward the pivot before continuing its bearish move down toward the 1st support.
Pivot: 0.5636
Supporting reasons: Identified as a pullback resistance that aligns with the 50% Fibonacci retracement, where selling pressures could intensify and potentially cap any upward retracement.
1st support: 0.5582
Supporting reasons: Identified as a swing low support, this area has provided strong support historically and may attract buying interest for a potential short-term bounce
1st resistance: 0.5687
Supporting reasons: Identified as an overlap resistance, indicating a potential area that could halt any further upward movement.

Potential Direction: Bullish
Overall momentum of the chart: Bullish
The price could see a short-term pullback toward the pivot before rising again toward the 1st resistance.
Pivot: 46,804.82
Supporting reasons: Identified as a pullback support, where renewed buying pressure could emerge to push the price higher.
1st support: 46,442.68
Supporting reasons: Identified as a pullback support, suggesting a potential area where the price could stabilize once again.
1st resistance: 47,417.04
Supporting reasons: Identified as a pullback resistance that aligns with the 61.8% Fibonacci retracement, indicating a potential area that could halt any further upward movement.

Potential Direction: Bullish
Overall momentum of the chart: Bullish
The price could see a short-term pullback toward the pivot before rising again toward the 1st resistance.
Pivot: 23,488.29
Supporting reasons: Identified as a pullback support, where renewed buying pressure could emerge to push the price higher.
1st support: 22,917.77
Supporting reasons: Identified as a swing low support, indicating a key level where the price could stabilize once more.
1st resistance: 23,956.58
Supporting reasons: Identified as a pullback resistance that aligns with the 61.8% Fibonacci retracement, indicating a potential area that could halt any further upward movement.

Potential Direction: Bearish
Overall momentum of the chart: Bullish
The price could see a short-term pullback toward the pivot before continuing its bearish move down toward the 1st support.
Pivot: 6,773.23
Supporting reasons: Identified as an overlap resistance, where selling pressures could intensify and potentially cap any upward retracement.
1st support: 6,673.25
Supporting reasons: Identified as an overlap support, indicating a potential level where the price could stabilize once again.
1st resistance: 6,870.93
Supporting reasons: Identified as a swing high resistance, indicating a potential area that could halt any further upward movement.

Potential Direction: Bearish
Overall momentum of the chart: Bearish
The price has already reacted off the pivot and may continue its bearish move toward the 1st support
Pivot: 89,178.40
Supporting reasons: Identified as an overlap resistance that aligns with the 61.8% Fibonacci retracement, where selling pressures could intensify and potentially cap any upward retracement
1st support: 81,214.21
Supporting reasons: Identified as an overlap support, indicating a potential level where the price could stabilize once more.
1st resistance: 93,070.41
Supporting reasons: Identified as an overlap resistance, indicating a potential area that could halt any further upward movement.

Potential Direction: Bearish
Overall momentum of the chart: Bullish
The price could see a short-term pullback toward the pivot before continuing its bearish move down toward the 1st support.
Pivot: 3,057.32
Supporting reasons: Identified as a pullback resistance, where selling pressures could intensify and potentially cap any upward retracement.
1st support: 2,855.95
Supporting reasons: Identified as a pullback support, indicating a potential level where the price could stabilize once more.
1st resistance: 3,230.74
Supporting reasons: Identified as an overlap resistance, indicating a potential area that could halt any further upward movement.

Potential Direction: Bearish
Overall momentum of the chart: Bullish
The price could see a short-term pullback toward the pivot before continuing its bearish move down toward the 1st support.
Pivot: 58.99
Supporting reasons: Identified as an overlap resistance, where selling pressures could intensify and potentially cap any upward retracement.
1st support: 57.41
Supporting reasons: Identified as a swing low support, indicating a key level where the price could stabilize once more.
1st resistance: 60.28
Supporting reasons: Identified as a pullback resistance, indicating a potential area that could halt any further upward movement.

Potential Direction: Bearish
Overall momentum of the chart: Bullish
The price has already reacted off the pivot and may continue its bearish move toward the 1st support
Pivot: 4,147.61
Supporting reasons: Identified as an overlap resistance that aligns with the 61.8% Fibonacci retracement, where selling pressures could intensify and potentially cap any upward retracement
1st support: 4,093.68
Supporting reasons: Identified as a pullback support, indicating a key level where the price could stabilize once more.
1st resistance: 4,219.46
Supporting reasons: Identified as an overlap resistance, indicating a potential area that could halt any further upward movement.

The accuracy, completeness and timeliness of the information contained on this site cannot be guaranteed. IC Markets Global does not warranty, guarantee or make any representations, or assume any liability regarding financial results based on the use of the information in the site.
News, views, opinions, recommendations and other information obtained from sources outside of www.icmarkets.com, used in this site are believed to be reliable, but we cannot guarantee their accuracy or completeness. All such information is subject to change at any time without notice. IC Markets Global assumes no responsibility for the content of any linked site.
The fact that such links may exist does not indicate approval or endorsement of any material contained on any linked site. IC Markets Global is not liable for any harm caused by the transmission, through accessing the services or information on this site, of a computer virus, or other computer code or programming device that might be used to access, delete, damage, disable, disrupt or otherwise impede in any manner, the operation of the site or of any user’s software, hardware, data or property.
The post Wednesday 26th November 2025: Technical Outlook and Review first appeared on IC Markets | Official Blog.
423848 November 25, 2025 17:39 ICMarkets Market News

The post Ex-Dividend 26/11/2025 first appeared on IC Markets | Official Blog.
423846 November 25, 2025 16:14 ICMarkets Market News
US Stocks Rally on Fed Rate Cut Hopes – Nasdaq up over 2%
US equities opened the week on a firm footing, with all three major indices posting solid gains as expectations for a December rate cut increased again. Markets are now assigning an 80% chance of a 25-basis-point cut at the December FOMC meeting, up from just 40% only days ago. The Dow Jones rose 0.44% to close at 46,448, while the S&P 500 jumped 1.55% to 6,705, while major tech players rallied strongly, driving the Nasdaq up 2.69% to finish at 22,872. Treasury markets reflected the dovish shift, with the 2-year yield slipping 1.1 basis points to 3.497% and the 10-year yield falling 3.8 basis points to 4.025%, while the U.S. dollar was more muted, with the DXY edging 0.08% lower to 100.20. Oil prices climbed as resistance to the proposed Ukraine peace accord raised fresh uncertainty around supply conditions. Brent gained 1.33% to trade at $63.39, while WTI rose 1.46% to $58.91. Gold also pushed higher from key support levels, rallying 1.64% to settle at $4,131.89 by the New York close.
Oil Rises on Peace Doubts and Fed Cuts
Oil prices pushed higher in trading yesterday after having pulled back significantly over the past week on hopes of a peace deal between Russia and Ukraine. The US has been actively trying to negotiate a deal between the two parties, and progress had led to WTI prices dropping nearly 6% over the course of last week. However, updates yesterday that Ukraine may push back again on some of Russia’s requests led to a 1.5% rally. Market pricing for a Federal Reserve rate cut increased again last night, now up to a near 80% chance from just 40% a couple of days ago, and the dollar side of the trade has helped yesterday’s move. Traders are expecting more volatility in ‘Black Gold’ in the next few days, with more updates and movement expected from both sides of the equation. Support for WTI now sits near the recent low just above $57, with resistance now around the $60.25 mark.
Economic Calendar Picks up Today
The macroeconomic calendar picks up today with traders preparing for a deluge of data before an anticipated calmer end to the week due to the US Thanksgiving holiday. There is little to move the dial on the calendar in the first two trading sessions of the day, however strong overnight moves and the potential for more geopolitical updates should keep markets buoyant. Risk events pick up strongly once New York opens though, with more delayed data due to hit the street. September PPI and Retail Sales data is due out, just 40 days late: the PPI (exp +0.3% m/m), Core PPI (exp +0.2% m/m), Retail Sales (exp +0.4% m/m), and Core Retail Sales (exp +0.3% m/m) will all be released at the same time, with traders expecting plenty of volatility around the event. Later in the session, we also have the latest Pending Home Sales (exp +0.5%) and Richmond Manufacturing Index (exp -5) data out; however, expect the earlier data to dominate sentiment.
The post General Market Analysis – 25/11/25 first appeared on IC Markets | Official Blog.
423840 November 25, 2025 16:00 ICMarkets Market News
Potential Direction: Bullish
Overall momentum of the chart: Bearish
The price could see a short-term pullback toward the pivot before rising again toward the 1st resistance.
Pivot: 99.80
Supporting reasons: Identified as a pullback support that aligns closely with the 38.2% Fibonacci retracement, where renewed buying pressure could emerge to push the price higher.
1st support: 99.35
Supporting reasons: Identified as an overlap support that aligns closely with the 78.6% Fibonacci retracement, indicating a potential area where the price could again stabilize.
1st resistance: 100.35
Supporting reasons: Identified as a swing high resistance, indicating a potential area that could halt any further upward movement

Potential Direction: Bearish
Overall momentum of the chart: Bearish
The price could see a short-term pullback toward the pivot before continuing its bearish move down toward the 1st support.
Pivot: 1.1567
Supporting reasons: Identified as a pullback resistance, where selling pressures could intensify and potentially cap any upward retracement.
1st support: 1.1494
Supporting reasons: Identified as an overlap support, indicating a potential level where the price could stabilize once again.
1st resistance: 1.1623
Supporting reasons: Identified as a pullback resistance, indicating a potential level that could cap further upward movement.

Potential Direction: Bullish
Overall momentum of the chart: Bullish
The price could see a short-term pullback toward the pivot before rising again toward the 1st resistance.
Pivot: 179.93
Supporting reasons: Identified as a pullback support, where renewed buying pressure could emerge to push the price higher.
1st support: 178.67
Supporting reasons: Identified as a pullback support, indicating a potential area where the price could again stabilize.
1st resistance: 181.69
Supporting reasons: Identified as a swing high resistance, indicating a potential level that could cap further upward movement.

Potential Direction: Bearish
Overall momentum of the chart: Bullish
The price has already reacted off the pivot and may continue its bearish move toward the 1st support
Pivot: 0.8828
Supporting reasons: Identified as an overlap resistance, where selling pressures could intensify and potentially cap any upward retracement
1st support: 0.8751
Supporting reasons: Identified as an overlap support, indicating a potential area where the price could stabilize once more.
1st resistance: 0.8865
Supporting reasons: Identified as a swing high resistance, indicating a potential level that could cap further upward movement.

Potential Direction: Bearish
Overall momentum of the chart: Bullish
The price could see a short-term pullback toward the pivot before continuing its bearish move down toward the 1st support.
Pivot: 1.3106
Supporting reasons: Identified as an overlap resistance that aligns with the 38.2% Fibonacci retracement, where selling pressures could intensify and potentially cap any upward retracement.
1st support: 1.3012
Supporting reasons: Identified as a swing low support, indicating a potential area where the price could stabilize once more.
1st resistance: 1.3179
Supporting reasons: Identified as a pullback resistance that aligns with the 78.6% Fibonacci retracement, indicating a potential level that could halt further upward movement.

Potential Direction: Bullish
Overall momentum of the chart: Bullish
The price could see a short-term pullback toward the pivot before rising again toward the 1st resistance.
Pivot: 204.86
Supporting reasons: Identified as an overlap support, where renewed buying pressure could emerge to push the price higher.
1st support: 203.09
Supporting reasons: Identified as a pullback support, indicating a potential level where the price could stabilize once more.
1st resistance: 206.85
Supporting reasons: Identified as a swing high resistance, indicating a potential level that could halt further upward movement.

Potential Direction: Bullish
Overall momentum of the chart: Bearish
The price could see a short-term pullback toward the pivot before rising again toward the 1st resistance.
Pivot: 0.8030
Supporting reasons: Identified as a pullback support, where renewed buying pressure could emerge to push the price higher.
1st support: 0.7987
Supporting reasons: Identified as a pullback support that aligns with the 50% Fibonacci retracement, indicating a potential level where the price could stabilize once again.
1st resistance: 0.8109
Supporting reasons: Identified as a swing high resistance, indicating a potential level that could cap further upward movement.

Potential Direction: Bullish
Overall momentum of the chart: Bullish
The price could see a short-term pullback toward the pivot before rising again toward the 1st resistance.
Pivot: 155.02
Supporting reasons: Identified as an overlap support, where renewed buying pressure could emerge to push the price higher.
1st support: 154.08
Supporting reasons: Identified as an overlap support, indicating a strong area where buyers might return, and the price could stabilize once again.
1st resistance: 157.61
Supporting reasons: Identified as a swing high resistance. This level represents the next key area where upward movement could be capped amid increased selling pressure

Potential Direction: Bullish
Overall momentum of the chart: Bearish
The price could fall toward the pivot and could make a short-term pullback toward this level before rising again toward the 1st resistance.
Pivot: 1.4073
Supporting reasons: Identified as a pullback support, where renewed buying pressure could emerge to push the price higher.
1st support: 1.4034
Supporting reasons: Identified as a pullback support, indicating a key level where the price could stabilize once more.
1st resistance: 1.4134
Supporting reasons: Identified as a swing high resistance, making it a possible target for bullish advances and a level where some sellers could return to cap gains

Potential Direction: Bearish
Overall momentum of the chart: Bullish
The price could see a short-term pullback toward the pivot before continuing its bearish move down toward the 1st support.
Pivot: 0.6480
Supporting reasons: Identified as a pullback resistance that aligns with the 38.2% Fibonacci retracement, where selling pressures could intensify and potentially cap any upward retracement.
1st support: 0.6421
Supporting reasons: Identified as a swing low support, this area has provided strong support historically and may attract buying interest for a potential short-term bounce
1st resistance: 0.6519
Supporting reasons: Identified as an overlap resistance that aligns with the 61.0% Fibonacci retracement, indicating a potential area that could halt any further upward movement.

Potential Direction: Bearish
Overall momentum of the chart: Bullish
The price has already reacted off the pivot and may continue its bearish move toward the 1st support
Pivot: 0.5636
Supporting reasons: Identified as a pullback resistance, where selling pressures could intensify and potentially cap any upward retracement
1st support: 0.5556
Supporting reasons: Identified as a support that is supported by the 161.8% Fibonacci extension, this area has provided strong support historically and may attract buying interest for a potential short-term bounce
1st resistance: 0.5687
Supporting reasons: Identified as an overlap resistance, indicating a potential area that could halt any further upward movement.
Potential Direction: Bearish
Overall momentum of the chart: Bullish
The price could see a short-term pullback toward the pivot before continuing its bearish move down toward the 1st support.
Pivot: 46,723.38
Supporting reasons: Identified as an overlap resistance, where selling pressures could intensify and potentially cap any upward retracement.
1st support: 45,767.10
Supporting reasons: Identified as an overlap support that aligns with the 100% Fibonacci projection, suggesting a potential area where the price could stabilize once again.
1st resistance: 47,417.04
Supporting reasons: Identified as a pullback resistance, indicating a potential area that could halt any further upward movement.

Potential Direction: Bearish
Overall momentum of the chart: Bullish
The price could see a short-term pullback toward the pivot before continuing its bearish move down toward the 1st support.
Pivot: 23,539.09
Supporting reasons: Identified as a pullback resistance, where selling pressures could intensify and potentially cap any upward retracement.
1st support: 22,917.77
Supporting reasons: Identified as a swing low support, indicating a key level where the price could stabilize once more.
1st resistance: 23,776.73
Supporting reasons: Identified as a pullback resistance, indicating a potential area that could halt any further upward movement.

Potential Direction: Bullish
Overall momentum of the chart: Bullish
The price could see a short-term pullback toward the pivot before rising again toward the 1st resistance.
Pivot: 6.660.83
Supporting reasons: Identified as a pullback support, where renewed buying pressure could emerge to push the price higher.
1st support: 6,532.80
Supporting reasons: Identified as a swing low support, indicating a potential level where the price could stabilize once again.
1st resistance: 6,763.10
Supporting reasons: Identified as a swing high resistance, indicating a potential area that could halt any further upward movement.

Potential Direction: Bearish
Overall momentum of the chart: Bullish
The price could see a short-term pullback toward the pivot before continuing its bearish move down toward the 1st support.
Pivot: 89,178.40
Supporting reasons: Identified as a pullback resistance that aligns with the 61.8% Fibonacci retracement, where selling pressures could intensify and potentially cap any upward retracement.
1st support: 81,214.21
Supporting reasons: Identified as an overlap support, indicating a potential level where the price could stabilize once more.
1st resistance: 93,070.41
Supporting reasons: Identified as an overlap resistance, indicating a potential area that could halt any further upward movement.

Potential Direction: Bearish
Overall momentum of the chart: Bullish
The price could see a short-term pullback toward the pivot before continuing its bearish move down toward the 1st support.
Pivot: 3,057.32
Supporting reasons: Identified as a pullback resistance, where selling pressures could intensify and potentially cap any upward retracement.
1st support: 2,818.56
Supporting reasons: Identified as a pullback support, indicating a potential level where the price could stabilize once more.
1st resistance: 3,230.74
Supporting reasons: Identified as an overlap resistance, indicating a potential area that could halt any further upward movement.

Potential Direction: Bearish
Overall momentum of the chart: Bullish
The price could see a short-term pullback toward the pivot before continuing its bearish move down toward the 1st support.
Pivot: 59.38
Supporting reasons: Identified as a pullback resistanc, where selling pressures could intensify and potentially cap any upward retracement.
1st support: 58.40
Supporting reasons: Identified as a pullback support, indicating a key level where the price could stabilize once more.
1st resistance: 60.28
Supporting reasons: Identified as a pullback resistance, indicating a potential area that could halt any further upward movement.

Potential Direction: Bearish
Overall momentum of the chart: Bullish
The price could see a short-term pullback toward the pivot before continuing its bearish move down toward the 1st support.
Pivot: 4,147.61
Supporting reasons: Identified as a pullback resistance that aligns closely with the 61.8% Fibonacci retracement, where selling pressures could intensify and potentially cap any upward retracement.
1st support: 4,093.68
Supporting reasons: Identified as a pullback support, indicating a key level where the price could stabilize once more.
1st resistance: 4,219.46
Supporting reasons: Identified as an overlap resistance, indicating a potential area that could halt any further upward movement.

The accuracy, completeness and timeliness of the information contained on this site cannot be guaranteed. IC Markets Global does not warranty, guarantee or make any representations, or assume any liability regarding financial results based on the use of the information in the site.
News, views, opinions, recommendations and other information obtained from sources outside of www.icmarkets.com, used in this site are believed to be reliable, but we cannot guarantee their accuracy or completeness. All such information is subject to change at any time without notice. IC Markets Global assumes no responsibility for the content of any linked site.
The fact that such links may exist does not indicate approval or endorsement of any material contained on any linked site. IC Markets Global is not liable for any harm caused by the transmission, through accessing the services or information on this site, of a computer virus, or other computer code or programming device that might be used to access, delete, damage, disable, disrupt or otherwise impede in any manner, the operation of the site or of any user’s software, hardware, data or property.
The post Tuesday 25th November 2025: Technical Outlook and Review first appeared on IC Markets | Official Blog.
423839 November 25, 2025 16:00 ICMarkets Market News
IC Markets Global – Asia Fundamental Forecast | 25 November 2025
What happened in the U.S. session?
U.S. financial news during the overnight session was driven by optimism around potential Federal Reserve interest rate cuts, robust performances in technology stocks, and mixed macroeconomic data releases. Tech stocks, especially major semiconductor companies and Alphabet (Google’s parent), rallied strongly, buoying the Nasdaq Composite and S&P 500. Rumors and Fed officials’ comments raised the likelihood of a rate cut at the December FOMC meeting to above 70%, fueling gains across equities, particularly consumer and technology shares.
What does it mean for the Asia Session?
Asian traders should closely monitor key US macroeconomic releases, ongoing volatility in technology stocks, movements in major currencies like the Japanese yen, and potential policy actions from China and Japan on Tuesday, November 25, 2025. Market sentiment is strongly influenced by upcoming US inflation and retail sales data, which could drive volatility across Asian equities and currencies
The Dollar Index (DXY)
Key news events today
Core PPI m/m (1:30 pm GMT)
Core Retail Sales m/m (1:30 pm GMT)
PPI m/m (1:30 pm GMT)
Retail Sales m/m (1:30 pm GMT)
Pending Home Sales m/m (3:00 pm GMT)
Richmond Manufacturing Index (3:00 pm GMT)
What can we expect from DXY today?
The US dollar is holding firm on November 25, with the market focused on economic data and the Fed’s policy outlook. The outlook for the rest of the week hinges on several high-impact US releases, with traders watching for signals on the strength of the US consumer and any signs of broadening labor market weakness. The US dollar remains a dominant force, accounting for 88% of forex trades worldwide. While the dollar’s long-term fundamentals remain strong, its near-term direction hinges on Fed policy and risk sentiment globally.
Central Bank Notes:
Next 24 Hours Bias
Medium Bullish
Gold (XAU)
Key news events today
Core PPI m/m (1:30 pm GMT)
Core Retail Sales m/m (1:30 pm GMT)
PPI m/m (1:30 pm GMT)
Retail Sales m/m (1:30 pm GMT)
Pending Home Sales m/m (3:00 pm GMT)
Richmond Manufacturing Index (3:00 pm GMT)
What can we expect from Gold today?
Gold begins the week in a consolidation phase between $4,000 and $4,100, reflecting market uncertainty about the Federal Reserve’s December rate decision. Despite the range-bound trading, fundamental support remains robust from continued central bank buying, elevated safe-haven demand driven by geopolitical tensions, and strong investment flows into gold ETFs.
Next 24 Hours Bias
Medium Bearish
The Australian Dollar (AUD)
Key news events today
No major news event
What can we expect from AUD today?
The Australian Dollar (AUD) was trading modestly weaker, pressured by global risk aversion and recent strength in the US Dollar. The currency remains supported in the medium term by hawkish Reserve Bank of Australia (RBA) policy but is sensitive to shifts in global sentiment and key domestic data releases. The Australian Dollar depreciated approximately 1.3% during the past week, influenced by global equity declines and investors’ cautious stance ahead of upcoming CPI data and other US macro releases.
Central Bank Notes:
Next 24 Hours Bias
Medium Bearish
The Kiwi Dollar (NZD)
Key news events today
No major news event
What can we expect from NZD today?
The NZD remains under pressure due to anticipated RBNZ rate cuts, a weak domestic economic outlook, and a resilient US Dollar. The market consensus is for further NZD downside unless there is a policy surprise or a shift in global sentiment. Traders continue to watch key resistance levels and the RBNZ meeting for signs of recovery or additional weakness in the currency.
Central Bank Notes:
Next 24 Hours Bias
Medium Bearish
The Japanese Yen (JPY)
Key news events today
No major news events
What can we expect from JPY today?
The Japanese Yen (JPY) continues to weaken against the US Dollar, trading near multi-month lows as of Tuesday, November 25, 2025, with USD/JPY last seen around 156.61–156.90. The yen remains under pressure due to fiscal concerns, ongoing stimulus measures, and speculation about potential government intervention in the currency markets.
Central Bank Notes:
Next 24 Hours Bias
Weak Bearish
Oil
Key news events today
No major news event
What can we expect from Oil today?
Oil markets are predominantly bearish today, reacting to peace negotiations and projected increases in supply, with prices hovering near multi-week and yearly lows for both WTI and Brent benchmarks. Oil has posted its longest monthly losing run since 2023, reflecting cautious sentiment from traders and analysts about global inventory growth and future demand.
Brent and WTI both face technical resistance, and even minor optimism in peace talks is provoking bearish sentiment due to anticipated supply increases.
Next 24 Hours Bias
Medium Bearish
The post IC Markets Global – Asia Fundamental Forecast | 25 November 2025 first appeared on IC Markets | Official Blog.
423838 November 25, 2025 15:39 ICMarkets Market News
Asian stock markets were mixed on Tuesday, mirroring the broadly positive cues from Wall Street and rising expectations of a U.S. Federal Reserve rate cut next month. Optimism grew after recent dovish comments from Fed officials, though concerns about high market valuations continue to weigh on sentiment. Fed Governor Christopher Waller signaled support for another quarter-point cut in December due to labor market concerns, echoing remarks from New York Fed President John Williams, who noted room for further adjustments. The CME FedWatch Tool now shows an 80.9 percent probability of a December cut, sharply higher than last week.
In Australia, the S&P/ASX 200 traded slightly higher, supported by gains in major mining stocks and a mixed performance across other sectors. Rio Tinto led miners with strong gains, while gold producers like Newmont and Resolute Mining advanced sharply. Tech stocks were mixed, with Block declining and Appen rising. Banks were mostly lower, while individual movers included Web Travel, up nearly 10 percent on strong results, and Ramsay Health Care, which gained on improved earnings guidance.
Japan’s Nikkei 225 also moved higher in post-holiday trade, buoyed by strength in automakers and technology stocks such as Tokyo Electron and Advantest. Major exporters like Panasonic and Mitsubishi Electric advanced, though SoftBank declined.
Elsewhere in Asia, China, Hong Kong, South Korea, and Taiwan traded higher, while New Zealand, Singapore, Malaysia, and Indonesia were modestly lower. Meanwhile, Wall Street extended Friday’s rebound, led by a strong surge in the Nasdaq, while European markets ended mixed and crude oil prices rose.
Upcoming Events:
The post Tuesday 25th November 2025: Asian Markets Mixed as Fed Rate-Cut Hopes Rise and Tech Stocks Lead Gains first appeared on IC Markets | Official Blog.
423837 November 25, 2025 15:39 ICMarkets Market News
IC Markets Global – Europe Fundamental Forecast | 25 November 2025
What happened in the Asia session?
During today’s Asia session, financial markets were primarily influenced by optimism over a possible US Federal Reserve rate cut in December, which boosted Asian equities and impacted core instruments such as technology stocks, US Treasury yields, and regional forex pairs. Asian stocks, Japanese yen, and US Treasury yields were most affected by the headlines and economic data during today’s Asia session, as market participants responded to monetary policy signals and softening global macro data.
What does it mean for the Europe & US sessions?
The market is alert to U.S. government data releases and their effects, as any surprising outcome in inflation or sales can impact Federal Reserve policy expectations. ECB, European banking sector, and EU investment rules developments continue to drive sentiment and capital flows, with ongoing efforts to support local industries and adapt to global trends. Watch for updates in central bank communications, particularly from the Reserve Bank of New Zealand, which may cut rates in its latest meeting, potentially influencing risk sentiment globally.
The Dollar Index (DXY)
Key news events today
Core PPI m/m (1:30 pm GMT)
Core Retail Sales m/m (1:30 pm GMT)
PPI m/m (1:30 pm GMT)
Retail Sales m/m (1:30 pm GMT)
Pending Home Sales m/m (3:00 pm GMT)
Richmond Manufacturing Index (3:00 pm GMT)
What can we expect from DXY today?
The US dollar remains steady today, Tuesday, as investors continue to weigh the potential for a Federal Reserve rate cut in December. Market sentiment is cautious, with increased speculation putting mild pressure on the dollar against major currencies, although it has not led to significant moves so far. The dollar is currently stable but faces potential volatility pending today’s US economic releases and evolving Federal Reserve rate cut outlook for December.
Central Bank Notes:
Next 24 Hours Bias
Weak Bullish
Gold (XAU)
Key news events today
Core PPI m/m (1:30 pm GMT)
Core Retail Sales m/m (1:30 pm GMT)
PPI m/m (1:30 pm GMT)
Retail Sales m/m (1:30 pm GMT)
Pending Home Sales m/m (3:00 pm GMT)
Richmond Manufacturing Index (3:00 pm GMT)
What can we expect from Gold today?
Gold remains in a range between $4,000 and $4,100, with a bullish bias unless significant support levels are breached; if prices were to fall below $3,905, analysts warn of further downside risks. The near-term outlook suggests that gold could resume its upward trend if global uncertainty persists and monetary easing takes place. Gold is benefiting from both macroeconomic uncertainty and rising expectations for U.S. monetary easing, keeping prices elevated and volatility high.
Next 24 Hours Bias
Medium Bullish
The Euro (EUR)
Key news events today
German Ifo Business Climate (9:00 am GMT)
ECB President Lagarde Speaks (2:50 pm GMT)
What can we expect from EUR today?
The Euro is pressured by technical and fundamental headwinds, but short-term rebounds are possible at key support zones. Eurozone economic growth remains resilient despite slower employment and inflation deceleration. European policy attention is focused on support for Ukraine, AI adoption, and regulatory strategy, all of which could impact currency sentiment in the near term.
Central Bank Notes:
Next 24 Hours Bias
Weak Bearish
The Swiss Franc (CHF)
Key news events today
No major news event
What can we expect from CHF today?
The Swiss Franc (CHF) is experiencing a steady phase today, November 25, 2025, following recent volatility driven by trade and macroeconomic news. Demand for the franc remains supported by its safe-haven status, with the recent U.S.-Switzerland tariff deal playing a significant stabilizing role.
The USD/CHF exchange rate was around 0.8079 as of November 24, 2025, reflecting a 0.19% daily drop; the franc is down 1.38% for the month but up nearly 9% year-on-year.
Central Bank Notes:
Next 24 Hours Bias
Weak Bearish
The Pound (GBP)
Key news events today
No major news event
What can we expect from GBP today?
The British pound is trading steadily just below $1.31 as markets focus on Wednesday’s upcoming UK budget announcement. Expectations of a Bank of England interest rate cut in December are growing, with markets pricing in nearly a 90% chance of a 25-basis-point reduction, which is capping gains for the pound and driving cautious sentiment.
Central Bank Notes:
Next 24 Hours Bias
Weak Bearish
The Canadian Dollar (CAD)
Key news events today
No major news event
What can we expect from CAD today?
The Canadian dollar faces a confluence of bearish pressures on November 25, 2025. Weak oil prices below $58/barrel, Canada’s widening trade deficit, and sticky domestic inflation that limits further BoC rate cuts are all weighing on the currency. While increased Fed rate cut expectations provided brief relief earlier in the session, the USD/CAD pair remains near seven-month highs around 1.4110.
Central Bank Notes:
Next 24 Hours Bias
Medium Bearish
Oil
Key news events today
API Crude Oil Stock (8:30 pm GMT)
What can we expect from Oil today?
Oil is trading sideways to slightly lower today after a modest rebound yesterday, with Brent around 63 USD and WTI just under 59 USD. The market is dominated by expectations of a 2026 supply surplus, driven by robust non‑OPEC output and still‑high OPEC+ production, while global demand growth looks softer. Conflicting signals around a Russia–Ukraine peace deal and sanctions on Russian oil are adding short‑term volatility but have not yet changed the bearish medium‑term narrative. Prospects of a US rate cut are offering some support, yet traders largely see any rally into the mid‑60s Brent area as a chance to sell strength rather than chase upside.
Next 24 Hours Bias
Medium Bearish
The post IC Markets Global – Europe Fundamental Forecast | 25 November 2025 first appeared on IC Markets | Official Blog.