Articles
Monday 22nd December 2025: Technical Outlook and Review
424741 December 22, 2025 14:14 ICMarkets Market News
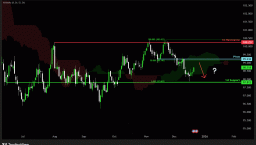
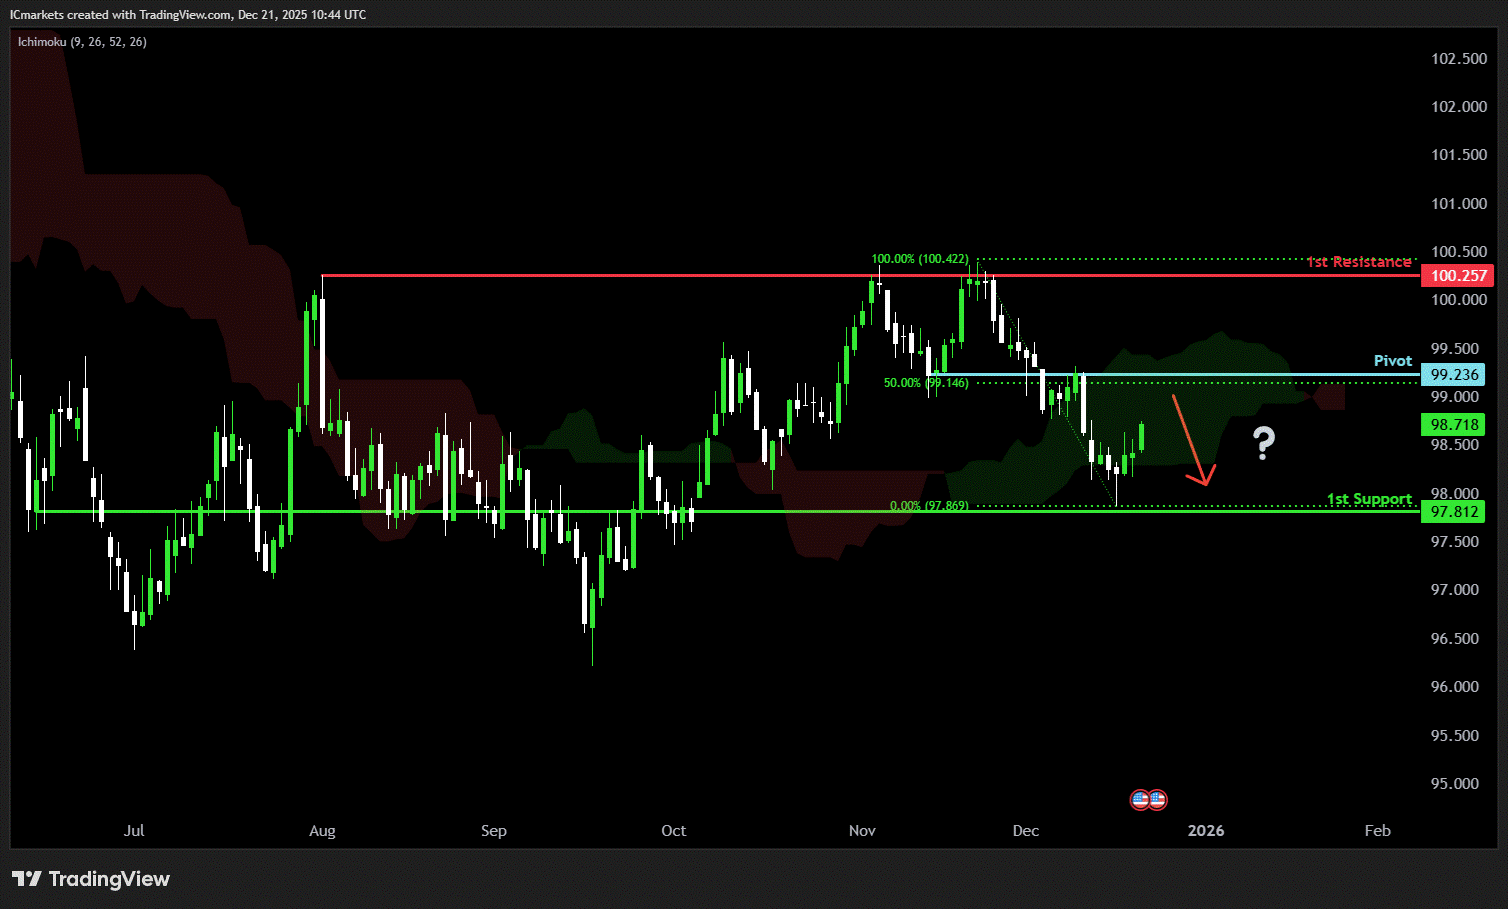
DXY (U.S. Dollar Index):
Potential Direction: Bearish
Overall momentum of the chart: Bearish
The price could see a short-term pullback toward the pivot before continuing its bearish move down toward the 1st support.
Pivot: 99.23
Supporting reasons: Identified as a pullback resistance that aligns with the 50% Fibonacci retracement, where selling pressures could intensify and potentially cap any upward retracement.
1st support: 97.18
Supporting reasons: Identified as an overlap support, indicating a potential area where the price could again stabilize.
1st resistance: 100.25
Supporting reasons: Identified as a multi-swing high resistance, indicating a potential area that could halt any further upward movement
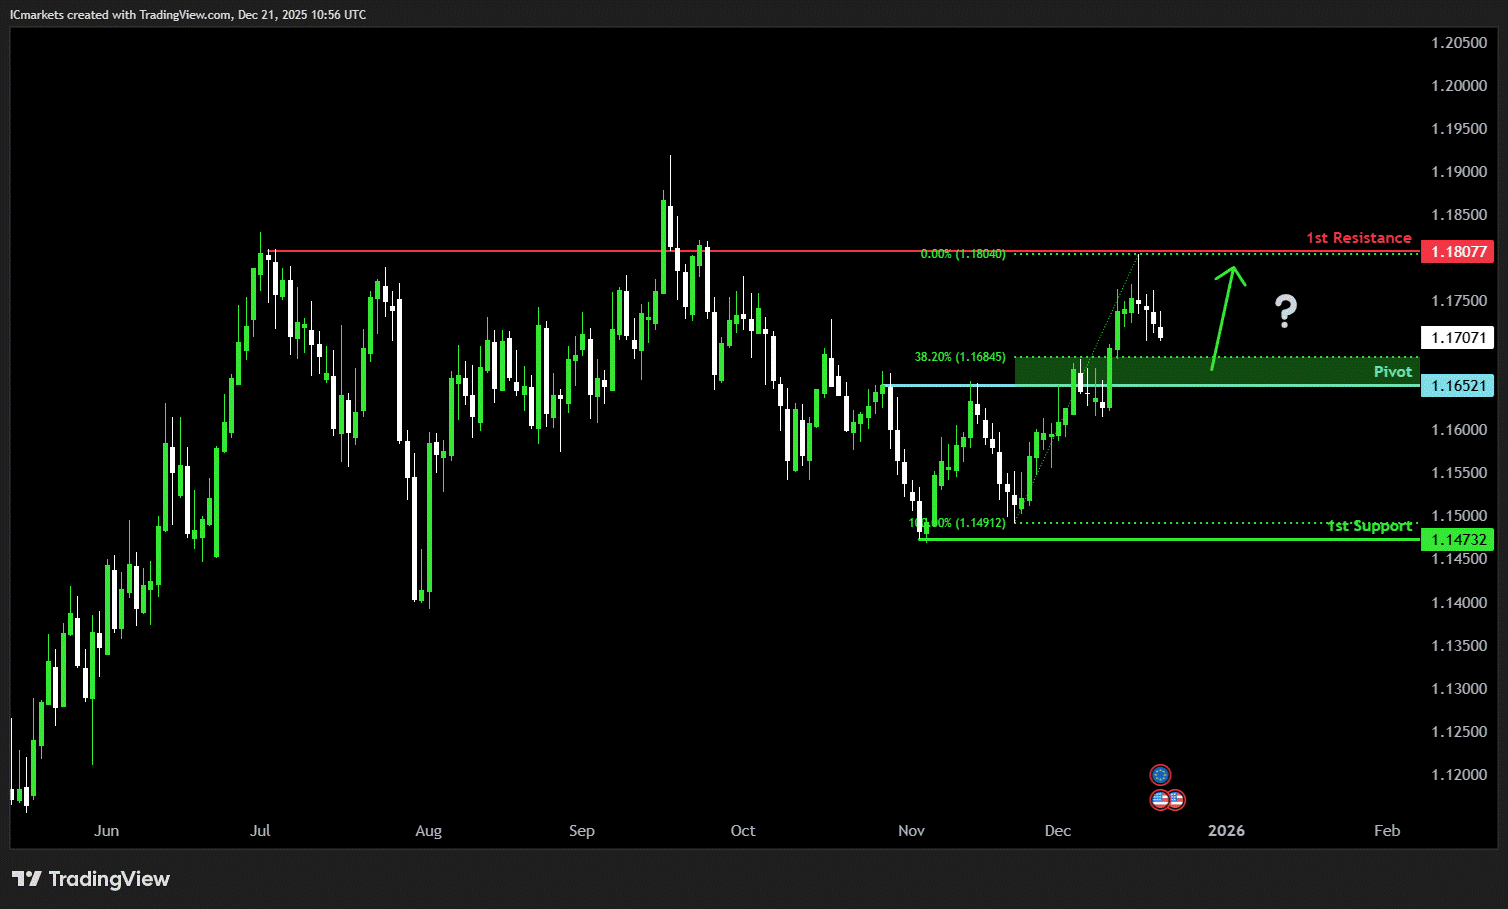
EUR/USD:
Potential Direction: Bullish
Overall momentum of the chart: Bullish
The price could make a short-term pullback toward the pivot before rising again toward the 1st resistance.
Pivot: 1.1652
Supporting reasons: Identified as a pullback support, where renewed buying pressure could emerge to push the price higher.
1st support: 1.1473
Supporting reasons: Identified as a swing low support, indicating a potential level where the price could stabilize once again.
1st resistance: 1.1807
Supporting reasons: Identified as a pullback resistance, indicating a potential level that could cap further upward movement.
EUR/JPY:
Potential Direction: Bullish
Overall momentum of the chart: Bullish
The price could make a short-term pullback toward the pivot before rising again toward the 1st resistance.
Pivot: 181.62
Supporting reasons: Identified as a pullback support, where renewed buying pressure could emerge to push the price higher.
1st support: 177.97
Supporting reasons: Identified as a pullback support, indicating a potential area where the price could again stabilize.
1st resistance: 188.13
Supporting reasons: Identified as a resistance that is supported by the 161.8% Fibonacci extension, indicating a potential level that could cap further upward movement.
EUR/GBP:
Potential Direction: Bullish
Overall momentum of the chart: Bullish
The price has already bounced off the pivot and may continue its bullish move toward the 1st resistance
Pivot: 0.8744
Supporting reasons: Identified as an overlap support, where renewed buying pressure could emerge to push the price higher.
1st support: 0.8607
Supporting reasons: Identified as an overlap support, indicating a potential area where the price could stabilize once more.
1st resistance: 0.8867
Supporting reasons: Identified as a swing high resistance, indicating a potential level that could cap further upward movement.
GBP/USD:
Potential Direction: Bearish
Overall momentum of the chart: Bullish
The price has already reacted off the pivot and may continue its bearish move toward the 1st support.
Pivot: 1.3405
Supporting reasons: Identified as an overlap resistance that aligns with the 61.8% Fibonacci retracement, where selling pressures could intensify and potentially cap any upward retracement
1st support: 1.3208
Supporting reasons: Identified as an overlap support, indicating a potential area where the price could stabilize once more.
1st resistance: 1.3585
Supporting reasons: Identified as a pullback resistance, indicating a potential level that could halt further upward movement.

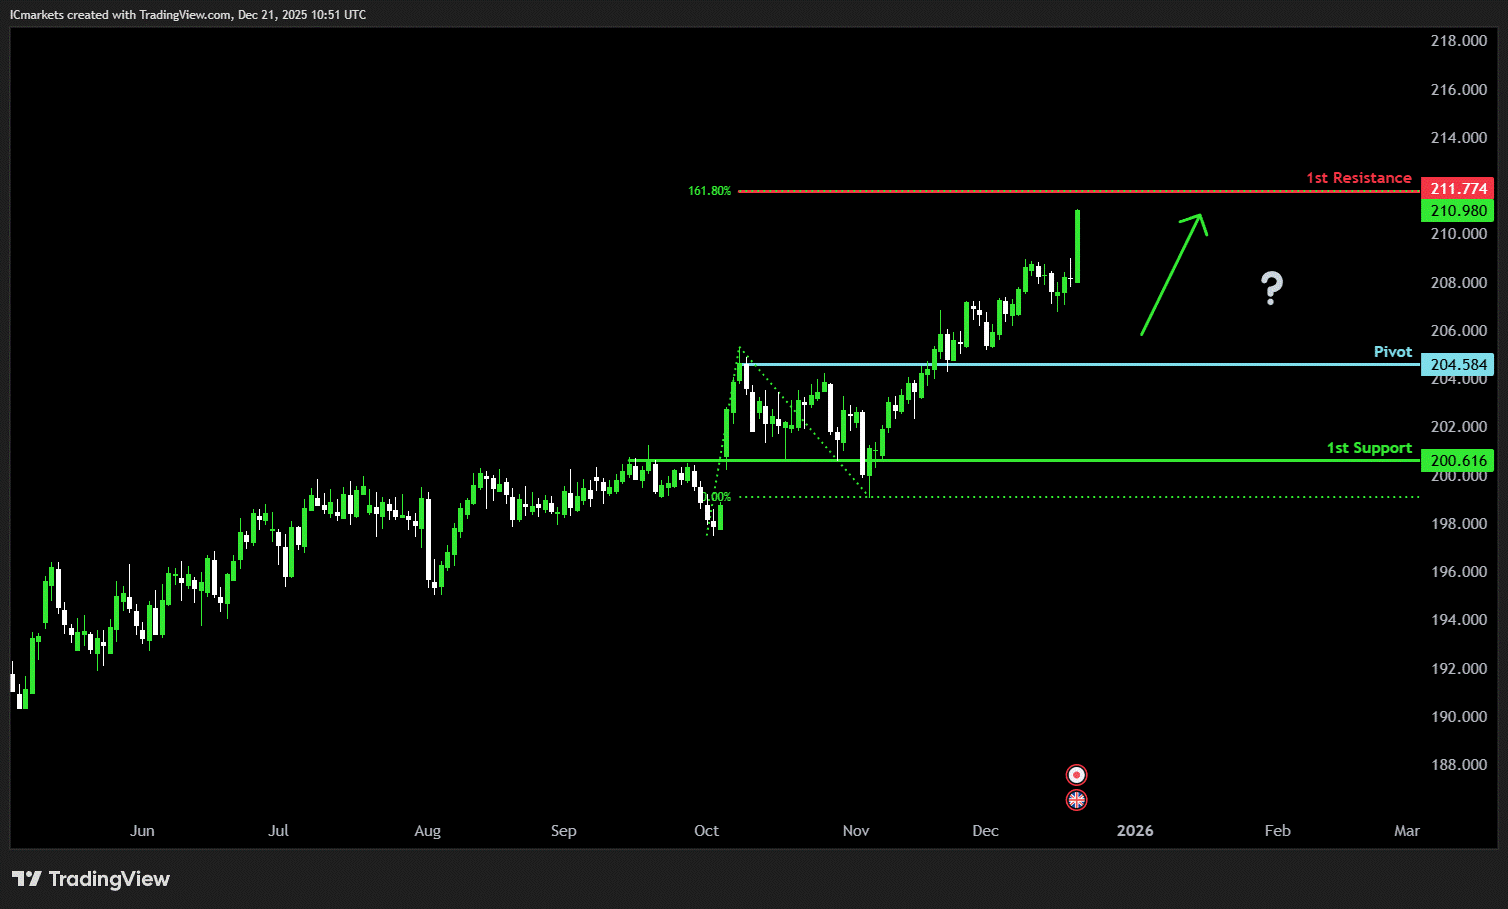
GBP/JPY:
Potential Direction: Bullish
Overall momentum of the chart: Bullish
The price could make a short-term pullback toward the pivot before rising again toward the 1st resistance
Pivot: 204,58
Supporting reasons: Identified as a pullback support, where renewed buying pressure could emerge to push the price higher.
1st support: 200.61
Supporting reasons: Identified as an overlap support, indicating a potential level where the price could stabilize once more.
1st resistance: 211.77
Supporting reasons: Identified as a resistance that is supported by the 161.8% Fibonacci projection indicating a potential level that could halt further upward movement.
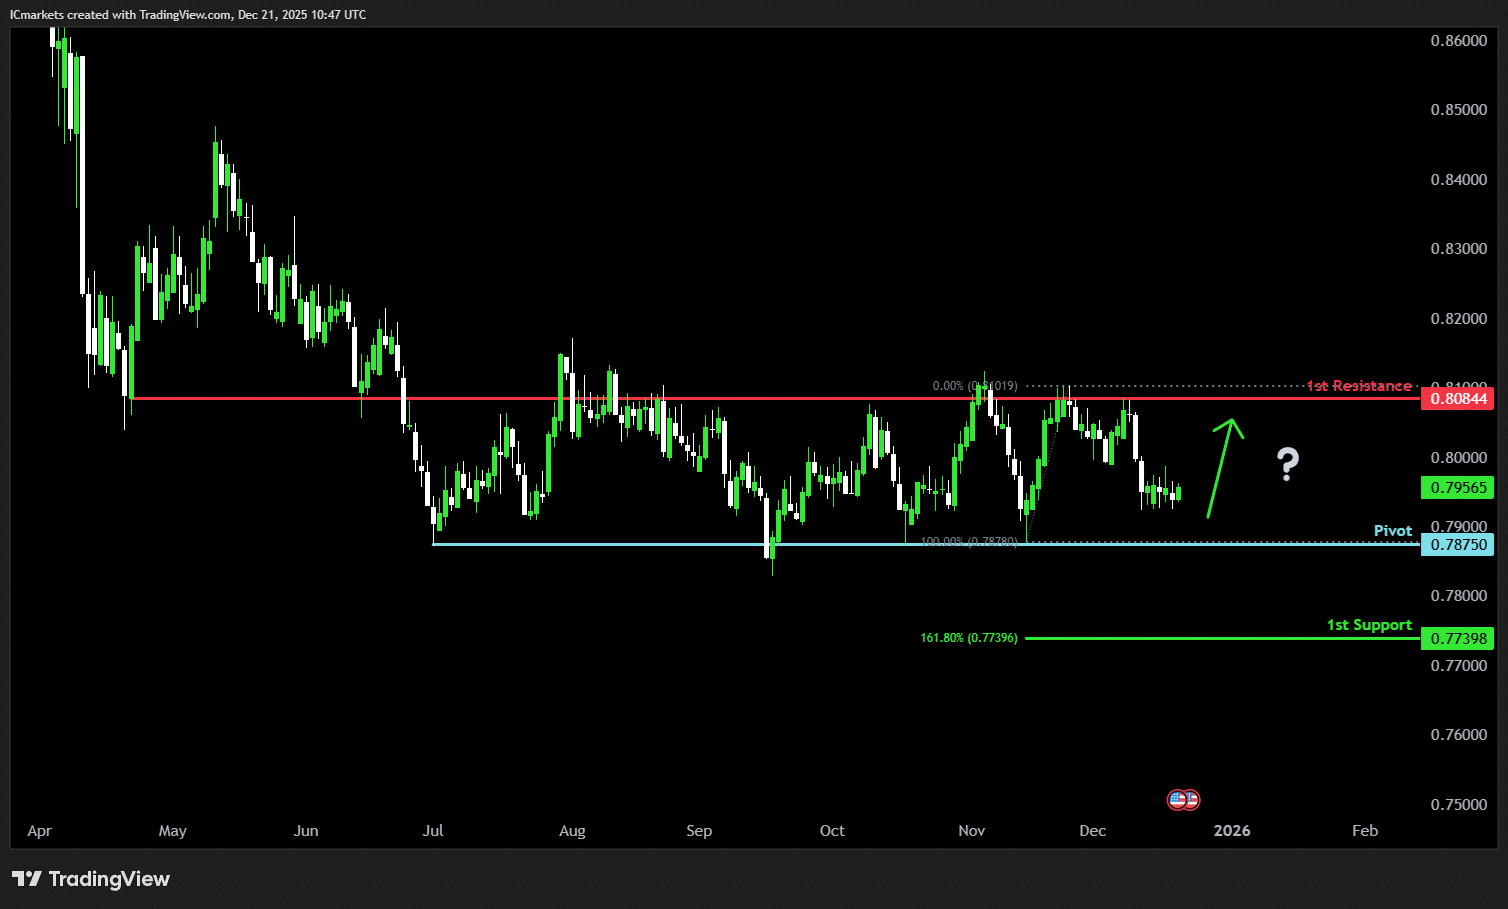
USD/CHF:
Potential Direction: Bullish
Overall momentum of the chart: Bearish
The price could see a short-term pullback toward the pivot before rising again toward the 1st resistance.
Pivot: 0.7875
Supporting reasons: Identified as an overlap support, where renewed buying pressure could emerge to push the price higher.
1st support: 0.7739
Supporting reasons: Identified as a support that is supported by the 161.8% Fibonacci extension, indicating a potential level where the price could stabilize once again.
1st resistance: 0.8084
Supporting reasons: Identified as an overlap resistance, indicating a potential level that could cap further upward movement.
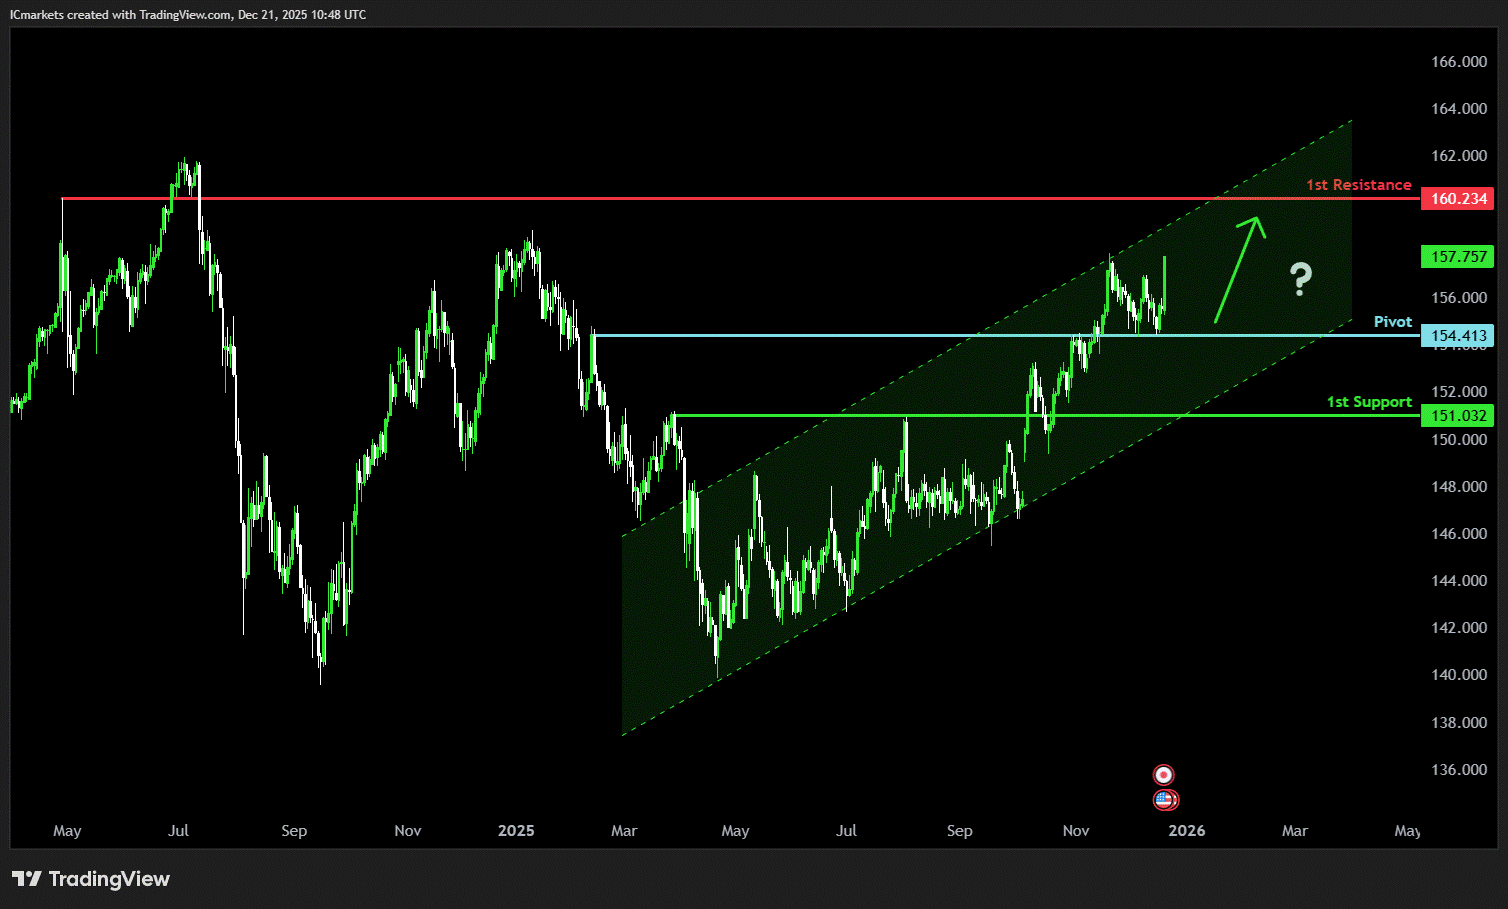
USD/JPY:
Potential Direction: Bullish
Overall momentum of the chart: Bullish
The price has already bounced off the pivot and may continue its bullish move toward the 1st resistance
Pivot: 154.41
Supporting reasons: Identified as a pullback support, where renewed buying pressure could emerge to push the price higher.
1st support: 151.03
Supporting reasons: Identified as a pullback support, indicating a strong area where buyers might return, and the price could stabilize once again.
1st resistance: 160.23
Supporting reasons: Identified as a pullback resistance. This level represents the next key area where upward movement could be capped amid increased selling pressure
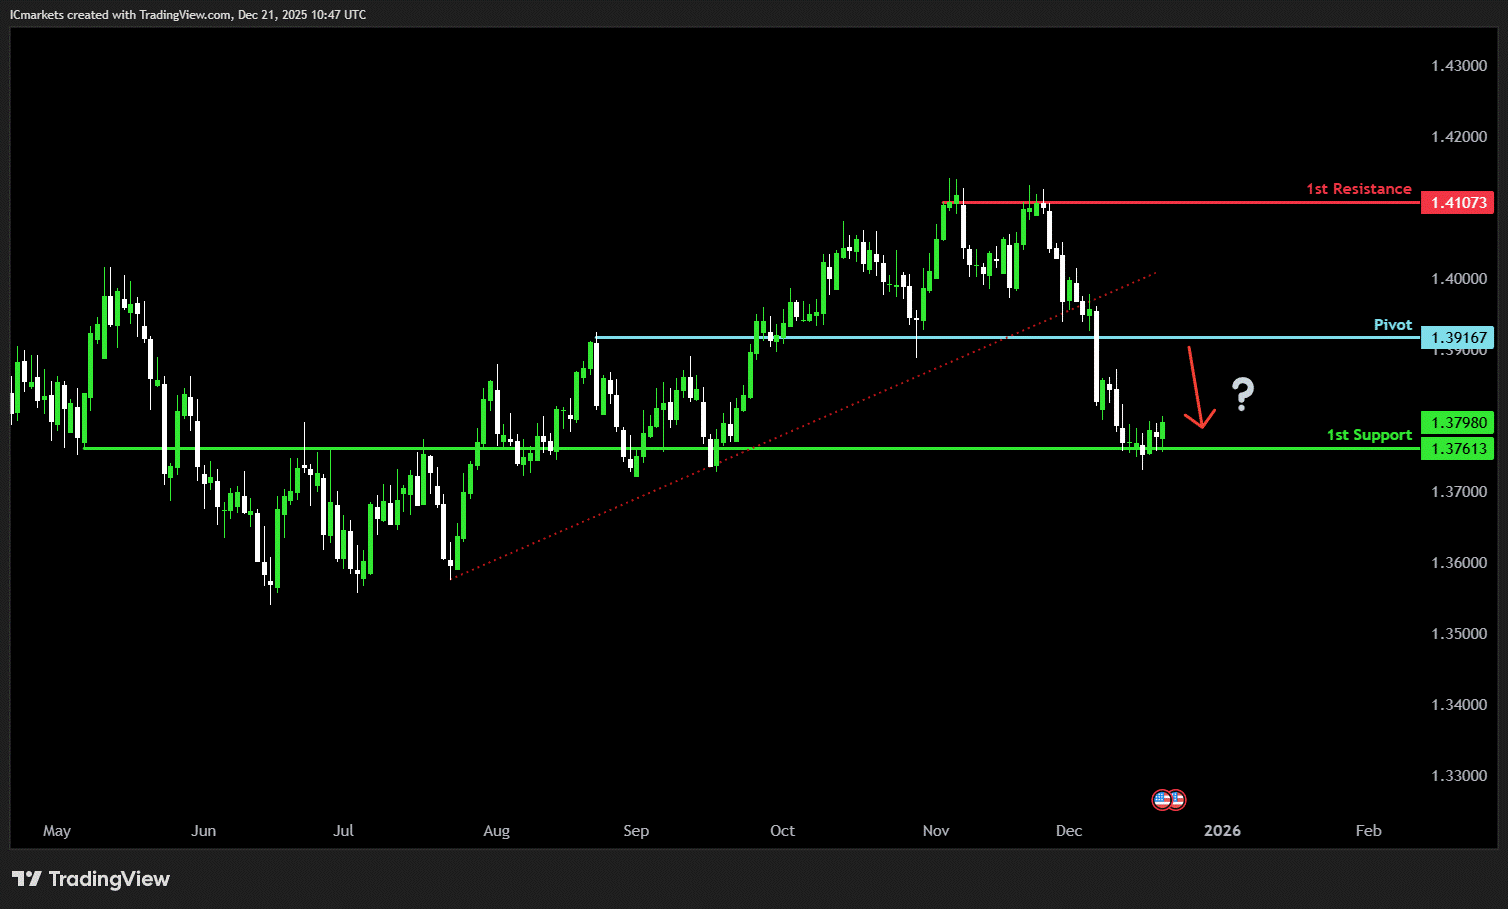
USD/CAD:
Potential Direction: Bearish
Overall momentum of the chart: Bearish
The price could see a short-term pullback toward the pivot before continuing its bearish move down toward the 1st support.
Pivot: 1.3916
Supporting reasons: Identified as a pullback resistance, where selling pressures could intensify and potentially cap any upward retracement.
1st support: 1.3761
Supporting reasons: Identified as an overlap support, indicating a key level where the price could stabilize once more.
1st resistance: 1.4107
Supporting reasons: Identified as a multi swing high resistance, making it a possible target for bullish advances and a level where some sellers could return to cap gains
AUD/USD:
Potential Direction: Bullish
Overall momentum of the chart: Bullish
The price could make a short-term pullback toward the pivot before rising again toward the 1st resistance
Pivot: 0.6538
Supporting reasons: Identified as a pullback support, where renewed buying pressure could emerge to push the price higher.
1st support: 0.6404
Supporting reasons: Identified as a pullback support, this area has provided strong support historically and may attract buying interest for a potential short-term bounce
1st resistance: 0.6681
Supporting reasons: Identified as a swing high resistance that aligns with the 161.8% Fibonacci extension, indicating a potential area that could halt any further upward movement.
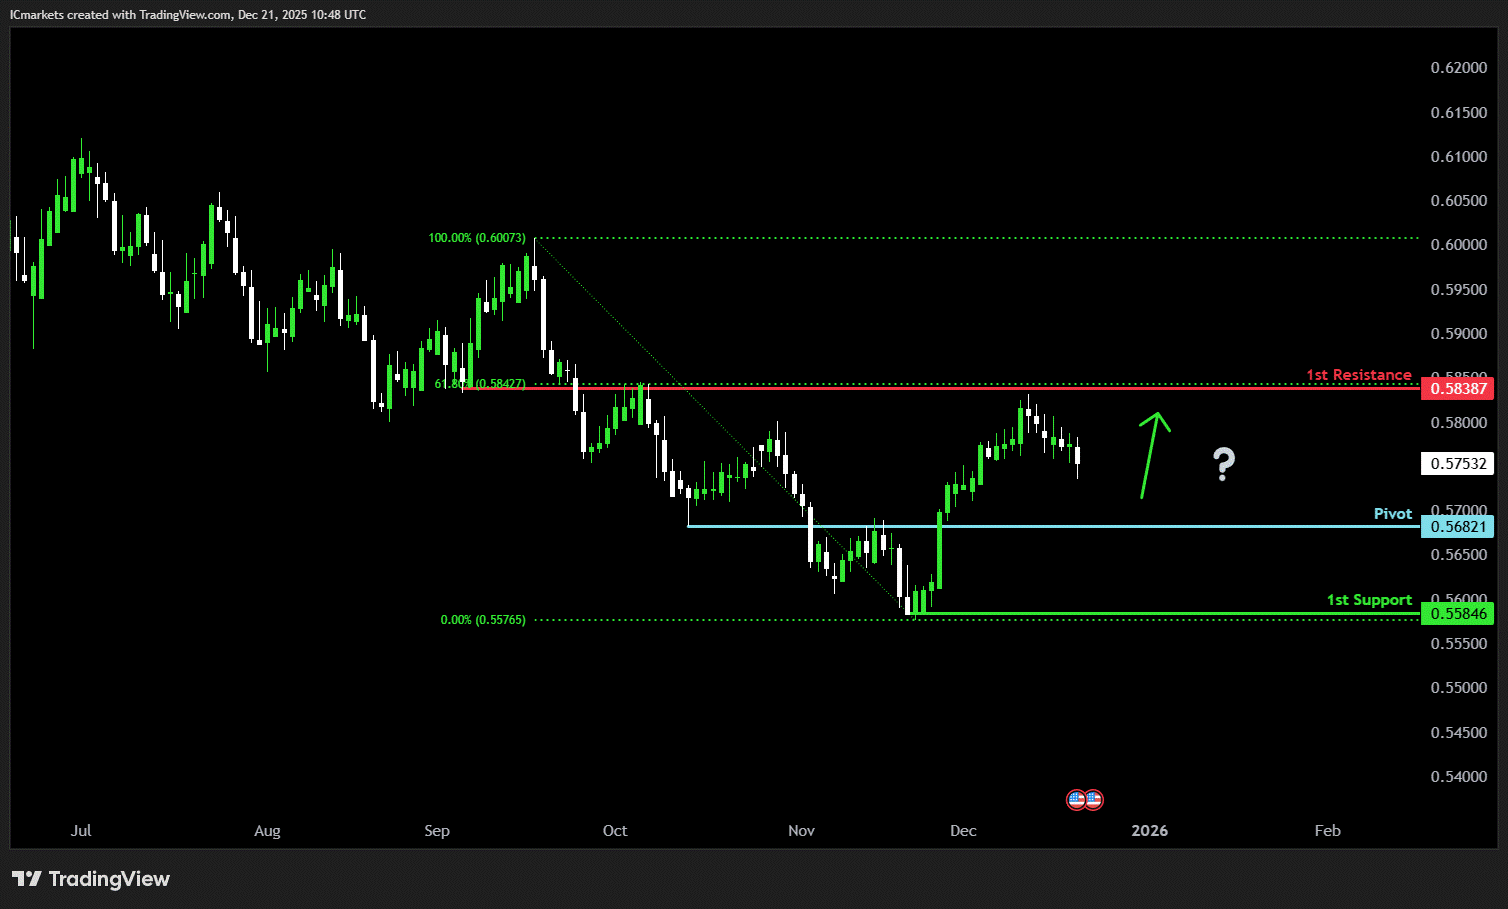
NZD/USD
Potential Direction: Bullish
Overall momentum of the chart: Bearish
The price could make a short-term pullback toward the pivot before rising again toward the 1st resistance
Pivot: 0.5682
Supporting reasons: Identified as a pullback support, where renewed buying pressure could emerge to push the price higher.
1st support: 0.5584
Supporting reasons: Identified as a swing low support, this area has provided strong support historically and may attract buying interest for a potential short-term bounce
1st resistance: 0.5838
Supporting reasons: Identified as an overlap resistance that aligns with the 61.8% Fibonacci retracement, indicating a potential area that could halt any further upward movement.
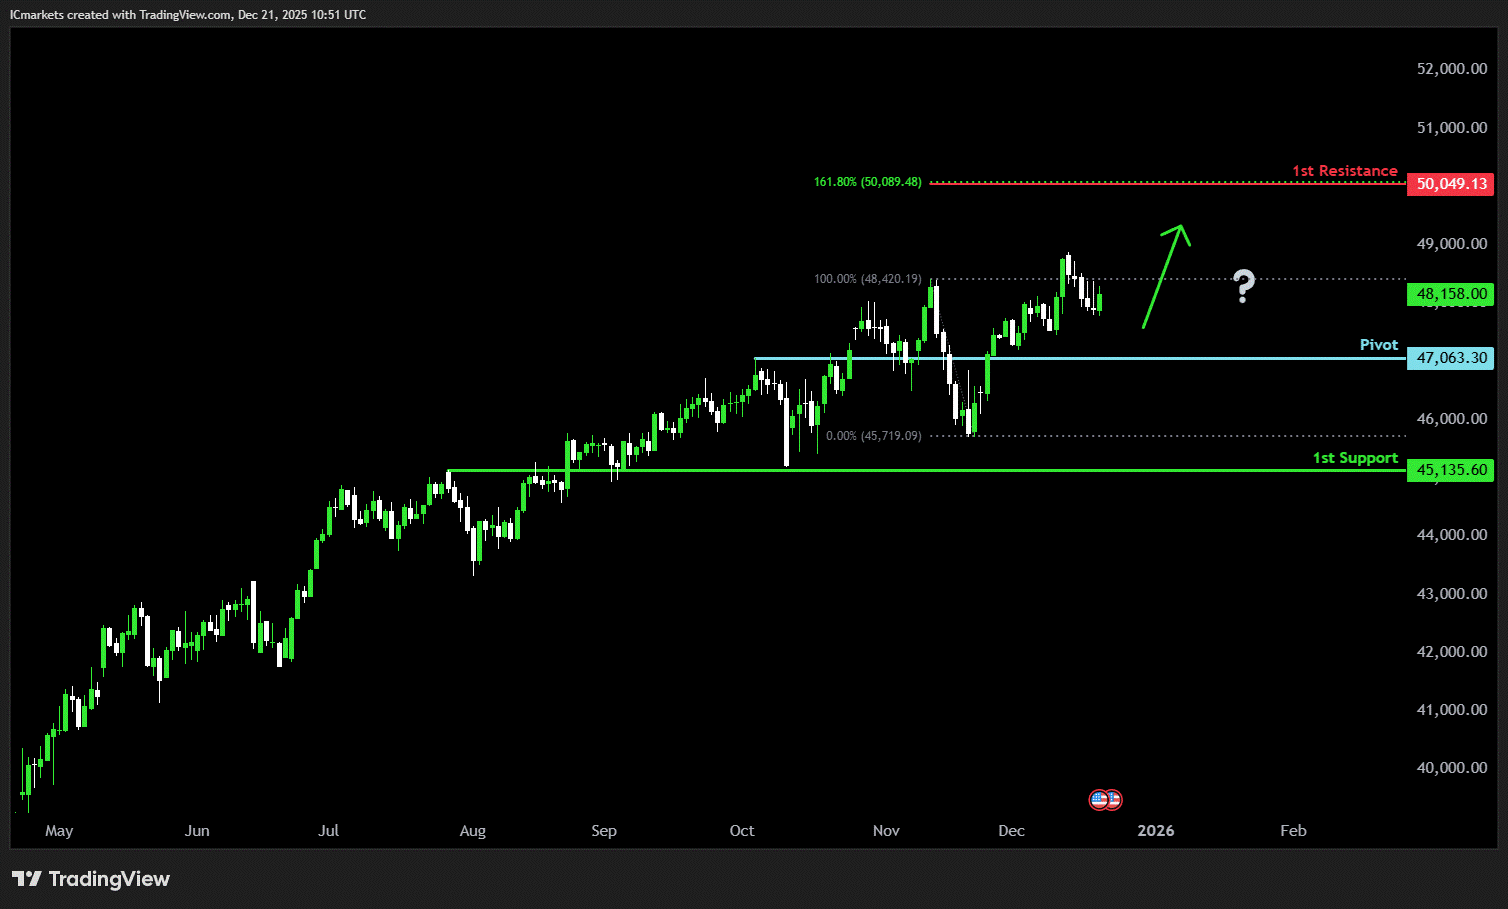
US30 (DJIA):
Potential Direction: Bullish
Overall momentum of the chart: Bullish
The price could make a short-term pullback toward the pivot before rising again toward the 1st resistance
Pivot: 47,063.30
Supporting reasons: Identified as a pullback support, where renewed buying pressure could emerge to push the price higher.
1st support: 45,135.60
Supporting reasons: Identified as an overlap support, suggesting a potential area where the price could stabilize once again.
1st resistance: 50,049.13
Supporting reasons: Identified as a resistance that is supported by the 161.8% Fibonacci extension, indicating a potential area that could halt any further upward movement.
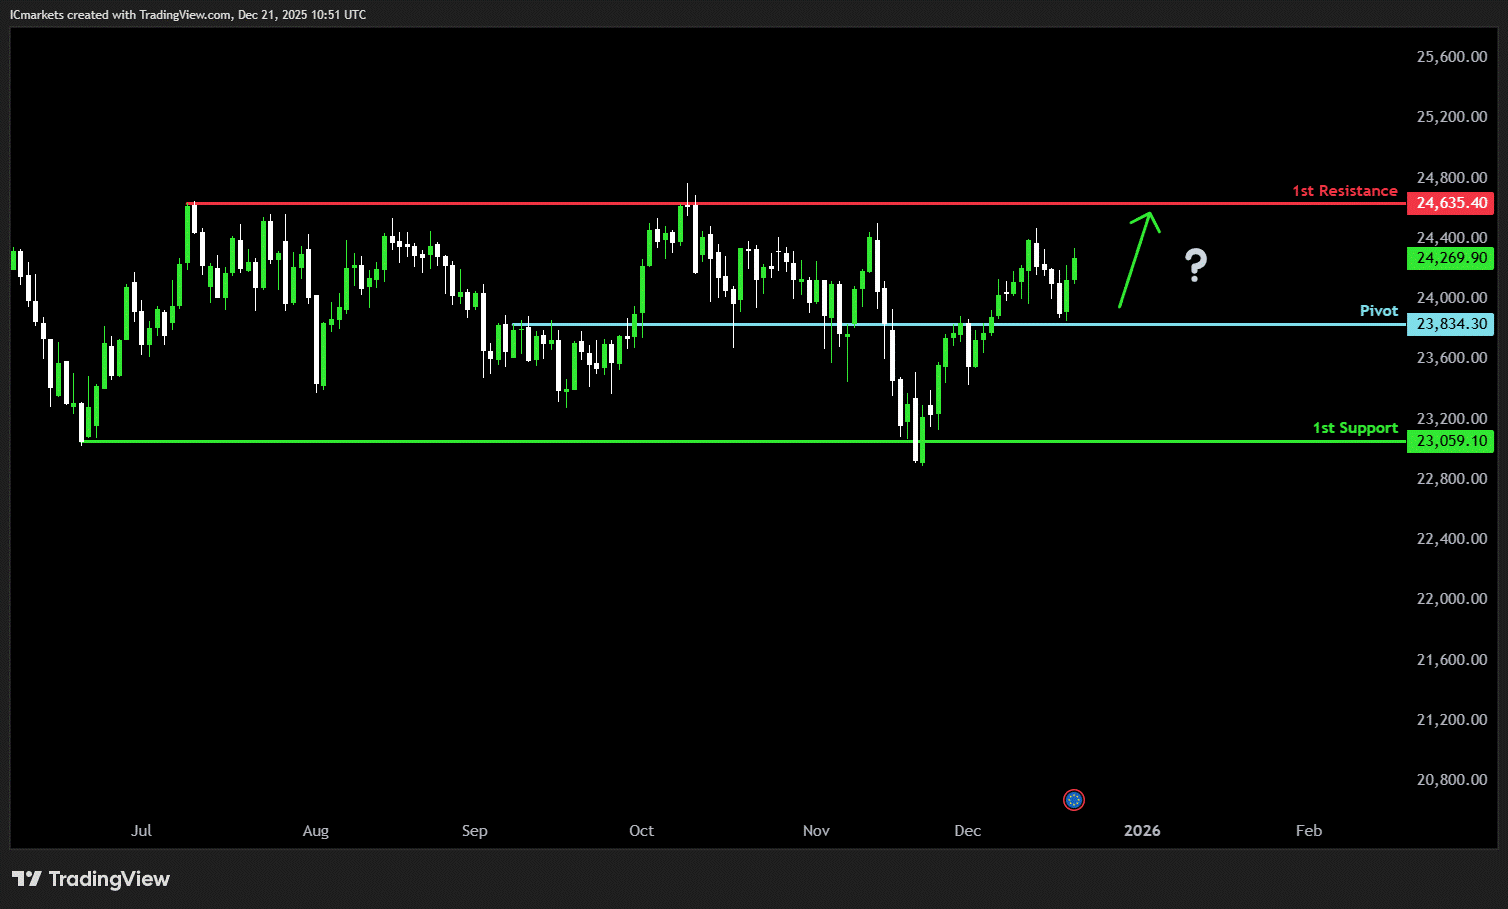
DE40 (DAX):
Potential Direction: Bullish
Overall momentum of the chart: Bullish
The price has already bounced off the pivot and may continue its bullish move toward the 1st resistance
Pivot: 23,834.30
Supporting reasons: Identified as a pullback support, where renewed buying pressure could emerge to push the price higher.
1st support: 23,059.30
Supporting reasons: Identified as a pullback support, indicating a key level where the price could stabilize once more.
1st resistance: 24,635.40
Supporting reasons: Identified as a multi-swing high resistance, indicating a potential area that could halt any further upward movement.
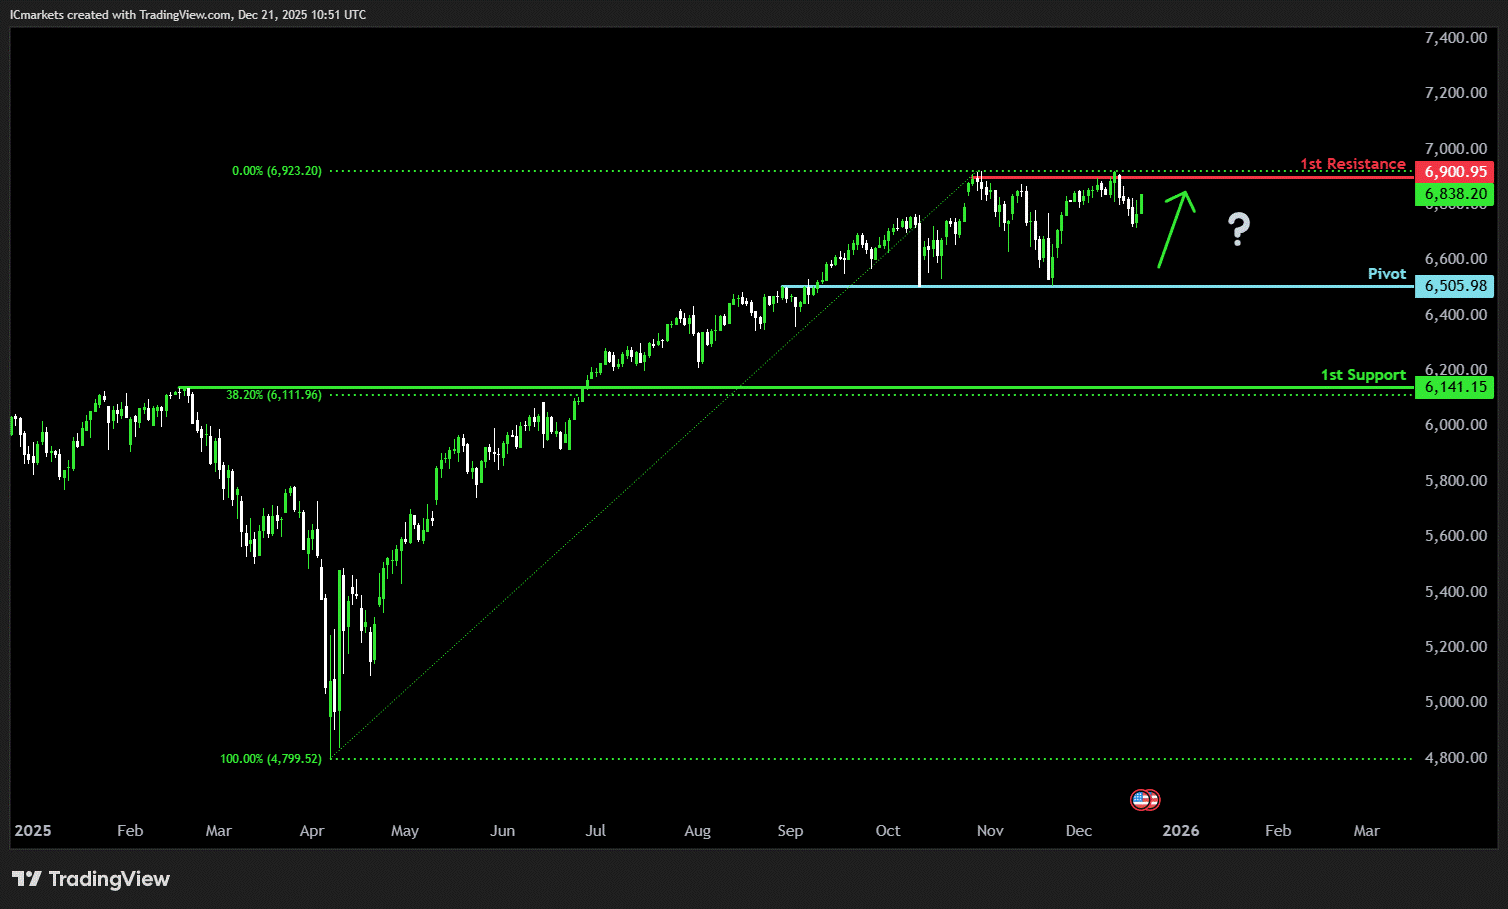
US500 (S&P 500):
Potential Direction: Bullish
Overall momentum of the chart: Bullish
The price could make a short-term pullback toward the pivot before rising again toward the 1st resistance
Pivot: 6,505.98
Supporting reasons: Identified as an overlap support, where renewed buying pressure could emerge to push the price higher.
1st support: 6,141.15
Supporting reasons: Identified as a pullback support that aligns with the 38.2% Fibonacci retracement, indicating a potential level where the price could stabilize once again.
1st resistance: 6,900.95
Supporting reasons: Identified as a swing high resistance, indicating a potential area that could halt any further upward movement.
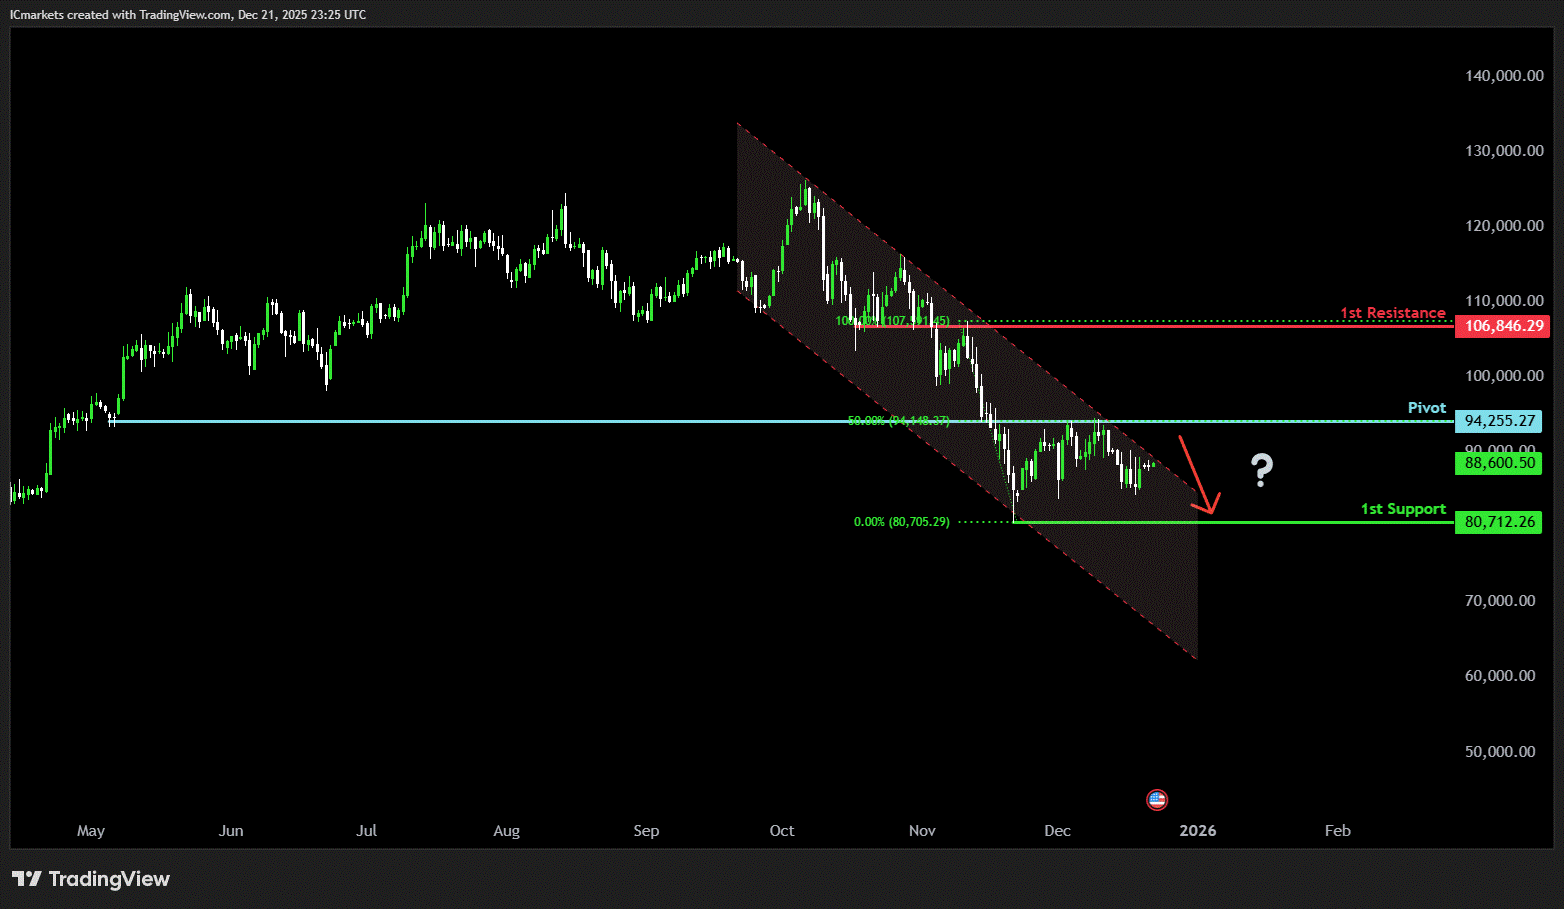
BTC/USD (Bitcoin):
Potential Direction: Bearish
Overall momentum of the chart: Bullish
The price has already reacted off the pivot and may continue its bearish move toward the 1st support.
Pivot: 94,255.27
Supporting reasons: Identified as a pullback resistance that aligns with the 50% Fibonacci retracement, where selling pressures could intensify and potentially cap any upward retracement.
1st support: 80,712.26
Supporting reasons: Identified as an overlap support, indicating a potential level where the price could stabilize once more.
1st resistance: 106,846.29
Supporting reasons: Identified as an overlap resistance, indicating a potential area that could halt any further upward movement.
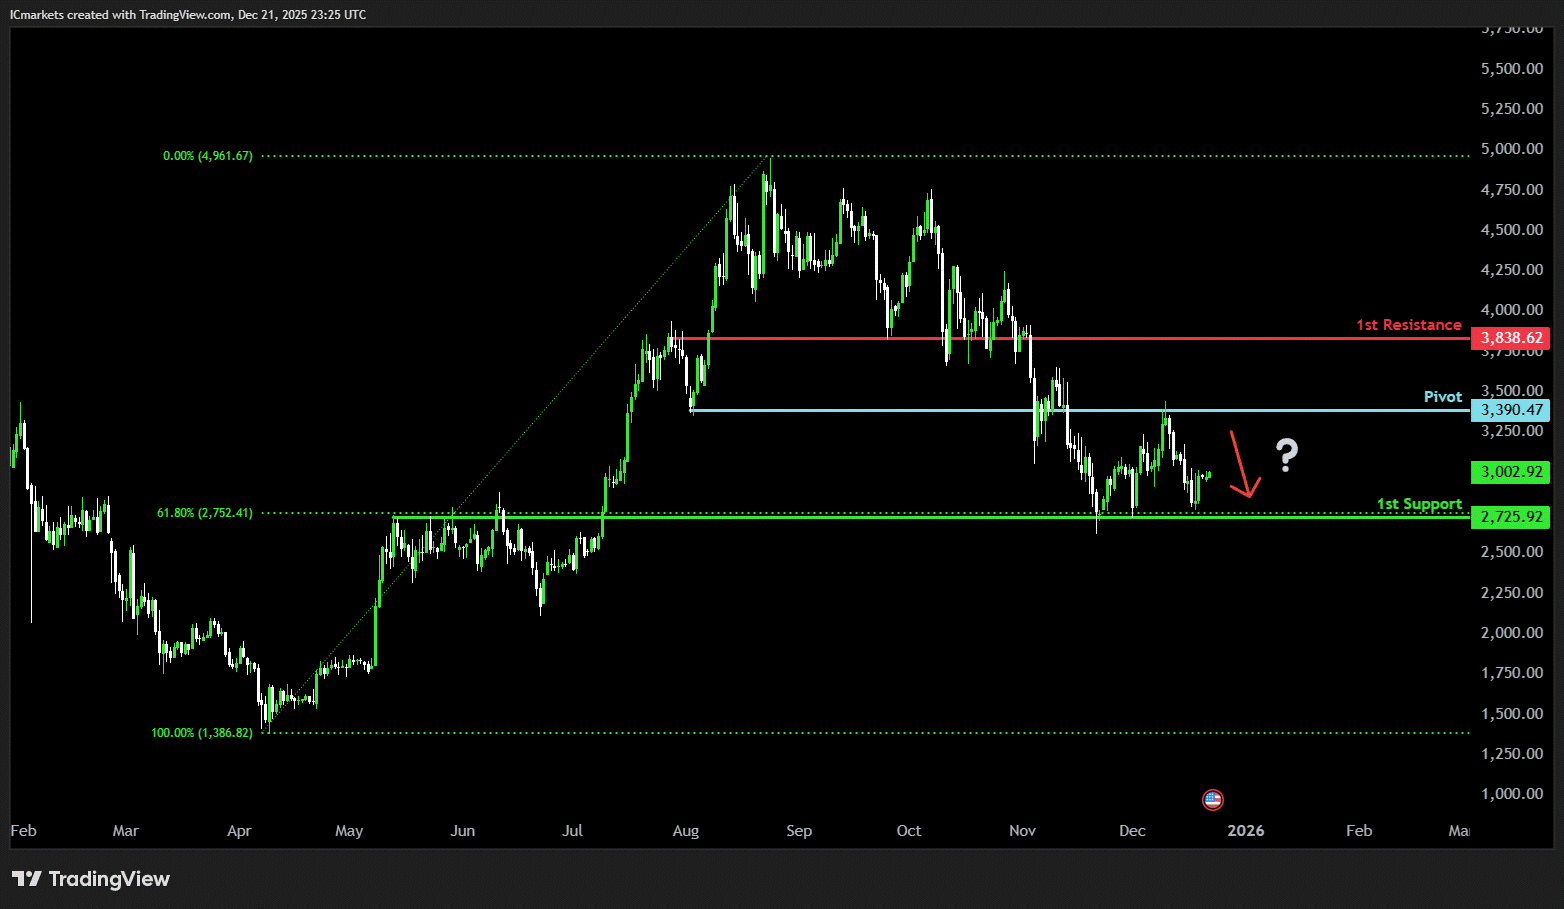
ETH/USD (Ethereum):
Potential Direction: Bearish
Overall momentum of the chart: Bullish
The price could see a short-term pullback toward the pivot before continuing its bearish move down toward the 1st support.
Pivot: 3,390.47
Supporting reasons: Identified as a pullback resistance, where selling pressures could intensify and potentially cap any upward retracement.
1st support: 2,725.92
Supporting reasons: Identified as an overlap support that aligns with the 61.8% Fibonacci retracement, indicating a potential level where the price could stabilize once more.
1st resistance: 3,838.62
Supporting reasons: Identified as a pullback resistance, indicating a potential area that could halt any further upward movement.
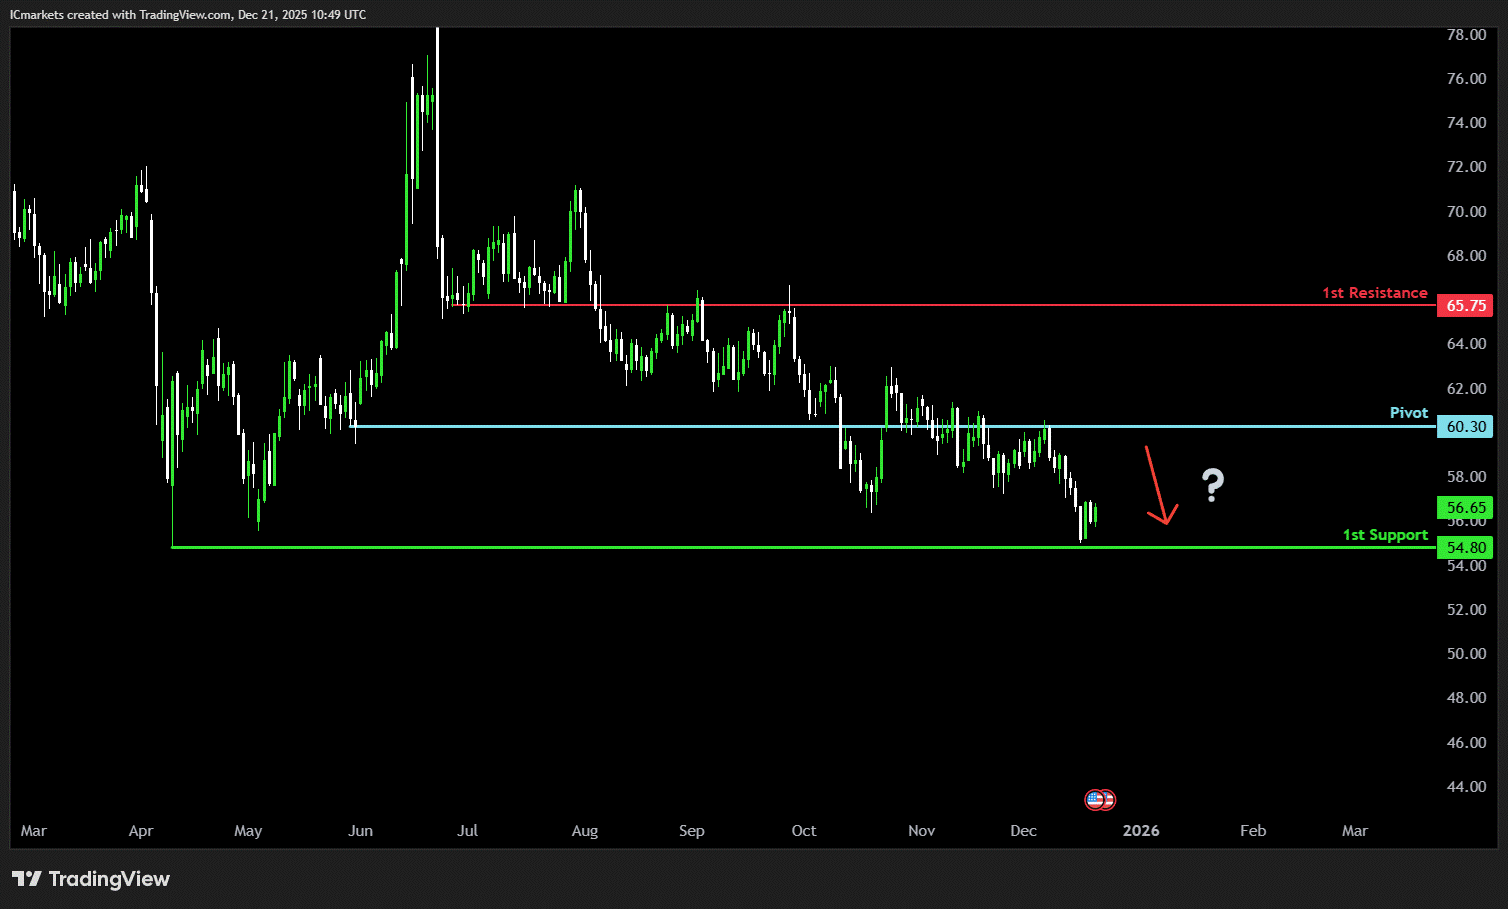
WTI/USD (Oil):
Potential Direction: Bearish
Overall momentum of the chart: Bullish
The price could see a short-term pullback toward the pivot before continuing its bearish move down toward the 1st support.
Pivot: 60.30
Supporting reasons: Identified as an overlap resistance, where selling pressures could intensify and potentially cap any upward retracement
1st support: 54.80
Supporting reasons: Identified as a swing low support, indicating a key level where the price could stabilize once more.
1st resistance: 65.75
Supporting reasons: Identified as an overlap resistance, indicating a potential area that could halt any further upward movement.
XAU/USD (GOLD):
Potential Direction: Bullish
Overall momentum of the chart: Bullish
The price could see a short-term pullback toward the pivot before rising again toward the 1st resistance.
Pivot: 4,244.72
Supporting reasons: Identified as a pullback support, where renewed buying pressure could emerge to push the price higher.
1st support: 4,041.68
Supporting reasons: Identified as a pullback support, indicating a key level where the price could stabilize once more.
1st resistance: 4,379.38
Supporting reasons: Identified as a swing resistance, indicating a potential area that could halt any further upward movement.

The accuracy, completeness and timeliness of the information contained on this site cannot be guaranteed. IC Markets Global does not warranty, guarantee or make any representations, or assume any liability regarding financial results based on the use of the information in the site.
News, views, opinions, recommendations and other information obtained from sources outside of www.icmarkets.com, used in this site are believed to be reliable, but we cannot guarantee their accuracy or completeness. All such information is subject to change at any time without notice. IC Markets Global assumes no responsibility for the content of any linked site.
The fact that such links may exist does not indicate approval or endorsement of any material contained on any linked site. IC Markets Global is not liable for any harm caused by the transmission, through accessing the services or information on this site, of a computer virus, or other computer code or programming device that might be used to access, delete, damage, disable, disrupt or otherwise impede in any manner, the operation of the site or of any user’s software, hardware, data or property.
The post Monday 22nd December 2025: Technical Outlook and Review first appeared on IC Markets | Official Blog.

IC Markets Global – Asia Fundamental Forecast | 22 December 2025
424740 December 22, 2025 14:14 ICMarkets Market News
IC Markets Global – Asia Fundamental Forecast | 22 December 2025
What happened in the U.S. session?
The latest U.S. session unfolded against a backdrop of solid but decelerating growth, with GDP and the near‑term data slate reinforcing a soft‑landing narrative and no fresh hawkish shock from the Fed. U.S. equity futures and cash indices stayed supported but not euphoric, with growth and AI‑linked names still carrying broader risk sentiment, while Treasuries traded sideways as decent activity data offset expectations for 2026 rate cuts. The dollar was range‑bound as traders awaited further confirmation from labor and inflation prints, leaving gold underpinned as a hedge and crude oil driven more by supply and geopolitical factors than by the latest macro releases.
What does it mean for the Asia Session?
Asian traders will be watching a light but important macro day centered on China’s loan prime rate decision, Hong Kong’s inflation and current account data, and the start of a week dominated by the People’s Bank of China and Western holiday‑thinned liquidity. The backdrop is an Asia still growing faster than the rest of the world, but navigating mixed momentum in Southeast Asia and a gradually tightening global financial environment.
The Dollar Index (DXY)
Key news events today
No major news event
What can we expect from DXY today?
Going into Monday, the Dollar is in a softening but stabilising phase: the DXY is parked just below 99, and broader Fed trade‑weighted gauges sit several percent below their 2024 peaks, reflecting the impact of Fed rate cuts, easing US inflation, and diminished yield support for the currency. With year‑end holidays thinning liquidity, this week’s Dollar trading is likely to feature choppy, headline‑driven moves around a gently weaker trend rather than a strong directional surge, as markets watch incoming Fed and data updates for confirmation that the easing cycle will continue in 2026.
Central Bank Notes:
- The Federal Open Market Committee (FOMC) is widely expected to lower the federal funds rate target range by 25 basis points to 3.50%–3.75% at its December 9–10, 2025, meeting, marking the third consecutive cut after the October reduction to 3.75%–4.00%
- The Committee continues to pursue maximum employment and 2% inflation goals, with the labor market showing further softening as the unemployment rate rose to 4.4% in September 2025 amid modest job gains.
- Officials note persistent downside risks to growth alongside resilient activity, with inflation easing to 3.0% year-over-year CPI in September but remaining elevated due to tariff effects; core PCE stands at around 2.8% as of October.
- Economic activity grew at a 3.8% annualized pace in Q2 2025 per revised estimates, though Q3 and Q4 face headwinds from trade tensions, fiscal restraint, and data disruptions like the government shutdown.
- September’s Summary of Economic Projections forecasts 2025 unemployment at a median 4.5%, with PCE inflation near 3.0% and core PCE at 3.1%, signaling a gradual disinflation path; updates expected on December 10 may adjust for higher unemployment and lower growth.
- The Committee maintained its data-dependent approach, noting a softening labor market and inflation above the 2% target, while deciding to lower the federal funds rate target range by 25 basis points to 3.50%-3.75%. Dissent persisted, with multiple members opposing the cut or advocating for a hold, reflecting divisions similar to recent meetings.
- The FOMC confirmed the conclusion of its quantitative tightening program effective December 1, 2025, with Treasury rolloff caps at $5 billion per month and agency MBS caps at $35 billion per month to ensure ample reserves and market stability.
- The next meeting is scheduled for 27 to 28 January 2026.
Next 24 Hours Bias
Medium Bearish
Gold (XAU)
Key news events today
No major news event
What can we expect from Gold today?
Going into Monday, gold remains one of the strongest major assets, consolidating just above 4,300 USD/oz and near record territory as traders navigate a seasonally thin, year‑end market. The metal’s resilience is being driven by a combination of softer U.S. inflation, earlier Fed rate cuts, and ongoing demand for safety and diversification, even as debate continues over how much further policy will ease in 2026.
Next 24 Hours Bias
Medium Bullish
The Australian Dollar (AUD)
Key news events today
No major news event
What can we expect from AUD today?
The Australian Dollar starts the week of Monday, trading slightly weaker but broadly range‑bound around the mid‑0.66 level against the US dollar, having given back part of its recent climb from below 0.66 as risk sentiment softened. Technical analyses describe a market caught between modest corrective upside and a still‑intact medium‑term downtrend, with resistance clustered near 0.6685–0.6750 and downside risk towards the low‑0.64s if rebounds fail.
Central Bank Notes:
- The Reserve Bank of Australia held its cash rate steady at 3.60% at the November 2025 policy meeting, adopting a cautious tone amid a surprise uptick in inflation data for the September quarter. This marks the fourth consecutive pause since the 25 basis point cut in August. The Board attributed some of the inflation rise to temporary factors like higher petrol prices and council rates, but noted signs of more persistent pressures from consumer demand.
- Policymakers emphasized vigilance on inflation, with trimmed mean inflation expected to remain elevated in the near term before nearing the 2–3% target midpoint by mid-2027. Recent data showed underlying inflation staying above target until at least the second half of 2026, prompting upward revisions to forecasts. Capacity pressures are seen as slightly more pronounced than previously assessed, delaying any easing.
- Headline CPI for the September quarter exceeded expectations, driven partly by temporary items, while underlying measures signal ongoing stickiness. The shift to monthly CPI reporting, with the first full edition in November 2025, will enhance real-time inflation monitoring. Housing and services remain resilient contributors to price pressures.
- Domestic demand shows firmness in services alongside below-trend growth elsewhere, with capacity pressures not expected to ease significantly. The labor market is gradually softening, with unemployment projected to stabilize around 4.4%, though wage growth and productivity dynamics keep unit labor costs a concern. Household spending faces headwinds from high borrowing costs.
- Global risks include geopolitical tensions and commodity volatility, set against modestly revised-up world growth outlooks. The Board describes its policy as mildly restrictive and data-dependent, balancing inflation control with employment goals. No rate hike was considered despite the inflation surprise.
- Monetary policy remains mildly restrictive to address lingering price stability risks amid household and global vulnerabilities. Communications reaffirm the dual mandate of 2–3% inflation and full employment, with readiness to adjust based on incoming data.
- Market expectations point to the cash rate holding through early 2026, with a possible modest cut to 3.3% mid-year if inflation eases as forecast. The new monthly CPI data will be key for timely insights.
- Monetary policy remains mildly restrictive, balancing progress on price stability against vulnerabilities in household demand and global outlook. Board communications reaffirm a dual mandate: price stability and full employment, while underscoring readiness to respond should risks materialize sharply.
- Analysts generally expect the cash rate to remain at current levels through early 2026, with only modest cuts possible later in the year if inflation moderates. The new monthly CPI release (first full edition Nov 2025) will be watched closely for timely signals on price trends.
- The next meeting is on 2 to 3 February 2026.
Next 24 Hours Bias
Medium Bullish
The Kiwi Dollar (NZD)
Key news events today
No major news event
What can we expect from NZD today?
The New Zealand dollar starts the week of Monday on the back foot, trading around the mid‑0.57s against the US dollar after slipping from recent highs, with charts still pointing to a mild downtrend and resistance in the high‑0.58s. Stronger‑than‑expected Q3 GDP has not translated into sustained NZD strength because spare capacity and subdued inflation mean markets no longer expect additional RBNZ hikes, especially after Governor Anna Breman signaled rates are likely on hold through 2026.
Central Bank Notes:
- The Monetary Policy Committee (MPC) left the Official Cash Rate (OCR) unchanged at 2.25% at its 26 November 2025 meeting, following the widely anticipated 25-basis-point reduction from 2.50%, and signaled that policy is now firmly in stimulatory territory while keeping the option of further easing on the table if needed.
- The decision was again reached by consensus, with members judging that the cumulative 325 basis points of easing over the past year warranted a period of assessment, even as several emphasized a willingness to cut further should incoming data point to a more protracted downturn or renewed disinflationary pressures.
- Headline consumer price inflation is projected to hover near 3% in late 2025 before gradually easing toward the 2% midpoint of the 1–3% target band through 2026, supported by contained inflation expectations around 2.3% over the two-year horizon and an expected pickup in spare capacity.
- The MPC noted that domestic demand remains subdued but shows tentative signs of stabilisation, with softer household spending and construction only partially offset by improving services activity; nevertheless, policymakers still expect services inflation to ease as wage growth moderates and the labour market loosens further over the coming year.
- Financial conditions continue to ease as wholesale and retail borrowing rates reprice to the lower OCR, contributing to gradually rising mortgage approvals and improving housing-related sentiment, although broader business credit growth remains patchy and sensitive to uncertainty about the durability of the recovery.
- Recent data confirm that GDP momentum is weak but not deteriorating as sharply as earlier in 2025, with high-frequency indicators pointing to a shallow recovery from a low base and ongoing headwinds from elevated living costs and fragile confidence weighing on discretionary consumption and investment.
- The MPC reiterated that external risks remain skewed to the downside, particularly from softer Chinese demand and uncertainty around United States trade policy, but noted that a lower New Zealand dollar continues to provide some offset via improved export competitiveness and support for tradables inflation.
- Looking ahead to early 2026, the Committee maintained a mild easing bias, indicating that a further cut toward 2.00–2.10% cannot be ruled out if activity fails to gain traction or if inflation undershoots projections, but current forecasts envisage the OCR remaining near 2.25% for an extended period provided inflation converges toward target and the recovery proceeds broadly as expected.
- The next meeting is on 18 February 2026.
Next 24 Hours Bias
Medium Bearish
The Japanese Yen (JPY)
Key news events today
No major news event
What can we expect from JPY today?
The Japanese yen is starting the week still on the back foot, trading around the mid‑150s per dollar as markets absorb the Bank of Japan’s latest rate increase to 0.75%, its highest policy rate in roughly three decades. The move has not produced lasting currency strength because traders doubt how aggressively the BoJ will tighten from here and remain focused on Japan’s deteriorating fiscal outlook under Prime Minister Takaichi’s expansive spending agenda.
Central Bank Notes:
- The Policy Board of the Bank of Japan will meet on 18–19 December with markets almost fully pricing a 25-basis-point hike, which would raise the short-term policy rate from 0.50% to around 0.75%, as the bank moves further away from its ultra-loose stance while stressing that any tightening will remain gradual and data-dependent.
- The BOJ is expected to continue guiding the uncollateralized overnight call rate in a narrow band around the new policy rate, near 0.75%, while signaling that the pace and timing of any additional hikes will depend on how past increases affect bank lending, corporate financing conditions, and overall economic activity.
- The quarterly path of JGB purchases remains on a pre-announced, gradual taper: outright purchases are being reduced by about ¥400 billion per quarter through March 2026, then by roughly ¥200 billion per quarter from April to June 2026, with the bank still aiming for JGB purchases to settle near ¥2 trillion in Q1 2027 and retaining flexibility to adjust the pace if market functioning or yield volatility deteriorate.
- Japan’s economy has softened in the near term, with Q3 2025 GDP contracting at an annualized pace of about 2.3% as weaker residential investment and external demand weighed on activity, even as business sentiment in manufacturing has recently improved to a roughly four-year high.
- Core consumer inflation (excluding fresh food) accelerated to around 3.0% year-on-year in October, up from 2.9% in September and remaining above the BOJ’s 2% target, while the “core-core” measure excluding both fresh food and energy rose to about 3.1%, underscoring persistent underlying price pressures.
- In the very near term, some input-cost pressures are easing as earlier import price surges fade, but services inflation linked to labor shortages, along with steady wage gains, continues to support broader price momentum; firms’ and households’ medium-term inflation expectations remain anchored slightly above 2%, keeping short-term inflation risks tilted to the upside.
- For the coming quarters, the BOJ assesses that real growth will likely run below potential as the economy digests tighter financial conditions and past yen depreciation, though accommodative real rates, positive real wage growth, and improving corporate sentiment should help sustain a modest recovery in private consumption and business investment.
- Over the medium term, as overseas demand stabilizes and domestic labor markets remain tight, the BOJ expects wage settlements and inflation expectations to keep core inflation on a gradual upward trajectory around or slightly above 2%, providing room for further cautious rate normalization as long as financial conditions remain supportive and the recovery is not derailed.
- The next meeting is scheduled for 22 to 23 January 2026.
Next 24 Hours Bias
Medium Bearish
Oil
Key news events today
No major news event
What can we expect from Oil today?
Oil starts Monday, with Brent hovering near 60 USD and WTI in the mid‑50s, recovering from recent multi‑year lows but still down roughly 18–20% over the past year as supply remains abundant. OPEC’s December report keeps its 2025–2026 demand growth projections steady around 1.3–1.4 million barrels per day, and OECD inventories, while somewhat below the pre‑pandemic five‑year average, are not tight enough to force a sustained rally.
Next 24 Hours Bias
Medium Bearish
The post IC Markets Global – Asia Fundamental Forecast | 22 December 2025 first appeared on IC Markets | Official Blog.
IC Markets Global – Europe Fundamental Forecast | 22 December 2025
424739 December 22, 2025 14:00 ICMarkets Market News
IC Markets Global – Europe Fundamental Forecast | 22 December 2025
What happened in the Asia session?
Asian markets rallied during the December 22 session, fueled by steady PBOC loan rates and US tech momentum, boosting equities like Nikkei and KOSPI while yen and bonds faced selling pressure in thin holiday trade. Asian equity indices led the moves, with Japan’s Nikkei 225 up 1.5-1.86%, South Korea’s KOSPI rising 1.9%, and Australia’s S&P/ASX 200 gaining 0.83%. The Japanese yen weakened to an all-time low against the euro and Swiss franc despite BOJ’s recent rate hike to 0.75%, pressuring JGB yields higher (10-year up 2.5 bps)
What does it mean for the Europe & US sessions?
With thin holiday trading, watch US GDP tomorrow, recent PMI divergences, and Fed minutes for rate path hints amid easing expectations and geopolitical oil risks; expect range-bound action with volatility spikes. US releases include the initial Q3 GDP estimate on December 23 (postponed from advance due to shutdown), alongside consumer confidence and possibly PCE inflation metrics. Markets anticipate scrutiny for Fed easing clues after recent rate cuts to 3.5-3.75%. Industrial production for October-November and durable goods orders also loom.
The Dollar Index (DXY)
Key news events today
No major news event
What can we expect from DXY today?
The US Dollar exhibits modest stability with the DXY at 98.65, buoyed by market digestion of low inflation prints despite looming Fed easing. The dollar has weakened 1.43% over the past month and 8.27% over the last year, influenced by softer US inflation data (November CPI at 2.7%) and expectations of Federal Reserve rate cuts in 2026. In Taipei trading, the USD fell slightly to NT$31.503, down NT$0.023.
Central Bank Notes:
- The Federal Open Market Committee (FOMC) is widely expected to lower the federal funds rate target range by 25 basis points to 3.50%–3.75% at its December 9–10, 2025, meeting, marking the third consecutive cut after the October reduction to 3.75%–4.00%
- The Committee continues to pursue maximum employment and 2% inflation goals, with the labour market showing further softening as the unemployment rate rose to 4.4% in September 2025 amid modest job gains.
- Officials note persistent downside risks to growth alongside resilient activity, with inflation easing to 3.0% year-over-year CPI in September but remaining elevated due to tariff effects; core PCE stands at around 2.8% as of October.
- Economic activity grew at a 3.8% annualized pace in Q2 2025 per revised estimates, though Q3 and Q4 face headwinds from trade tensions, fiscal restraint, and data disruptions like the government shutdown.
- September’s Summary of Economic Projections forecasts 2025 unemployment at a median 4.5%, with PCE inflation near 3.0% and core PCE at 3.1%, signalling a gradual disinflation path; updates expected on December 10 may adjust for higher unemployment and lower growth.
- The Committee maintained its data-dependent approach, noting a softening labour market and inflation above the 2% target, while deciding to lower the federal funds rate target range by 25 basis points to 3.50%-3.75%. Dissent persisted, with multiple members opposing the cut or advocating for a hold, reflecting divisions similar to recent meetings.
- The FOMC confirmed the conclusion of its quantitative tightening program effective December 1, 2025, with Treasury rolloff caps at $5 billion per month and agency MBS caps at $35 billion per month to ensure ample reserves and market stability.
- The next meeting is scheduled for 27 to 28 January 2026.
Next 24 Hours Bias
Medium Bearish
Gold (XAU)
Key news events today
No major news event
What can we expect from Gold today?
Gold hit intraday peaks, attacking $4,380 resistance, supported by bullish momentum above key EMAs and positive RSI signals, though analysts note risks of pullbacks if support breaks below $4,045. Weekly outlooks emphasize “buy on dip” strategies amid high RSI levels and upcoming US data like the Chicago Fed indices.
Next 24 Hours Bias
Medium Bullish
The Euro (EUR)
Key news events today
No major news event
What can we expect from EUR today?
The euro saw modest gains against the US dollar, trading around 1.1717 amid thin holiday trading volumes and ongoing market anticipation for year-end developments. French lawmakers’ failure to approve the 2026 budget has raised concerns over fiscal policy, with Prime Minister Sebastian Loro planning talks starting Monday to address a 5.4% deficit, potentially pressuring the euro through uncertainty in the eurozone’s second-largest economy.
Central Bank Notes:
- The Governing Council of the ECB is widely expected to keep the three key interest rates unchanged at its 17–18 December 2025 meeting, maintaining the main refinancing rate at 2.15%, the marginal lending facility at 2.40% and the deposit facility at 2.00%. This would reflect policymakers’ assessment that the current policy stance remains broadly consistent with medium‑term price stability, while inflation hovers close to the 2% target and the economy expands at a modest pace. Market pricing and recent ECB commentary suggest a high “option value” in staying on hold, with no clear pre‑set path for the next move amid two‑sided risks around growth and inflation.
- Recent indicators point to broadly stable price dynamics around the ECB’s target. Headline HICP inflation is projected to hover near 2% through late 2025, with earlier energy‑related disinflation largely behind and food price pressures contained compared with previous years. Services and wage inflation remain somewhat firmer than anticipated, but the trend is one of gradual moderation, consistent with a scenario in which inflation stabilizes around but not persistently above 2% over the medium term.
- Eurosystem staff projections to be released in December are expected to show only small revisions from the September exercise, maintaining a profile of headline inflation close to 2% in 2025, dipping slightly below in 2026, and returning near target in 2027. Soft producer prices, fading pipeline cost pressures, and anchored long‑term inflation expectations limit upside risks, though officials continue to flag uncertainty from geopolitical tensions, commodity price shocks, and fiscal policy choices.
- Euro area GDP growth remains subdued but resilient, with most forecasters and survey‑based indicators pointing to an expansion around 1 — 1.25% in 2025 and 2026, followed by a similar pace into 2027. PMIs and confidence surveys suggest activity has stabilised after earlier weakness, with modest support from public investment and improving external demand offsetting soft private consumption and investment.
- The labour market remains tight in aggregate, with unemployment rates close to multi‑decade lows and participation relatively high, even as job creation has slowed from its earlier peak. Real income growth has turned slightly positive again as inflation normalises, underpinning household spending, while financing conditions, though tighter than in the pre‑hiking era, remain consistent with a gradual expansion in credit to households and firms.
- Business sentiment is mixed, reflecting uncertainty around global trade, the policy outlook in the United States, and the potential impact of future tariff or industrial policy shifts. At the same time, easing supply‑chain costs and a relatively competitive euro exchange rate versus major trading partners provide support to manufacturing and export‑oriented sectors at the margin.
- The Governing Council is expected to reiterate that future decisions will remain data-dependent and taken meeting by meeting, based on an integrated assessment of the inflation outlook, the dynamics of underlying inflation, and the strength of monetary policy transmission. Officials have recently stressed that both further hikes and eventual cuts remain contingent on incoming data, implying no commitment to a particular path and a readiness to adjust if inflation or growth diverge materially from baseline projections.
- Balance sheet normalisation is set to continue gradually and predictably, with the stock of assets under the APP and PEPP declining as reinvestments have already been halted or scaled back in line with prior guidance. The ECB is expected to confirm that the current pace of portfolio runoff remains appropriate, supporting a slow withdrawal of monetary accommodation without disrupting market functioning.
- The next meeting is on 4 to 5 January 2026
Next 24 Hours Bias
Medium Bullish
The Swiss Franc (CHF)
Key news events today
No major news event
What can we expect from CHF today?
The Swiss franc (CHF) remains strong against the USD today, with the USD/CHF exchange rate around 0.7947-0.7960, reflecting a slight daily dip but ongoing appreciation amid safe-haven demand and SNB policy stability. Recent SNB decisions to hold interest rates at 0%—despite lower-than-expected inflation—have bolstered the franc, as policymakers signal reluctance for negative rates while noting gradual inflation upticks ahead.
Central Bank Notes:
- At its 11 December 2025 monetary policy assessment, the Swiss National Bank (SNB) is widely expected to leave the policy rate unchanged at 0%, extending the pause that began in September as the Governing Board judges that current settings are sufficient to keep inflation near, but still below, its target while avoiding an unnecessary move into negative rates.
- Recent data show that the tentative rebound in Swiss inflation has stalled, with headline CPI easing from 0.1% year‑on‑year in October to 0.0% in November and core inflation slipping to about 0.4%, reinforcing the view that underlying price pressures remain very weak and that deflation risks, while contained, have not fully disappeared.
- The SNB’s conditional inflation forecast is likely to remain close to the September projections, with inflation still seen averaging roughly 0.2% in 2025, 0.5% in 2026, and 0.7% in 2027 under an unchanged policy rate path, though the latest CPI prints argue for a slightly lower near‑term profile and keep open the option of renewed easing if activity or prices weaken further.
- The global backdrop has deteriorated further, as continuing U.S. tariff actions and softer external demand weigh on world trade, while uncertainty in key European and U.S. markets for Swiss exports persists, leaving the SNB cautious about the growth outlook despite Switzerland’s relatively resilient domestic demand.
- Business and labour-market sentiment in export‑oriented manufacturing remains subdued, with firms reporting pressure on margins from the still‑strong franc and softer foreign orders, although the broader economy is still expected to grow at around 1–1.5% in 2025 and unemployment only drifting up gradually from low levels.
- The SNB continues to stress its willingness to act if deflation risks re‑emerge, reiterating that it can ease policy through renewed rate cuts or targeted foreign‑exchange intervention if necessary, while also highlighting its commitment to transparent communication, including the publication of detailed minutes from recent assessments and ongoing dialogue with international partners on FX policy
The next meeting is on 19 March 2026.
Next 24 Hours Bias
Medium Bullish
The Pound (GBP)
Key news events today
No major news event
What can we expect from GBP today?
The British pound (GBP) shows mixed signals today, with GBP/USD trading around 1.3390-1.3400 amid holiday-thin volumes and anticipation for UK Q3 GDP data. Recent forecasts point to a potential bullish correction testing resistance near 1.3515 before a possible decline toward 1.2845, influenced by ongoing sideways movement between 1.3280 and 1.3449 despite key UK and US economic releases last week.
Central Bank Notes:
- The Bank of England’s Monetary Policy Committee (MPC) will meet on 18 December 2025, with the current Bank Rate standing at 4.00 per cent after being held in a close 5–4 vote at the 5 November meeting. Market pricing and analyst commentary point to a high risk of a 25‑basis‑point cut to 3.75 per cent, but this remains conditional on incoming inflation and labour‑market data, so the December note should be treated as pre‑decision guidance rather than an ex‑post summary.
- The BoE is expected to leave its quantitative tightening (QT) framework broadly unchanged through year‑end, maintaining the lower reduction pace in gilt holdings that was set earlier in 2025. Official communications still characterise the existing QT path as consistent with a restrictive stance, with policymakers stressing that balance‑sheet reduction will remain gradual and sensitive to market‑liquidity conditions.
- Headline CPI inflation eased to 3.6 per cent year‑on‑year in October 2025, down from 3.8 per cent in September, helped by softer energy and goods prices, though it remains almost twice the 2 per cent target. Underlying inflation pressures, particularly in services, have continued to moderate only slowly, so the MPC’s central projection still envisages inflation moving closer to, but not yet reaching, 3 per cent over the course of 2026, contingent on further normalisation in energy and wage dynamics.
- UK economic activity remains weak heading into the December meeting, with the labour market showing further signs of slackening. The unemployment rate has risen toward just above 5 per cent on the latest three‑month figures to October, while overall regular pay growth has slowed to around the mid‑4 per cent range, reinforcing the view that domestic cost pressures are gradually easing.
- External conditions continue to cloud the outlook, with fragile global growth and fluctuating commodity prices contributing to bouts of financial‑market volatility. The MPC has highlighted that renewed global energy or food price shocks could temporarily slow the pace of disinflation, but such risks are currently judged unlikely to derail the medium‑term downward trajectory for inflation if domestic demand stays subdued.
- The balance of risks around the inflation outlook remains finely poised. Downside risks are linked to persistently weak domestic demand and rising unemployment, while upside risks come from still‑elevated inflation expectations, sticky services inflation, and the possibility that structural changes in the labour market leave less slack than conventional indicators suggest.
- Overall, the MPC’s stance going into December is restrictive but increasingly open to a gradual easing cycle, with any rate cuts expected to be measured and data‑dependent. Policymakers have reiterated that the Bank Rate will need to stay in restrictive territory until they are confident inflation is on a sustainable path back to the 2 per cent target, and they have signalled that the profile of cuts, once started, is likely to be shallow rather than rapid.
- The next meeting is on 5 February 2026.
Next 24 Hours Bias
Medium Bullish
The Canadian Dollar (CAD)
Key news events today
No major news event
What can we expect from CAD today?
The Canadian dollar (CAD) traded slightly lower against the US dollar, with the USD/CAD exchange rate at 1.3796, down 0.05% from the prior session amid steady Canadian inflation data and expectations of Bank of Canada stability contrasting softer US policy outlooks. Over the past month, the CAD has strengthened by 2.21%, reflecting gains from oil price support and recent economic resilience, though forecasts suggest it may hover around 1.38 by quarter-end before potentially easing to 1.36 in 12 months
Central Bank Notes:
- The Governing Council left the target for the overnight rate unchanged at 2.25% at its 10 December 2025 meeting, in line with market expectations and signalling that the earlier easing cycle has likely concluded. The Bank noted that while global tariff tensions and trade uncertainty persist, the external backdrop has stabilised somewhat, reducing the need for additional insurance cuts even as world trade remains fragile.
- The Council acknowledged that uncertainty around U.S. trade policy and tariffs continues to weigh on business sentiment, but recent data show Canadian manufacturing and goods exports holding up better than anticipated. Surveys cited by the Bank suggest export order books have stopped deteriorating, with firms reporting some rebuilding of backlogs despite still‑cautious capital spending plans.
- Canada’s economy rebounded more strongly than expected in the third quarter, with real GDP expanding at an annualised pace of about 2.6% after a 1.8% contraction in Q2, largely on the back of higher crude exports and government spending. Monthly data show output rising 0.2% in September, though flash estimates point to a softer start to Q4 as some sectors give back earlier gains.
- Service sector activity has firmed, with indicators showing the services PMI back above the 50 threshold and broadening gains in business and professional services. However, consumer-facing categories remain mixed, as still‑elevated price levels and only modest real income growth keep a lid on discretionary spending even as tourism and technology‑related services expand.
- Housing markets have continued to stabilise, with national resale activity and prices edging higher through the autumn alongside the earlier decline in borrowing costs. The Bank noted that while some major urban centres are seeing renewed price pressures, tighter underwriting standards and still‑high affordability constraints are expected to cap the pace of any rebound.
- Headline CPI inflation eased to 2.2% year over year in October and is estimated to have remained near that rate in November, keeping it slightly above the 2% target but comfortably within the 1%–3% control range. Core measures have drifted lower, with CPI‑median and CPI‑trim around 3% or below, reinforcing the assessment that underlying price pressures are gradually moderating even as gasoline and some shelter components remain volatile.
- The Governing Council reiterated that the current policy rate is “about the right level” to keep inflation close to target while supporting the economy through a period of structural adjustment, and it signalled a shift away from near‑term easing expectations. While the Bank did not rule out future adjustments, officials stressed that, barring a material downside surprise to growth or inflation, further rate cuts are unlikely before 2026, and attention is now focused on the durability of the recovery and the evolution of core inflation.
- The next meeting is on 28 January 2026.
Next 24 Hours Bias
Medium Bullish
Oil
Key news events today
No major news event
What can we expect from Oil today?
Oil markets saw early gains as US forces boarded a Venezuelan tanker and pursued another amid President Trump’s blockade, lifting Brent to near $61 and WTI to $57 despite a yearly 21% WTI drop from oversupply fears. Russia-Ukraine talks and OPEC+ dynamics fueled volatility, but IEA’s 2026 surplus projection of 3.8 million bpd underscores bearish pressures, with prices testing key supports below $55-56.
Next 24 Hours Bias
Medium Bearish
The post IC Markets Global – Europe Fundamental Forecast | 22 December 2025 first appeared on IC Markets | Official Blog.
Monday 22nd December 2025: Asian Markets Advance on Strong Wall Street Cues and Tech-Led Optimism
424738 December 22, 2025 14:00 ICMarkets Market News
Global Markets:
- Asian Stock Markets : Nikkei up 1.80%, Shanghai Composite up 0.64%, Hang Seng up 0.35% ASX up 0.81%
- Commodities : Gold at $4,421.90 (0.81%), Silver at $69.317 (2.74%), Brent Oil at $60.90 (0.71%), WTI Oil at $56.94 (0.74%)
- Rates : US 10-year yield at 4.169, UK 10-year yield at 4.5290, Germany 10-year yield at 2.8925
News & Data:
- (CAD) Core Retail Sales m/m -0.6% to 0.0% expected
- (CAD) Retail Sales m/m -0.2% to 0.0% expected
Markets Update:
Asian stock markets are trading mostly higher on Monday, supported by strong cues from Wall Street on Friday, where technology stocks rallied on solid earnings and easing concerns over a tech bubble. Continued optimism about further monetary easing by the U.S. Federal Reserve, following softer inflation data, also lifted investor sentiment. Asian markets had ended mostly higher on Friday.
The Australian market is notably higher, extending gains from the previous two sessions. The benchmark S&P/ASX 200 is moving well above the 8,650 level, led by strength in mining and technology stocks. The index is up nearly 1 percent, while the broader All Ordinaries Index is also higher. Major miners such as BHP Group, Rio Tinto and Fortescue are advancing, alongside broad gains in energy and gold stocks. Technology shares show mixed performance, though Appen and Block are posting strong gains. Banking stocks are largely steady. The Australian dollar is trading near $0.661.
In Japan, stocks are sharply higher, with the Nikkei 225 surging close to 2 percent and moving well above the 50,450 level. Gains are led by index heavyweights, financials and technology stocks, including strong advances in SoftBank Group and Tokyo Electron.
Elsewhere in Asia, South Korea and Taiwan are leading gains, while most regional markets are modestly higher.
On Wall Street, stocks closed strongly higher on Friday, with the Nasdaq hitting fresh highs, supported by technology shares. European markets also ended mostly higher. Meanwhile, crude oil prices edged up amid concerns over potential supply disruptions linked to U.S.-Venezuela tensions.
Upcoming Events:
- 01:30 PM GMT – CAD IPPI m/m
- 01:30 PM GMT – CAD RMPI m/m
The post Monday 22nd December 2025: Asian Markets Advance on Strong Wall Street Cues and Tech-Led Optimism first appeared on IC Markets | Official Blog.
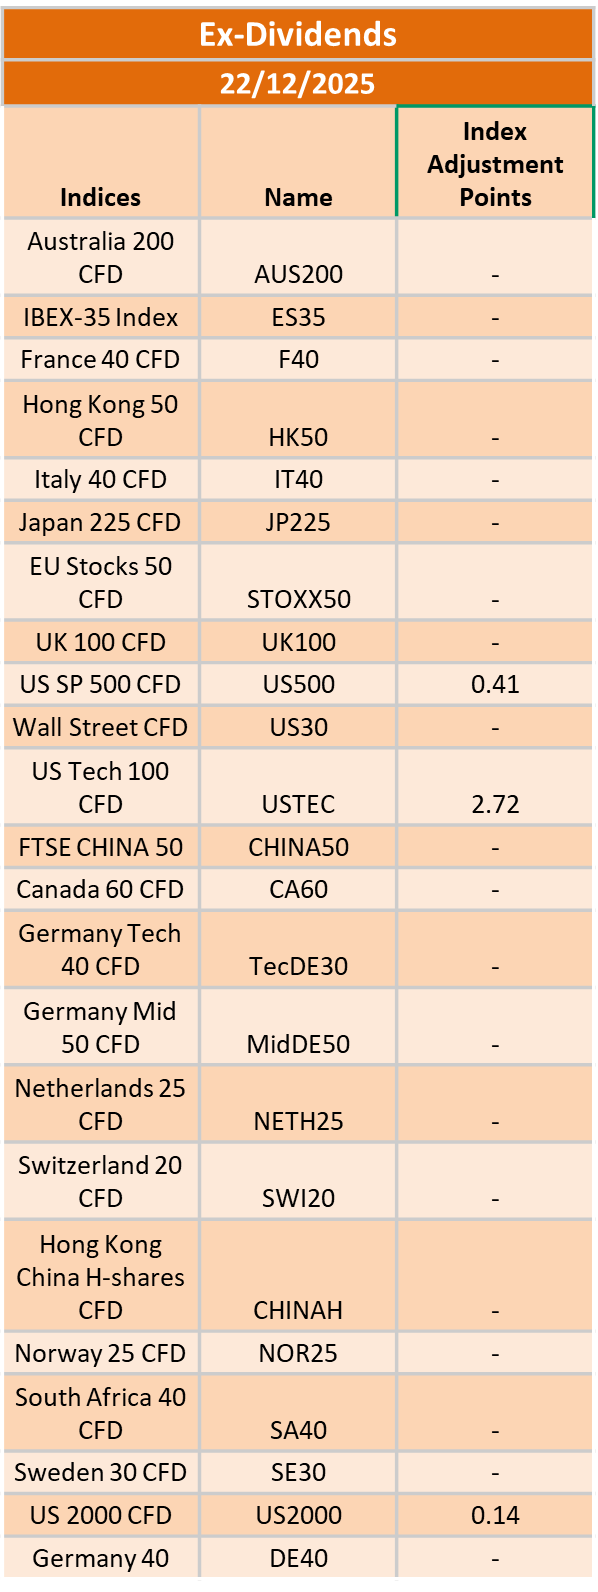
Ex-Dividend 22/12/2025
424729 December 19, 2025 17:14 ICMarkets Market News
The post Ex-Dividend 22/12/2025 first appeared on IC Markets | Official Blog.
General Market Analysis – 19/12/25
424728 December 19, 2025 16:39 ICMarkets Market News
US Stocks Rally After Weaker CPI Print – Nasdaq up 1.4%
US equity markets advanced overnight as softer inflation data buoyed risk sentiment. The latest CPI print came in at its lowest level since 2021, though analysts caution that recent government shutdown disruptions may have skewed the figures. All three of the major indices closed in positive territory, led by tech stocks, which rebounded from yesterday’s drop. The Dow Jones added 0.14% to finish at 47,951, while the S&P 500 climbed 0.79% to 6,774, while the Nasdaq outperformed, rising 1.38% to 23,066. US Treasury yields eased, with the 2-year down 2.1 bps to 3.462% and the 10-year slipping 3.1 bps to 4.122%, reflecting expectations for a slower pace of tightening. The US Dollar Index ended slightly firmer at 98.44, up 0.08%, after an initial post-CPI dip. The Bank of England delivered a widely anticipated 25 bps rate cut, while the European Central Bank held policy steady. Oil prices were marginally higher as traders continued to weigh supply risks heading into 2026. Brent rose 0.12% to $59.75, while WTI gained 0.23% to $56.08. Gold briefly spiked to its highest level since late October following the CPI release, but settled lower, down 0.15% at $4,331.16 at the close.
Another Busy Day to Close Out the Trading Week
It is another busy day ahead for traders, with another key central bank rate call scheduled, as well as some more tier 1 data releases later in the day. In the Asian session, attention will centre on Japanese markets, where the Bank of Japan is expected to announce its interest rate decision—a 25-basis point hike is widely priced in. This is followed by a press conference later in the day, where traders will look closely for hints of more hikes in the new year. The European session will see the release of UK Retail Sales data (exp +0.3% m/m), which will provide insight into consumer spending trends ahead of the holiday season. Early in the US session, Canada will report retail sales (exp 0.0% m/m), offering a snapshot of economic momentum north of the border. Later in the session, US data will round out the week, with Existing Home Sales (exp 4.15 mio) figures released alongside the revised University of Michigan Consumer Sentiment and Inflation Expectations data, key indicators for assessing household confidence and the inflation outlook.
The post General Market Analysis – 19/12/25 first appeared on IC Markets | Official Blog.
IC Markets Global – Europe Fundamental Forecast | 19 December 2025
424727 December 19, 2025 16:14 ICMarkets Market News
IC Markets Global – Europe Fundamental Forecast | 19 December 2025
What happened in the Asia session?
Asia’s trading session featured anticipation around the Bank of Japan’s (BoJ) policy decision, expected to hike rates to 0.75%—the highest since 1995—along with Japan’s November CPI data showing headline inflation at 2.9% and core at 3.0%. Markets reacted positively to this alongside positive US cues from softer inflation, driving broad gains without major surprises in other macro releases like China’s prior data.
What does it mean for the Europe & US sessions?
Yesterday’s softer-than-expected U.S. CPI fueled equity rallies and Treasury yield drops, reinforcing 2026 Fed cut bets, while ECB projections highlight modest euro area growth amid U.S. tariff relief; today pivots to U.S. home sales at 10 AM ET and massive options expiry, with thin holiday liquidity amplifying moves. Asian shares gained overnight on cooling U.S. CPI (core at 2.6% YoY vs. 3.0% expected), boosting rate cut hopes despite data distortions from the government shutdown.
The Dollar Index (DXY)
Key news events today
Existing Home Sales (3:00 pm GMT)
Revised UoM Consumer Sentiment (3:00 pm GMT)
What can we expect from DXY today?
The DXY has weakened 1.78% over the past month and 9.23% year-over-year, with forecasts pointing to 98.28 by quarter-end and further downside to 96.10 in 12 months due to anticipated Fed easing. USD/JPY experienced volatility with initial rallies reversing on CPI data, though pullbacks remain buying opportunities amid rate differentials. In Uzbekistan, local expectations signal a USD decline by 34-35 som.
Central Bank Notes:
- The Federal Open Market Committee (FOMC) is widely expected to lower the federal funds rate target range by 25 basis points to 3.50%–3.75% at its December 9–10, 2025, meeting, marking the third consecutive cut after the October reduction to 3.75%–4.00%
- The Committee continues to pursue maximum employment and 2% inflation goals, with the labour market showing further softening as the unemployment rate rose to 4.4% in September 2025 amid modest job gains.
- Officials note persistent downside risks to growth alongside resilient activity, with inflation easing to 3.0% year-over-year CPI in September but remaining elevated due to tariff effects; core PCE stands at around 2.8% as of October.
- Economic activity grew at a 3.8% annualised pace in Q2 2025 per revised estimates, though Q3 and Q4 face headwinds from trade tensions, fiscal restraint, and data disruptions like the government shutdown.
- September’s Summary of Economic Projections forecasts 2025 unemployment at a median 4.5%, with PCE inflation near 3.0% and core PCE at 3.1%, signalling a gradual disinflation path; updates expected on December 10 may adjust for higher unemployment and lower growth.
- The Committee maintained its data-dependent approach, noting a softening labour market and inflation above the 2% target, while deciding to lower the federal funds rate target range by 25 basis points to 3.50%-3.75%. Dissent persisted, with multiple members opposing the cut or advocating for a hold, reflecting divisions similar to recent meetings.
- The FOMC confirmed the conclusion of its quantitative tightening program effective December 1, 2025, with Treasury rolloff caps at $5 billion per month and agency MBS caps at $35 billion per month to ensure ample reserves and market stability.
- The next meeting is scheduled for 27 to 28 January 2026.
Next 24 Hours Bias
Medium Bearish
Gold (XAU)
Key news events today
Existing Home Sales (3:00 pm GMT)
Revised UoM Consumer Sentiment (3:00 pm GMT)
What can we expect from Gold today?
Gold maintained its upward trajectory near $4,330/oz, buoyed by investment demand in markets like India, a softer dollar, and Fed rate cut anticipation, though jewellery buying slowed seasonally; year-to-date gains exceeded 67% with short-term forecasts eyeing further highs around $4,440 amid stable bullish technicals.
Next 24 Hours Bias
Medium Bullish
The Euro (EUR)
Key news events today
No major news event
What can we expect from EUR today?
The euro advanced to multi-month highs near $1.178, driven by US dollar weakness from soft jobs data (64K payrolls, 4.6% unemployment) and ECB hints at pausing easing, alongside upbeat Eurozone sentiment indicators like ZEW at 33.7; forecasts suggest potential upside to 1.1820 if support holds, though geopolitical shifts in Ukraine talks add optimism to regional markets.
Central Bank Notes:
- The Governing Council of the ECB is widely expected to keep the three key interest rates unchanged at its 17–18 December 2025 meeting, maintaining the main refinancing rate at 2.15%, the marginal lending facility at 2.40% and the deposit facility at 2.00%. This would reflect policymakers’ assessment that the current policy stance remains broadly consistent with medium‑term price stability, while inflation hovers close to the 2% target and the economy expands at a modest pace. Market pricing and recent ECB commentary suggest a high “option value” in staying on hold, with no clear pre‑set path for the next move amid two‑sided risks around growth and inflation.
- Recent indicators point to broadly stable price dynamics around the ECB’s target. Headline HICP inflation is projected to hover near 2% through late 2025, with earlier energy‑related disinflation largely behind and food price pressures contained compared with previous years. Services and wage inflation remain somewhat firmer than anticipated, but the trend is one of gradual moderation, consistent with a scenario in which inflation stabilises around but not persistently above 2% over the medium term.
- Eurosystem staff projections to be released in December are expected to show only small revisions from the September exercise, maintaining a profile of headline inflation close to 2% in 2025, dipping slightly below in 2026, and returning near target in 2027. Soft producer prices, fading pipeline cost pressures, and anchored long‑term inflation expectations limit upside risks, though officials continue to flag uncertainty from geopolitical tensions, commodity price shocks, and fiscal policy choices.
- Euro area GDP growth remains subdued but resilient, with most forecasters and survey‑based indicators pointing to an expansion around 1 — 1.25% in 2025 and 2026, followed by a similar pace into 2027. PMIs and confidence surveys suggest activity has stabilised after earlier weakness, with modest support from public investment and improving external demand offsetting soft private consumption and investment.
- The labour market remains tight in aggregate, with unemployment rates close to multi‑decade lows and participation relatively high, even as job creation has slowed from its earlier peak. Real income growth has turned slightly positive again as inflation normalises, underpinning household spending, while financing conditions, though tighter than in the pre‑hiking era, remain consistent with a gradual expansion in credit to households and firms.
- Business sentiment is mixed, reflecting uncertainty around global trade, the policy outlook in the United States, and the potential impact of future tariff or industrial policy shifts. At the same time, easing supply‑chain costs and a relatively competitive euro exchange rate versus major trading partners provide support to manufacturing and export‑oriented sectors at the margin.
- The Governing Council is expected to reiterate that future decisions will remain data-dependent and taken meeting by meeting, based on an integrated assessment of the inflation outlook, the dynamics of underlying inflation, and the strength of monetary policy transmission. Officials have recently stressed that both further hikes and eventual cuts remain contingent on incoming data, implying no commitment to a particular path and a readiness to adjust if inflation or growth diverge materially from baseline projections.
- Balance sheet normalisation is set to continue gradually and predictably, with the stock of assets under the APP and PEPP declining as reinvestments have already been halted or scaled back in line with prior guidance. The ECB is expected to confirm that the current pace of portfolio runoff remains appropriate, supporting a slow withdrawal of monetary accommodation without disrupting market functioning.
- The next meeting is on 4 to 5 January 2026
Next 24 Hours Bias
Medium Bullish
The Swiss Franc (CHF)
Key news events today
No major news event
What can we expect from CHF today?
The franc shows resilience with limited intraday volatility; EUR/CHF and USD/CHF pairs reflect subdued dollar moves ahead of US data. Broader forecasts predict steady appreciation, with CHF/USD potentially reaching 1.29 in a year. The Swiss franc continues its robust trend on December 19, 2025, supported by the SNB’s cautious 0% rate policy amid deflation, safe-haven flows from geopolitical risks, and forecasts of testing USD/CHF resistance near 0.7995, while longer-term outlooks favour further gains against the dollar.
Central Bank Notes:
- At its 11 December 2025 monetary policy assessment, the Swiss National Bank (SNB) is widely expected to leave the policy rate unchanged at 0%, extending the pause that began in September as the Governing Board judges that current settings are sufficient to keep inflation near, but still below, its target while avoiding an unnecessary move into negative rates.
- Recent data show that the tentative rebound in Swiss inflation has stalled, with headline CPI easing from 0.1% year‑on‑year in October to 0.0% in November and core inflation slipping to about 0.4%, reinforcing the view that underlying price pressures remain very weak and that deflation risks, while contained, have not fully disappeared.
- The SNB’s conditional inflation forecast is likely to remain close to the September projections, with inflation still seen averaging roughly 0.2% in 2025, 0.5% in 2026, and 0.7% in 2027 under an unchanged policy rate path, though the latest CPI prints argue for a slightly lower near‑term profile and keep open the option of renewed easing if activity or prices weaken further.
- The global backdrop has deteriorated further, as continuing U.S. tariff actions and softer external demand weigh on world trade, while uncertainty in key European and U.S. markets for Swiss exports persists, leaving the SNB cautious about the growth outlook despite Switzerland’s relatively resilient domestic demand.
- Business and labour-market sentiment in export‑oriented manufacturing remains subdued, with firms reporting pressure on margins from the still‑strong franc and softer foreign orders, although the broader economy is still expected to grow at around 1–1.5% in 2025 and unemployment only drifting up gradually from low levels.
- The SNB continues to stress its willingness to act if deflation risks re‑emerge, reiterating that it can ease policy through renewed rate cuts or targeted foreign‑exchange intervention if necessary, while also highlighting its commitment to transparent communication, including the publication of detailed minutes from recent assessments and ongoing dialogue with international partners on FX policy
The next meeting is on 19 March 2026.
Next 24 Hours Bias
Medium Bullish
The Pound (GBP)
Key news events today
Retail Sales m/m (7:00 am GMT)
What can we expect from GBP today?
The British Pound remained resilient yet cautious against the USD at approximately 1.3381, influenced by softer UK inflation data reinforcing BoE rate cut expectations and technical forecasts predicting a short-term correction to 1.3285 before potential upside to 1.3565, amid steady market digestion of central bank signals and minimal aggressive selling.
Central Bank Notes:
- The Bank of England’s Monetary Policy Committee (MPC) will meet on 18 December 2025, with the current Bank Rate standing at 4.00 per cent after being held in a close 5–4 vote at the 5 November meeting. Market pricing and analyst commentary point to a high risk of a 25‑basis‑point cut to 3.75 per cent, but this remains conditional on incoming inflation and labour‑market data, so the December note should be treated as pre‑decision guidance rather than an ex‑post summary.
- The BoE is expected to leave its quantitative tightening (QT) framework broadly unchanged through year‑end, maintaining the lower reduction pace in gilt holdings that was set earlier in 2025. Official communications still characterise the existing QT path as consistent with a restrictive stance, with policymakers stressing that balance‑sheet reduction will remain gradual and sensitive to market‑liquidity conditions.
- Headline CPI inflation eased to 3.6 per cent year‑on‑year in October 2025, down from 3.8 per cent in September, helped by softer energy and goods prices, though it remains almost twice the 2 per cent target. Underlying inflation pressures, particularly in services, have continued to moderate only slowly, so the MPC’s central projection still envisages inflation moving closer to, but not yet reaching, 3 per cent over the course of 2026, contingent on further normalisation in energy and wage dynamics.
- UK economic activity remains weak heading into the December meeting, with the labour market showing further signs of slackening. The unemployment rate has risen toward just above 5 per cent on the latest three‑month figures to October, while overall regular pay growth has slowed to around the mid‑4 per cent range, reinforcing the view that domestic cost pressures are gradually easing.
- External conditions continue to cloud the outlook, with fragile global growth and fluctuating commodity prices contributing to bouts of financial‑market volatility. The MPC has highlighted that renewed global energy or food price shocks could temporarily slow the pace of disinflation, but such risks are currently judged unlikely to derail the medium‑term downward trajectory for inflation if domestic demand stays subdued.
- The balance of risks around the inflation outlook remains finely poised. Downside risks are linked to persistently weak domestic demand and rising unemployment, while upside risks come from still‑elevated inflation expectations, sticky services inflation, and the possibility that structural changes in the labour market leave less slack than conventional indicators suggest.
- Overall, the MPC’s stance going into December is restrictive but increasingly open to a gradual easing cycle, with any rate cuts expected to be measured and data‑dependent. Policymakers have reiterated that the Bank Rate will need to stay in restrictive territory until they are confident inflation is on a sustainable path back to the 2 per cent target, and they have signalled that the profile of cuts, once started, is likely to be shallow rather than rapid.
- The next meeting is on 5 February 2026.
Next 24 Hours Bias
Medium Bullish
The Canadian Dollar (CAD)
Key news events today
Core Retail Sales m/m (1:30 pm GMT)
Retail Sales m/m (1:30 pm GMT)
What can we expect from CAD today?
The Canadian dollar exhibited resilience with a slight uptick versus the USD near 1.3772, fueled by oil gains and pre-retail sales positioning, though forecasts indicate stability with potential quarterly improvements against major peers amid central bank divergence. Retail sales figures released on December 19 were a focal point, following recent softer US CPI data that spurred rate-cut speculation but left the long-term USD/CAD bias tilted upward. Oil prices climbed 0.9%, bolstering the commodity-linked loonie.
Central Bank Notes:
- The Governing Council left the target for the overnight rate unchanged at 2.25% at its 10 December 2025 meeting, in line with market expectations and signalling that the earlier easing cycle has likely concluded. The Bank noted that while global tariff tensions and trade uncertainty persist, the external backdrop has stabilised somewhat, reducing the need for additional insurance cuts even as world trade remains fragile.
- The Council acknowledged that uncertainty around U.S. trade policy and tariffs continues to weigh on business sentiment, but recent data show Canadian manufacturing and goods exports holding up better than anticipated. Surveys cited by the Bank suggest export order books have stopped deteriorating, with firms reporting some rebuilding of backlogs despite still‑cautious capital spending plans.
- Canada’s economy rebounded more strongly than expected in the third quarter, with real GDP expanding at an annualised pace of about 2.6% after a 1.8% contraction in Q2, largely on the back of higher crude exports and government spending. Monthly data show output rising 0.2% in September, though flash estimates point to a softer start to Q4 as some sectors give back earlier gains.
- Service sector activity has firmed, with indicators showing the services PMI back above the 50 threshold and broadening gains in business and professional services. However, consumer-facing categories remain mixed, as still‑elevated price levels and only modest real income growth keep a lid on discretionary spending even as tourism and technology‑related services expand.
- Housing markets have continued to stabilise, with national resale activity and prices edging higher through the autumn alongside the earlier decline in borrowing costs. The Bank noted that while some major urban centres are seeing renewed price pressures, tighter underwriting standards and still‑high affordability constraints are expected to cap the pace of any rebound.
- Headline CPI inflation eased to 2.2% year over year in October and is estimated to have remained near that rate in November, keeping it slightly above the 2% target but comfortably within the 1%–3% control range. Core measures have drifted lower, with CPI‑median and CPI‑trim around 3% or below, reinforcing the assessment that underlying price pressures are gradually moderating even as gasoline and some shelter components remain volatile.
- The Governing Council reiterated that the current policy rate is “about the right level” to keep inflation close to target while supporting the economy through a period of structural adjustment, and it signalled a shift away from near‑term easing expectations. While the Bank did not rule out future adjustments, officials stressed that, barring a material downside surprise to growth or inflation, further rate cuts are unlikely before 2026, and attention is now focused on the durability of the recovery and the evolution of core inflation.
- The next meeting is on 28 January 2026.
Next 24 Hours Bias
Medium Bullish
Oil
Key news events today
No major news event
What can we expect from Oil today?
Oil prices experienced volatility on December 19, 2025, with WTI crude dipping to around $55.83 per barrel amid ongoing supply concerns. A US blockade on Venezuelan oil tankers, ordered by President Trump, provided some upward support earlier in the week, pushing prices toward $56, but fears of a Russia-Ukraine peace deal and potential Russian oil re-entering the market tempered gains.
Next 24 Hours Bias
Medium Bearish
The post IC Markets Global – Europe Fundamental Forecast | 19 December 2025 first appeared on IC Markets | Official Blog.
IC Markets Global – Asia Fundamental Forecast | 19 December 2025
424726 December 19, 2025 16:14 ICMarkets Market News
IC Markets Global – Asia Fundamental Forecast | 19 December 2025
What happened in the U.S. session?
During the U.S. session, the combination of a downside CPI surprise and steady jobless claims shifted the narrative further toward a 2025 easing cycle that begins in March, rather than January, keeping a “goldilocks” feel to macro conditions. The immediate market reaction favored risk assets and duration: U.S. equity indices and gold outperformed, the front end of the Treasury curve rallied, and the dollar softened against major peers, with GBP, EUR, and pro‑cyclical FX among the main beneficiaries.
What does it mean for the Asia Session?
Asian traders should be prepared for elevated volatility centered on the Bank of Japan, with a widely expected hike from 0.50% to about 0.75% and Governor Ueda’s press conference likely to drive sharp moves in JPY and regional risk assets. Attention will then shift to UK retail sales as a gauge of European consumer resilience, followed by Canadian retail sales for insight into North American demand and CAD dynamics. Into the US session, existing home sales and the revised University of Michigan sentiment index will provide fresh reads on the US housing market and consumer confidence, shaping closing‑week positioning in USD, global equities, and high‑beta Asian currencies
The Dollar Index (DXY)
Key news events today
Existing Home Sales (3:00 pm GMT)
Revised UoM Consumer Sentiment (3:00 pm GMT)
What can we expect from DXY today?
The Dollar is trading near 98.4 on the DXY, modestly firmer intraday but still in a broader corrective downtrend after losing almost 9% over the past year as markets price in a post‑Fed‑cut environment with a shallower US rate premium. With no major US data releases scheduled, price action is expected to be flow‑ and headline‑driven, particularly around the Bank of Japan decision window, leaving USD vulnerable to further selling on any risk‑positive or dovish‑policy news but capable of short‑covering rallies if global risk sentiment sours.
Central Bank Notes:
- The Federal Open Market Committee (FOMC) is widely expected to lower the federal funds rate target range by 25 basis points to 3.50%–3.75% at its December 9–10, 2025, meeting, marking the third consecutive cut after the October reduction to 3.75%–4.00%
- The Committee continues to pursue maximum employment and 2% inflation goals, with the labor market showing further softening as the unemployment rate rose to 4.4% in September 2025 amid modest job gains.
- Officials note persistent downside risks to growth alongside resilient activity, with inflation easing to 3.0% year-over-year CPI in September but remaining elevated due to tariff effects; core PCE stands at around 2.8% as of October.
- Economic activity grew at a 3.8% annualized pace in Q2 2025 per revised estimates, though Q3 and Q4 face headwinds from trade tensions, fiscal restraint, and data disruptions like the government shutdown.
- September’s Summary of Economic Projections forecasts 2025 unemployment at a median 4.5%, with PCE inflation near 3.0% and core PCE at 3.1%, signaling a gradual disinflation path; updates expected on December 10 may adjust for higher unemployment and lower growth.
- The Committee maintained its data-dependent approach, noting a softening labor market and inflation above the 2% target, while deciding to lower the federal funds rate target range by 25 basis points to 3.50%-3.75%. Dissent persisted, with multiple members opposing the cut or advocating for a hold, reflecting divisions similar to recent meetings.
- The FOMC confirmed the conclusion of its quantitative tightening program effective December 1, 2025, with Treasury rolloff caps at $5 billion per month and agency MBS caps at $35 billion per month to ensure ample reserves and market stability.
- The next meeting is scheduled for 27 to 28 January 2026.
Next 24 Hours Bias
Medium Bearish
Gold (XAU)
Key news events today
Existing Home Sales (3:00 pm GMT)
Revised UoM Consumer Sentiment (3:00 pm GMT)
What can we expect from Gold today?
Gold remains close to record territory in the mid‑$4,300/oz region after a roughly 60–70% surge this year, with intraday forecasts pointing to a volatile but upward‑tilted range around $4,255–$4,440 and no clear sign yet of a major top. The market tone is broadly bullish but increasingly cautious, as traders balance strong tailwinds, lower real rates, central‑bank and safe‑haven demand, de‑dollarization flows, and persistent geopolitical and inflation concerns against the risk of corrective pullbacks from historically stretched levels as year‑end liquidity thins.
Next 24 Hours Bias
Strong Bullish
The Australian Dollar (AUD)
Key news events today
No major news event
What can we expect from AUD today?
Going into Friday, the Australian Dollar is on the defensive, trading just below 0.66 after several sessions of losses that pushed it to a two‑week low against the US Dollar, with the move driven mainly by a firmer USD and cautious global risk sentiment rather than fresh domestic shocks. Australia’s data calendar for the day is light, featuring only lower‑tier credit indicators, so traders are focusing on external catalysts such as US economic releases, equity market swings, and evolving expectations for Fed and RBA policy, while technical analysts continue to flag the 0.67 region as a key resistance level that must be cleared for any sustained AUD recovery.
Central Bank Notes:
- The Reserve Bank of Australia held its cash rate steady at 3.60% at the November 2025 policy meeting, adopting a cautious tone amid a surprise uptick in inflation data for the September quarter. This marks the fourth consecutive pause since the 25 basis point cut in August. The Board attributed some of the inflation rise to temporary factors like higher petrol prices and council rates, but noted signs of more persistent pressures from consumer demand.
- Policymakers emphasized vigilance on inflation, with trimmed mean inflation expected to remain elevated in the near term before nearing the 2–3% target midpoint by mid-2027. Recent data showed underlying inflation staying above target until at least the second half of 2026, prompting upward revisions to forecasts. Capacity pressures are seen as slightly more pronounced than previously assessed, delaying any easing.
- Headline CPI for the September quarter exceeded expectations, driven partly by temporary items, while underlying measures signal ongoing stickiness. The shift to monthly CPI reporting, with the first full edition in November 2025, will enhance real-time inflation monitoring. Housing and services remain resilient contributors to price pressures.
- Domestic demand shows firmness in services alongside below-trend growth elsewhere, with capacity pressures not expected to ease significantly. The labor market is gradually softening, with unemployment projected to stabilize around 4.4%, though wage growth and productivity dynamics keep unit labor costs a concern. Household spending faces headwinds from high borrowing costs.
- Global risks include geopolitical tensions and commodity volatility, set against modestly revised-up world growth outlooks. The Board describes its policy as mildly restrictive and data-dependent, balancing inflation control with employment goals. No rate hike was considered despite the inflation surprise.
- Monetary policy remains mildly restrictive to address lingering price stability risks amid household and global vulnerabilities. Communications reaffirm the dual mandate of 2–3% inflation and full employment, with readiness to adjust based on incoming data.
- Market expectations point to the cash rate holding through early 2026, with a possible modest cut to 3.3% mid-year if inflation eases as forecast. The new monthly CPI data will be key for timely insights.
- Monetary policy remains mildly restrictive, balancing progress on price stability against vulnerabilities in household demand and global outlook. Board communications reaffirm a dual mandate: price stability and full employment, while underscoring readiness to respond should risks materialize sharply.
- Analysts generally expect the cash rate to remain at current levels through early 2026, with only modest cuts possible later in the year if inflation moderates. The new monthly CPI release (first full edition Nov 2025) will be watched closely for timely signals on price trends.
- The next meeting is on 2 to 3 February 2026.
Next 24 Hours Bias
Medium Bullish
The Kiwi Dollar (NZD)
Key news events today
No major news event
What can we expect from NZD today?
Today, the New Zealand Dollar is trading in a consolidative, slightly defensive posture around the mid‑0.57s against the US Dollar, retreating from early‑December highs as risk appetite cools and strong domestic GDP data fails to shift RBNZ policy expectations toward imminent tightening. The broader trend over the past month remains modestly positive for NZD, but with the Fed already cutting rates, the RBNZ seen on hold, and global markets turning more cautious, short‑term price action is likely to revolve around whether NZD/USD can defend support near 0.5750 or slips back toward the lower end of its recent range.
Central Bank Notes:
- The Monetary Policy Committee (MPC) left the Official Cash Rate (OCR) unchanged at 2.25% at its 26 November 2025 meeting, following the widely anticipated 25-basis-point reduction from 2.50%, and signaled that policy is now firmly in stimulatory territory while keeping the option of further easing on the table if needed.
- The decision was again reached by consensus, with members judging that the cumulative 325 basis points of easing over the past year warranted a period of assessment, even as several emphasized a willingness to cut further should incoming data point to a more protracted downturn or renewed disinflationary pressures.
- Headline consumer price inflation is projected to hover near 3% in late 2025 before gradually easing toward the 2% midpoint of the 1–3% target band through 2026, supported by contained inflation expectations around 2.3% over the two-year horizon and an expected pickup in spare capacity.
- The MPC noted that domestic demand remains subdued but shows tentative signs of stabilisation, with softer household spending and construction only partially offset by improving services activity; nevertheless, policymakers still expect services inflation to ease as wage growth moderates and the labour market loosens further over the coming year.
- Financial conditions continue to ease as wholesale and retail borrowing rates reprice to the lower OCR, contributing to gradually rising mortgage approvals and improving housing-related sentiment, although broader business credit growth remains patchy and sensitive to uncertainty about the durability of the recovery.
- Recent data confirm that GDP momentum is weak but not deteriorating as sharply as earlier in 2025, with high-frequency indicators pointing to a shallow recovery from a low base and ongoing headwinds from elevated living costs and fragile confidence weighing on discretionary consumption and investment.
- The MPC reiterated that external risks remain skewed to the downside, particularly from softer Chinese demand and uncertainty around United States trade policy, but noted that a lower New Zealand dollar continues to provide some offset via improved export competitiveness and support for tradables inflation.
- Looking ahead to early 2026, the Committee maintained a mild easing bias, indicating that a further cut toward 2.00–2.10% cannot be ruled out if activity fails to gain traction or if inflation undershoots projections, but current forecasts envisage the OCR remaining near 2.25% for an extended period provided inflation converges toward target and the recovery proceeds broadly as expected.
- The next meeting is on 18 February 2026.
Next 24 Hours Bias
Medium Bullish
The Japanese Yen (JPY)
Key news events today
BOJ Policy Rate (Tentative)
Monetary Policy Statement (Tentative)
BOJ Press Conference (Tentative)
What can we expect from JPY today?
The Japanese yen today is in a holding pattern but underpinned by strong expectations that the BoJ will deliver a landmark rate hike to 0.75% at its December 18–19 meeting, bringing policy to a three‑decade high. Price action in USD/JPY around the mid‑155s reflects this tug‑of‑war between anticipated domestic tightening and broader dollar dynamics, while markets brace for elevated volatility and potential carry‑trade unwinds once Friday’s decision and guidance hit the tape.
Central Bank Notes:
- The Policy Board of the Bank of Japan will meet on 18–19 December with markets almost fully pricing a 25-basis-point hike, which would raise the short-term policy rate from 0.50% to around 0.75%, as the bank moves further away from its ultra-loose stance while stressing that any tightening will remain gradual and data-dependent.
- The BOJ is expected to continue guiding the uncollateralized overnight call rate in a narrow band around the new policy rate, near 0.75%, while signaling that the pace and timing of any additional hikes will depend on how past increases affect bank lending, corporate financing conditions, and overall economic activity.
- The quarterly path of JGB purchases remains on a pre-announced, gradual taper: outright purchases are being reduced by about ¥400 billion per quarter through March 2026, then by roughly ¥200 billion per quarter from April to June 2026, with the bank still aiming for JGB purchases to settle near ¥2 trillion in Q1 2027 and retaining flexibility to adjust the pace if market functioning or yield volatility deteriorate.
- Japan’s economy has softened in the near term, with Q3 2025 GDP contracting at an annualized pace of about 2.3% as weaker residential investment and external demand weighed on activity, even as business sentiment in manufacturing has recently improved to a roughly four-year high.
- Core consumer inflation (excluding fresh food) accelerated to around 3.0% year-on-year in October, up from 2.9% in September and remaining above the BOJ’s 2% target, while the “core-core” measure excluding both fresh food and energy rose to about 3.1%, underscoring persistent underlying price pressures.
- In the very near term, some input-cost pressures are easing as earlier import price surges fade, but services inflation linked to labor shortages, along with steady wage gains, continues to support broader price momentum; firms’ and households’ medium-term inflation expectations remain anchored slightly above 2%, keeping short-term inflation risks tilted to the upside.
- For the coming quarters, the BOJ assesses that real growth will likely run below potential as the economy digests tighter financial conditions and past yen depreciation, though accommodative real rates, positive real wage growth, and improving corporate sentiment should help sustain a modest recovery in private consumption and business investment.
- Over the medium term, as overseas demand stabilizes and domestic labor markets remain tight, the BOJ expects wage settlements and inflation expectations to keep core inflation on a gradual upward trajectory around or slightly above 2%, providing room for further cautious rate normalization as long as financial conditions remain supportive and the recovery is not derailed.
- The next meeting is scheduled for 22 to 23 January 2026.
Next 24 Hours Bias
Medium Bearish
Oil
Key news events today
No major news event
What can we expect from Oil today?
Oil is trading slightly higher today, with WTI in the mid‑50s and Brent near 60 dollars per barrel as the market digests a rebound from recent multi‑year lows. Prices were lifted earlier in the week after President Donald Trump ordered a full blockade of sanctioned Venezuelan tankers, heightening supply‑disruption fears, but sentiment remains cautious because global production and inventories still suggest an oversupplied market. Over the past month, crude has lost around 5% and is down close to 18% over the past year, reflecting persistent demand concerns despite ongoing geopolitical flashpoints
Next 24 Hours Bias
Medium Bearish
The post IC Markets Global – Asia Fundamental Forecast | 19 December 2025 first appeared on IC Markets | Official Blog.
Friday 19th December 2025: Asian Markets Rise on Fed Rate-Cut Hopes, Australia and Japan Lead Gains
424725 December 19, 2025 16:01 ICMarkets Market News
Global Markets:
- Asian Stock Markets : Nikkei up 1.28%, Shanghai Composite up 1.59%, Hang Seng up 0.71% ASX up 0.53%
- Commodities : Gold at $4,346.30 (-0.41%), Silver at $65.118 (-0.17%), Brent Oil at $59.68 (-0.23%), WTI Oil at $55.86 (-0.25%)
- Rates : US 10-year yield at 4.136, UK 10-year yield at 4.4830, Germany 10-year yield at 2.8491
News & Data:
- (USD) CPI y/y -1.3M to -2.4M expected
- (USD) Unemployment Claims -1.3M to -2.4M expected
Markets Update:
Asian stock markets are trading mostly higher on Friday, buoyed by broadly positive cues from Wall Street after softer-than-expected U.S. inflation data reinforced confidence that the U.S. Federal Reserve may continue cutting interest rates next year. Asian markets had ended mostly lower in the previous session.
The Australian share market is modestly higher, extending Thursday’s gains. The benchmark S&P/ASX 200 is trading above the 8,600 level, supported by strength in technology and financial stocks, though losses in gold miners are limiting upside. The index is up about 0.4 percent, while the broader All Ordinaries Index is also trading higher.
Mining stocks are mixed, with modest losses in BHP Group and Fortescue offset by gains in Rio Tinto and Mineral Resources. Oil stocks are also mixed, as gains in Origin Energy and Beach Energy counter declines in Santos and Woodside Energy. Technology stocks are broadly higher, while major banks are posting solid gains across the board. Gold miners, however, are mostly lower.
In Japan, the market is trading sharply higher, rebounding from the previous session’s losses. The Nikkei 225 has climbed to near the 49,600 level, led by strong gains in automakers, financials and technology stocks. Investors are also watching closely as the Bank of Japan concludes its monetary policy meeting, with expectations of a 25 basis point rate hike.
Elsewhere in Asia, markets across Taiwan, China, Hong Kong, South Korea and Southeast Asia are trading mostly higher. On Wall Street overnight, U.S. stocks rebounded strongly, led by the Nasdaq, while European markets also closed higher. Crude oil prices edged up slightly amid ongoing geopolitical concerns.
Upcoming Events:
- 01:30 PM GMT – CAD Retail Sales m/m
- 01:30 PM GMT – CAD Core Retail Sales m/m
The post Friday 19th December 2025: Asian Markets Rise on Fed Rate-Cut Hopes, Australia and Japan Lead Gains first appeared on IC Markets | Official Blog.
Friday 19th December 2025: Technical Outlook and Review
424709 December 19, 2025 16:00 ICMarkets Market News
DXY (U.S. Dollar Index):
Potential Direction: Bearish
Overall momentum of the chart: Bearish
The price could see a short-term pullback toward the pivot before continuing its bearish move down toward the 1st support.
Pivot: 98.62
Supporting reasons: Identified as an overlap resistance that aligns with the 50% Fibonacci retracement, where selling pressures could intensify and potentially cap any upward retracement.
1st support: 98.03
Supporting reasons: Identified as a swing low support, indicating a potential area where the price could again stabilize.
1st resistance: 99.06
Supporting reasons: Identified as a pullback resistance, indicating a potential area that could halt any further upward movement
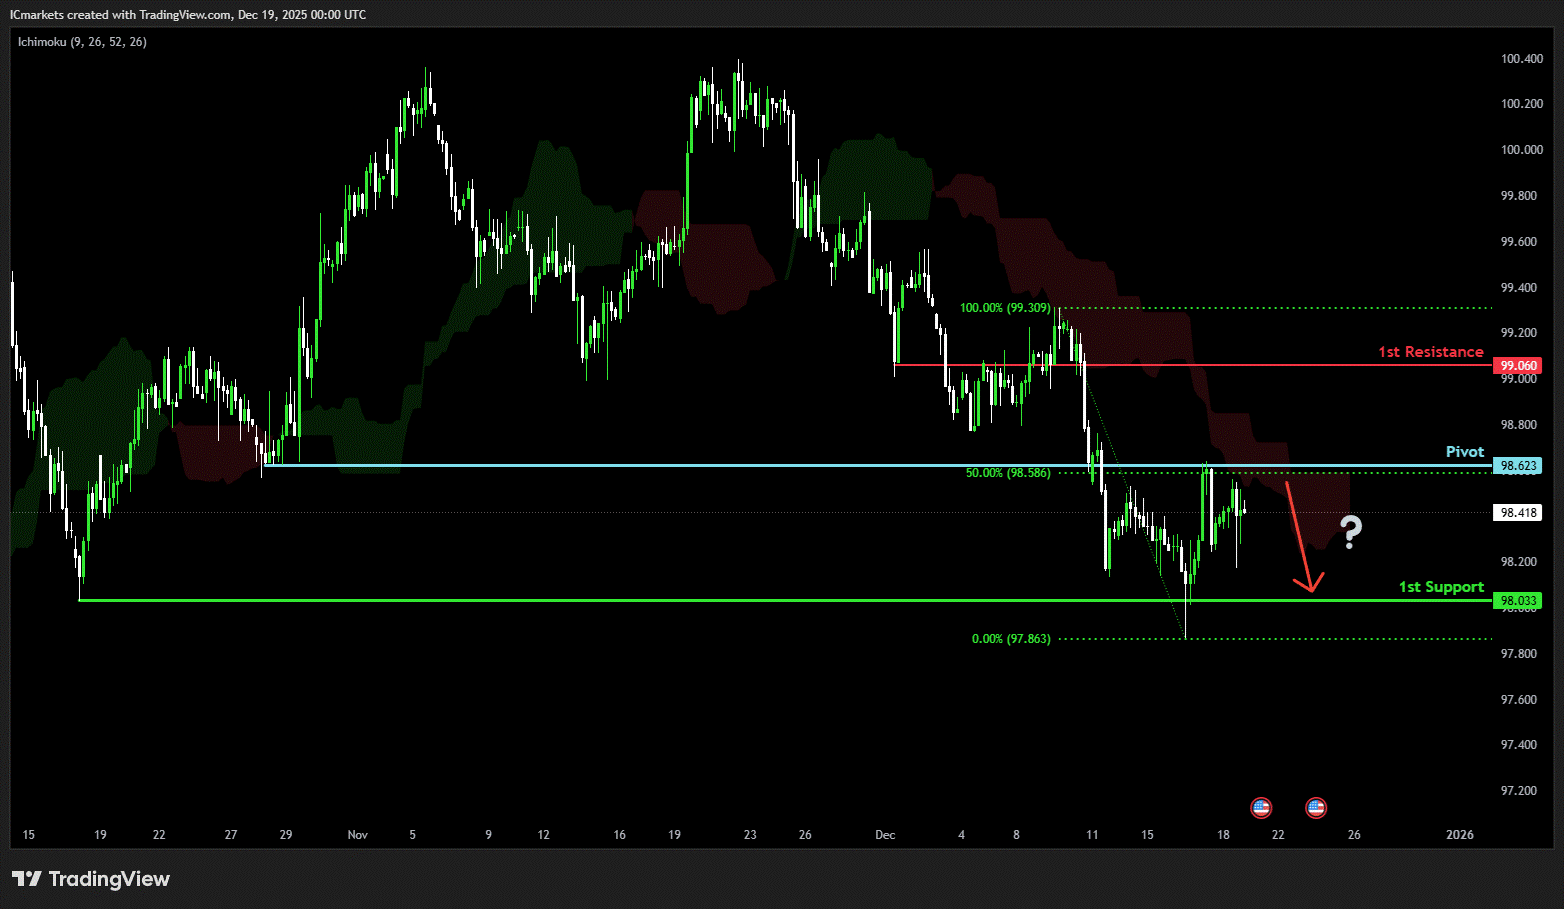
EUR/USD:
Potential Direction: Bullish
Overall momentum of the chart: Bearish
The price has already bounced off the pivot and may continue its bullish move toward the 1st resistance
Pivot: 1.1710
Supporting reasons: Identified as an overlap support, where renewed buying pressure could emerge to push the price higher.
1st support: 1.1644
Supporting reasons: Identified as a pullback support, indicating a potential level where the price could stabilize once again.
1st resistance: 1.1810
Supporting reasons: Identified as a swing high resistance that aligns closely with the 100% Fibonacci projection, indicating a potential level that could cap further upward movement.
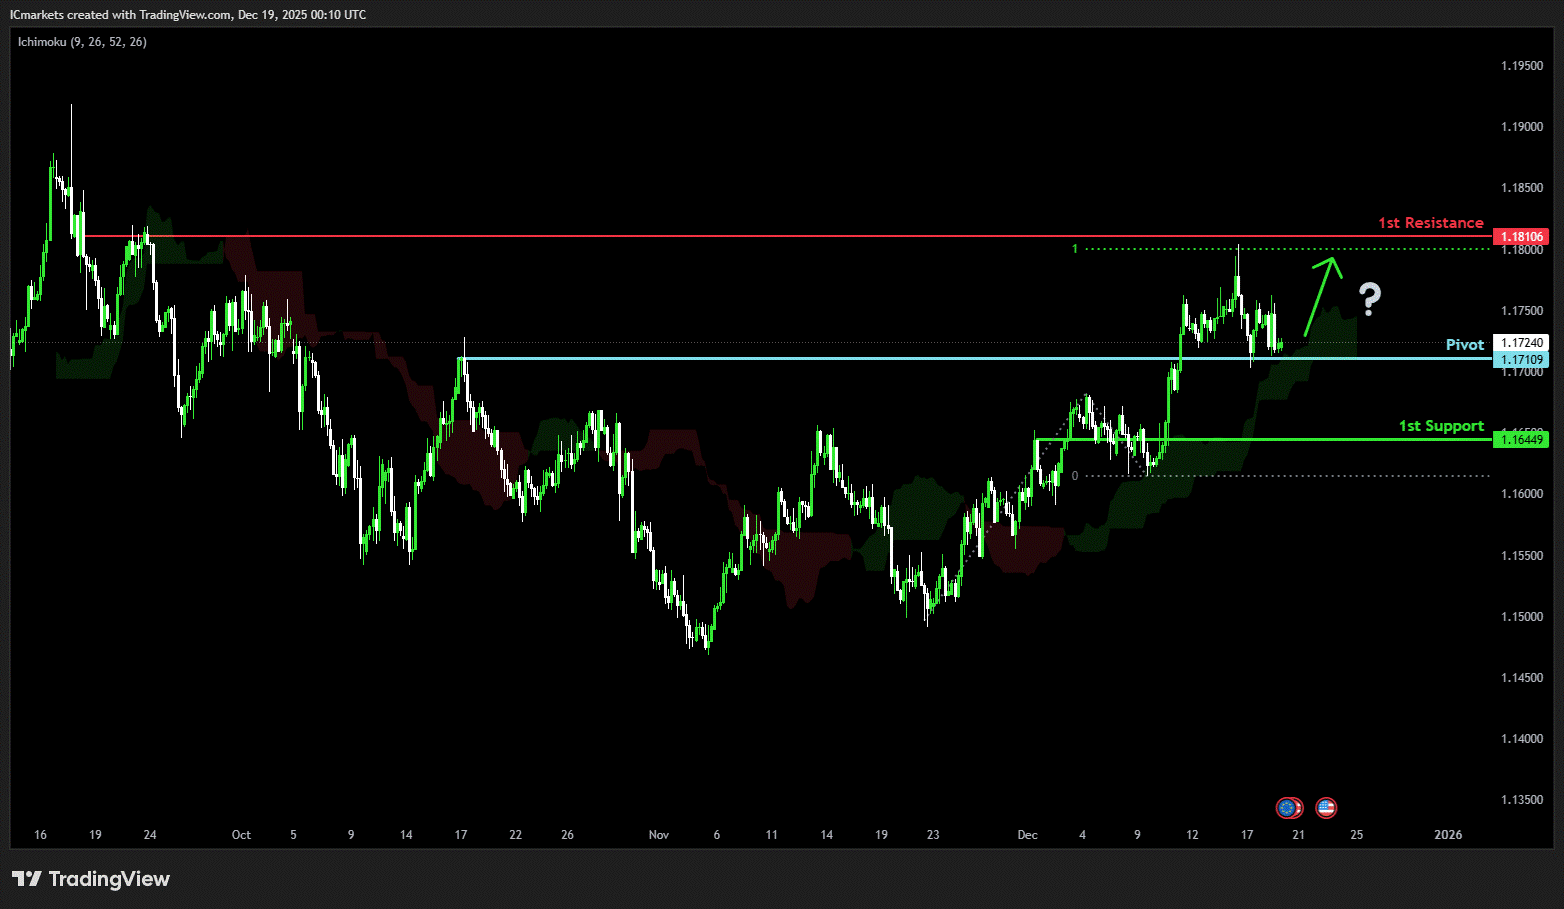
EUR/JPY:
Potential Direction: Bullish
Overall momentum of the chart: Bullish
The price could see a short-term pullback toward the pivot before rising again toward the 1st resistance.
Pivot: 181.69
Supporting reasons: Identified as a pullback support that aligns with the 50% Fibonacci retracement, where renewed buying pressure could emerge to push the price higher.
1st support: 179.92
Supporting reasons: Identified as a pullback support, indicating a potential area where the price could again stabilize.
1st resistance: 183.02
Supporting reasons: Identified as a swing high resistance, indicating a potential level that could cap further upward movement.
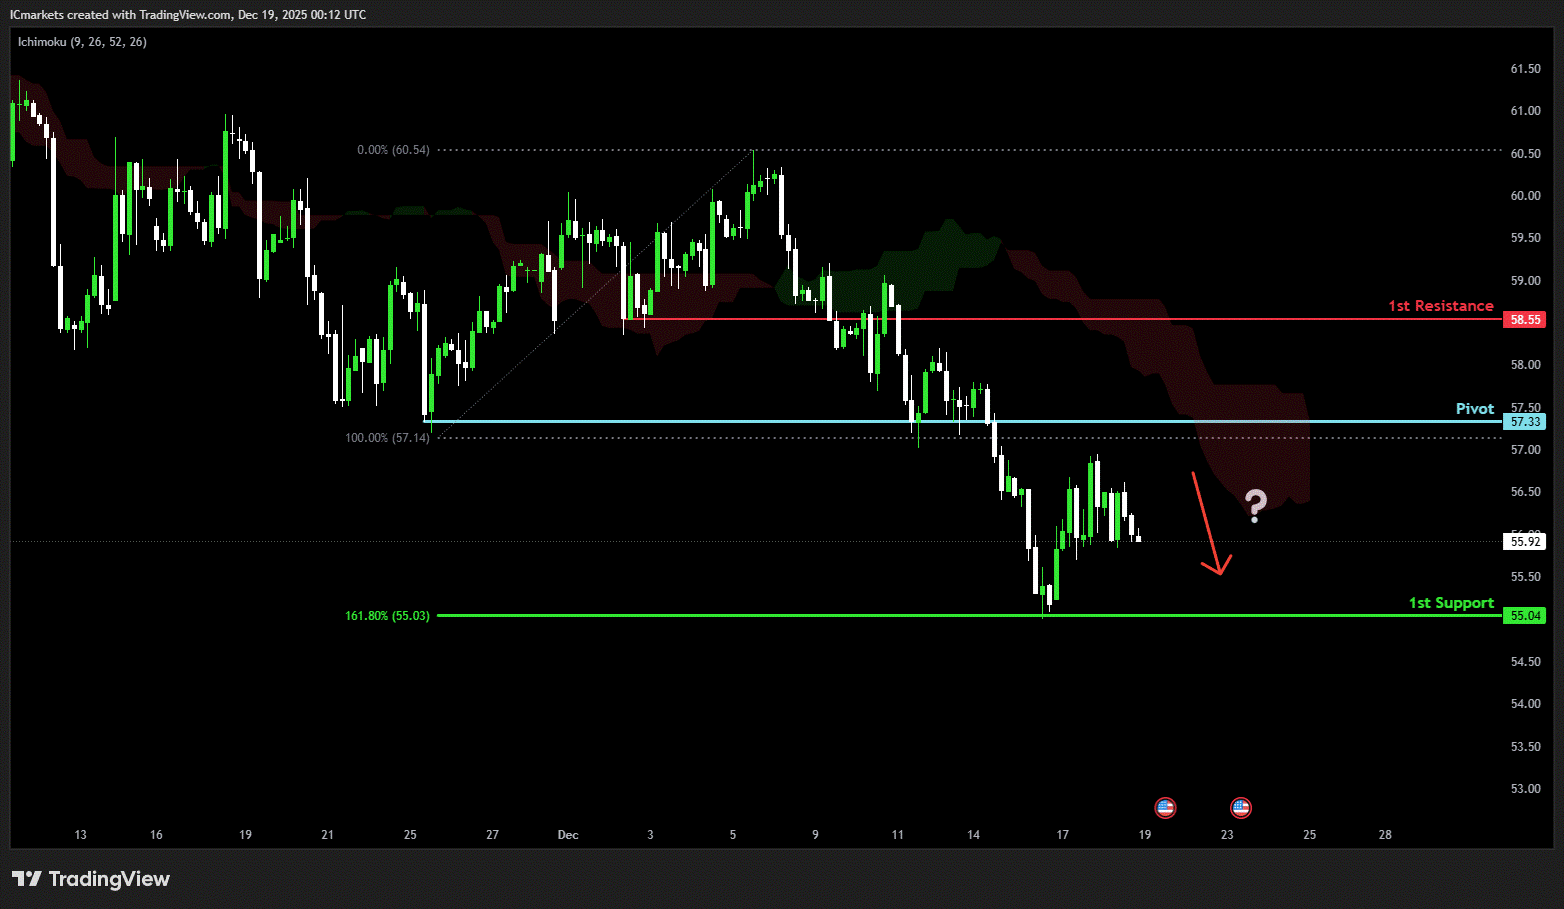
EUR/GBP:
Potential Direction: Bullish
Overall momentum of the chart: Bullish
The price has already bounced off the pivot and may continue its bullish move toward the 1st resistance
Pivot: 0.8746
Supporting reasons: Identified as an overlap support, where renewed buying pressure could emerge to push the price higher.
1st support: 0.8724
Supporting reasons: Identified as an overlap support, indicating a potential area where the price could stabilize once more.
1st resistance: 0.8799
Supporting reasons: Identified as an overlap resistance, indicating a potential level that could cap further upward movement.
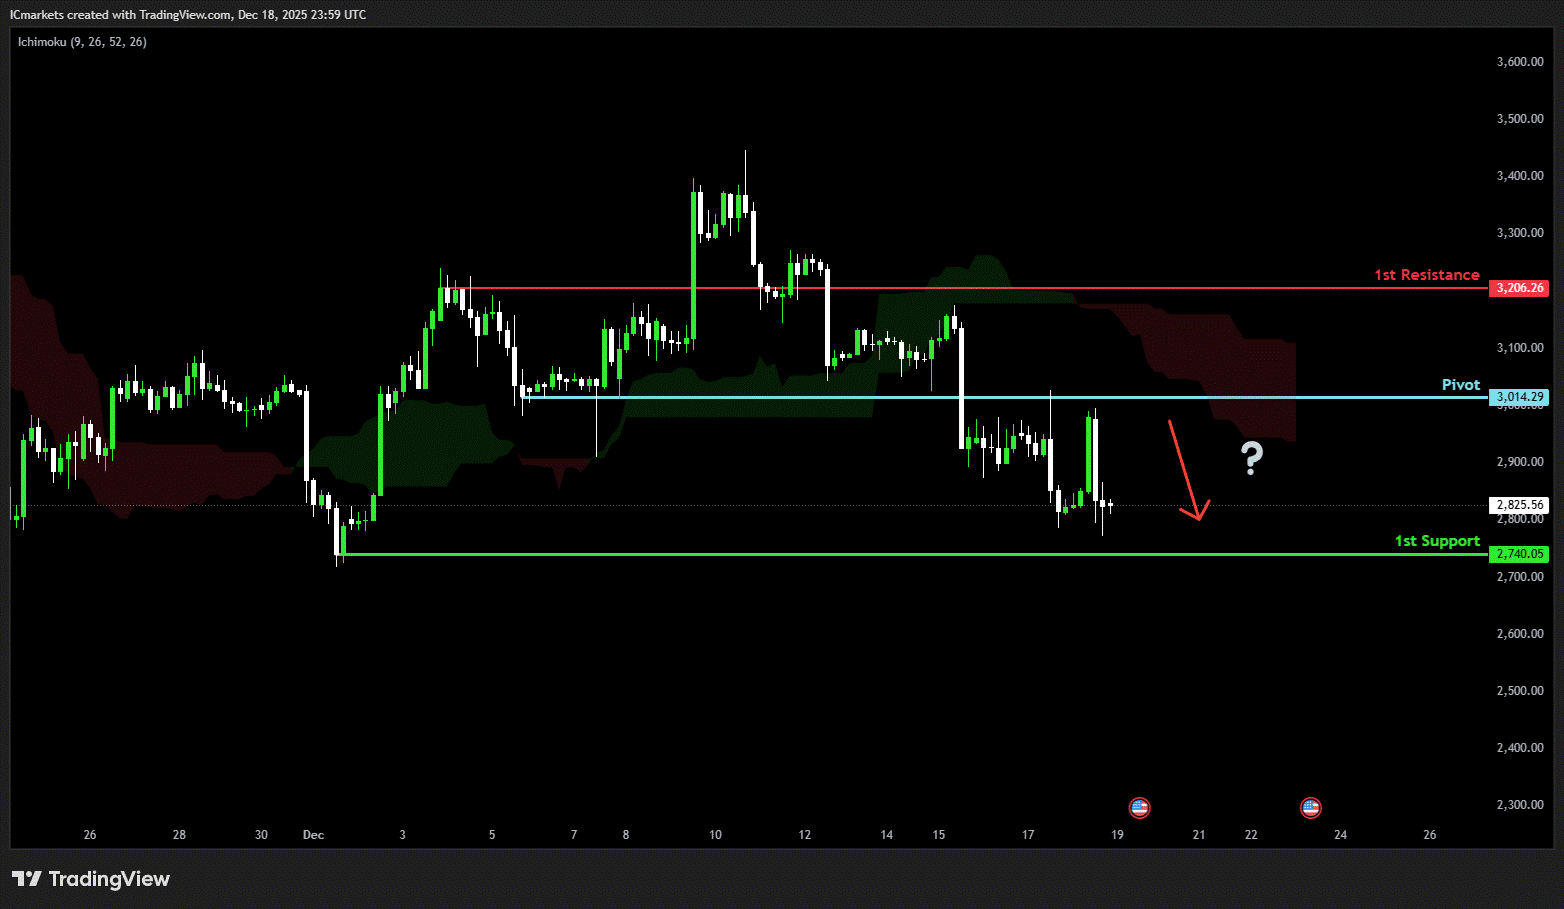
GBP/USD:
Potential Direction: Bullish
Overall momentum of the chart: Bullish
The price could see a short-term pullback toward the pivot before rising again toward the 1st resistance.
Pivot: 1.3294
Supporting reasons: Identified as a pullback support, where renewed buying pressure could emerge to push the price higher.
1st support: 1.3216
Supporting reasons: Identified as a pullback support, indicating a potential area where the price could stabilize once more.
1st resistance: 1.3452
Supporting reasons: Identified as a swing high resistance, indicating a potential level that could halt further upward movement.
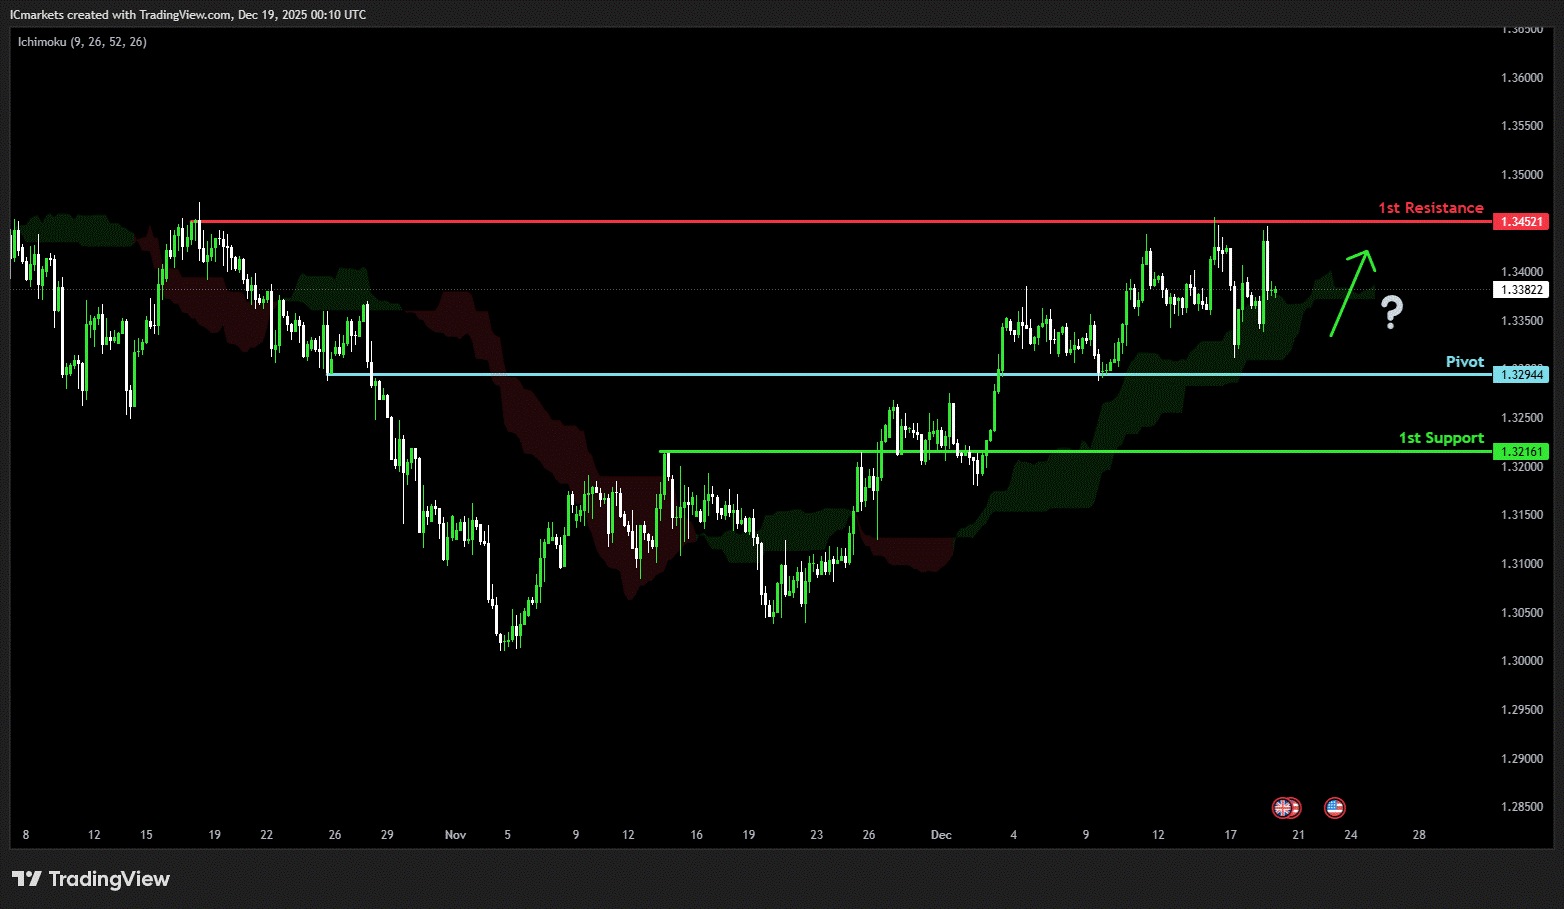
GBP/JPY:
Potential Direction: Bullish
Overall momentum of the chart: Bullish
The price could see a short-term pullback toward the pivot before rising again toward the 1st resistance.
Pivot: 207.17
Supporting reasons: Identified as an overlap resistance that aligns with the 50% Fibonacci retracement, where selling pressures could intensify and potentially cap any upward retracement
1st support: 205.32
Supporting reasons: Identified as an overlap support, indicating a potential level where the price could stabilize once more.
1st resistance: 208.94
Supporting reasons: Identified as a swing high resistance, indicating a potential level that could halt further upward movement.
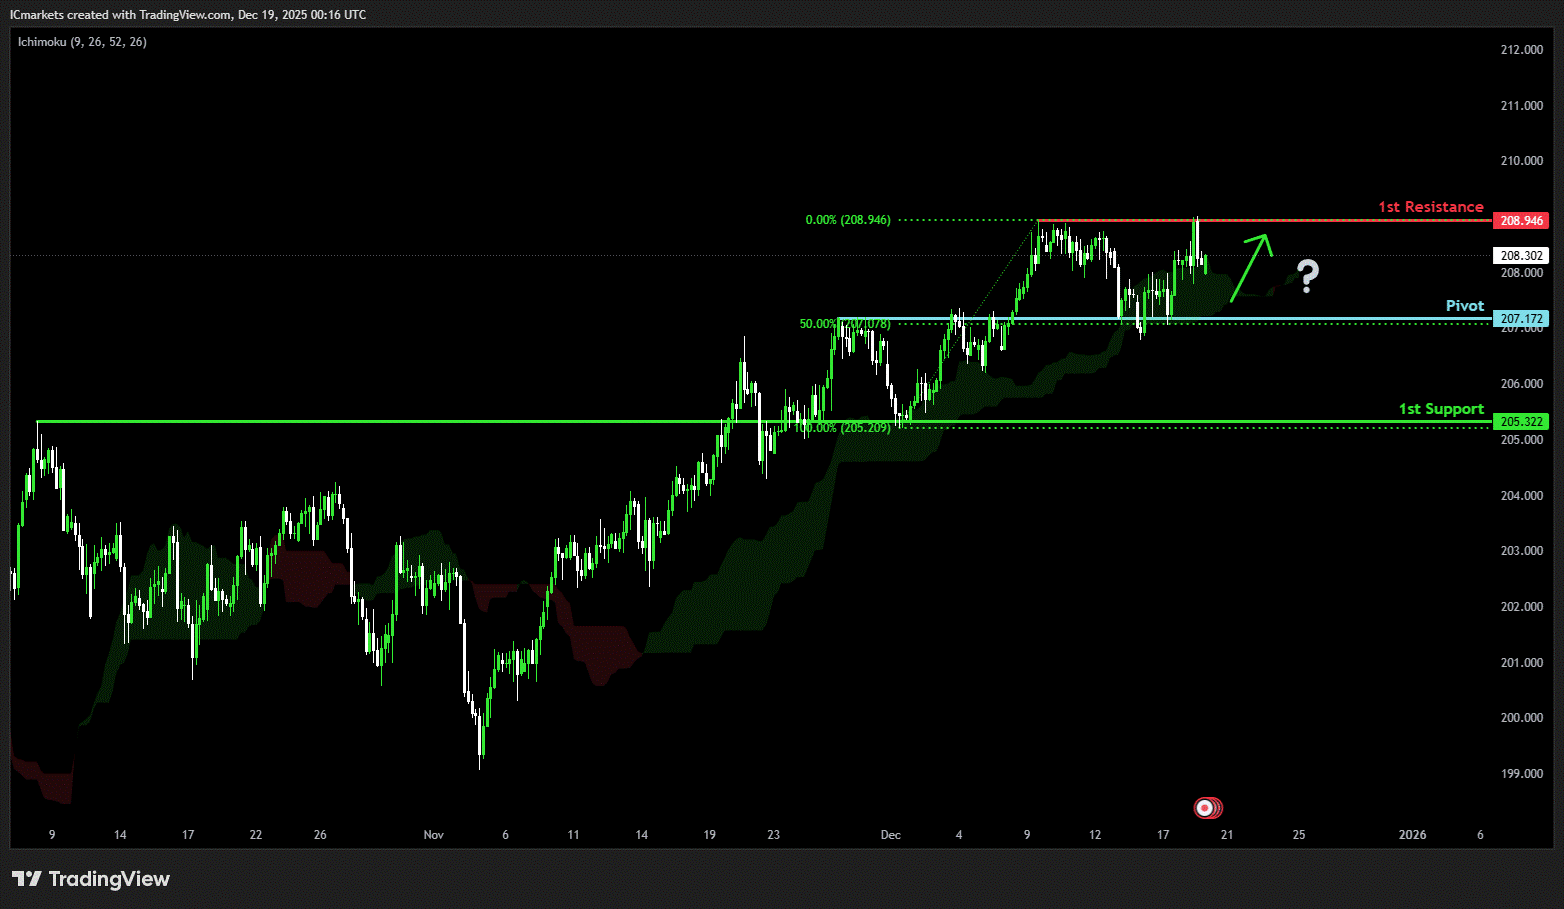
USD/CHF:
Potential Direction: Bearish
Overall momentum of the chart: Bearish
The price could see a short-term pullback toward the pivot before continuing its bearish move down toward the 1st support.
Pivot: 0.7987
Supporting reasons: Identified as a pullback resistance, where selling pressures could intensify and potentially cap any upward retracement.
1st support: 0.7926
Supporting reasons: Identified as a pullback support that aligns with the 78.6% Fibonacci retracement, indicating a potential level where the price could stabilize once again.
1st resistance: 0.8028
Supporting reasons: Identified as a pullback resistance, indicating a potential level that could cap further upward movement.
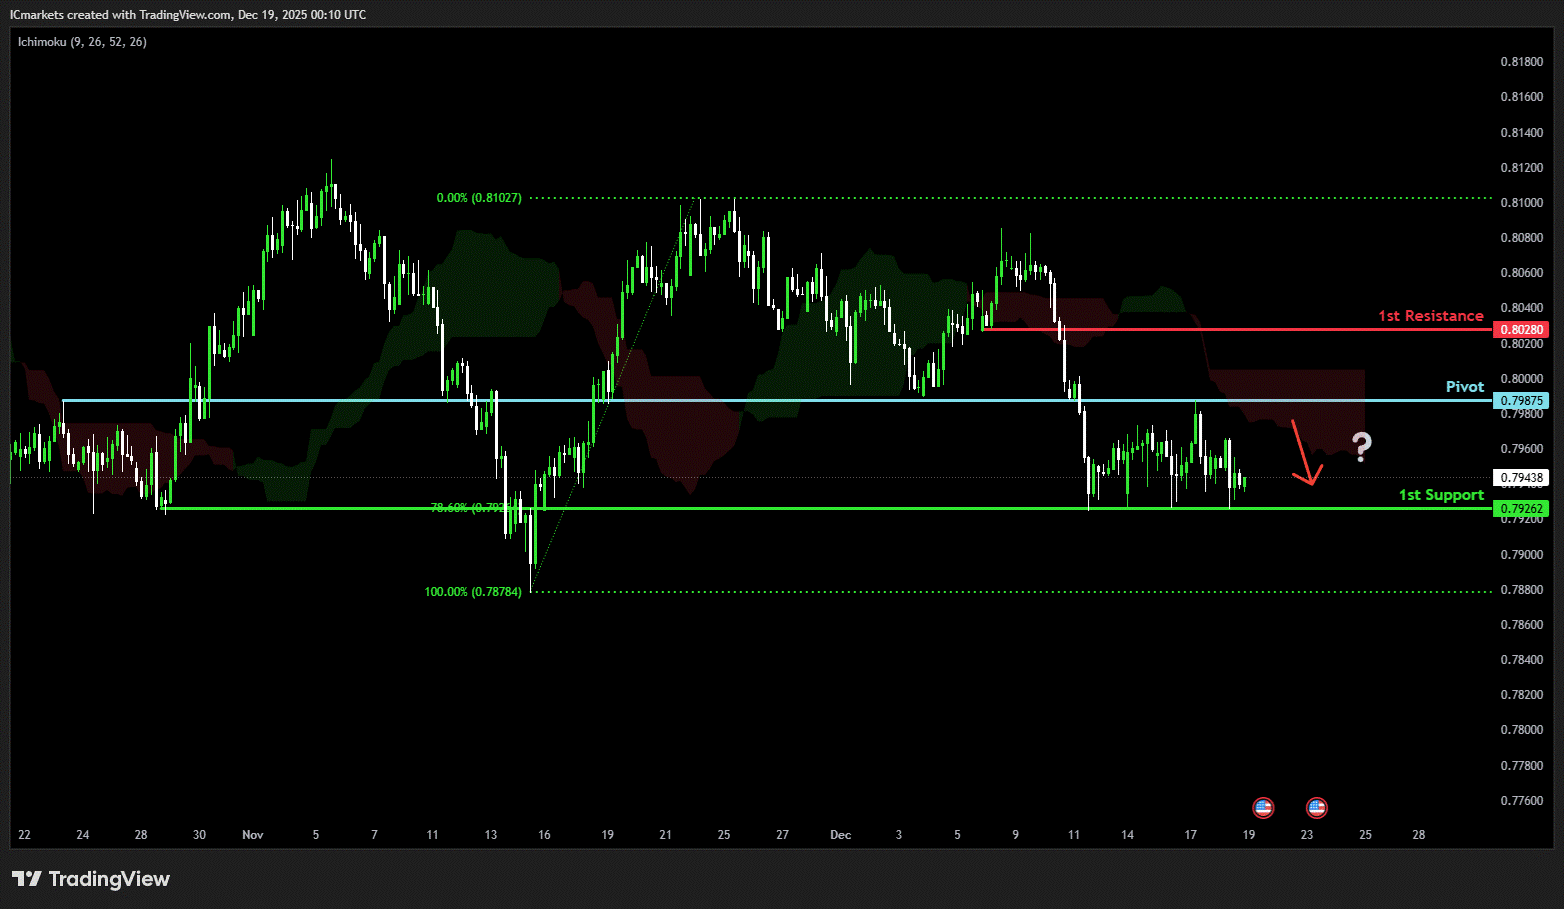
USD/JPY:
Potential Direction: Bearish
Overall momentum of the chart: Bullish
The price has already reacted off the pivot and may continue its bearish move toward the 1st support.
Pivot: 155.89
Supporting reasons: Identified as an overlap resistance, where selling pressures could intensify and potentially cap any upward retracement
1st support: 154.44
Supporting reasons: Identified as an overlap support, indicating a strong area where buyers might return, and the price could stabilize once again.
1st resistance: 156.95
Supporting reasons: Identified as a swing high resistance. This level represents the next key area where upward movement could be capped amid increased selling pressure
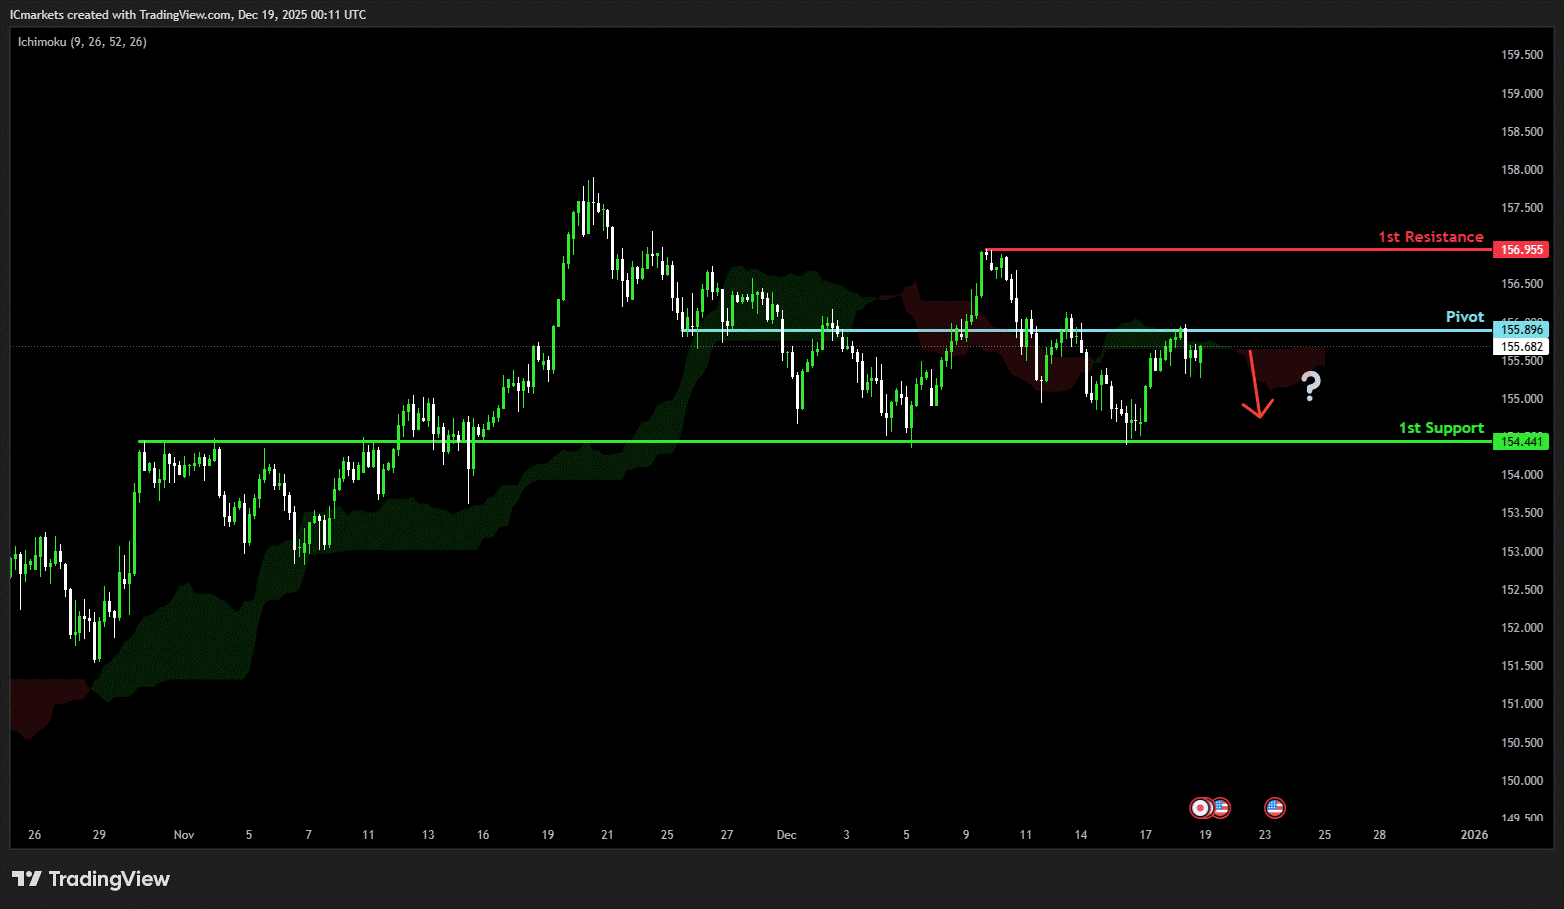
USD/CAD:
Potential Direction: Bearish
Overall momentum of the chart: Bearish
The price could see a short-term pullback toward the pivot before continuing its bearish move down toward the 1st support.
Pivot: 1.3810
Supporting reasons: Identified as a pullback resistance that aligns closely with the 23.6% Fibonacci retracement, where selling pressures could intensify and potentially cap any upward retracement.
1st support: 1.3728
Supporting reasons: Identified as a swing low support, indicating a key level where the price could stabilize once more.
1st resistance: 1.3889
Supporting reasons: Identified as a pullback resistance that aligns closely with the 38.2% Fibonacci retracement, making it a possible target for bullish advances and a level where some sellers could return to cap gains
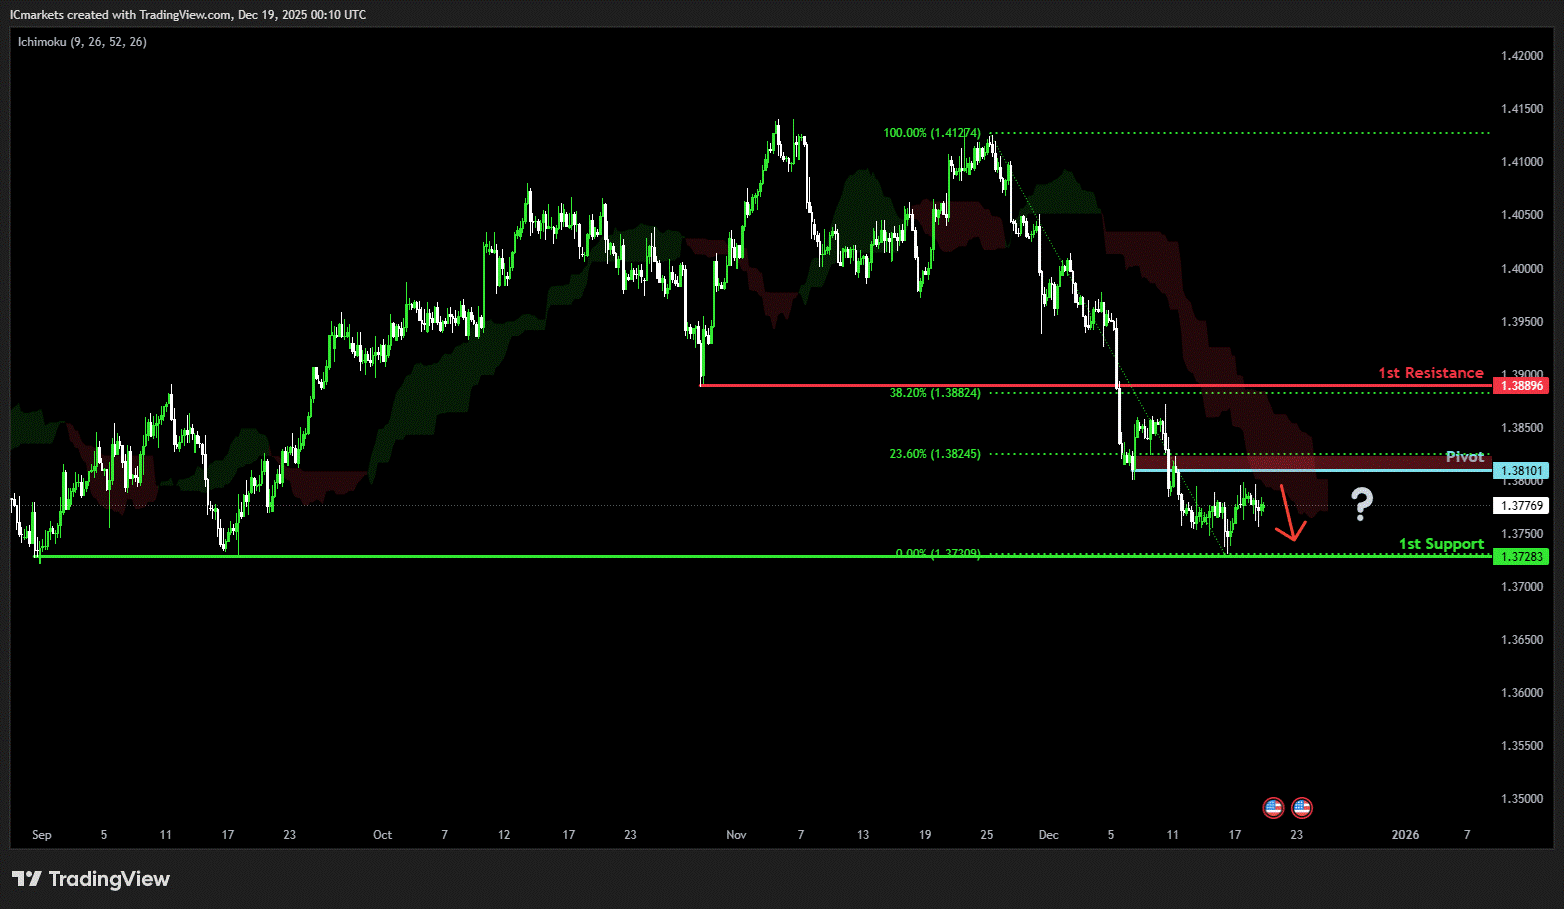
AUD/USD:
Potential Direction: Bearish
Overall momentum of the chart: Bullish
The price has already reacted off the pivot and may continue its bearish move toward the 1st support.
Pivot: 0.6622
Supporting reasons: Identified as a pullback resistance, where selling pressures could intensify and potentially cap any upward retracement.
1st support: 0.6572
Supporting reasons: Identified as a pullback support that aligns with the 38.6% Fibonacci retracement, this area has provided strong support historically and may attract buying interest for a potential short-term bounce
1st resistance: 0.6684
Supporting reasons: Identified as an overlap resistance, indicating a potential area that could halt any further upward movement.
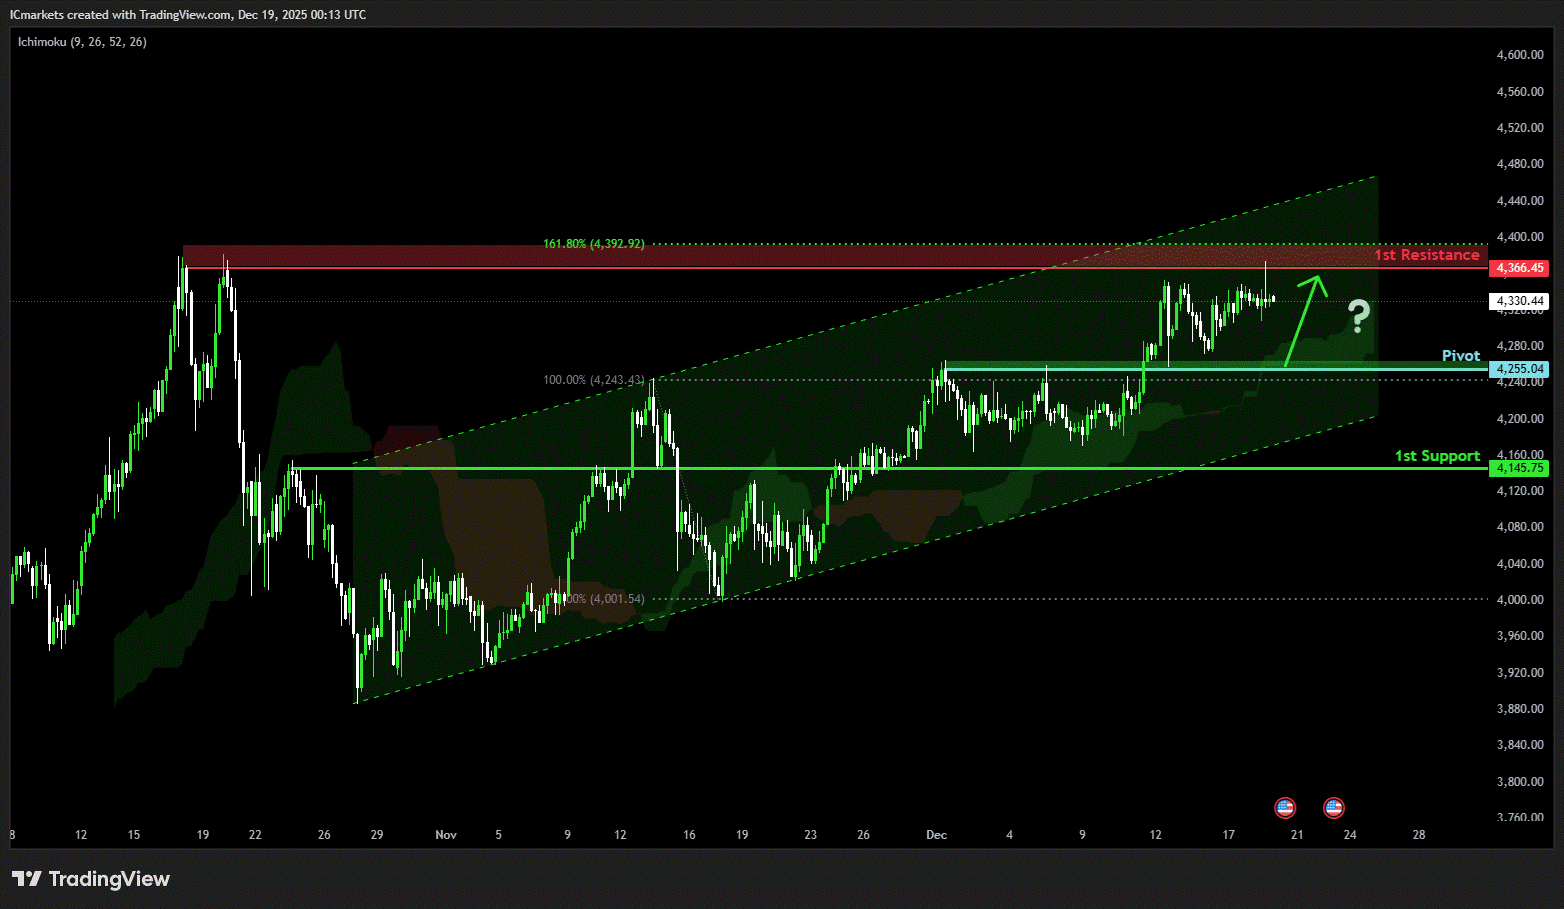
NZD/USD
Potential Direction: Bearish
Overall momentum of the chart: Bullish
The price has already reacted off the pivot and may continue its bearish move toward the 1st support.
Pivot: 0.5796
Supporting reasons: Identified as an overlap resistance, where selling pressures could intensify and potentially cap any upward retracement.
1st support: 0.5743
Supporting reasons: Identified as a pullback support that aligns with the 38.2% Fibonacci retracement, this area has provided strong support historically and may attract buying interest for a potential short-term bounce
1st resistance: 0.5831
Supporting reasons: Identified as a swing high resistance, indicating a potential area that could halt any further upward movement.
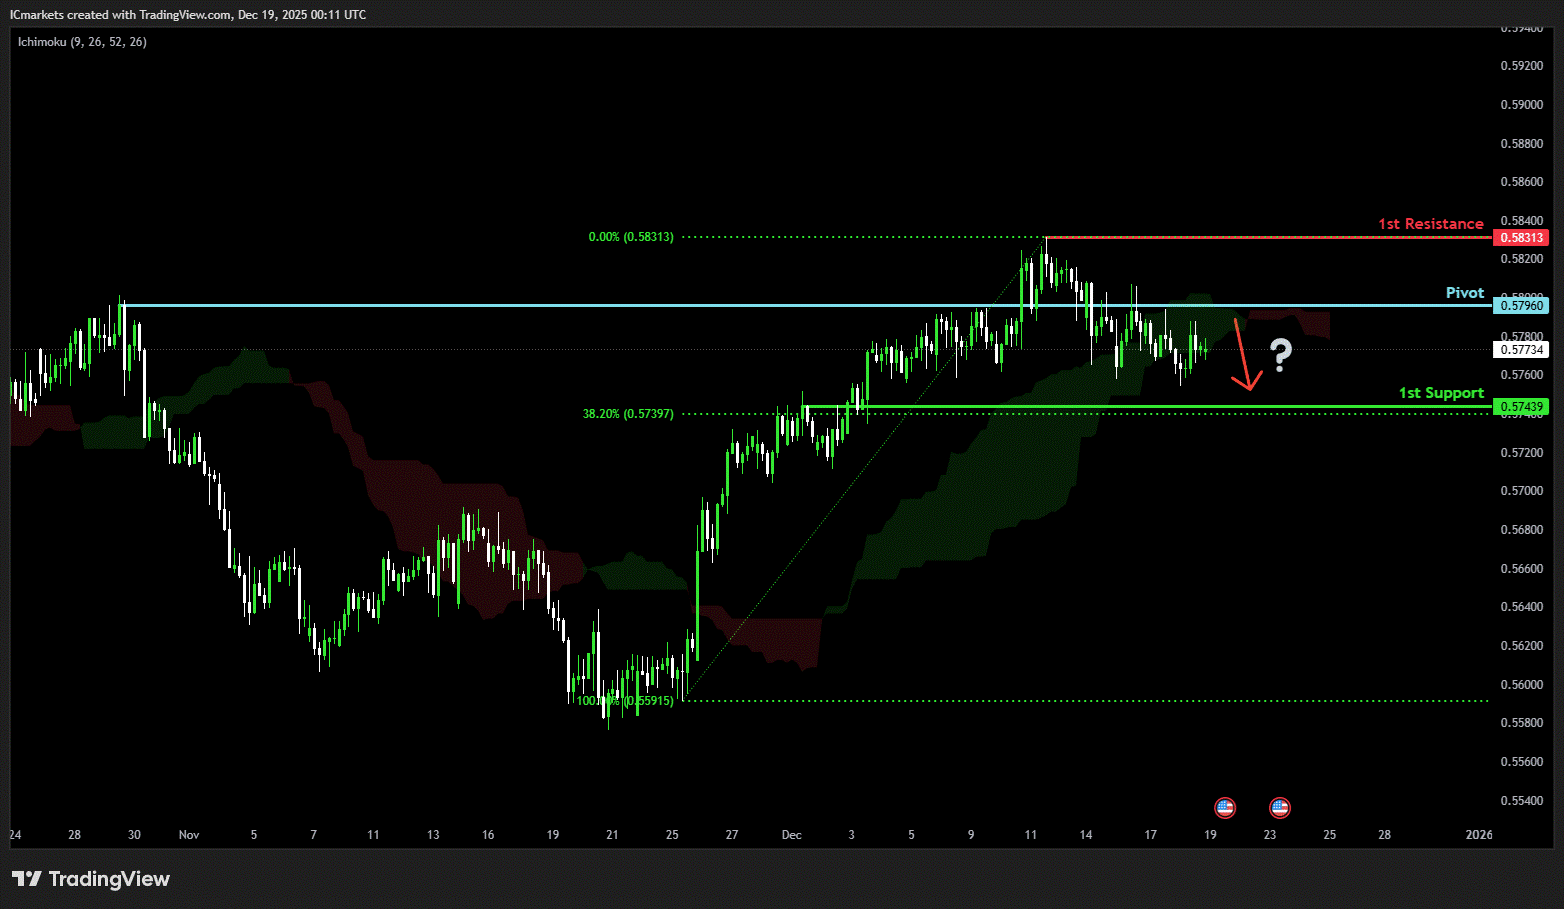
US30 (DJIA):
Potential Direction: Bearish
Overall momentum of the chart: Bullish
The price could see a short-term pullback toward the pivot before continuing its bearish move down toward the 1st support.
Pivot: 48,412.06
Supporting reasons: Identified as an overlap resistance, where selling pressures could intensify and potentially cap any upward retracement.
1st support: 47,724.66
Supporting reasons: Identified as a pullback support, suggesting a potential area where the price could stabilize once again.
1st resistance: 48,879.50
Supporting reasons: Identified as a swing high resistance, indicating a potential area that could halt any further upward movement.
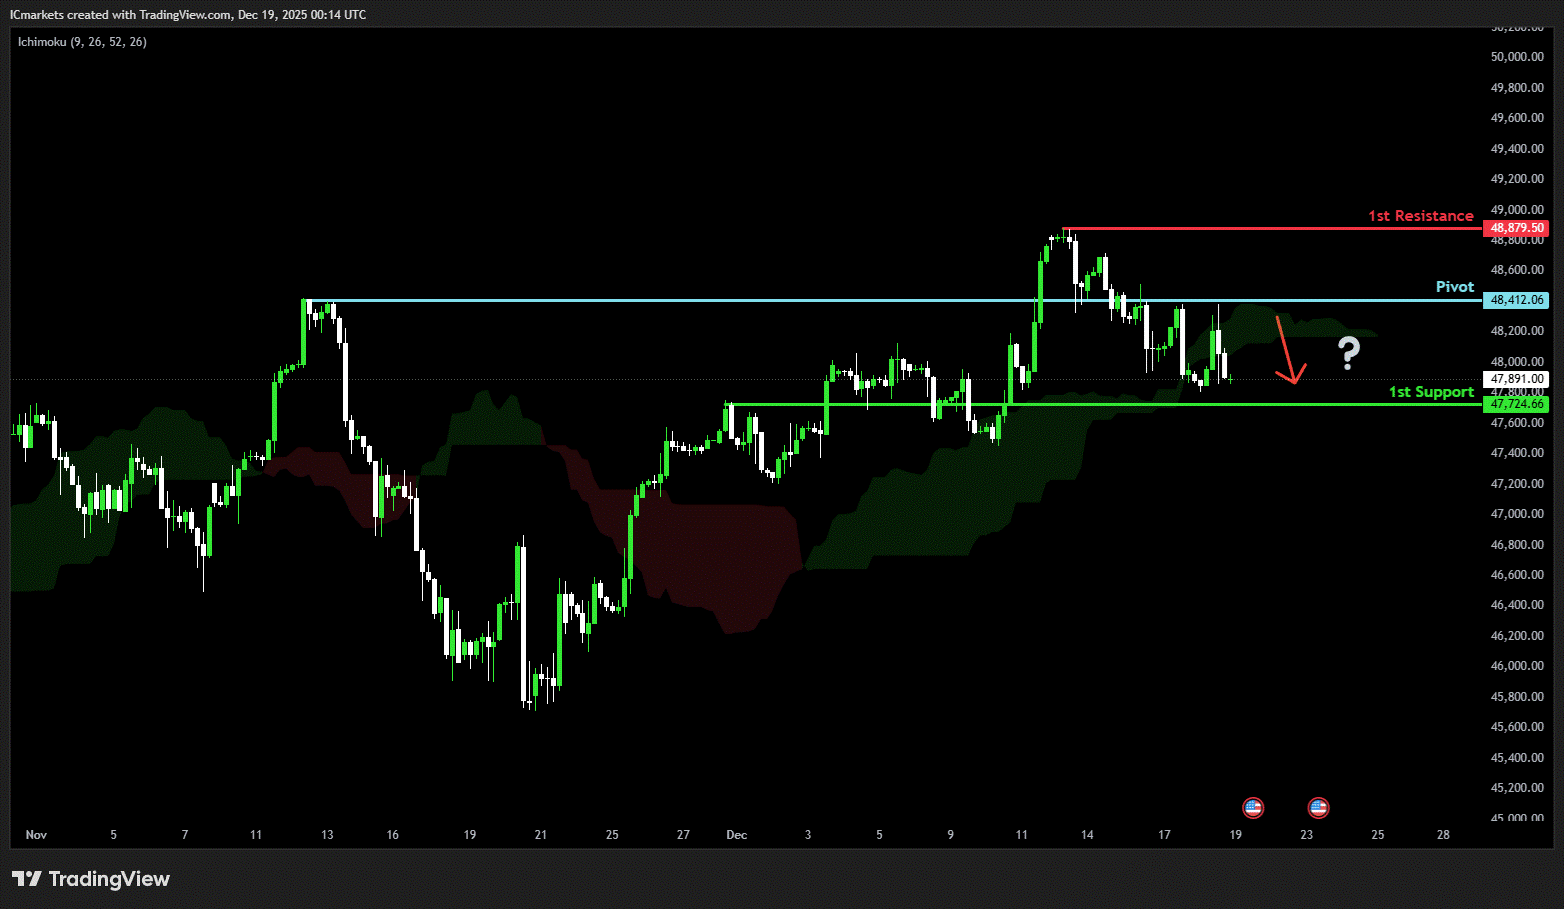
DE40 (DAX):
Potential Direction: Bearish
Overall momentum of the chart: Bullish
The price could see a short-term pullback toward the pivot before continuing its bearish move down toward the 1st support.
Pivot: 24,217.35
Supporting reasons: Identified as an overlap resistance, where selling pressures could intensify and potentially cap any upward retracement.
1st support: 23,860.89
Supporting reasons: Identified as an overlap support, indicating a key level where the price could stabilize once more.
1st resistance: 24,444.50
Supporting reasons: Identified as a swing high resistance that aligns with the 100% Fibonacci projection, indicating a potential area that could halt any further upward movement.
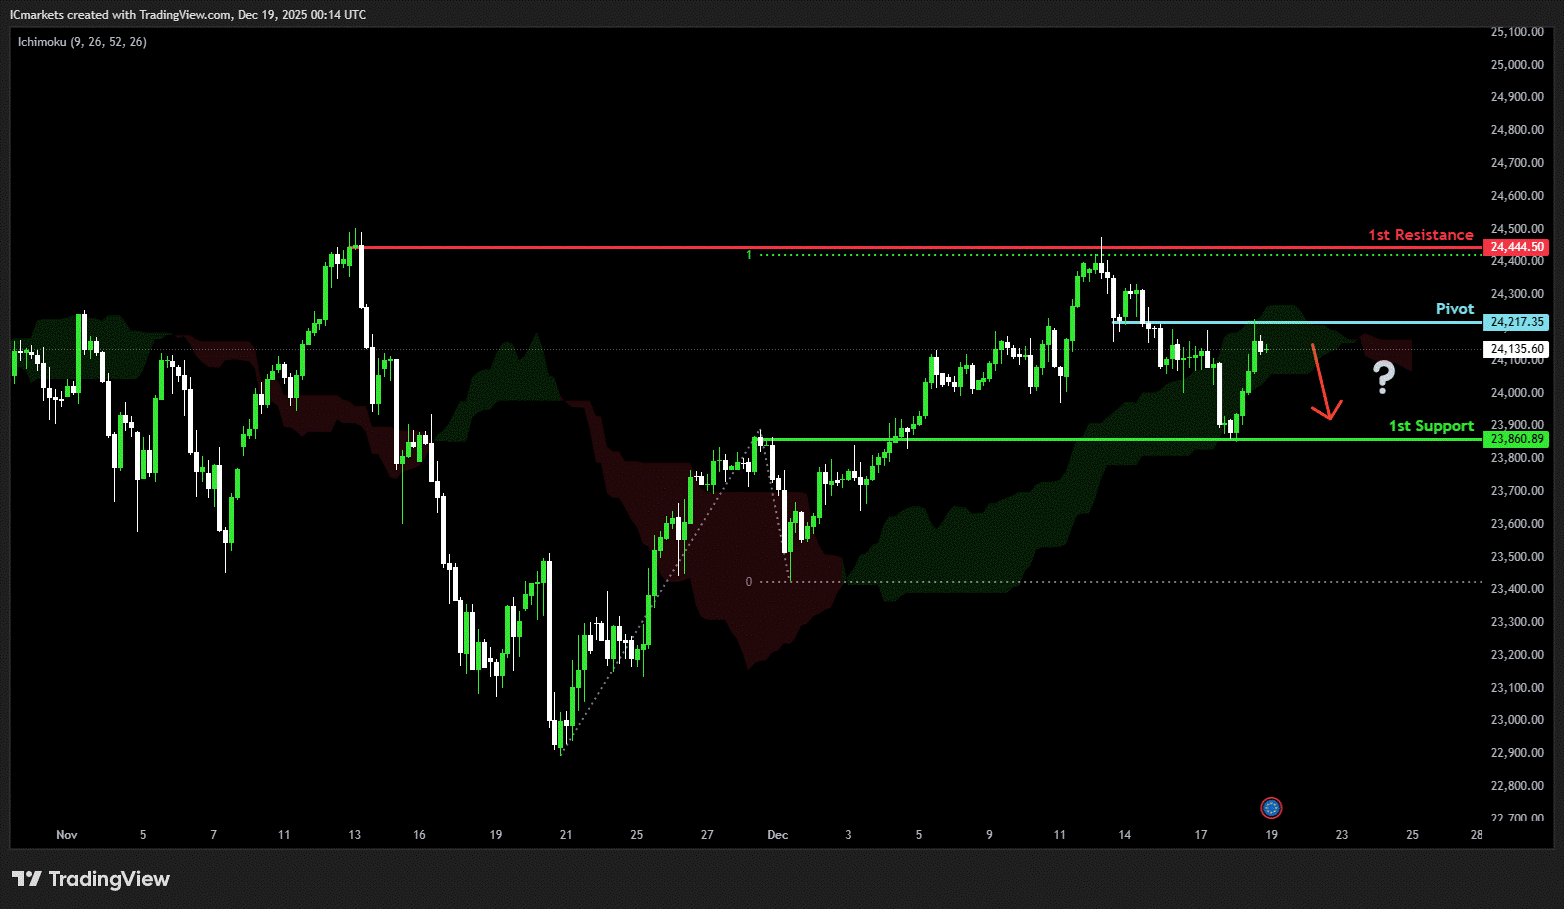
US500 (S&P 500):
Potential Direction: Bearish
Overall momentum of the chart: Bullish
The price could see a short-term pullback toward the pivot before continuing its bearish move down toward the 1st support.
Pivot: 6,828.80
Supporting reasons: Identified as an overlap resistance, where selling pressures could intensify and potentially cap any upward retracement.
1st support: 6,728.73
Supporting reasons: Identified as an overlap support that aligns with the 50% Fibonacci retracement, indicating a potential level where the price could stabilize once again.
1st resistance: 6,923.08
Supporting reasons: Identified as a swing low resistance, indicating a potential area that could halt any further upward movement.
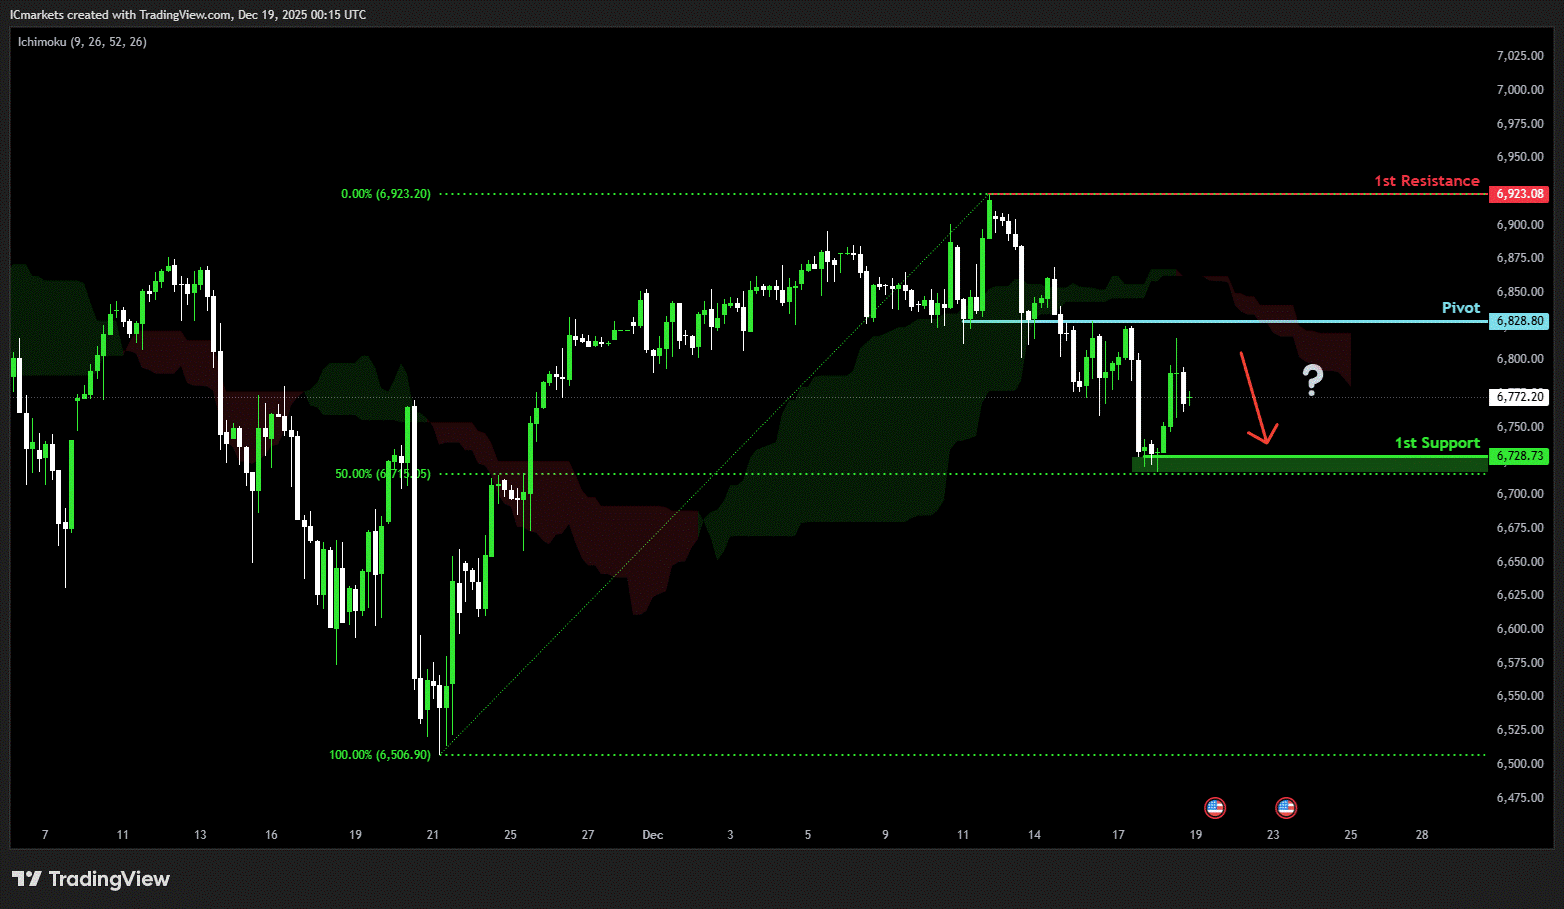
BTC/USD (Bitcoin):
Potential Direction: Bearish
Overall momentum of the chart: Bearish
The price has already reacted off the pivot and may continue its bearish move toward the 1st support.
Pivot: 88,893.73
Supporting reasons: Identified as an overlap resistance, where selling pressures could intensify and potentially cap any upward retracement.
1st support: 81,604.89
Supporting reasons: Identified as a swing low support, indicating a potential level where the price could stabilize once more.
1st resistance: 94,626.23
Supporting reasons: Identified as an overlap resistance that aligns with the 50% Fibonacci retracement, indicating a potential area that could halt any further upward movement.
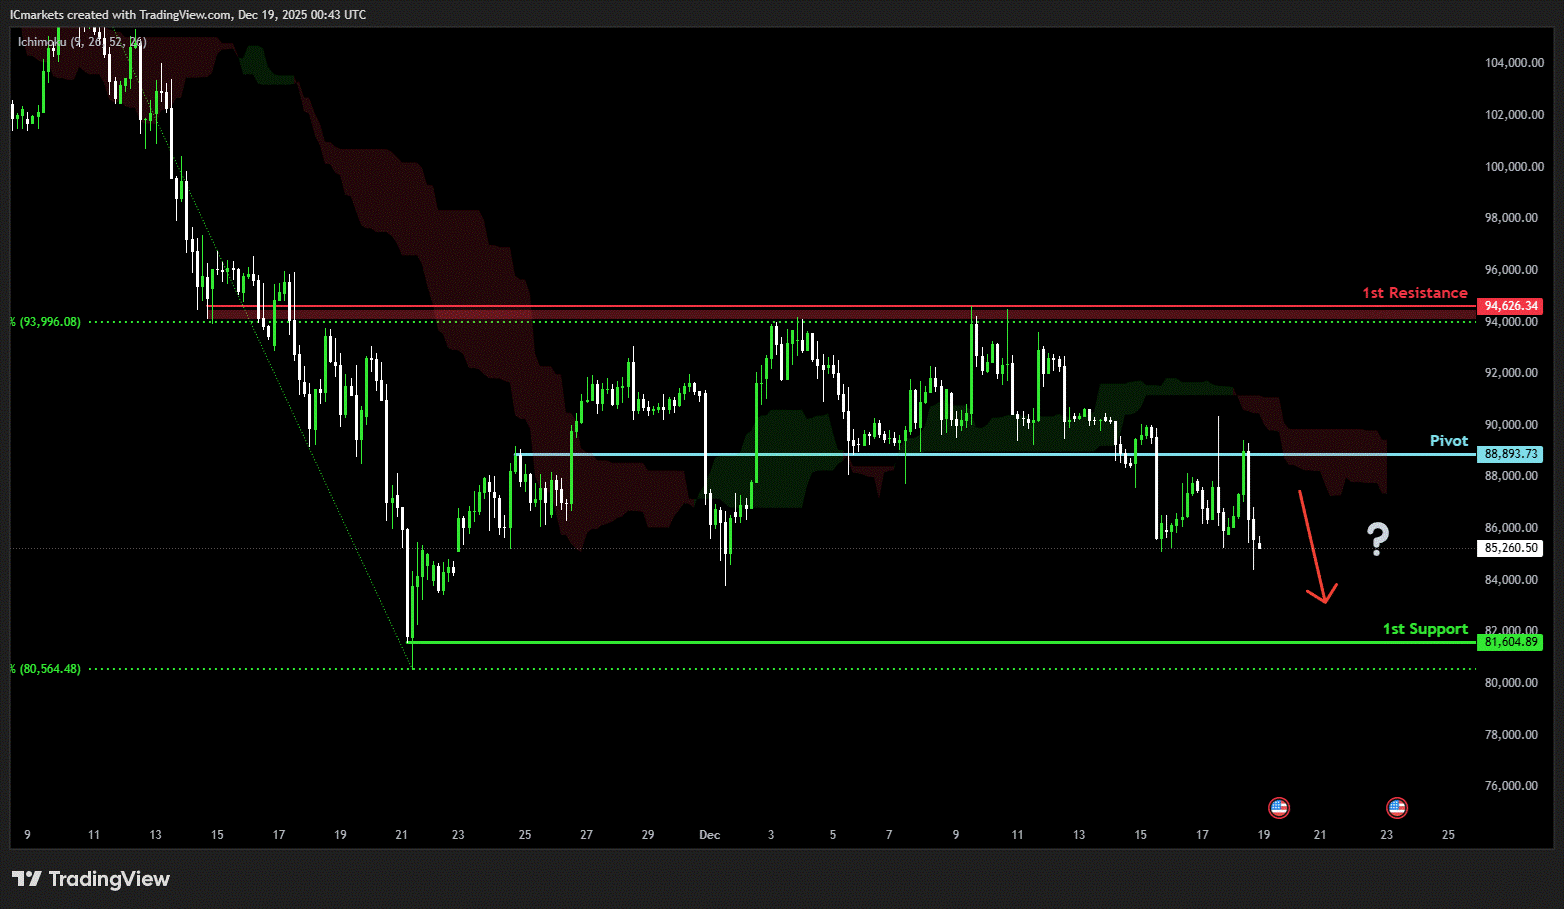
ETH/USD (Ethereum):
Potential Direction: Bearish
Overall momentum of the chart: Bullish
The price has already reacted off the pivot and may continue its bearish move toward the 1st support.
Pivot: 3,014.29
Supporting reasons: Identified as an overlap resistance, where selling pressures could intensify and potentially cap any upward retracement.
1st support: 2,740.05
Supporting reasons: Identified as a swing low support, indicating a potential level where the price could stabilize once more.
1st resistance: 3,206.26
Supporting reasons: Identified as a pullback resistance, indicating a potential area that could halt any further upward movement.
WTI/USD (Oil):
Potential Direction: Bearish
Overall momentum of the chart: Bullish
The price could see a short-term pullback toward the pivot before continuing its bearish move down toward the 1st support.
Pivot: 57.33
Supporting reasons: Identified as a pullback resistance, where selling pressures could intensify and potentially cap any upward retracement.
1st support: 55.04
Supporting reasons: Identified as a swing low support that aligns with the 161.8%% Fibonacci extension and the 100% Fibonacci projection, indicating a key level where the price could stabilize once more.
1st resistance: 58.55
Supporting reasons: Identified as a pullback resistance, indicating a potential area that could halt any further upward movement.
XAU/USD (GOLD):
Potential Direction: Bullish
Overall momentum of the chart: Bullish
The price could see a short-term pullback toward the pivot before rising again toward the 1st resistance.
Pivot: 4,255.04
Supporting reasons: Identified as a pullback support, where renewed buying pressure could emerge to push the price higher.
1st support: 4,145.75
Supporting reasons: Identified as a pullback support, indicating a key level where the price could stabilize once more.
1st resistance: 4,366.45
Supporting reasons: Identified as a swing high resistance that aligns with the 161.8% Fibonacci extension, indicating a potential area that could halt any further upward movement.
The accuracy, completeness and timeliness of the information contained on this site cannot be guaranteed. IC Markets Global does not warranty, guarantee or make any representations, or assume any liability regarding financial results based on the use of the information in the site.
News, views, opinions, recommendations and other information obtained from sources outside of www.icmarkets.com, used in this site are believed to be reliable, but we cannot guarantee their accuracy or completeness. All such information is subject to change at any time without notice. IC Markets Global assumes no responsibility for the content of any linked site.
The fact that such links may exist does not indicate approval or endorsement of any material contained on any linked site. IC Markets Global is not liable for any harm caused by the transmission, through accessing the services or information on this site, of a computer virus, or other computer code or programming device that might be used to access, delete, damage, disable, disrupt or otherwise impede in any manner, the operation of the site or of any user’s software, hardware, data or property.
The post Friday 19th December 2025: Technical Outlook and Review first appeared on IC Markets | Official Blog.
Ex-Dividend 19/12/2025
424688 December 18, 2025 17:14 ICMarkets Market News
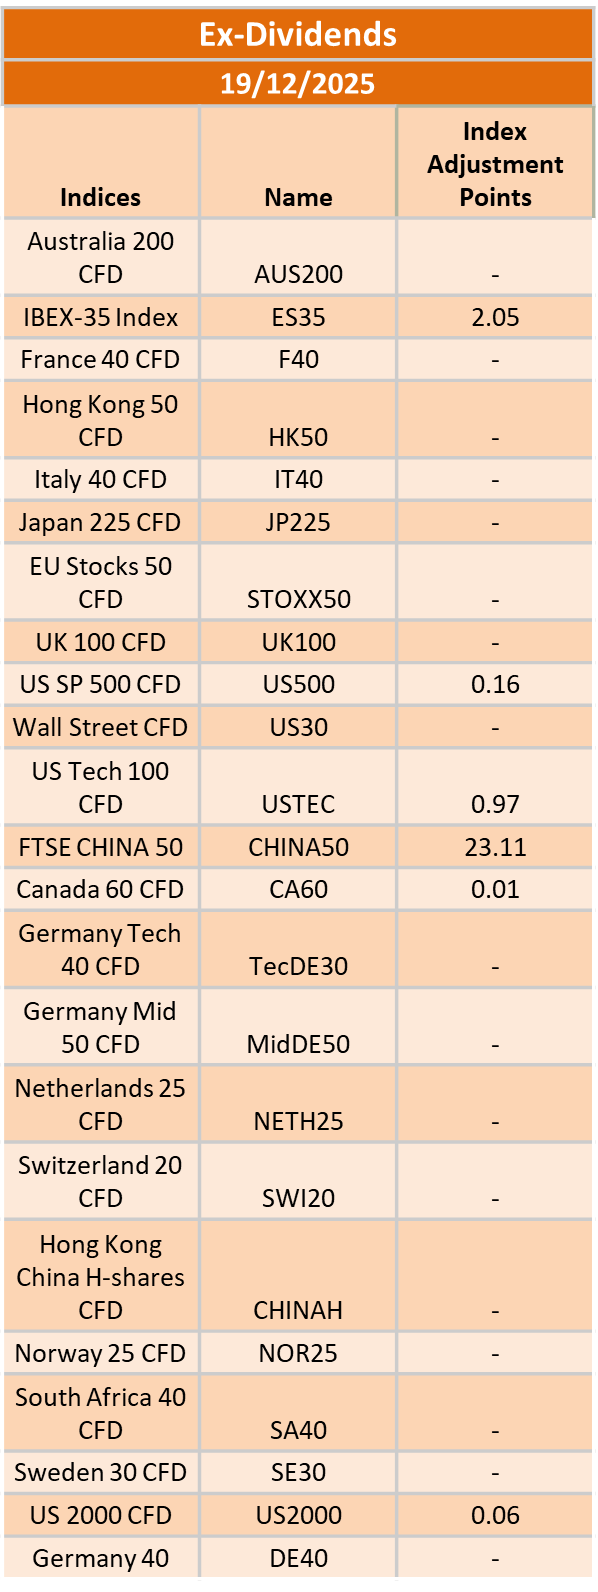
The post Ex-Dividend 19/12/2025 first appeared on IC Markets | Official Blog.
General Market Analysis – 18/12/25
424686 December 18, 2025 16:14 ICMarkets Market News
US Stocks Crash as Tech Concerns Increase – Nasdaq Down 1.8%
US equity markets moved lower yesterday as renewed concerns around the technology sector weighed on sentiment, dragging all three major indices into negative territory. The Nasdaq underperformed, leading losses as investors once again reassessed stretched valuations across large-cap tech. Treasury markets were relatively subdued, while the US dollar regained some of its recent lost ground against the major currencies. The Dow Jones fell 0.47% to close at 47,885, while the S&P 500 declined 1.16% to 6,721. The Nasdaq saw heavier losses, sliding 1.81% to finish at 22,693. The US dollar index rose 0.25% to 98.40. In rates, the US 2-year Treasury yield edged 0.2 basis points lower to 3.485%, while the 10-year yield ticked up 1.0 basis point to 4.155%. Commodity markets were more active, with oil prices surging after President Trump ordered a blockade of all oil tankers under sanctions entering and leaving Venezuela, raising fresh concerns around global supply. Brent crude jumped 2.87% to $60.62 per barrel, while WTI gained 2.97% to $56.90. Gold extended its advance as haven demand increased, pushing prices higher and back toward recent record levels, ultimately rising 0.99% to $4,345.12 by the close.
Huge Calendar Day Ahead for Traders
Markets will be closely watching a busy slate of economic data and central bank updates today. Early in the session, New Zealand releases its GDP figures, with the market expecting the quarterly number to rise 0.9%. The London session sees two key central bank rate updates, with the Bank of England set to update markets on its latest rate call, the market expecting them to reduce rates from 4% to 3.75%. This is swiftly followed by the ECB’s rate decision, although they are expected to keep rates on hold on this occasion. As always, both banks’ statements and press conferences have the potential to move markets more than the actual rate call, with forward guidance key as we move into 2026. Crucial US CPI data (exp +3.1% y/y) is due out close to the New York open, alongside the Weekly Jobless Claims numbers (exp 224k) and the Philly Fed Manufacturing Index update (exp 2.5).
The post General Market Analysis – 18/12/25 first appeared on IC Markets | Official Blog.