Articles
Thursday 30th October 2025: Technical Outlook and Review
422899 October 30, 2025 16:00 ICMarkets Market News
DXY (U.S. Dollar Index):
Potential Direction: Bullish
Overall momentum of the chart: Bearish
The price has already bounced off the pivot and may continue its bullish move toward the 1st resistance
Pivot: 98.55
Supporting reasons: Identified as an overlap support, where renewed buying pressure could emerge to push the price higher.
1st support: 98.00
Supporting reasons: Identified as an overlap support that aligns closely with the 50% Fibonacci , indicating a potential area where the price could again stabilize.
1st resistance: 99.53
Supporting reasons: Identified as an overlap resistance, indicating a potential area that could halt any further upward movement
EUR/USD:
Potential Direction: Bearish
Overall momentum of the chart: Bullish
The price could see a short-term pullback toward the pivot before continuing its bearish move down toward the 1st support.
Pivot: 1.1620
Supporting reasons: Identified as a pullback resistance, where selling pressures could intensify and potentially cap any upward retracement.
1st support: 1.1553
Supporting reasons: Identified as a swing low support that aligns with the 127.2% Fibonacci extension, indicating a potential level where the price could stabilize once again.
1st resistance: 1.1666
Supporting reasons: Identified as a pullback resistance that aligns closely with the 61.8% Fibonacci retracement, indicating a potential level that could cap further upward movement.
EUR/JPY:
Potential Direction: Bearish
Overall momentum of the chart: Bullish
The price has already reacted off the pivot and may continue its bearish move toward the 1st support
Pivot: 177.75
Supporting reasons: Identified as a swing high resistance, where selling pressures could intensify and potentially cap any upward retracement
1st support: 174.92
Supporting reasons: Identified as an overlap support, indicating a potential area where the price could again stabilize.
1st resistance: 179.80
Supporting reasons: Identified as a resistance that is supported by the 161.8% Fibonacci extension, indicating a potential level that could cap further upward movement.
EUR/GBP:
Potential Direction: Bullish
Overall momentum of the chart: Bullish
The price could fall toward the pivot and could make a short-term pullback toward this level before rising again toward the 1st resistance.
Pivot: 0.8749
Supporting reasons: Identified as a pullback support, where renewed buying pressure could emerge to push the price higher.
1st support: 0.8718
Supporting reasons: Identified as overlap support, indicating a potential area where the price could stabilize once more.
1st resistance: 0.8809
Supporting reasons: Identified as a resistance that is supported by the 161.8% Fibonacci extension, indicating a potential level that could cap further upward movement.
GBP/USD:
Potential Direction: Bearish
Overall momentum of the chart: Bullish
The price could see a short-term pullback toward the pivot before continuing its bearish move down toward the 1st support.
Pivot: 1.326
Supporting reasons: Identified as a pullback resistance, where selling pressures could intensify and potentially cap any upward retracement.
1st support: 1.3115
Supporting reasons: Identified as a support that is supported by the 161.8% Fibonacci extension, indicating a potential area where the price could stabilize once more.
1st resistance: 1.3355
Supporting reasons: Identified as an overlap resistance, indicating a potential level that could halt further upward movement.
GBP/JPY:
Potential Direction: Bearish
Overall momentum of the chart: Bullish
The price could rise toward the pivot and make a short-term pullback toward this level before continuing its bearish move down toward the 1st support.
Pivot: 202.74
Supporting reasons: Identified as a pullback resistance, where selling pressures could intensify and potentially cap any upward retracement.
1st support: 200.47
Supporting reasons: Identified as a pullback support, indicating a potential level where the price could stabilize once more.
1st resistance: 204.03
Supporting reasons: Identified as a swing high resistance, indicating a potential level that could halt further upward movement.
USD/CHF:
Potential Direction: Bullish
Overall momentum of the chart: Bearish
The price is falling toward the pivot and could make a short-term pullback toward this level before rising again toward the 1st resistance.
Pivot: 0.7921
Supporting reasons: Identified as an overlap support that aligns with the 61.8% Fibonacci retracement, where renewed buying pressure could emerge to push the price higher.
1st support: 0.7874
Supporting reasons: Identified as a swing low support, indicating a potential level where the price could stabilize once again.
1st resistance: 0.7996
Supporting reasons: Identified as an overlap resistance that aligns with the 61.8% Fibonacci retracement, indicating a potential level that could cap further upward movement.

USD/JPY:
Potential Direction: Bearish
Overall momentum of the chart: Bullish
The price could see a short-term pullback toward the pivot before continuing its bearish move down toward the 1st support.
Pivot: 153.25
Supporting reasons: Identified as a swing high resistance, where selling pressures could intensify and potentially cap any upward retracement.
1st support: 151.18
Supporting reasons: Identified as a pullback support, indicating a strong area where buyers might return, and the price could stabilize once again.
1st resistance: 154.300
Supporting reasons: Identified as a resistance that is supported by the 161.8% Fibonacci extension. This level represents the next key area where upward movement could be capped amid increased selling pressure
USD/CAD:
Potential Direction: Bearish
Overall momentum of the chart: Bearish
The price could see a short-term pullback toward the pivot before continuing its bearish move down toward the 1st support.
Pivot: 1.3969
Supporting reasons: Identified as a pullback resistance, where selling pressures could intensify and potentially cap any upward retracement.
1st support: 1.3079
Supporting reasons: Identified as a pullback support that aligns with the 61.8% Fibonacci retracement, indicating a key level where the price could stabilize once more.
1st resistance: 1.4029
Supporting reasons: Identified as an overlap resistance, making it a possible target for bullish advances and a level where some sellers could return to cap gains
AUD/USD:
Potential Direction: Bullish
Overall momentum of the chart: Bullish
The price could make a short-term pullback toward the pivot before rising again toward the 1st resistance
Pivot: 0.6524
Supporting reasons: Identified as a pullback support, where renewed buying pressure could emerge to push the price higher.
1st support: 0.6484
Supporting reasons: Identified as a swing low support, this area has provided strong support historically and may attract buying interest for a potential short-term bounce
1st resistance: 0.6590
Supporting reasons: Identified as a pullback resistance, indicating a potential area that could halt any further upward movement.
NZD/USD
Potential Direction: Bearish
Overall momentum of the chart: Bullish
The price could see a short-term pullback toward the pivot before continuing its bearish move down toward the 1st support.
Pivot: 0.5803
Supporting reasons: Identified as a pullback resistance that aligns with the 78.6% Fibonacci retracement, where selling pressures could intensify and potentially cap any upward retracement.
1st support: 0.5755
Supporting reasons: Identified as an overlap support, this area has provided strong support historically and may attract buying interest for a potential short-term bounce
1st resistance: 0.5837
Supporting reasons: Identified as an overlap resistance, indicating a potential area that could halt any further upward movement.
US30 (DJIA):
Potential Direction: Bullish
Overall momentum of the chart: Bullish
The price could see a short-term pullback toward the pivot before rising again toward the 1st resistance.
Pivot: 47,059.94
Supporting reasons: Identified as a pullback support, indicating a potential area where buying interest could pick up
1st support: 46,447.27
Supporting reasons: Identified as a pullback support, suggesting a potential area where the price could stabilize once again.
1st resistance: 48,184.09
Supporting reasons: Identified as a resistance that is supported by the 161.8% Fibonacci extension and the 100% Fibonacci projection, indicating a potential area that could halt any further upward movement.
DE40 (DAX):
Potential Direction: Bearish
Overall momentum of the chart: Bullish
The price could see a short-term pullback toward the pivot before continuing its bearish move down toward the 1st support.
Pivot: 24,175.32
Supporting reasons: Identified as a pullback resistance that aligns with the 78.6% Fibonacci retracement, where selling pressures could intensify and potentially cap any upward retracement.
1st support: 23,935.25
Supporting reasons: Identified as a swing low support, indicating a key level where the price could stabilize once more.
1st resistance: 24,340.30
Supporting reasons: Identified as an overlap resistance, indicating a potential area that could halt any further upward movement.
US500 (S&P 500):
Potential Direction: Bullish
Overall momentum of the chart: Bullish
The price is falling toward the pivot and could make a short-term pullback toward this level before rising again toward the 1st resistance.
Pivot: 6,760.21
Supporting reasons: Identified as a pullback support, indicating a potential area where buying interest could pick up
1st support: 6,696.60
Supporting reasons: Identified as a pullback support, indicating a potential level where the price could stabilize once again.
1st resistance: 6,922.99
Supporting reasons: Identified as a resistance that is supported by the 161.8% Fibonacci extension, indicating a potential area that could halt any further upward movement.
BTC/USD (Bitcoin):
Potential Direction: Bearish
Overall momentum of the chart: Bullish
The price has already reacted off the pivot and may continue its bearish move toward the 1st support
Pivot: 116,139.03
Supporting reasons: Identified as a pullback resistance that aligns with the 100% Fibonacci projection, where selling pressures could intensify and potentially cap any upward retracement
1st support: 107,689.12
Supporting reasons: Identified as an overlap support, indicating a potential level where the price could stabilize once more.
1st resistance: 119,893.62
Supporting reasons: Identified as a pullback resistance, indicating a potential area that could halt any further upward movement.
ETH/USD (Ethereum):
Potential Direction: Bullish
Overall momentum of the chart: Bullish
The price has already bounced off the pivot and may continue its bullish move toward the 1st resistance
Pivot: 3,837.71
Supporting reasons: Identified as a pullback support that aligns with the 78.6% Fibonacci retracement, where renewed buying pressure could emerge to push the price higher.
1st support: 3,694.07
Supporting reasons: Identified as a swing low support, indicating a potential level where the price could stabilize once more.
1st resistance: 4,051.57
Supporting reasons: Identified as a pullback resistance, indicating a potential area that could halt any further upward movement.
WTI/USD (Oil):
Potential Direction: Bullish
Overall momentum of the chart: Bullish
The price has already bounced off the pivot and may continue its bullish move toward the 1st resistance
Pivot: 60.18
Supporting reasons: Identified as an overlap support that aligns with the 38.2% Fibonacci retracement, where renewed buying pressure could emerge to push the price higher.
1st support: 57.72
Supporting reasons: Identified as a pullback support that aligns with the 78.6% Fibonacci retracement, indicating a key level where the price could stabilize once more.
1st resistance: 63.15
Supporting reasons: Identified as an overlap resistance that aligns with the 61.8% Fibonacci retracement, indicating a potential area that could halt any further upward movement.
XAU/USD (GOLD):
Potential Direction: Bearish
Overall momentum of the chart: Bullish
The price could see a short-term pullback toward the pivot before continuing its bearish move down toward the 1st support.
Pivot: 4,053.83
Supporting reasons: Identified as a pullback resistance, where selling pressures could intensify and potentially cap any upward retracement.
1st support: 3,891.10
Supporting reasons: Identified as an overlap support that aligns closely with the 78.6% Fibonacci projection, indicating a key level where the price could stabilize once more.
1st resistance: 4,177.54
Supporting reasons: Identified as a pullback resistance, indicating a potential area that could halt any further upward movement.
The accuracy, completeness and timeliness of the information contained on this site cannot be guaranteed. IC Markets does not warranty, guarantee or make any representations, or assume any liability regarding financial results based on the use of the information in the site.
News, views, opinions, recommendations and other information obtained from sources outside of www.icmarkets.com, used in this site are believed to be reliable, but we cannot guarantee their accuracy or completeness. All such information is subject to change at any time without notice. IC Markets assumes no responsibility for the content of any linked site.
The fact that such links may exist does not indicate approval or endorsement of any material contained on any linked site. IC Markets is not liable for any harm caused by the transmission, through accessing the services or information on this site, of a computer virus, or other computer code or programming device that might be used to access, delete, damage, disable, disrupt or otherwise impede in any manner, the operation of the site or of any user’s software, hardware, data or property.
The post Thursday 30th October 2025: Technical Outlook and Review first appeared on IC Markets | Official Blog.

IC Markets – Asia Fundamental Forecast | 30 October 2025
422898 October 30, 2025 16:00 ICMarkets Market News
IC Markets – Asia Fundamental Forecast | 30 October 2025
What happened in the U.S. session?
The U.S. trading session was characterized by record-breaking equity performance fueled by major technology sector developments, positive U.S.-China trade framework progress, and strong corporate earnings that exceeded expectations. The Microsoft-OpenAI restructuring and Nvidia-Nokia partnership announcements catalyzed significant gains in tech megacaps, pushing the S&P 500 above 6,800 and the Nasdaq to new highs..
What does it mean for the Asia Session?
Thursday’s Asian session centers on the Bank of Japan’s policy decision and Tokyo CPI data, both critical for yen direction and regional market sentiment. The ECB meeting and European inflation/GDP data will drive EUR crosses, while the Australian dollar’s strength following hot inflation data positions it as an outperformer. Record highs in Japanese and South Korean equities face tests from central bank decisions, while gold’s rebound and cryptocurrency weakness add to market complexity. Traders should monitor central bank commentary closely, as tone and forward guidance will be more market-moving than the expected policy holds.
The Dollar Index (DXY)
Key news events today
No major news event
What can we expect from DXY today?
The US dollar demonstrated resilience, supported by Fed Chair Powell’s cautious stance on future rate cuts and optimism surrounding the US-China trade framework agreement. While the Fed delivered an expected 25 basis point cut, Powell’s message that December action is “not a foregone conclusion” provided a hawkish counterbalance. The breakthrough in US-China trade negotiations ahead of the Trump-Xi summit removed the threat of devastating 100% tariffs, boosting risk sentiment while preventing further dollar weakness.
Central Bank Notes:
- The Federal Open Market Committee (FOMC) voted, by majority, to lower the federal funds rate target range by 25 basis points to 3.75%–4.00% at its October 28–29, 2025, meeting, marking the second consecutive cut following the 25 basis points reduction in September.
- The Committee maintained its long-term objectives of maximum employment and 2% inflation, noting that the labor market continues to soften, with modest job creation and an unemployment rate edging higher. In comparison, inflation remains above target at around 3.0%.
- Policymakers highlighted ongoing downside risks to economic growth, tempered by signs of resilient economic activity. September’s consumer price index (CPI) came in slightly lower than expected at 3.0% year-over-year, easing inflation pressure but still warranting vigilance given tariff-driven price effects.
- Economic activity expanded modestly in the third quarter, with GDP growth estimates around 1.0% annualized; however, uncertainty remains elevated amid persistent global trade tensions and the U.S. government shutdown, which is impacting data availability.
- The updated Summary of Economic Projections reflects an anticipated unemployment rate averaging approximately 4.5% for 2025, with headline and core personal consumption expenditures (PCE) inflation projections holding near 3.0%, indicating a slow easing path ahead.
- The Committee emphasized its flexible, data-dependent approach and underscored that future policy adjustments will be guided by incoming labor market and inflation data. As in prior meetings, there was dissent, including one member advocating a more aggressive 50-basis-point cut.
- The FOMC announced the planned conclusion of its balance sheet reduction (quantitative tightening) program, intending to cease runoff in the near term to maintain market stability, with Treasury redemption caps held steady at $5 billion per month and agency mortgage-backed securities caps at $35 billion.
- The next meeting is scheduled for 9 to 10 December 2025.
Next 24 Hours Bias
Weak Bearish
Gold (XAU)
Key news events today
No major news event
What can we expect from Gold today?
Gold prices on Thursday are stabilizing around $4,000-$4,020 per ounce after volatile trading throughout late October. The precious metal faces a critical juncture as multiple factors converge: reduced safe-haven demand from improving US-China trade relations, widely anticipated Fed rate cuts supporting non-yielding assets, and key central bank meetings from both the BOJ and ECB. While short-term technical indicators suggest potential for further consolidation between $3,900-$4,100, the long-term outlook remains constructive given persistent central bank accumulation, elevated geopolitical uncertainty, and expectations of continued monetary easing from major economies.
Next 24 Hours Bias
Medium Bearish
The Australian Dollar (AUD)
Key news events today
No major news event
What can we expect from AUD today?
The Australian dollar is experiencing its strongest performance in three weeks, driven primarily by unexpectedly hot inflation data that has crushed near-term RBA rate cut expectations. The quarterly CPI jumping to 3.2% (from 2.1%) and trimmed mean inflation surging to 3.0% has prompted a hawkish reassessment of RBA policy, with markets now pricing in less than a 10% chance of a November rate cut. This stands in stark contrast to the dovish Federal Reserve, which delivered its second consecutive 25 basis point cut, creating favorable interest rate differentials for the AUD.
Central Bank Notes:
- The RBA held its cash rate steady at 3.60% at its October meeting on 29–30 September 2025, marking a second consecutive pause after August’s 25 basis point cut. The move affirms the Bank’s data-dependent approach as inflation trends within the target range.
- Inflation indicators remained stable through September, with headline CPI likely anchoring near 2.2%—comfortably within the 2–3% band. Insurance and housing costs remain sticky but are increasingly offset by moderation in discretionary goods.
- Trimmed mean inflation is estimated at around 2.8%, signaling underlying pressures remain contained. The Board continues to flag food and energy price volatility as short-term risks, though the broader disinflation narrative holds.
- Global conditions remain a source of uncertainty. U.S. policy expectations and uneven growth in China continue to weigh on commodities, even as trade disruptions have eased marginally since mid-year.
- Domestic growth shows resilience in the housing and services sectors, though manufacturing remains subdued. Household incomes have stabilized, but consumption remains only modest, capped by high borrowing costs.
- The labor market maintains relative tightness, though job growth has slowed notably since the first half of the year. Underutilization has ticked higher, but overall employment conditions remain supportive.
- Wage growth is plateauing, reflecting softer labor demand. Weak productivity continues to keep unit labor costs elevated, underscoring a medium-term concern highlighted repeatedly by the RBA.
- Household consumption prospects remain fragile. The combination of high rents and weak discretionary appetite suggests risks of a consumer-led slowdown in Q4 if confidence fails to rebound.
- The Board reiterated that subdued household spending poses risks to business sentiment and may dampen investment and job creation in the coming quarters.
- Monetary policy remains mildly restrictive. The RBA balanced confidence in inflation progress with caution around global and domestic demand risks, keeping further adjustments conditional on incoming data.
- The Bank reaffirmed its dual commitment to price stability and full employment, noting its readiness to act should conditions shift markedly.
- The next meeting is on 5 to 6 November 2025.
Next 24 Hours Bias
Medium Bullish
The Kiwi Dollar (NZD)
Key news events today
No major news event
What can we expect from NZD today?
The New Zealand Dollar is supported by optimism surrounding potential US-China trade de-escalation ahead of today’s Trump-Xi meeting and expectations of further Fed rate cuts. However, gains remain capped by domestic economic weakness, recent aggressive RBNZ easing, and elevated inflation. The Kiwi faces critical technical resistance around 0.5800, with near-term direction likely determined by the outcomes of both the Fed meeting and the Trump-Xi summit.
Central Bank Notes:
- The Monetary Policy Committee (MPC) agreed to cut the Official Cash Rate (OCR) by 50 basis points to 2.50% on 8 October 2025, exceeding market expectations for a smaller 25-basis-point reduction and signaling a stronger commitment to reviving growth.
- The decision was reached by consensus, marking a shift from previous split votes, and reflected policymakers’ shared view that sustained economic weakness and persistent disinflationary pressures required a more front-loaded policy response.
- Annual consumer price inflation stood at 2.7% in the June quarter and is seen nearing 3% for the September quarter—above the 2% midpoint but within the 1–3% target range. Despite high near-term readings, the MPC projects inflation will return toward 2% by the first half of 2026 as spare capacity and moderating tradables curb price momentum.
- Policymakers acknowledged that domestic demand remains weak, with household spending, business investment, and construction activity under pressure. While still elevated, services inflation is expected to ease gradually as wage growth slows and unemployment edges higher.
- Financial conditions have eased with expectations as wholesale and retail borrowing rates adjust to lower policy settings. Bank lending data indicate a modest uptick in mortgage approvals, though broader credit demand remains subdued.
- GDP growth stalled in the middle of 2025, with high-frequency indicators showing continued weakness into the third quarter. A combination of elevated costs for essentials and falling savings continues to restrain household consumption, while global trade frictions weigh on business sentiment.
- The MPC noted that global uncertainty—particularly from US trade regulation changes and soft Chinese demand—continues to pose downside risks to export sectors, though these are partly offset by a weaker New Zealand dollar improving competitiveness.
- Subject to data confirming a sustained soft patch in activity and moderating inflation pressures, the MPC signaled further scope to reduce the OCR toward 2.25% at its next meeting on 26 November 2025, consistent with current market and Westpac forecasts.
- The next meeting is on 26 November 2025.
Next 24 Hours Bias
Weak Bullish
The Japanese Yen (JPY)
Key news events today
BOJ policy rate (Tentative)
Monetary policy statement (Tentative)
BOJ outlook report (Tentative)
BOJ press conference (Tentative)
Tokyo core CPI y/y (11:30 pm GMT)
What can we expect from JPY today?
The Japanese yen strengthened ahead of the BOJ’s policy decision, driven by several key factors: US Treasury Secretary Bessent’s public pressure on Japan to allow BOJ policy independence; political clarity as Prime Minister Takaichi adopted a more neutral stance on monetary policy despite her stimulus-oriented fiscal plans; and inflation data remaining persistently above the BOJ’s 2% target at 2.9%. While the BOJ is expected to hold rates at 0.5% on October 30, growing hawkish sentiment within the policy board—evidenced by two dissenting votes in September—signals that a rate hike could come as soon as December 2025.
Central Bank Notes:
- The Policy Board of the Bank of Japan met on 30–31 October and by a clear majority vote, decided to maintain its key monetary policy approach for the upcoming period.
- The BOJ will continue to encourage the uncollateralized overnight call rate to remain at around 0.5%, in line with the prior stance.
- The gradual quarterly reduction in monthly outright purchases of Japanese Government Bonds (JGBs) remains intact, with amounts unchanged from the previous schedule. Purchases are set to decrease by about ¥400 billion per quarter through March 2026, shifting to about ¥200 billion per quarter from April to June 2026, and targeting a ¥2 trillion purchase level for Q1 2027. The bank reaffirmed its intention to maintain flexibility, with readiness to respond if market conditions warrant an adjustment.
- Japan’s economy continues to show moderate recovery, primarily led by solid capital expenditures, although export growth and corporate activity remain restrained by external demand uncertainty and the ongoing effects of U.S. trade policies.
- Annual headline inflation (excluding fresh food) accelerated to 2.9% year-on-year in September, marking the first uptick in four months and staying above the BOJ’s 2% target. Broad-based inflation persists, with food and energy cost pressures, but wage growth continues to support household consumption. Input cost pressures from the earlier surge in imports eased slightly.
- Short-term inflation momentum could moderate as food-price hikes ease, though rent, healthcare, and service-sector price increases tied to labor shortages provide support. Firms and households maintain a gradual upward drift in inflation expectations.
- For the near term, BOJ projects growth below trend as external demand stays subdued and corporate investment plans remain cautious. Still, accommodative financial conditions and steady gains in real labor income will underpin domestic consumption.
- Over the medium term, as overseas economies recover and trade conditions normalize, Japan’s growth potential should improve. Persistent labor market tightness, higher wage settlements, and rising medium- to long-term inflation expectations are expected to keep core inflation on a gradual upward trajectory, converging toward the 2% price stability target later in the forecast horizon.
- The next meeting is scheduled for 18 to 19 December 2025.
Next 24 Hours Bias
weak Bearish
Oil
Key news events today
No major news event
What can we expect from Oil today?
Oil prices climbed modestly as a much-larger-than-expected drop in U.S. crude inventories temporarily relieved oversupply concerns that had dominated recent weeks. The market remains cautious, with supply expected to exceed demand for the coming months, and geopolitical risks—particularly sanctions on Russia—adding uncertainty to global oil flows.
Next 24 Hours Bias
Medium Bearish
The post IC Markets – Asia Fundamental Forecast | 30 October 2025 first appeared on IC Markets | Official Blog.
Thursday 30th October 2025: Asian Markets Rise on Trade Optimism Despite Fed Rate Cut Uncertainty
422897 October 30, 2025 15:39 ICMarkets Market News
Global Markets:
- Asian Stock Markets : Nikkei up 0.56%, Shanghai Composite up 0.06%, Hang Seng up 0.54% ASX down -0.31%
- Commodities : Gold at $3,948.25 (-1.31%), Silver at $47.385 (-1.10%), Brent Oil at $64.19 (-0.20%), WTI Oil at $60.31 (-0.28%)
- Rates : US 10-year yield at 4.074, UK 10-year yield at 4.3930, Germany 10-year yield at 2.6186
News & Data:
- (CAD) Overnight Rate 2.25% to 2.25% expected
- (USD) Federal Funds Rate 4.00% to 4.00% expected
Markets Update:
Asian markets traded mostly higher on Thursday, buoyed by optimism over a possible U.S.-China trade deal as Presidents Donald Trump and Xi Jinping met, and as traders reacted to the U.S. Federal Reserve’s quarter-point rate cut. However, Fed Chair Jerome Powell’s remarks cast doubt on another rate cut in December, saying it was “far from a foregone conclusion.” Powell noted divisions among Fed members and cited uncertainty due to the government shutdown delaying key data. Following his comments, CME FedWatch showed the probability of unchanged rates in December rising to 34.1 percent from 9.1 percent.
In Australia, the S&P/ASX 200 slipped 0.15 percent to 8,913.10, weighed by tech losses despite gains in miners and banks. Fortescue and Mineral Resources rose sharply, while tech firms like Block and Appen declined.
Japan’s Nikkei 225 edged up 0.17 percent to 51,396.85 in choppy trade, supported by tech and banking stocks. Lasertec soared over 20 percent, while SoftBank and Fast Retailing dropped more than 2 percent.
Elsewhere, South Korea gained 1.2 percent, while China, Hong Kong, and Singapore posted smaller advances.
On Wall Street, the Nasdaq hit a record high, rising 0.6 percent, while the Dow and S&P 500 ended mixed. European markets also closed mixed, and oil prices rose after U.S. crude inventories fell sharply.
Upcoming Events:
- 01:15 PM GMT – EUR Main Refinancing Rate
The post Thursday 30th October 2025: Asian Markets Rise on Trade Optimism Despite Fed Rate Cut Uncertainty first appeared on IC Markets | Official Blog.
IC Markets – Europe Fundamental Forecast | 30 October 2025
422896 October 30, 2025 15:39 ICMarkets Market News
IC Markets – Europe Fundamental Forecast | 30 October 2025
What happened in the Asia session?
Today’s Asia session saw cautious but active market conditions driven by central bank announcements, key inflation data from Japan, and anticipation of major geopolitical meetings (U.S.-China, U.S.-Korea). The U.S. dollar gained on hawkish Fed language, the Japanese Yen traded near a multi-month low with high event risk, and Asian equities were mixed, but the Kospi surged on trade optimism. Oil and commodity prices held firm, with all eyes on upcoming diplomatic developments and policy signals for direction into the European session.
What does it mean for the Europe & US sessions?
Today’s markets are starting with a cautiously bullish tone, shaped by recent central bank meetings, major economic data releases, and shifting sentiment in both stocks and currencies. Traders in the European and U.S. sessions should focus on central bank policy statements, critical macro indicators, and high-impact earnings reports as these are driving cross-asset volatility.
The Dollar Index (DXY)
Key news events today
No major news event
What can we expect from DXY today?
The US dollar strengthened modestly on Thursday, October 30, 2025, following Fed Chair Powell’s cautionary remarks that a December rate cut is “far from” certain despite Wednesday’s 25 basis point reduction to 3.75%-4.00%. The DXY traded around 99.09, with EUR/USD at 1.1604 and USD/JPY near 152.63. The BoJ is expected to hold rates at 0.5%, and the ECB is anticipated to keep rates unchanged at 2.15%. Powell’s divided committee (10-2 vote) and emphasis on competing inflation and employment risks signal a more cautious Fed approach ahead, supporting dollar strength in the near term.
Central Bank Notes:
- The Federal Open Market Committee (FOMC) voted, by majority, to lower the federal funds rate target range by 25 basis points to 3.75%–4.00% at its October 28–29, 2025, meeting, marking the second consecutive cut following the 25 basis points reduction in September.
- The Committee maintained its long-term objectives of maximum employment and 2% inflation, noting that the labor market continues to soften, with modest job creation and an unemployment rate edging higher. In comparison, inflation remains above target at around 3.0%.
- Policymakers highlighted ongoing downside risks to economic growth, tempered by signs of resilient economic activity. September’s consumer price index (CPI) came in slightly lower than expected at 3.0% year-over-year, easing inflation pressure but still warranting vigilance given tariff-driven price effects.
- Economic activity expanded modestly in the third quarter, with GDP growth estimates around 1.0% annualized; however, uncertainty remains elevated amid persistent global trade tensions and the U.S. government shutdown, which is impacting data availability.
- The updated Summary of Economic Projections reflects an anticipated unemployment rate averaging approximately 4.5% for 2025, with headline and core personal consumption expenditures (PCE) inflation projections holding near 3.0%, indicating a slow easing path ahead.
- The Committee emphasized its flexible, data-dependent approach and underscored that future policy adjustments will be guided by incoming labor market and inflation data. As in prior meetings, there was dissent, including one member advocating a more aggressive 50-basis-point cut.
- The FOMC announced the planned conclusion of its balance sheet reduction (quantitative tightening) program, intending to cease runoff in the near term to maintain market stability, with Treasury redemption caps held steady at $5 billion per month and agency mortgage-backed securities caps at $35 billion.
- The next meeting is scheduled for 9 to 10 December 2025.
Next 24 Hours Bias
Weak Bearish
Gold (XAU)
Key news events today
No major news event
What can we expect from Gold today?
Gold prices are staging a modest recovery above $4,000 per ounce following the Federal Reserve’s expected 25 basis point rate cut. However, upside momentum remains limited as progress toward a US-China trade agreement has reduced safe-haven demand. The precious metal recently pulled back from its October 20 record high of $4,381, experiencing its first weekly loss in ten weeks amid profit-taking and easing geopolitical tensions.
Next 24 Hours Bias
Medium Bullish
The Euro (EUR)
Key news events today
German prelim CPI m/m (8:00 am GMT)
Spanish flash CPI y/y (8:00 am GMT)
German prelim GDP q/q (9:00 am GMT)
Main refinancing rate (1:15 pm GMT)
Monetary policy statement (1:15 pm GMT)
ECB press conference (1:45 pm GMT)
What can we expect from EUR today?
ECB’s widely anticipated decision to hold rates steady for a third consecutive meeting. The euro strengthened modestly against the dollar, trading at 1.1616, as markets digested the ECB’s commitment to its current “good place” policy stance. While inflation remains near the 2% target and has shown signs of stabilization, the eurozone faces significant challenges from France’s deepening fiscal and political crisis, Germany’s modest growth prospects despite fiscal stimulus, and ongoing trade tensions with the United States and China..
Central Bank Notes:
- The Governing Council of the ECB kept the three key interest rates unchanged at its meeting on 30 October 2025. The main refinancing rate remains at 2.15%, the marginal lending facility at 2.40%, and the deposit facility at 2.00%. This decision reflects policymakers’ assessment that the current monetary stance remains consistent with medium-term price stability, while incoming data confirm a gradual return of inflation towards the target.
- Recent indicators point to stable price dynamics. Headline inflation remains near the 2% mark, with energy prices contained and food inflation easing slightly after earlier supply bottlenecks. Wage growth continues to moderate, contributing to the slowdown in domestic cost pressures. The ECB reiterated its commitment to a data-driven, meeting-by-meeting approach and emphasized flexibility in the face of uncertain global financial conditions.
- Eurosystem staff projections have not been materially altered since September. Headline inflation averages remain at 2.0% for 2025, 1.8% for 2026, and 2.0% for 2027. Recent softening in producer prices and subdued pipeline pressures suggest limited upside risks to inflation, though geopolitical tensions and potential commodity shocks continue to pose uncertainties to the outlook.
- Euro area GDP growth remains on track with earlier forecasts, projected at 1.1% for 2025, 1.1% for 2026, and 1.4% for 2027. Forward-looking indicators, including PMIs and industrial sentiment surveys, signal some stabilization in activity following weakness in the third quarter. Public investment and recovering export activity are expected to offset softer private sector demand in the near term.
- The labor market remains resilient, with unemployment rates at multi-decade lows and participation rates strong. Real income growth continues to support household spending, even as consumption growth normalizes from earlier highs. Financing conditions remain favorable, aided by stable banking sector liquidity and improved credit demand among small and medium-sized firms.
- Business sentiment remains mixed, reflecting lingering uncertainty over global trade policy and the path of US tariffs. However, easing supply chain costs and improved export competitiveness due to softer exchange rates are providing some relief to manufacturing and external-oriented sectors.
- The Governing Council reaffirmed that future decisions will depend on an integrated assessment of incoming data—covering inflation trends, financial conditions, and the state of policy transmission. The Council emphasized that no pre-set path for rates exists; keeping all options open should the economic outlook shift markedly.
- Balance sheet reduction continues smoothly, with holdings under the APP and PEPP declining as reinvestments have ceased. The ECB confirmed that the pace of portfolio runoff remains in line with its previously communicated normalization plan, supporting a gradual withdrawal of monetary accommodation in a predictable manner.
- The next meeting is on 17 to 18 December 2025
Next 24 Hours Bias
Weak Bearish
The Swiss Franc (CHF)
Key news events today
No major news event
What can we expect from CHF today?
The Swiss franc faces near-term weakening pressure on October 30 as improved global risk sentiment from US-China trade optimism weighs on safe-haven demand. The SNB’s commitment to keeping rates at 0% with no deflation risks, combined with rebounding investor sentiment from deeply negative levels, provides some stability. However, Switzerland’s slowing economic growth outlook (1-1.5% in 2025, under 1% in 2026) amid US tariff headwinds and the franc’s significant year-to-date strength suggest limited upside. Key catalysts today include the ECB rate decision (expected hold at 2%) and the outcome of Trump-Xi trade talks at APEC.
Central Bank Notes:
- The SNB maintained its key policy rate at 0% during its meeting on 25 September 2025, pausing a sequence of six consecutive rate cuts as inflation stabilized and the Swiss franc remained firm.
- Recent data showed a modest rebound in inflation, with Swiss consumer prices rising 0.2% year-on-year in August after staying above zero for three consecutive months; this helped alleviate fears of deflation that were mounting earlier in the year.
- The conditional inflation forecast remains broadly unchanged from June: headline inflation is expected to average 0.2% in 2025, 0.5% in 2026, and 0.7% in 2027. The risk of a negative rate move has diminished for now, but the SNB retains flexibility should inflationary pressures weaken again.
- The global economic outlook has deteriorated further, weighed down by heightened trade tensions—especially with the U.S.—and ongoing uncertainty in key Swiss export markets.
- Swiss GDP growth moderated in Q2 after a strong Q1 boosted by front-loaded U.S. exports. The SNB expects growth to slow and remain subdued, with forecasted GDP expansion between 1% and 1.5% in both 2025 and 2026.
- Labor market sentiment in the Swiss industrial sector has softened on concerns over export competitiveness and potential adjustments to production, but the overall growth outlook stays broadly unchanged
- The SNB reiterated its readiness to respond as needed if deflation risks re-emerge, emphasizing its commitment to medium-term price stability and a robust, transparent communication policy, with the introduction of more detailed monetary policy minutes beginning in October.
- The next meeting is on 11 December 2025.
Next 24 Hours Bias
Weak Bullish
The Pound (GBP)
Key news events today
No major event
What can we expect from GBP today?
The British pound faces a challenging environment characterized by heightened budget uncertainty, expectations for accelerated BoE rate cuts, falling gilt yields, and a resilient US dollar. The combination of a potential £20+ billion fiscal shortfall, productivity downgrades, and anticipated tax increases has created a perfect storm for sterling weakness. While easing shop price inflation and resilient retail sales provide some positive economic signals, they have been insufficient to offset fiscal and monetary policy concerns. The pound is likely to remain under pressure until the November 26 budget provides clarity on the government’s fiscal strategy and the BoE’s November 6 meeting reveals the central bank’s policy trajectory.
Central Bank Notes:
- The Bank of England’s Monetary Policy Committee (MPC) voted on 18 September 2025 by a majority (expected split likely 7–2 or 6–3) to hold the Bank Rate steady at 4.00%, following the rate cut in August. Most members cited persistent inflation and mixed indicators on growth and employment, while a minority favored further easing due to the cooling labor market and subdued GDP growth.
- The Committee decided to decrease the pace of quantitative tightening, planning to reduce the stock of UK government bond purchases by £67.5 billion over the next 12 months, instead of the prior £100 billion pace, with the gilt balance now standing at nearly £558 billion. This reflects increased volatility in bond markets and a shift to a more gradual approach.
- Headline inflation rose unexpectedly to 3.8% in July and is projected at 4% for September, above the Bank’s 2% target. Price pressures are driven by regulated energy costs and ongoing food price increases. While previous disinflation has been substantial, core inflation remains elevated and sticky.
- The MPC expects headline inflation to remain above target through Q4, with a resumption of the downward trend projected for early 2026 as energy and regulated price pressures abate. The Committee remains watchful for signs of persistent inflation despite previous policy tightening.
- UK GDP growth is stagnant, with business and consumer activity subdued. Recent labor market data show rising unemployment rates (now at 4.7%) and stabilizing wage growth (holding near 5%), indicating slack but continued wage price pressure. The Committee remains cautious amid lackluster demand and soft survey sentiment.
- Pay growth and employment indicators have moderated further, alongside confirmation from business surveys that pay settlements are slowing. The Committee expects wage growth to decelerate significantly through Q4 and the rest of 2025.
- Global uncertainty persists due to volatile energy prices, supply chain disruptions linked to Middle East conflicts, and renewed trade tensions. The MPC remains vigilant in tracking transmission of external cost/wage shocks to UK inflation.
- Risks to inflation are considered two-sided. While subdued domestic growth and softening labor activity suggest scope for easing, persistent inflation requires caution. The MPC anticipates a slow, gradual reduction path in rates, continuing its data-dependent approach with careful adjustment as warranted by economic developments.
- The Committee’s bias remains toward maintaining a restrictive monetary policy stance until firmer evidence emerges that inflation will return sustainably to the 2% target. All future decisions will remain highly data dependent, with a strong emphasis on evolving demand, inflation expectations, costs, and labor market conditions.
- The next meeting is on 6 November 2025.
Next 24 Hours Bias
Medium Bearish
The Canadian Dollar (CAD)
Key news events today
No major news event
What can we expect from CAD today?
The Canadian dollar strengthened following the Bank of Canada’s surprise hawkish guidance that the current 2.25% policy rate is likely appropriate, effectively signaling an end to the easing cycle. The loonie traded near 1.3889 per USD, its strongest level in four weeks. However, significant headwinds remain: inflation at 2.4% exceeds the central bank’s target, GDP growth is tracking around 0.8% in Q3, unemployment sits at a multi-year high of 7.1%, and US trade uncertainty continues to cloud the outlook. Oil prices near $60 per barrel provide only modest support. While the September employment surprise (60,400 jobs) offered encouragement, underlying labor market weakness persists with elevated youth unemployment and underemployment.
Central Bank Notes:
- The Council noted that U.S. tariff tensions have eased slightly following early progress in bilateral discussions, though the external trade environment remains fragile. Businesses continue to hold back on long-term investment, with the Bank highlighting that sustained clarity on U.S. trade policy is needed to restore confidence.
- The Bank acknowledged that uncertainty persists despite the softer U.S. tone, as incoming data show limited improvement in export orders. The manufacturing sector has stabilized but remains below pre-2024 output levels, reflecting weak global demand and cautious corporate spending.
- Canada’s economy showed tentative signs of recovery in early Q4, with GDP estimated to expand by 0.3% in October after two quarters of contraction. Mining and energy activity strengthened modestly, aided by steady crude demand, while goods exports posted a fractional gain.
- Service sector growth remained uneven, supported mainly by tourism-related and technology services. However, retail spending and household consumption were subdued, constrained by slower job creation and lingering consumer caution. The Bank judged overall momentum as fragile but improving marginally.
- Housing activity showed modest reacceleration in major urban markets as mortgage rates stabilized near record lows. Nonetheless, affordability pressures and stricter lending standards continue to cap overall resale volumes, leading to only a gradual recovery in the housing sector.
- Headline CPI inflation rose to 2.1% in October, reaching the Bank’s target for the first time in six months. The increase was driven by higher energy prices and a modest uptick in food and shelter costs. Core inflation measures remained stable, suggesting underlying price pressures are contained.
- The Governing Council reiterated its data-dependent stance, indicating that the current policy rate remains appropriate amid tentative growth and balanced inflation risks. Officials noted that while additional stimulus is not ruled out, the emphasis has shifted toward monitoring the sustainability of the recovery rather than immediate rate adjustments.
- The next meeting is on 17 to 18 December 2025.
Next 24 Hours Bias
Weak Bearish
Oil
Key news events today
No major new event
What can we expect from Oil today?
Oil markets are characterized by cautious optimism as WTI trades near $60 and Brent near $65 per barrel. The week’s major developments include an unexpectedly large 6.86-million-barrel draw in US crude inventories that challenged oversupply concerns, new US sanctions on Russian oil giants Rosneft and Lukoil creating supply uncertainty, India’s adjustment of Russian crude purchases in response to sanctions, ongoing US-China trade negotiations that could ease economic tensions, and the Federal Reserve’s 25-basis-point rate cut providing modest support.
Next 24 Hours Bias
Medium Bearish
The post IC Markets – Europe Fundamental Forecast | 30 October 2025 first appeared on IC Markets | Official Blog.
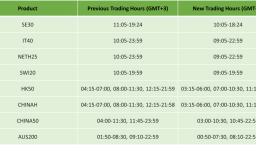
US Daylight Saving: Trading Schedule 2025
422875 October 30, 2025 08:14 ICMarkets Market News
Dear Client,
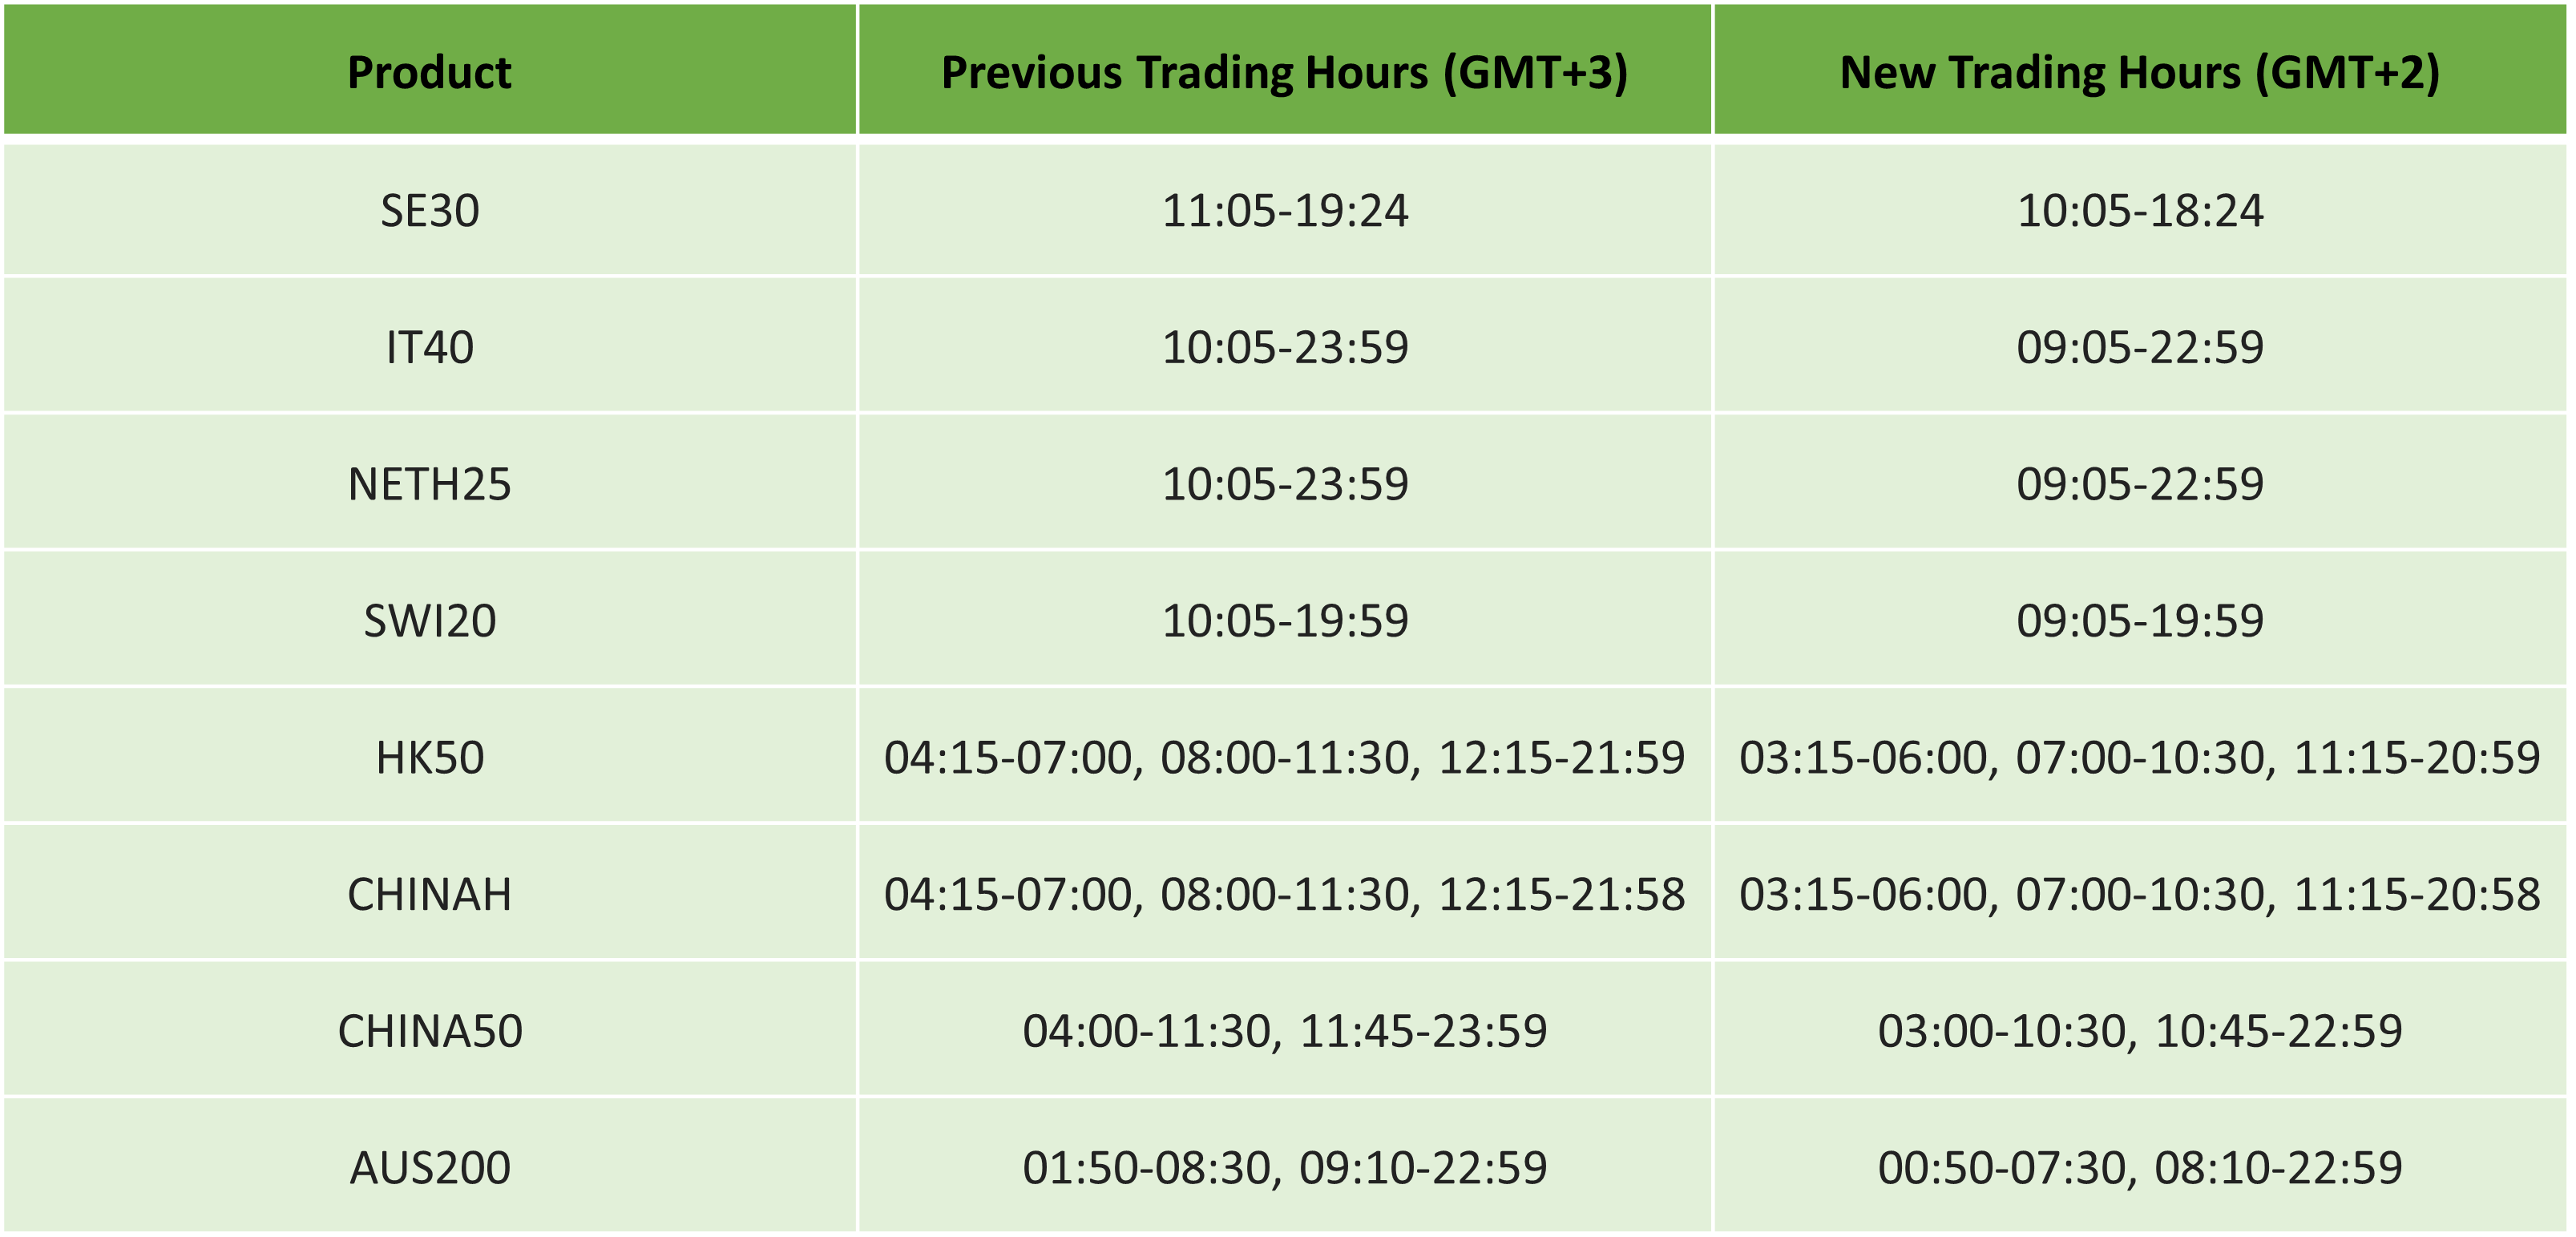
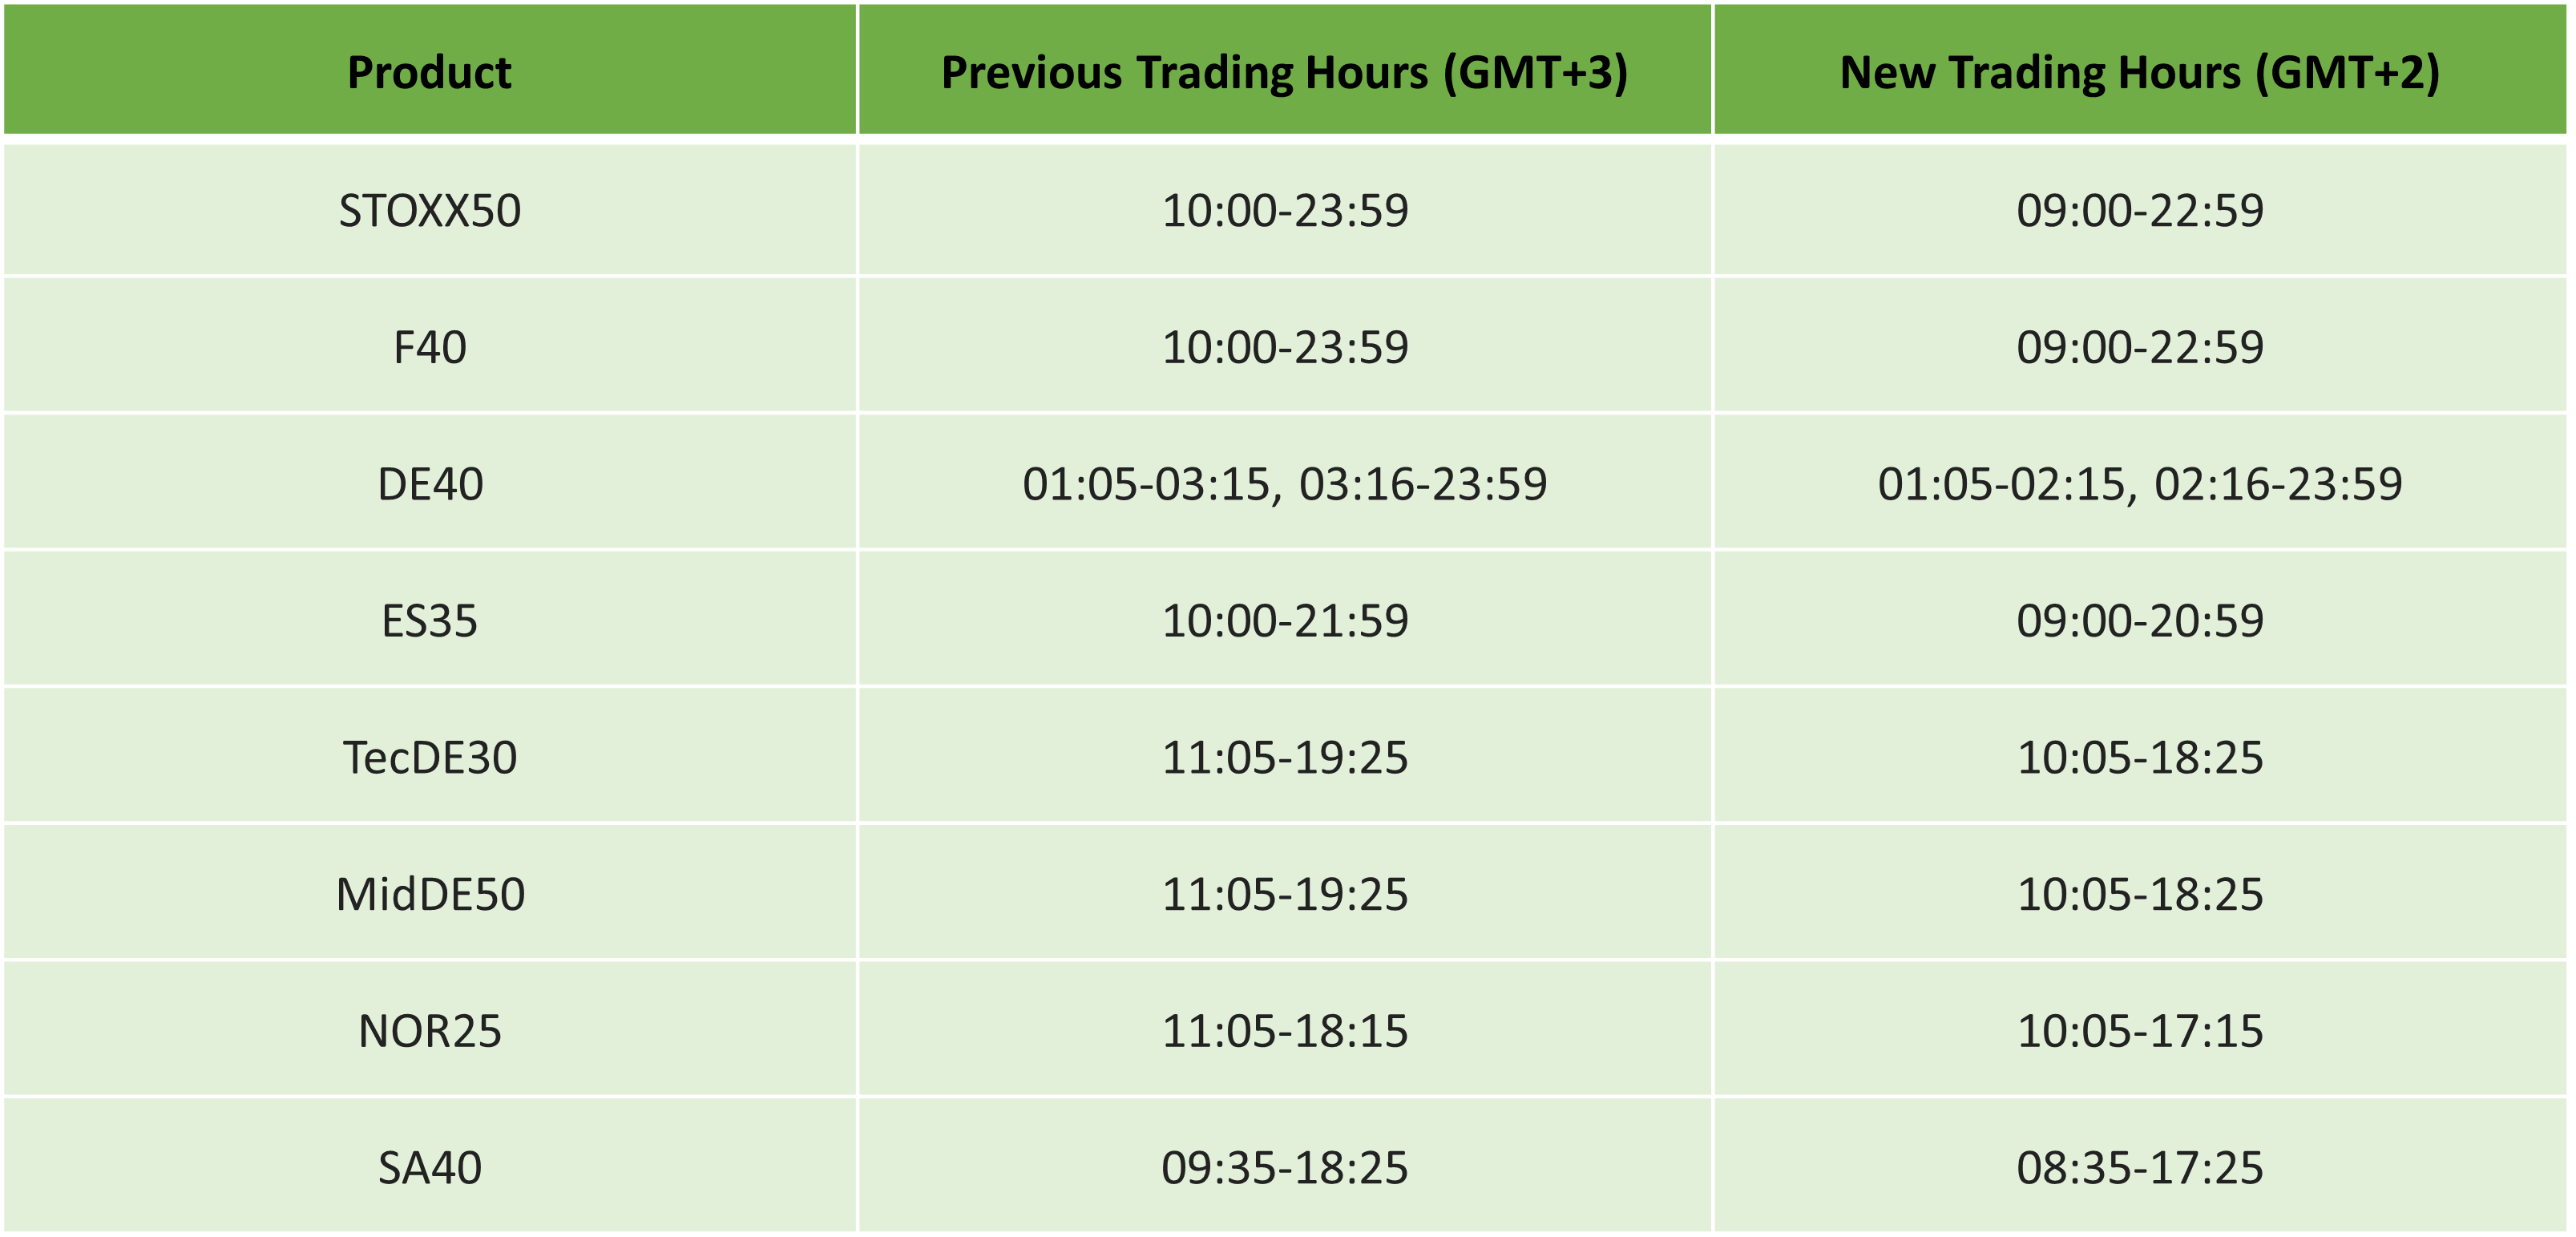
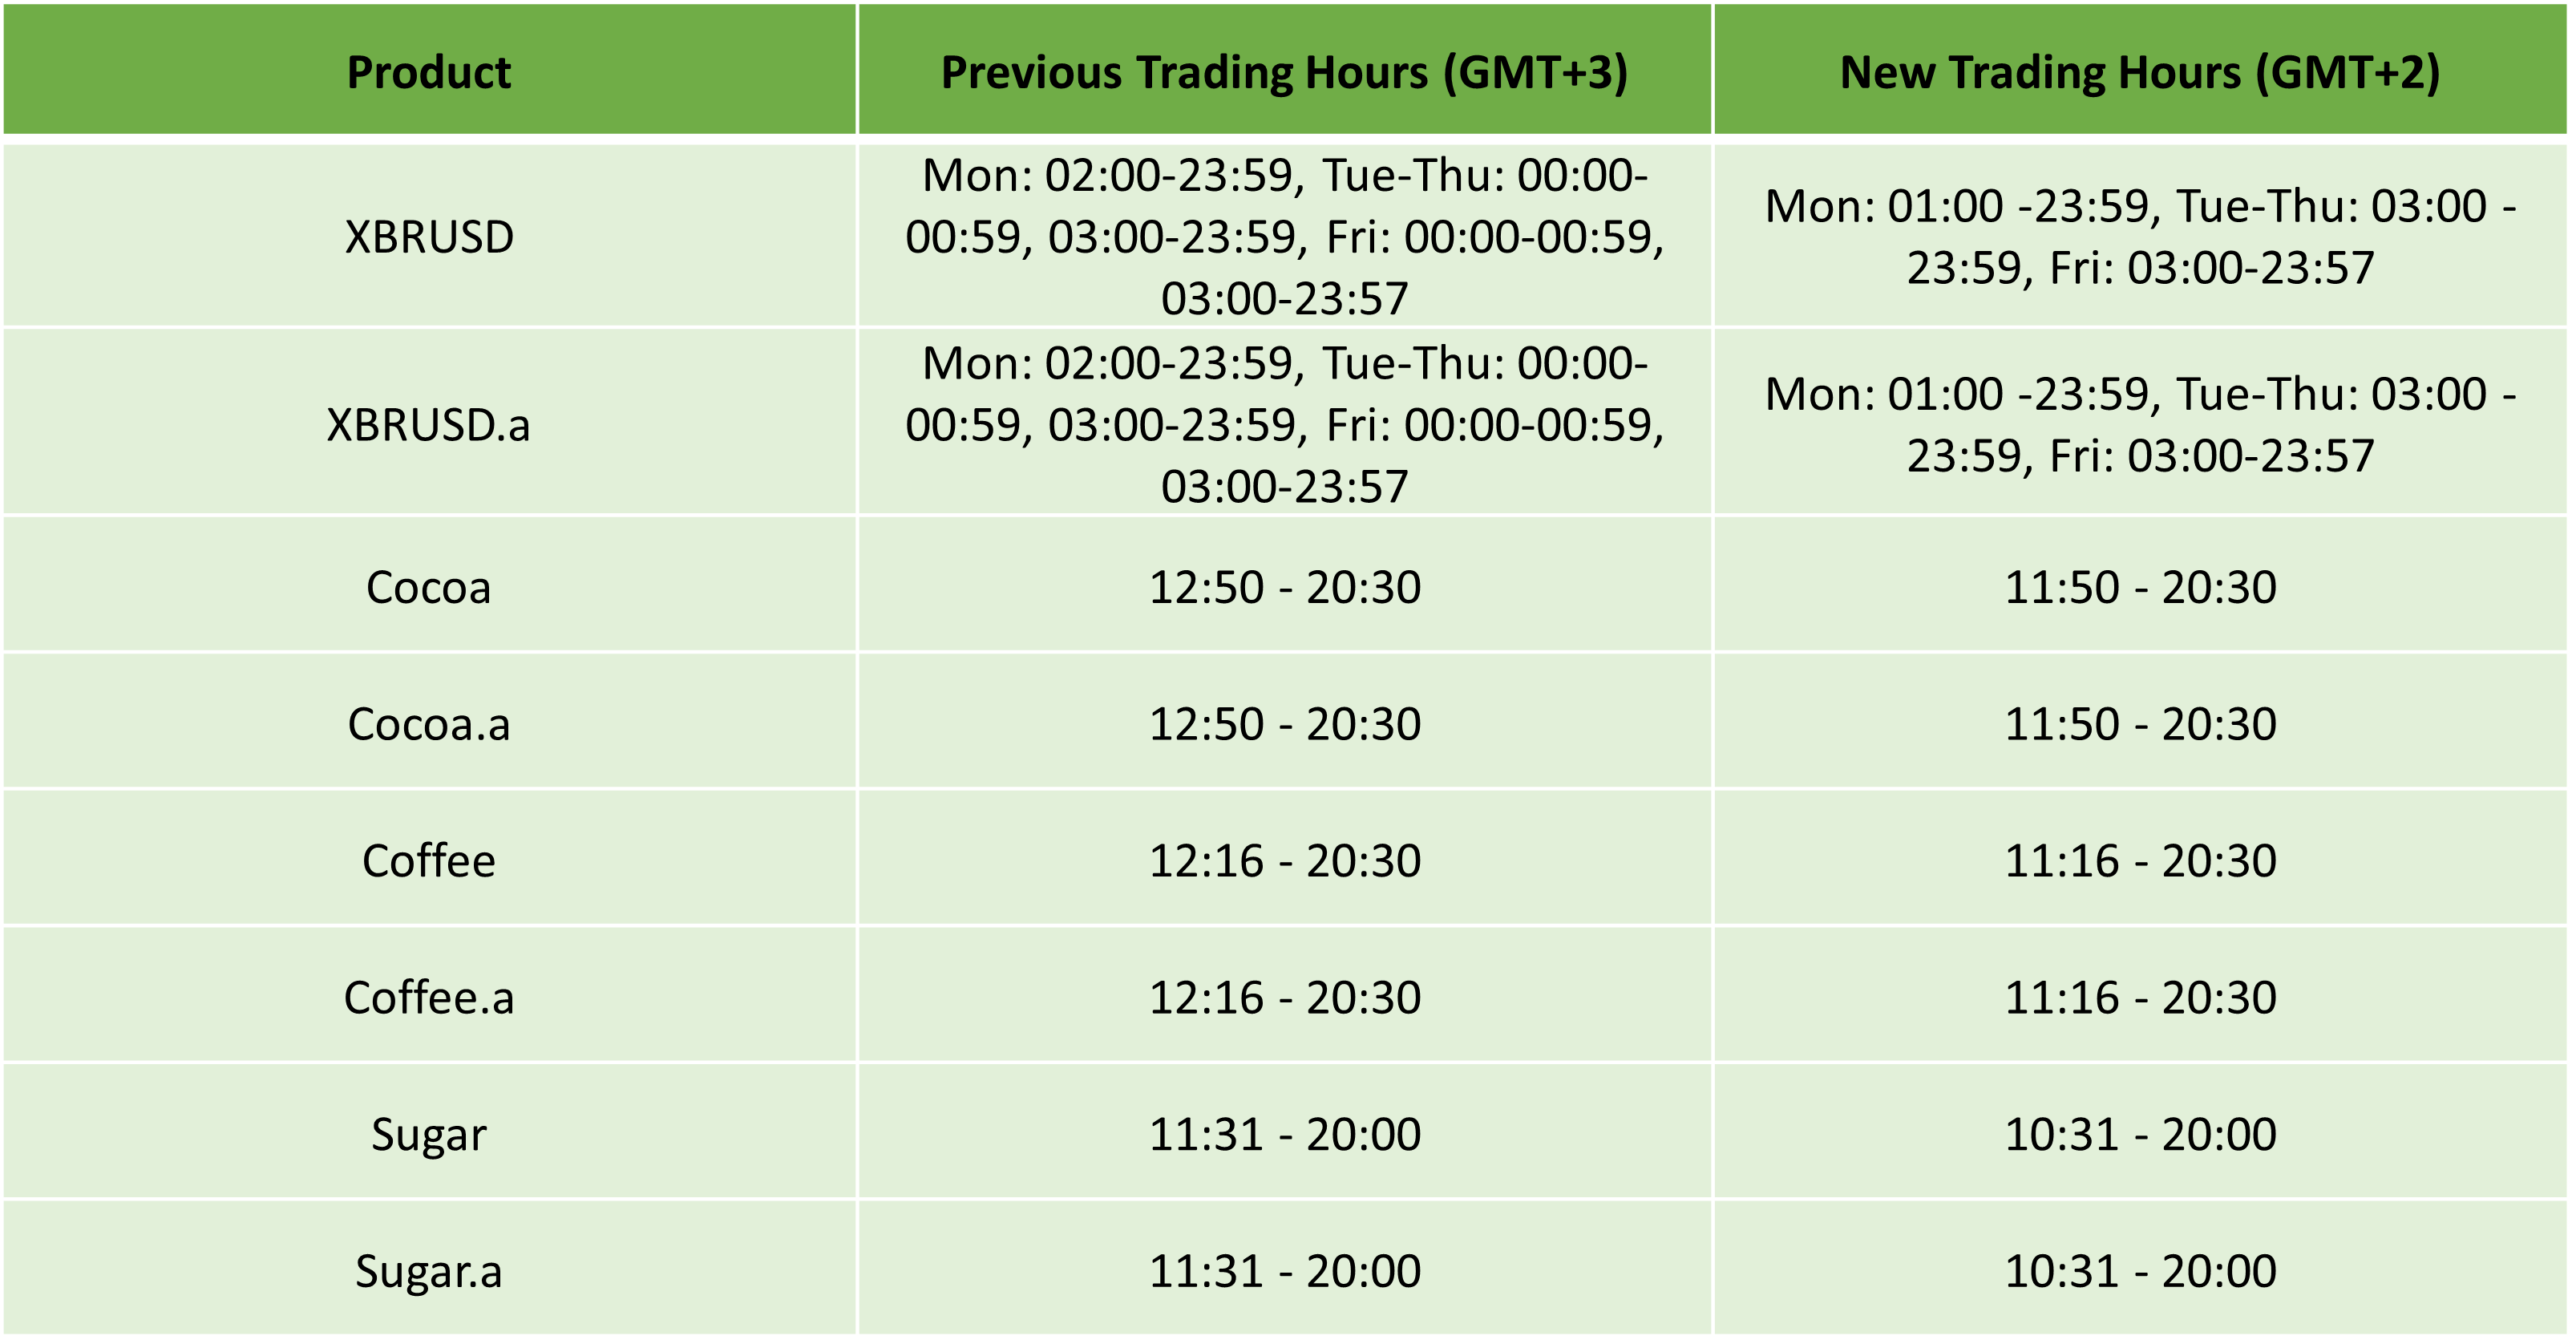
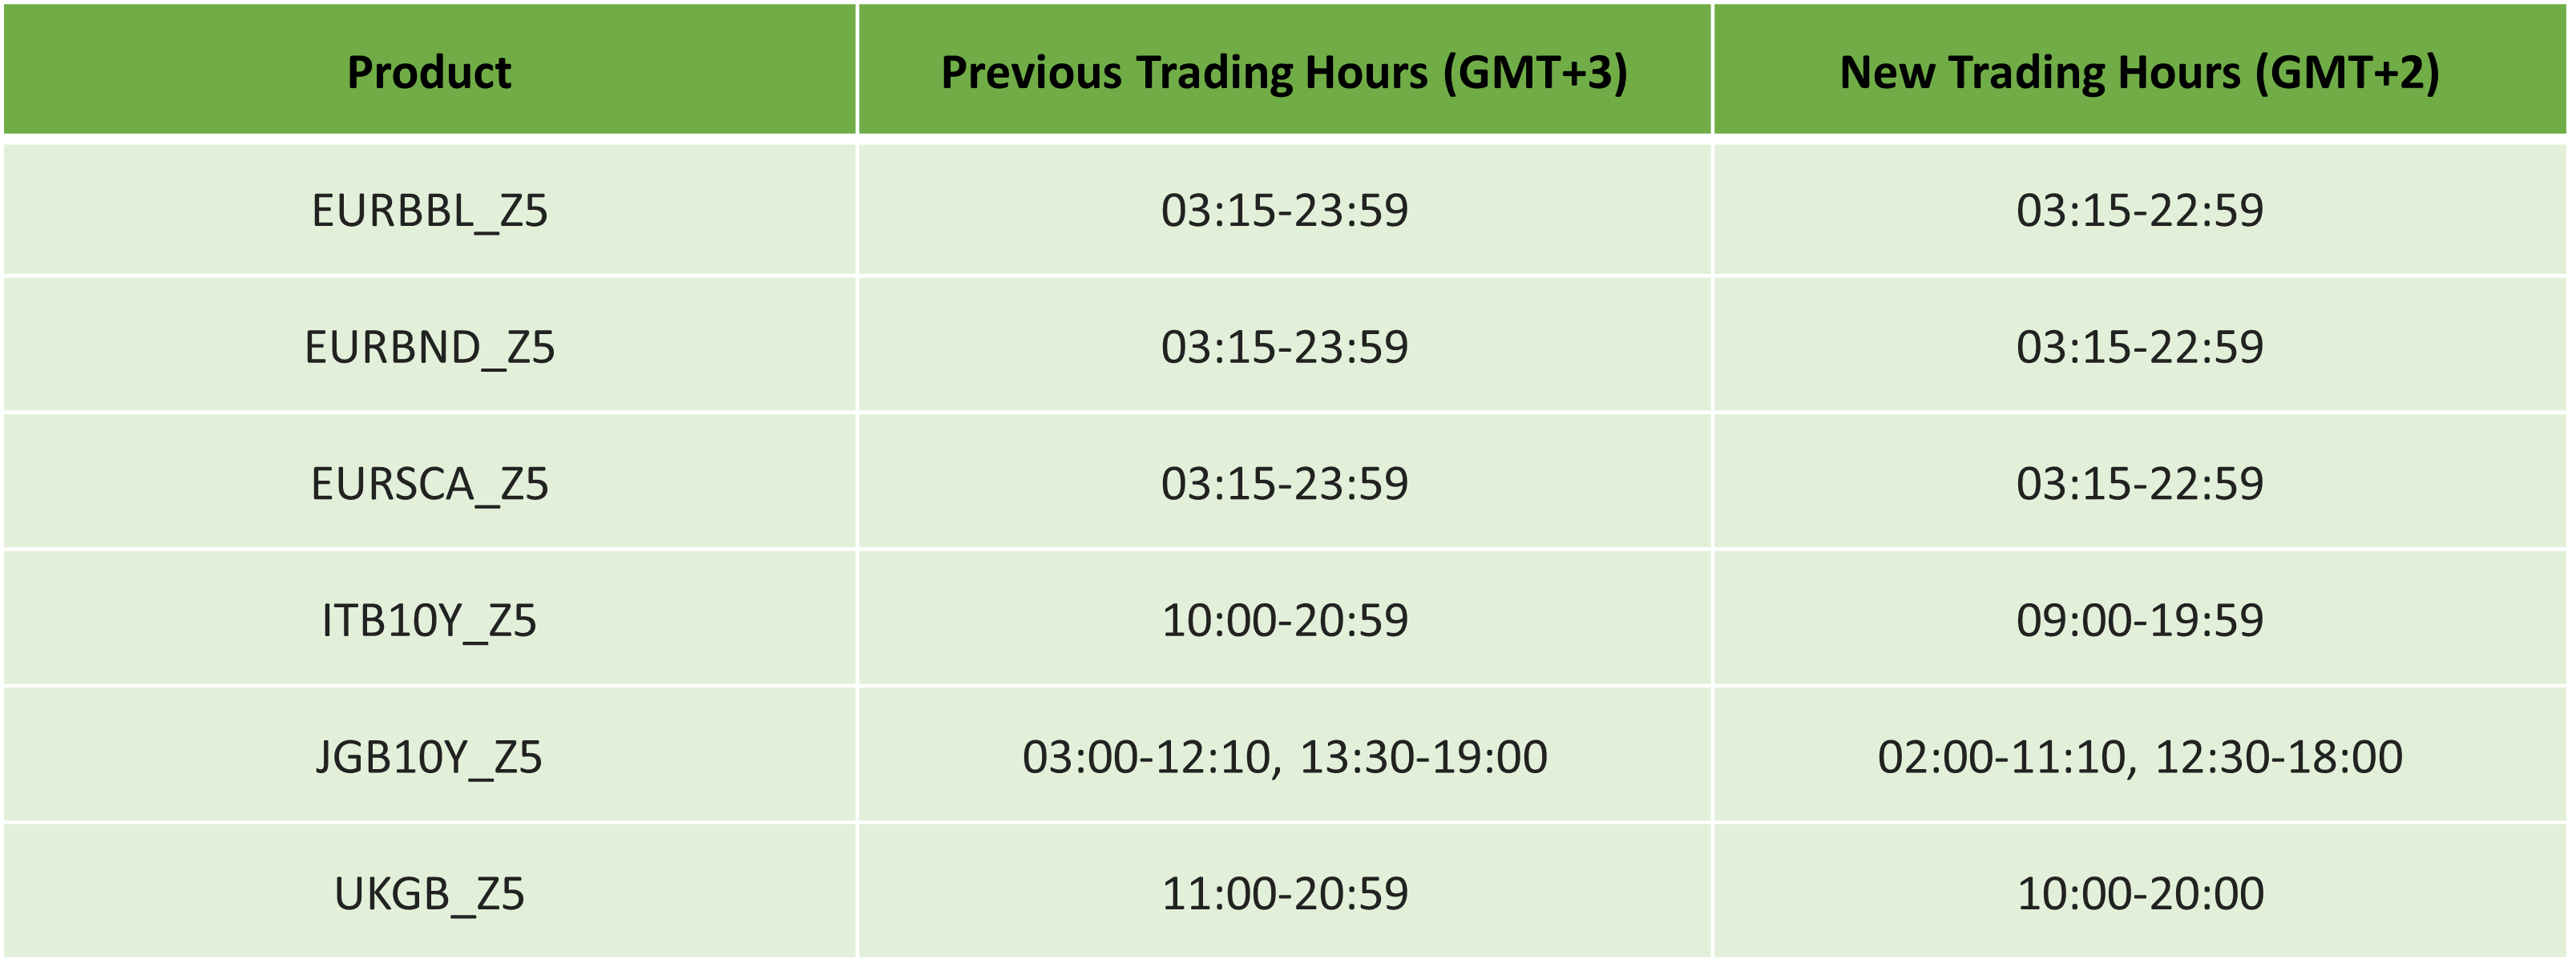
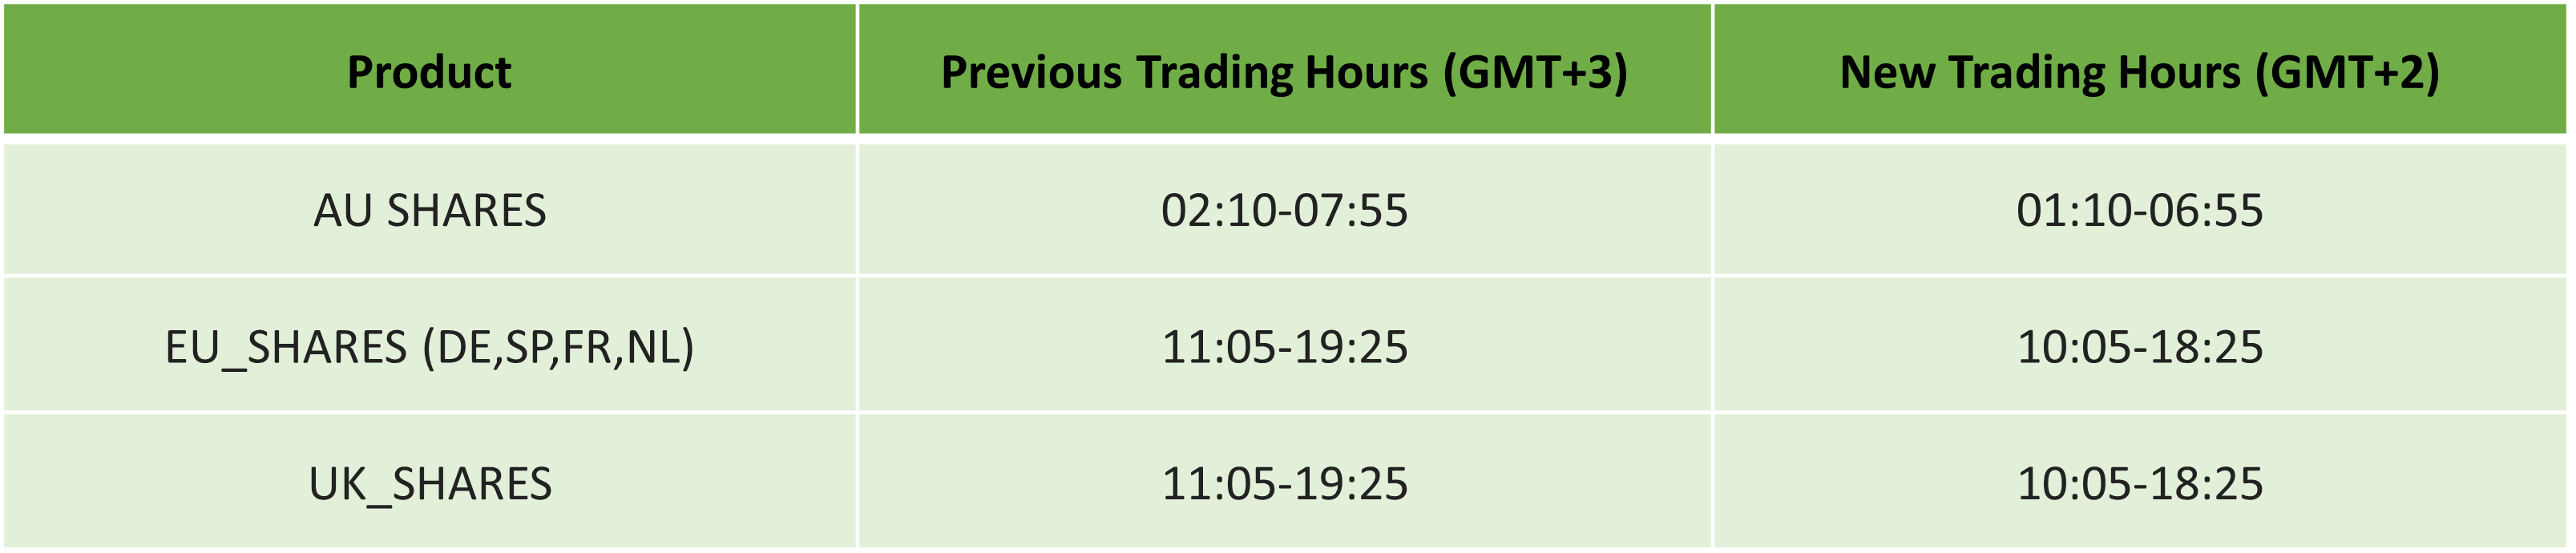
As part of our commitment to providing the best trading experience to our clients, we want to inform you there will be an adjustment in the trading schedule due to the US exiting Daylight Saving on Sunday, 02 November 2025.
While trading, most products will remain unaffected; however, there will be a change in the trading hours of some products.
MT4/5:
Indices:
Soft Commodities Futures:
Bonds:
Shares:
For any further assistance, please contact our Support Team.
Kind regards,
IC Markets Team
The post US Daylight Saving: Trading Schedule 2025 first appeared on IC Markets | Official Blog.
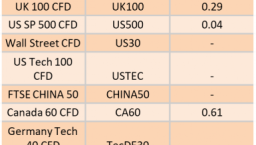
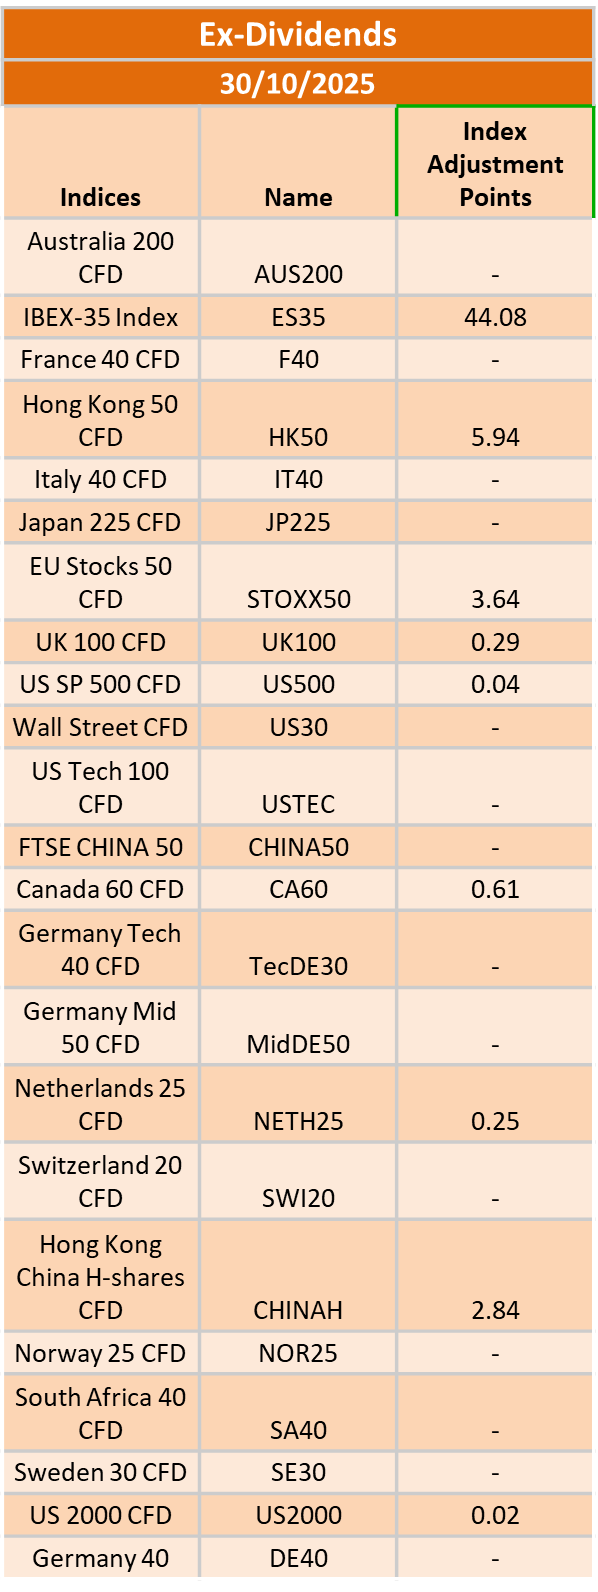
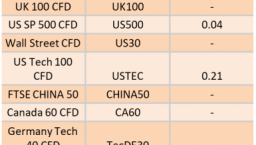
Ex-Dividend 30/10/2025
422854 October 29, 2025 18:39 ICMarkets Market News
The post Ex-Dividend 30/10/2025 first appeared on IC Markets | Official Blog.
General Market Analysis – 29/10/25
422853 October 29, 2025 18:14 ICMarkets Market News
US Stocks Drive Higher Ahead of Fed – Nasdaq up 0.8%
US stock markets hit record levels in trading again yesterday ahead of a highly anticipated rate cut later today and improving trade news between China and the US. The Dow pushed up 0.34% to 47,706, the S&P 0.23% to 6,890, and the Nasdaq jumped 0.80% to 23,827. FX and bond markets were more muted, the DXY drifting 0.05% lower to 98.73, while US 2-year yields added 0.8 of a basis point to move up to 3.490%, and the benchmark 10-year dropped just 0.4 of a basis point to 3.976%. Oil prices fell again as the market priced in production increases from OPEC+, Brent down 1.89% to $60.15, and WTI off 1.75% to $64.47 a barrel. Gold continued its recent drop, losing 0.75% on the day to close out the NY session at $3,951.11 an ounce.
FOMC Meeting in Focus for Traders Today
Traders are eagerly awaiting today’s key update from the Federal Reserve Bank later today, with the market now pricing in a 99.9% chance of a 25-basis point rate cut. Clearly, it would be a huge surprise to the market if this did not occur, and we would see massive moves across financial products. However, the likelihood is that we will see moves on the back of the FOMC statement and consequent press conference. The risk does seem to sit with a less dovish committee, with the market looking for another rate cut in December and more in 2026 following last week’s CPI data. The Fed has clearly been focusing on the failing jobs market, but it does have a dual mandate that includes inflation, and despite last week’s slightly lower print, CPI levels are still above where the Fed would like to see them in a rate-easing cycle. Any indications of hesitation for future cuts, from either the inflation risk or the fact that we are unlikely to have data next month, could see some sharp corrections in easing expectations and some big moves in the market, with the dollar and yields likely to jump and equity markets take a hit.
Huge Day Ahead for Markets
The macroeconomic calendar kicks into action today as some key data and central bank rate calls look set to lift volatility. Australian markets have already seen RBA rate-cut expectations pull back sharply after the CPI data came in well above expectations (3.5% y/y vs exp. 3.1% y/y). Focus will jump across the Tasman to New Zealand later in the day, with RBNZ Governor Christian Hawkseby scheduled to speak in Auckland. There is little scheduled in the European session; however, the New York day could see some huge moves. The initial focus will be north of the border in Ottawa, where the Bank of Canada is expected to deliver another 25-basis point rate cut as they continue to battle the falling jobs market. Focus will then shift firmly to US markets, with Pending Home Sales (exp. +1.6% m/m) and Weekly Crude Oil Inventory (exp. -0.9 mio barrels) due out before a few hours’ wait for the key interest rate update from the Federal Reserve Bank.
The post General Market Analysis – 29/10/25 first appeared on IC Markets | Official Blog.
Ex-Dividend 29/10/2025
422850 October 29, 2025 18:06 ICMarkets Market News
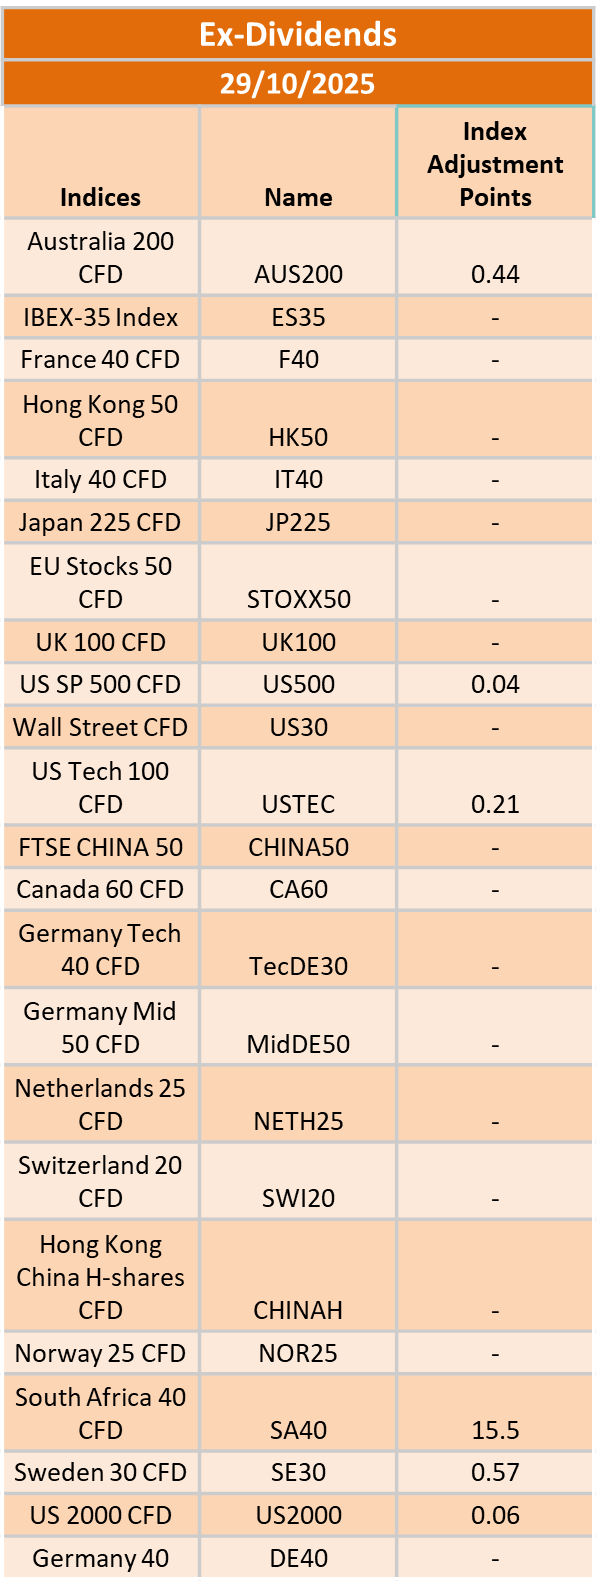
The post Ex-Dividend 29/10/2025 first appeared on IC Markets | Official Blog.
Wednesday 29th October 2025: Technical Outlook and Review
422834 October 29, 2025 18:05 ICMarkets Market News
DXY (U.S. Dollar Index):
Potential Direction: Bullish
Overall momentum of the chart: Bearish
The price is falling toward the pivot and could make a short-term pullback toward this level before rising again toward the 1st resistance.
Pivot: 98.55
Supporting reasons: Identified as a pullback support that aligns closely with the 50% Fibonacci retracement, indicating a potential area where buying interest could pick up
1st support: 98.00
Supporting reasons: Identified as an overlap support, indicating a potential area where the price could again stabilize.
1st resistance: 99.53
Supporting reasons: Identified as an overlap resistance, indicating a potential area that could halt any further upward movement
EUR/USD:
Potential Direction: Bullish
Overall momentum of the chart: Bullish
The price has already bounced off the pivot and may continue its bullish move toward the 1st resistance
Pivot: 1.1620
Supporting reasons: Identified as an overlap support, where renewed buying pressure could emerge to push the price higher.
1st support: 1.1590
Supporting reasons: Identified as an overlap support, indicating a potential level where the price could stabilize once again.
1st resistance: 1.1666
Supporting reasons: Identified as a pullback resistance that aligns closely with the 61.8% Fibonacci retracement, indicating a potential level that could cap further upward movement.
EUR/JPY:
Potential Direction: Bearish
Overall momentum of the chart: Bullish
The price has already reacted off the pivot and may continue its bearish move toward the 1st support
Pivot: 177.75
Supporting reasons: Identified as a swing high resistance, where selling pressures could intensify and potentially cap any upward retracement
1st support: 174.92
Supporting reasons: Identified as an overlap support, indicating a potential area where the price could again stabilize.
1st resistance: 179.80
Supporting reasons: Identified as a resistance that is supported by the 161.8% Fibonacci extension, indicating a potential level that could cap further upward movement.
EUR/GBP:
Potential Direction: Bullish
Overall momentum of the chart: Bullish
The price could fall toward the pivot and could make a short-term pullback toward this level before rising again toward the 1st resistance.
Pivot: 0.8749
Supporting reasons: Identified as a pullback support, where renewed buying pressure could emerge to push the price higher.
1st support: 0.8718
Supporting reasons: Identified as overlap support, indicating a potential area where the price could stabilize once more.
1st resistance: 0.8809
Supporting reasons: Identified as a resistance that is supported by the 161.8% Fibonacci extension, indicating a potential level that could cap further upward movement.
GBP/USD:
Potential Direction: Bearish
Overall momentum of the chart: Bullish
The price could see a short-term pullback toward the pivot before continuing its bearish move down toward the 1st support.
Pivot: 1.3332
Supporting reasons: Identified as a pullback resistance, where selling pressures could intensify and potentially cap any upward retracement.
1st support: 1.3248
Supporting reasons: Identified as a swing low support, indicating a potential area where the price could stabilize once more.
1st resistance: 1.3409
Supporting reasons: Identified as an overlap resistance, indicating a potential level that could halt further upward movement.
GBP/JPY:
Potential Direction: Bearish
Overall momentum of the chart: Bullish
The price could rise toward the pivot and make a short-term pullback toward this level before continuing its bearish move down toward the 1st support.
Pivot: 202.74
Supporting reasons: Identified as a pullback resistance, where selling pressures could intensify and potentially cap any upward retracement.
1st support: 200.47
Supporting reasons: Identified as a pullback support, indicating a potential level where the price could stabilize once more.
1st resistance: 204.03
Supporting reasons: Identified as a swing high resistance, indicating a potential level that could halt further upward movement.
USD/CHF:
Potential Direction: Bullish
Overall momentum of the chart: Bearish
The price is falling toward the pivot and could make a short-term pullback toward this level before rising again toward the 1st resistance.
Pivot: 0.7921
Supporting reasons: Identified as an overlap support that aligns with the 61.8% Fibonacci retracement, where renewed buying pressure could emerge to push the price higher.
1st support: 0.7874
Supporting reasons: Identified as a swing low support, indicating a potential level where the price could stabilize once again.
1st resistance: 0.7996
Supporting reasons: Identified as an overlap resistance that aligns with the 61.8% Fibonacci retracement, indicating a potential level that could cap further upward movement.
USD/JPY:
Potential Direction: Bearish
Overall momentum of the chart: Bullish
The price could see a short-term pullback toward the pivot before continuing its bearish move down toward the 1st support.
Pivot: 151.84
Supporting reasons: Identified as a pullback resistance, where selling pressures could intensify and potentially cap any upward retracement.
1st support: 149.87
Supporting reasons: Identified as an overlap support that aligns with the 50% Fibonacci retracement, indicating a strong area where buyers might return, and the price could stabilize once again.
1st resistance: 153.25
Supporting reasons: Identified as a swing high resistance. This level represents the next key area where upward movement could be capped amid increased selling pressure
USD/CAD:
Potential Direction: Bearish
Overall momentum of the chart: Bearish
The price could see a short-term pullback toward the pivot before continuing its bearish move down toward the 1st support.
Pivot: 1.3978
Supporting reasons: Identified as a pullback resistance, where selling pressures could intensify and potentially cap any upward retracement.
1st support: 1.3907
Supporting reasons: Identified as an overlap support that aligns with the 50% Fibonacci retracement, indicating a key level where the price could stabilize once more.
1st resistance: 1.4029
Supporting reasons: Identified as an overlap resistance, making it a possible target for bullish advances and a level where some sellers could return to cap gains
AUD/USD:
Potential Direction: Bullish
Overall momentum of the chart: Bullish
The price could make a short-term pullback toward the pivot before rising again toward the 1st resistance
Pivot: 0.6524
Supporting reasons: Identified as a pullback support, where renewed buying pressure could emerge to push the price higher.
1st support: 0.6484
Supporting reasons: Identified as a swing low support, this area has provided strong support historically and may attract buying interest for a potential short-term bounce
1st resistance: 0.6590
Supporting reasons: Identified as an overlap resistance, indicating a potential area that could halt any further upward movement.
NZD/USD
Potential Direction: Bearish
Overall momentum of the chart: Bullish
The price could see a short-term pullback toward the pivot before continuing its bearish move down toward the 1st support.
Pivot: 0.5803
Supporting reasons: Identified as a pullback resistance that aligns with the 78.6% Fibonacci retracement, where selling pressures could intensify and potentially cap any upward retracement.
1st support: 0.5755
Supporting reasons: Identified as an overlap support., this area has provided strong support historically and may attract buying interest for a potential short-term bounce
1st resistance: 0.5837
Supporting reasons: Identified as an overlap resistance, indicating a potential area that could halt any further upward movement.
US30 (DJIA):
Potential Direction: Bullish
Overall momentum of the chart: Bullish
The price could see a short-term pullback toward the pivot before rising again toward the 1st resistance.
Pivot: 47,059.94
Supporting reasons: Identified as a pullback support, indicating a potential area where buying interest could pick up
1st support: 46,447.27
Supporting reasons: Identified as a pullback support, suggesting a potential area where the price could stabilize once again.
1st resistance: 48,184.09
Supporting reasons: Identified as a resistance that is supported by the 161.8% Fibonacci extension and the 100% Fibonacci projection, indicating a potential area that could halt any further upward movement.
DE40 (DAX):
Potential Direction: Bullish
Overall momentum of the chart: Bullish
The price has already bounced off the pivot and may continue its bullish move toward the 1st resistance
Pivot: 24,175.32
Supporting reasons: Identified as an overlap support, where renewed buying pressure could emerge to push the price higher.
1st support: 23,935.25
Supporting reasons: Identified as a swing low support, indicating a key level where the price could stabilize once more.
1st resistance: 24,507.17
Supporting reasons: Identified as a pullback resistance, indicating a potential area that could halt any further upward movement.
US500 (S&P 500):
Potential Direction: Bullish
Overall momentum of the chart: Bullish
The price is falling toward the pivot and could make a short-term pullback toward this level before rising again toward the 1st resistance.
Pivot: 6,760.21
Supporting reasons: Identified as a pullback support, indicating a potential area where buying interest could pick up
1st support: 6,696.60
Supporting reasons: Identified as a pullback support, indicating a potential level where the price could stabilize once again.
1st resistance: 6,922.99
Supporting reasons: Identified as a resistance that is supported by the 161.8% Fibonacci extension, indicating a potential area that could halt any further upward movement.
BTC/USD (Bitcoin):
Potential Direction: Bearish
Overall momentum of the chart: Bullish
The price has already reacted off the pivot and may continue its bearish move toward the 1st support
Pivot: 116,139.03
Supporting reasons: Identified as a pullback resistance that aligns with the 100% Fibonacci projection, where selling pressures could intensify and potentially cap any upward retracement
1st support: 109,172.55
Supporting reasons: Identified as a pullback support, indicating a potential level where the price could stabilize once more.
1st resistance: 119,893.62
Supporting reasons: Identified as a pullback resistance, indicating a potential area that could halt any further upward movement.
ETH/USD (Ethereum):
Potential Direction: Bullish
Overall momentum of the chart: Bullish
The price has already bounced off the pivot and may continue its bullish move toward the 1st resistance
Pivot: 3,941.17
Supporting reasons: Identified as an overlap support that aligns with the 61.8% Fibonacci retracement, where renewed buying pressure could emerge to push the price higher.
1st support: 3,694.07
Supporting reasons: Identified as a swing low support, indicating a potential level where the price could stabilize once more.
1st resistance: 4,081,99
Supporting reasons: Identified as a pullback resistance, indicating a potential area that could halt any further upward movement.
WTI/USD (Oil):
Potential Direction: Bullish
Overall momentum of the chart: Bullish
The price has already bounced off the pivot and may continue its bullish move toward the 1st resistance
Pivot: 60.18
Supporting reasons: Identified as an overlap support that aligns with the 38.2% Fibonacci retracement, where renewed buying pressure could emerge to push the price higher.
1st support: 57.72
Supporting reasons: Identified as a pullback support that aligns with the 78.6% Fibonacci retracement, indicating a key level where the price could stabilize once more.
1st resistance: 63.15
Supporting reasons: Identified as an overlap resistance that aligns with the 61.8% Fibonacci retracement, indicating a potential area that could halt any further upward movement.
XAU/USD (GOLD):
Potential Direction: Bearish
Overall momentum of the chart: Bullish
The price could see a short-term pullback toward the pivot before continuing its bearish move down toward the 1st support.
Pivot: 4,053.83
Supporting reasons: Identified as a pullback resistance, where selling pressures could intensify and potentially cap any upward retracement.
1st support: 3,891.10
Supporting reasons: Identified as an overlap support that aligns closely with the 78.6% Fibonacci projection, indicating a key level where the price could stabilize once more.
1st resistance: 4,177.54
Supporting reasons: Identified as a pullback resistance, indicating a potential area that could halt any further upward movement.
The accuracy, completeness and timeliness of the information contained on this site cannot be guaranteed. IC Markets does not warranty, guarantee or make any representations, or assume any liability regarding financial results based on the use of the information in the site.
News, views, opinions, recommendations and other information obtained from sources outside of www.icmarkets.com, used in this site are believed to be reliable, but we cannot guarantee their accuracy or completeness. All such information is subject to change at any time without notice. IC Markets assumes no responsibility for the content of any linked site.
The fact that such links may exist does not indicate approval or endorsement of any material contained on any linked site. IC Markets is not liable for any harm caused by the transmission, through accessing the services or information on this site, of a computer virus, or other computer code or programming device that might be used to access, delete, damage, disable, disrupt or otherwise impede in any manner, the operation of the site or of any user’s software, hardware, data or property.
The post Wednesday 29th October 2025: Technical Outlook and Review first appeared on IC Markets | Official Blog.
IC Markets – Asia Fundamental Forecast | 29 October 2025
422833 October 29, 2025 18:00 ICMarkets Market News
IC Markets – Asia Fundamental Forecast | 29 October 2025
What happened in the U.S. session?
Strong corporate earnings and expectations for easier Fed policy propelled U.S. equities and technology stocks to new highs overnight. Fixed income saw yields decline in anticipation of rate cuts, while gold prices fell sharply as risk appetite increased. The macroeconomic backdrop remained clouded by reduced consumer confidence and labor-market caution, but optimism around AI and dovish central bank action dominated market sentiment. Data scarcity because of the government shutdown meant traders relied on private releases and forward guidance more heavily than usual.
What does it mean for the Asia Session?
Wednesday’s Asian session is likely to be dominated by pre-positioning and volatility around high-impact CPI and central bank releases, with particular attention to AUD, CAD, NZD, and USD pairs. Traders are urged to watch for shifts in rate expectations, central bank rhetoric, and themes of risk-on/risk-off sentiment as global markets continue to react to monetary policy divergence and evolving geopolitical headlines.
The Dollar Index (DXY)
Key news events today
Federal funds rate (6:00 pm GMT)
FOMC statement (6:00 pm GMT)
FOMC Press Conference (6:30 pm GMT)
What can we expect from DXY today?
The US Dollar is under pressure today as traders focus on the Fed’s policy direction. The anticipated rate cut reflects concerns over job growth and muted inflation, with economic uncertainty amplified by delays in official US data due to the federal shutdown. Investors are bracing for volatility following the FOMC announcement and the press conference, which will set the tone for the dollar and global markets in the coming weeks.
Central Bank Notes:
- The Federal Open Market Committee (FOMC) voted, by majority, to lower the federal funds rate target range by 25 basis points to 3.75%–4.00% at its October 28–29, 2025, meeting, marking the second consecutive cut following the 25 basis points reduction in September.
- The Committee maintained its long-term objectives of maximum employment and 2% inflation, noting that the labor market continues to soften, with modest job creation and an unemployment rate edging higher. In comparison, inflation remains above target at around 3.0%.
- Policymakers highlighted ongoing downside risks to economic growth, tempered by signs of resilient economic activity. September’s consumer price index (CPI) came in slightly lower than expected at 3.0% year-over-year, easing inflation pressure but still warranting vigilance given tariff-driven price effects.
- Economic activity expanded modestly in the third quarter, with GDP growth estimates around 1.0% annualized; however, uncertainty remains elevated amid persistent global trade tensions and the U.S. government shutdown, which is impacting data availability.
- The updated Summary of Economic Projections reflects an anticipated unemployment rate averaging approximately 4.5% for 2025, with headline and core personal consumption expenditures (PCE) inflation projections holding near 3.0%, indicating a slow easing path ahead.
- The Committee emphasized its flexible, data-dependent approach and underscored that future policy adjustments will be guided by incoming labor market and inflation data. As in prior meetings, there was dissent, including one member advocating a more aggressive 50-basis-point cut.
- The FOMC announced the planned conclusion of its balance sheet reduction (quantitative tightening) program, intending to cease runoff in the near term to maintain market stability, with Treasury redemption caps held steady at $5 billion per month and agency mortgage-backed securities caps at $35 billion.
- The next meeting is scheduled for 9 to 10 December 2025.
Next 24 Hours Bias
Weak Bearish
Gold (XAU)
Key news events today
Federal funds rate (6:00 pm GMT)
FOMC statement (6:00 pm GMT)
FOMC Press Conference (6:30 pm GMT)
What can we expect from Gold today?
Gold prices declined sharply at the start of this week and have faced heightened volatility, with spot prices testing the $3,945–$3,965 support zone after plunging below $4,000 due to improved risk sentiment, profit-taking, and optimism over a potential US–China trade deal. A recent rally saw gold reach an all-time high of $4,381.58, but prices have since corrected more than 7% within a week, currently hovering around $3,950–$4,010 as the market awaits the US Fed’s policy decision on October 29, which could trigger further moves depending on interest rate guidance.
Next 24 Hours Bias
Medium Bearish
The Australian Dollar (AUD)
Key news events today
CPI q/q (12:30 am GMT)
CPI y/y (12:30 am GMT)
Trimmed mean CPI q/q (12:30 am GMT)
What can we expect from AUD today?
The Australian Dollar staged a modest rally following stronger-than-expected inflation data, buoyed by external optimism and technical resilience, but remains in a watchful holding pattern ahead of further policy signals. The market sees the recent upside CPI surprise as supportive for the AUD in the near term, easing fears of further rate cuts by the RBA.The AUD remains sensitive to global risk appetite, especially developments in US-China trade relations and upcoming central bank meetings in the US and Australia.
Central Bank Notes:
- The RBA held its cash rate steady at 3.60% at its October meeting on 29–30 September 2025, marking a second consecutive pause after August’s 25 basis point cut. The move affirms the Bank’s data-dependent approach as inflation trends within the target range.
- Inflation indicators remained stable through September, with headline CPI likely anchoring near 2.2%—comfortably within the 2–3% band. Insurance and housing costs remain sticky but are increasingly offset by moderation in discretionary goods.
- Trimmed mean inflation is estimated at around 2.8%, signaling underlying pressures remain contained. The Board continues to flag food and energy price volatility as short-term risks, though the broader disinflation narrative holds.
- Global conditions remain a source of uncertainty. U.S. policy expectations and uneven growth in China continue to weigh on commodities, even as trade disruptions have eased marginally since mid-year.
- Domestic growth shows resilience in the housing and services sectors, though manufacturing remains subdued. Household incomes have stabilized, but consumption remains only modest, capped by high borrowing costs.
- The labor market maintains relative tightness, though job growth has slowed notably since the first half of the year. Underutilization has ticked higher, but overall employment conditions remain supportive.
- Wage growth is plateauing, reflecting softer labor demand. Weak productivity continues to keep unit labor costs elevated, underscoring a medium-term concern highlighted repeatedly by the RBA.
- Household consumption prospects remain fragile. The combination of high rents and weak discretionary appetite suggests risks of a consumer-led slowdown in Q4 if confidence fails to rebound.
- The Board reiterated that subdued household spending poses risks to business sentiment and may dampen investment and job creation in the coming quarters.
- Monetary policy remains mildly restrictive. The RBA balanced confidence in inflation progress with caution around global and domestic demand risks, keeping further adjustments conditional on incoming data.
- The Bank reaffirmed its dual commitment to price stability and full employment, noting its readiness to act should conditions shift markedly.
- The next meeting is on 5 to 6 November 2025.
Next 24 Hours Bias
Medium Bullish
The Kiwi Dollar (NZD)
Key news events today
RBNZ Gov Hawkesby Speaks (3:30 am GMT)
What can we expect from NZD today?
The New Zealand Dollar (NZD) showed moderate gains against the US Dollar on October 29, 2025, supported by easing US-China trade tensions and a modest uptick in market sentiment, tempered by recent dovish monetary signals from the Reserve Bank of New Zealand (RBNZ). The NZD/USD pair exhibited a slight upward momentum, trading around 0.5760–0.5780, but major resistance at 0.5800 remained intact.
Central Bank Notes:
- The Monetary Policy Committee (MPC) agreed to cut the Official Cash Rate (OCR) by 50 basis points to 2.50% on 8 October 2025, exceeding market expectations for a smaller 25-basis-point reduction and signaling a stronger commitment to reviving growth.
- The decision was reached by consensus, marking a shift from previous split votes, and reflected policymakers’ shared view that sustained economic weakness and persistent disinflationary pressures required a more front-loaded policy response.
- Annual consumer price inflation stood at 2.7% in the June quarter and is seen nearing 3% for the September quarter—above the 2% midpoint but within the 1–3% target range. Despite high near-term readings, the MPC projects inflation will return toward 2% by the first half of 2026 as spare capacity and moderating tradables curb price momentum.
- Policymakers acknowledged that domestic demand remains weak, with household spending, business investment, and construction activity under pressure. While still elevated, services inflation is expected to ease gradually as wage growth slows and unemployment edges higher.
- Financial conditions have eased with expectations as wholesale and retail borrowing rates adjust to lower policy settings. Bank lending data indicate a modest uptick in mortgage approvals, though broader credit demand remains subdued.
- GDP growth stalled in the middle of 2025, with high-frequency indicators showing continued weakness into the third quarter. A combination of elevated costs for essentials and falling savings continues to restrain household consumption, while global trade frictions weigh on business sentiment.
- The MPC noted that global uncertainty—particularly from US trade regulation changes and soft Chinese demand—continues to pose downside risks to export sectors, though these are partly offset by a weaker New Zealand dollar improving competitiveness.
- Subject to data confirming a sustained soft patch in activity and moderating inflation pressures, the MPC signaled further scope to reduce the OCR toward 2.25% at its next meeting on 26 November 2025, consistent with current market and Westpac forecasts.
- The next meeting is on 26 November 2025.
Next 24 Hours Bias
Weak Bullish
The Japanese Yen (JPY)
Key news events today
No major news event
What can we expect from JPY today?
On October 29, 2025, the Japanese Yen is rebounding on intervention fears and speculation about Bank of Japan policy. Markets expect rates to remain steady, but forward guidance and economic projections could set the tone for Yen moves into the year-end. Fiscal stimulus under PM Takaichi and persistent inflation are key drivers, with traders closely watching upcoming BOJ decisions and statements for clues about future tightening.
Central Bank Notes:
- The Policy Board of the Bank of Japan decided on 17 September, by a unanimous vote, to set the following guidelines for money market operations for the inter-meeting period:
- The Bank will encourage the uncollateralized overnight call rate to remain at around 0.5%.
- The BOJ will continue its gradual reduction of monthly outright purchases of Japanese Government Bonds (JGBs). The scheduled amount of long-term government bond purchases remains unchanged from the prior decision, with a quarterly reduction pace of about ¥400 billion through March 2026 and about ¥200 billion per quarter from April to June 2026 onward, aiming for a purchase level near ¥2 trillion in January to March 2027.
- Japan’s economy continues to show a moderate recovery, with household consumption supported by rising incomes, although corporate activity has softened somewhat. Overseas economies remain on a moderate growth path, with the impact of global trade policies still weighing on Japan’s export and industrial production outlook.
- On the price front, the year-on-year rate of change in consumer prices (excluding fresh food) remains in the mid-3% range. Inflationary pressures remain broad-based, with persistent cost-push factors in food and energy, alongside solid wage pass-through. However, input cost pressures from past import surges are showing early signs of easing.
- Short-term inflation momentum may moderate as cost-push effects diminish, though rent increases and service-related price gains tied to labor shortages are likely to provide support. Inflation expectations among firms and households continue a gradual upward drift.
- Looking ahead, the economy is projected to grow at a slower-than-trend pace in the near term due to external demand softness and cautious corporate investment plans. However, accommodative financial conditions and steady increases in real labor income are expected to underpin domestic demand.
- In the medium term, as overseas economies recover and global trade stabilizes, Japan’s growth potential is likely to improve. With persistent labor market tightness and rising medium- to long-term inflation expectations, core inflation is projected to remain on a gradual upward trend, converging toward the 2% price stability target in the latter half of the projection horizon.
- The next meeting is scheduled for 30 to 31 October 2025.
Next 24 Hours Bias
weak Bearish
Oil
Key news events today
EIA crude oil inventories (2:30 pm GMT)
What can we expect from Oil today?
Oil markets on Wednesday face a complex interplay of bearish and bullish forces. While sanctions on Russian oil producers and improving US-China trade relations provide some price support, the dominant narrative remains one of oversupply concerns driven by OPEC+ production increases and weak demand growth projections. The upcoming OPEC+ meeting on November 2 and official US inventory data release on October 29 will provide critical direction for near-term price movements.
Next 24 Hours Bias
Medium Bearish
The post IC Markets – Asia Fundamental Forecast | 29 October 2025 first appeared on IC Markets | Official Blog.
Wednesday 29th October 2025: Asian Markets Mixed Ahead of Fed Rate Decision
422832 October 29, 2025 17:39 ICMarkets Market News
Global Markets:
- Asian Stock Markets : Nikkei up 2.00%, Shanghai Composite up 0.37%, Hang Seng down -0.33% ASX down -0.99%
- Commodities : Gold at $3,981.19 (-0.05%), Silver at $47.480 (0.33%), Brent Oil at $63.73 (-0.16%), WTI Oil at $60.05 (-0.17%)
- Rates : US 10-year yield at 3.982, UK 10-year yield at 4.4030, Germany 10-year yield at 2.6212
News & Data:
- (USD) Richmond Manufacturing Index -4 to -11 expected
Markets Update:
Asian stock markets traded mixed on Wednesday, following positive overnight cues from Wall Street, as investors remained cautious ahead of the U.S. Federal Reserve’s interest rate decision later in the day. Optimism about a potential U.S.-China trade deal also supported sentiment. The Fed is widely expected to cut rates by another quarter point, with attention focused on Chair Jerome Powell’s comments for hints of future policy moves. According to CME Group’s FedWatch Tool, there is a 90.8% chance of another rate cut in December, though expectations for early 2026 remain divided.
In Australia, the S&P/ASX 200 Index slipped 0.73% to 8,946.50, weighed down by losses in banking and technology stocks, despite gains in gold miners. The CPI rose 3.5% year-on-year in September, exceeding expectations and marking the highest reading since July 2024. The Australian dollar traded at $0.659.
Japan’s Nikkei 225 surged 2.05% to 51,249.82, led by strong gains in technology and exporter stocks. Advantest jumped over 20%, while Tokyo Electron and Screen Holdings gained around 3%.
Elsewhere in Asia, South Korea gained 1.4%, while Singapore, Malaysia, and Indonesia slipped marginally. On Wall Street, major U.S. indices closed higher, extending Monday’s rally, with the Nasdaq up 0.8% and the Dow up 0.3%. Crude oil prices fell 2.2% to $59.99 per barrel on reports of potential OPEC production hikes.
Upcoming Events:
- 01:45 PM GMT – CAD Overnight Rate
- 06:00 PM GMT – USD Federal Funds Rate
- 06:00 PM GMT – USD FOMC Statement
The post Wednesday 29th October 2025: Asian Markets Mixed Ahead of Fed Rate Decision first appeared on IC Markets | Official Blog.
IC Markets – Europe Fundamental Forecast | 29 October 2025
422831 October 29, 2025 17:39 ICMarkets Market News
IC Markets – Europe Fundamental Forecast | 29 October 2025
What happened in the Asia session?
Today’s Asia session was driven by upbeat market sentiment on progress in US–China trade negotiations, hotter-than-expected Australian inflation data, and anticipation of major central bank rate decisions. Risk assets outperformed, Asian currencies firmed, and technology stocks led rallies across the region, while the US dollar softened ahead of the Federal Reserve meeting.
What does it mean for the Europe & US sessions?
October 29, 2025, brings critical central bank decisions from the Federal Reserve (2:00 PM ET) and Bank of Canada (1:45 PM UTC), with both expected to deliver 25 basis point rate cuts. Australia’s inflation surged to 3.2% annually, the highest since June 2024, driven by a 9% jump in electricity costs, effectively ruling out near-term RBA rate cuts. U.S. stock indices hit fresh records on Tuesday, led by Nvidia, while Asian markets rallied ahead of the Fed decision.
The Dollar Index (DXY)
Key news events today
Federal funds rate (6:00 pm GMT)
FOMC statement (6:00 pm GMT)
FOMC Press Conference (6:30 pm GMT)
What can we expect from DXY today?
The US Dollar faces pressure from the anticipated Federal Reserve rate cut, government-induced data blackout, and global policy divergence. Today’s FOMC decision is critical—while markets expect a 0.25% rate cut, any unexpected forward guidance from Chair Powell could trigger volatility. The dollar remains soft against major peers, with eyes on how policy changes and risk sentiment interplay in the coming days.
Central Bank Notes:
- The Federal Open Market Committee (FOMC) voted, by majority, to lower the federal funds rate target range by 25 basis points to 3.75%–4.00% at its October 28–29, 2025, meeting, marking the second consecutive cut following the 25 basis points reduction in September.
- The Committee maintained its long-term objectives of maximum employment and 2% inflation, noting that the labor market continues to soften, with modest job creation and an unemployment rate edging higher. In comparison, inflation remains above target at around 3.0%.
- Policymakers highlighted ongoing downside risks to economic growth, tempered by signs of resilient economic activity. September’s consumer price index (CPI) came in slightly lower than expected at 3.0% year-over-year, easing inflation pressure but still warranting vigilance given tariff-driven price effects.
- Economic activity expanded modestly in the third quarter, with GDP growth estimates around 1.0% annualized; however, uncertainty remains elevated amid persistent global trade tensions and the U.S. government shutdown, which is impacting data availability.
- The updated Summary of Economic Projections reflects an anticipated unemployment rate averaging approximately 4.5% for 2025, with headline and core personal consumption expenditures (PCE) inflation projections holding near 3.0%, indicating a slow easing path ahead.
- The Committee emphasized its flexible, data-dependent approach and underscored that future policy adjustments will be guided by incoming labor market and inflation data. As in prior meetings, there was dissent, including one member advocating a more aggressive 50-basis-point cut.
- The FOMC announced the planned conclusion of its balance sheet reduction (quantitative tightening) program, intending to cease runoff in the near term to maintain market stability, with Treasury redemption caps held steady at $5 billion per month and agency mortgage-backed securities caps at $35 billion.
- The next meeting is scheduled for 9 to 10 December 2025.
Next 24 Hours Bias
Medium Bearish
Gold (XAU)
Key news events today
Federal funds rate (6:00 pm GMT)
FOMC statement (6:00 pm GMT)
FOMC Press Conference (6:30 pm GMT)
What can we expect from Gold today?
Gold prices rebounded on Wednesday, as traders returned for bargain hunting after the precious metal dropped to a three-week low earlier in the week. Spot gold traded around $3,975-$3,978 per ounce, up approximately 0.60-0.66% from the previous day. After surging more than 60% year-to-date and reaching an all-time high of $4,382 per ounce on October 20, gold has experienced significant volatility, pulling back over 7% in just five trading sessions.
Next 24 Hours Bias
Weak Bearish
The Euro (EUR)
Key news events today
No major news event
What can we expect from EUR today?
The Euro enters the final days of October on a relatively firm footing, supported by stronger-than-expected economic growth data, stabilizing inflation near target, and an ECB that has successfully concluded its easing cycle. Germany’s surprisingly robust PMI performance has boosted confidence in the eurozone’s growth trajectory for Q4 2025, while the resolution of some US tariff uncertainties has reduced external headwinds.
Central Bank Notes:
- The Governing Council kept the three key ECB interest rates unchanged at its meeting on October 30, 2025. The main refinancing rate remains at 2.15%, the marginal lending facility at 2.40%, and the deposit facility at 2.00%. This decision reflects policymakers’ assessment that the current monetary stance remains consistent with medium-term price stability, while incoming data confirm a gradual return of inflation towards the target.
- Recent indicators point to stable price dynamics. Headline inflation remains near the 2% mark, with energy prices contained and food inflation easing slightly after earlier supply bottlenecks. Wage growth continues to moderate, contributing to the slowdown in domestic cost pressures. The ECB reiterated its commitment to a data-driven, meeting-by-meeting approach and emphasized flexibility amid uncertain global financial conditions.
- Eurosystem staff projections have not been materially altered since September. Headline inflation averages remain at 2.0% for 2025, 1.8% for 2026, and 2.0% for 2027. Recent softening in producer prices and subdued pipeline pressures suggest limited upside risks to inflation, though geopolitical tensions and potential commodity shocks continue to pose uncertainties to the outlook.
- Euro area GDP growth remains on track with earlier forecasts, projected at 1.1% for 2025, 1.1% for 2026, and 1.4% for 2027. Forward-looking indicators, including PMIs and industrial sentiment surveys, signal some stabilization in activity following weakness in the third quarter. Public investment and recovering export activity are expected to offset softer private sector demand in the near term.
- The labor market remains resilient, with unemployment rates at multi-decade lows and participation rates strong. Real income growth continues to support household spending, even as consumption growth normalizes from earlier highs. Financing conditions remain favorable, aided by stable banking sector liquidity and improved credit demand among small and medium-sized firms.
- Business sentiment remains mixed, reflecting lingering uncertainty over global trade policy and the path of US tariffs. However, easing supply chain costs and improved export competitiveness due to softer exchange rates are providing some relief to manufacturing and external-oriented sectors.
- The Governing Council reaffirmed that future decisions will depend on an integrated assessment of incoming data—covering inflation trends, financial conditions, and the state of policy transmission. The Council emphasized that no pre-set path for rates exists; keeping all options open should the economic outlook shift markedly.
- Balance sheet reduction continues smoothly, with holdings under the APP and PEPP declining as reinvestments have ceased. The ECB confirmed that the pace of portfolio runoff remains in line with its previously communicated normalization plan, supporting a gradual withdrawal of monetary accommodation in a predictable manner.
- The next meeting is on 17 to 18 December 2025
Next 24 Hours Bias
Weak Bullish
The Swiss Franc (CHF)
Key news events today
No major news event
What can we expect from CHF today?
The Swiss Franc’s strength stems from a confluence of factors: elevated global uncertainty driving safe-haven demand, the SNB’s decision to hold rates steady while dismissing further easing, and the Federal Reserve’s continued dovish stance. While punitive US tariffs weighing on the Swiss economy have prompted growth downgrades, strong pharmaceutical exports and the franc’s safe-haven status continue supporting the currency.
Central Bank Notes:
- The SNB maintained its key policy rate at 0% during its meeting on 25 September 2025, pausing a sequence of six consecutive rate cuts as inflation stabilized and the Swiss franc remained firm.
- Recent data showed a modest rebound in inflation, with Swiss consumer prices rising 0.2% year-on-year in August after staying above zero for three consecutive months; this helped alleviate fears of deflation that were mounting earlier in the year.
- The conditional inflation forecast remains broadly unchanged from June: headline inflation is expected to average 0.2% in 2025, 0.5% in 2026, and 0.7% in 2027. The risk of a negative rate move has diminished for now, but the SNB retains flexibility should inflationary pressures weaken again.
- The global economic outlook has deteriorated further, weighed down by heightened trade tensions—especially with the U.S.—and ongoing uncertainty in key Swiss export markets.
- Swiss GDP growth moderated in Q2 after a strong Q1 boosted by front-loaded U.S. exports. The SNB expects growth to slow and remain subdued, with forecasted GDP expansion between 1% and 1.5% in both 2025 and 2026.
- Labor market sentiment in the Swiss industrial sector has softened on concerns over export competitiveness and potential adjustments to production, but the overall growth outlook stays broadly unchanged
- The SNB reiterated its readiness to respond as needed if deflation risks re-emerge, emphasizing its commitment to medium-term price stability and a robust, transparent communication policy, with the introduction of more detailed monetary policy minutes beginning in October.
- The next meeting is on 11 December 2025.
Next 24 Hours Bias
Medium Bullish
The Pound (GBP)
Key news events today
No major event
What can we expect from GBP today?
Sterling is under pressure from mounting fiscal challenges and budget uncertainty as the UK faces a potential £20-30 billion fiscal shortfall ahead of the November 26 Autumn Budget. While retail price deflation offers some relief, inflation remains well above the Bank of England’s 2% target at 3.8%, limiting the central bank’s ability to cut rates in the near term. The pound has weakened to two-month lows against the euro and faces technical pressure, with Brexit’s ongoing economic impact continuing to constrain productivity and growth prospects.
Central Bank Notes:
- The Bank of England’s Monetary Policy Committee (MPC) voted on 18 September 2025 by a majority (expected split likely 7–2 or 6–3) to hold the Bank Rate steady at 4.00%, following the rate cut in August. Most members cited persistent inflation and mixed indicators on growth and employment, while a minority favored further easing due to the cooling labor market and subdued GDP growth.
- The Committee decided to decrease the pace of quantitative tightening, planning to reduce the stock of UK government bond purchases by £67.5 billion over the next 12 months, instead of the prior £100 billion pace, with the gilt balance now standing at nearly £558 billion. This reflects increased volatility in bond markets and a shift to a more gradual approach.
- Headline inflation rose unexpectedly to 3.8% in July and is projected at 4% for September, above the Bank’s 2% target. Price pressures are driven by regulated energy costs and ongoing food price increases. While previous disinflation has been substantial, core inflation remains elevated and sticky.
- The MPC expects headline inflation to remain above target through Q4, with a resumption of the downward trend projected for early 2026 as energy and regulated price pressures abate. The Committee remains watchful for signs of persistent inflation despite previous policy tightening.
- UK GDP growth is stagnant, with business and consumer activity subdued. Recent labor market data show rising unemployment rates (now at 4.7%) and stabilizing wage growth (holding near 5%), indicating slack but continued wage price pressure. The Committee remains cautious amid lackluster demand and soft survey sentiment.
- Pay growth and employment indicators have moderated further, alongside confirmation from business surveys that pay settlements are slowing. The Committee expects wage growth to decelerate significantly through Q4 and the rest of 2025.
- Global uncertainty persists due to volatile energy prices, supply chain disruptions linked to Middle East conflicts, and renewed trade tensions. The MPC remains vigilant in tracking transmission of external cost/wage shocks to UK inflation.
- Risks to inflation are considered two-sided. While subdued domestic growth and softening labor activity suggest scope for easing, persistent inflation requires caution. The MPC anticipates a slow, gradual reduction path in rates, continuing its data-dependent approach with careful adjustment as warranted by economic developments.
- The Committee’s bias remains toward maintaining a restrictive monetary policy stance until firmer evidence emerges that inflation will return sustainably to the 2% target. All future decisions will remain highly data dependent, with a strong emphasis on evolving demand, inflation expectations, costs, and labor market conditions.
- The next meeting is on 6 November 2025.
Next 24 Hours Bias
Medium Bearish
The Canadian Dollar (CAD)
Key news events today
BOC monetary policy report (1:45 pm GMT)
BOC rate statement (1:45 pm GMT)
Overnight rate (1:45 pm GMT)
Pending Home Sales m/m (2:00 pm GMT)
What can we expect from CAD today?
The BoC is widely expected to cut rates by 25 basis points to 2.25%, marking the ninth cut since last summer and bringing the overnight rate to the lower bound of its neutral range. Despite September inflation accelerating to 2.4%, economic weakness—including a 1.6% Q2 GDP contraction, elevated 7.1% unemployment, and deteriorating business confidence—justifies continued easing.
Central Bank Notes:
- The Council noted that U.S. tariff tensions have eased slightly following early progress in bilateral discussions, though the external trade environment remains fragile. Businesses continue to hold back on long-term investment, with the Bank highlighting that sustained clarity on U.S. trade policy is needed to restore confidence.
- The Bank acknowledged that uncertainty persists despite the softer U.S. tone, as incoming data show limited improvement in export orders. The manufacturing sector has stabilized but remains below pre-2024 output levels, reflecting weak global demand and cautious corporate spending.
- Canada’s economy showed tentative signs of recovery in early Q4, with GDP estimated to expand by 0.3% in October after two quarters of contraction. Mining and energy activity strengthened modestly, aided by steady crude demand, while goods exports posted a fractional gain.
- Service sector growth remained uneven, supported mainly by tourism-related and technology services. However, retail spending and household consumption were subdued, constrained by slower job creation and lingering consumer caution. The Bank judged overall momentum as fragile but improving marginally.
- Housing activity showed modest reacceleration in major urban markets as mortgage rates stabilized near record lows. Nonetheless, affordability pressures and stricter lending standards continue to cap overall resale volumes, leading to only a gradual recovery in the housing sector.
- Headline CPI inflation rose to 2.1% in October, reaching the Bank’s target for the first time in six months. The increase was driven by higher energy prices and a modest uptick in food and shelter costs. Core inflation measures remained stable, suggesting underlying price pressures are contained.
- The Governing Council reiterated its data-dependent stance, indicating that the current policy rate remains appropriate amid tentative growth and balanced inflation risks. Officials noted that while additional stimulus is not ruled out, the emphasis has shifted toward monitoring the sustainability of the recovery rather than immediate rate adjustments.
- The next meeting is on 17 to 18 December 2025.
Next 24 Hours Bias
Weak Bearish
Oil
Key news events today
EIA crude oil inventories (2:30 pm GMT)
What can we expect from Oil today?
Oil markets are navigating a complex landscape of competing pressures. Prices have stabilized around $60/barrel for WTI and $65/barrel for Brent after a three-day decline, as bearish fundamentals from OPEC+ production increases clash with supportive factors, including US-China trade progress and Russian sanctions.The dominant concern remains oversupply, with OPEC+ poised to approve another 137,000 bpd production increase for December at its November 2 meeting.
Next 24 Hours Bias
Weak Bearish
The post IC Markets – Europe Fundamental Forecast | 29 October 2025 first appeared on IC Markets | Official Blog.