Articles
Monday 6th October 2025: Technical Outlook and Review
421960 October 6, 2025 15:00 ICMarkets Market News
DXY (U.S. Dollar Index):
Potential Direction: Bearish
Overall momentum of the chart: Bearish
The price could see a short-term pullback toward the pivot before continuing its bearish move down toward the 1st support.
Pivot: 98.64
Supporting reasons: Identified as a pullback resistance that aligns closely with the 61.8% Fibonacci retracement, where selling pressures could intensify and potentially cap any upward retracement.
1st support: 96.64
Supporting reasons: Identified as a swing low support, indicating a potential area where the price could again stabilize.
1st resistance: 100.20
Supporting reasons: Identified as an overlap resistance, indicating a potential area that could halt any further upward movement
EUR/USD:
Potential Direction: Bullish
Overall momentum of the chart: Bullish
The price could make a short-term pullback toward the pivot before rising again toward the 1st resistance
Pivot: 1.1591
Supporting reasons: Identified as an overlap support that aligns with the 61.8% Fibonacci retracement, indicating a potential area where buying interest could pick up
1st support: 1.1391
Supporting reasons: Identified as a swing low support, indicating a potential level where the price could stabilize once again.
1st resistance: 1.1811
Supporting reasons: Identified as a pullback resistance, indicating a potential level that could cap further upward movement.
EUR/JPY:
Potential Direction: Bullish
Overall momentum of the chart: Bullish
The price could make a short-term pullback toward the pivot before rising again toward the 1st resistance
Pivot: 172.12
Supporting reasons: Identified as an overlap support, where renewed buying pressure could emerge to push the price higher.
1st support: 168.44
Supporting reasons: Identified as a pullback support, indicating a potential area where the price could again stabilize.
1st resistance: 176.48
Supporting reasons: Identified as a resistance that aligns with the 161.8% Fibonacci extension, indicating a potential level that could cap further upward movement.
EUR/GBP:
Potential Direction: Bullish
Overall momentum of the chart: Bullish
The price could make a short-term pullback toward the pivot before rising again toward the 1st resistance
Pivot: 0.8691
Supporting reasons: Identified as a pullback support, where renewed buying pressure could emerge to push the price higher.
1st support: 0.8600
Supporting reasons: Identified as an overlap support, indicating a potential area where the price could stabilize once more.
1st resistance: 0.8798
Supporting reasons: Identified as a resistance that is supported by the 127.2% Fibonacci extension, indicating a potential level that could cap further upward movement.
GBP/USD:
Potential Direction: Bullish
Overall momentum of the chart: Bullish
The price could make a short-term pullback toward the pivot before rising again toward the 1st resistance
Pivot: 1.3369
Supporting reasons: Identified as a pullback support, indicating a potential area where buying interest could pick up
1st support: 1.3200
Supporting reasons: Identified as an overlap support, indicating a potential area where the price could stabilize once more.
1st resistance: 1.3575
Supporting reasons: Identified as a pullback resistance that aligns with the 61.8% Fibonacci retracement, indicating a potential level that could halt further upward movement.
GBP/JPY:
Potential Direction: Bullish
Overall momentum of the chart: Bullish
The price could make a short-term pullback toward the pivot before rising again toward the 1st resistance
Pivot: 196.38
Supporting reasons: Identified as a pullback support, where renewed buying pressure could emerge to push the price higher.
1st support: 192.17
Supporting reasons: Identified as an overlap support, indicating a potential level where the price could stabilize once more.
1st resistance: 201.300
Supporting reasons: Identified as a swing high resistance, indicating a potential level that could halt further upward movement.
USD/CHF:
Potential Direction: Bearish
Overall momentum of the chart: Bearish
The price could see a short-term pullback toward the pivot before continuing its bearish move down toward the 1st support.
Pivot: 0.8040
Supporting reasons: Identified as a pullback resistance that aligns closely with the 61.8% Fibonacci retracement, where selling pressures could intensify and potentially cap any upward retracement.
1st support: 0.7916
Supporting reasons: Identified as a pullback support, indicating a potential level where the price could stabilize once again.
1st resistance: 0.8162
Supporting reasons: Identified as an overlap resistance, indicating a potential level that could cap further upward movement.
USD/JPY:
Potential Direction: Bullish
Overall momentum of the chart: Bullish
The price could fall toward the pivot and make a bullish bounce off toward the 1st resistance.
Pivot: 145.27
Supporting reasons: Identified as a pullback support that aligns with the 61.8% Fibonacci retracement, indicating a potential area where buying interest could pick up.
1st support: 143.29
Supporting reasons: Identified as a swing low support, indicating a strong area where buyers might return, and the price could stabilize once again.
1st resistance: 151.15
Supporting reasons: Identified as an overlap resistance that aligns closely with the 61.8% Fibonacci retracement. This level represents the next key area where upward movement could be capped amid increased selling pressure
USD/CAD:
Potential Direction: Bullish
Overall momentum of the chart: Bearish
The price could fall toward the pivot and make a bullish bounce off toward the 1st resistance.
Pivot: 1.3906
Supporting reasons: Identified a an overlap support, indicating a potential area where buying interest could pick up.
1st support: 1.3742
Supporting reasons: Identified as an overlap support, indicating a key level where the price could stabilize once more.
1st resistance: 1.4166
Supporting reasons: Identified as a pullback resistance that aligns with the 61.8% Fibonacci retracement, making it a possible target for bullish advances and a level where some sellers could return to cap gains
AUD/USD:
Potential Direction: Bullish
Overall momentum of the chart: Bullish
The price could make a short-term pullback toward the pivot before rising again toward the 1st resistance
Pivot: 0.6532
Supporting reasons: Identified as an overlap support that aligns with the 61.8% Fibonacci retracement, indicating a potential area where buying interest could pick up
1st support: 0.6424
Supporting reasons: Identified as a swing low support, this area has provided strong support historically and may attract buying interest for a potential short-term bounce
1st resistance: 0.6625
Supporting reasons: Identified as an overlap resistance, indicating a potential area that could halt any further upward movement.
NZD/USD
Potential Direction: Bearish
Overall momentum of the chart: Bullish
The price could see a short-term pullback toward the pivot before continuing its bearish move down toward the 1st support.
Pivot: 0.5853
Supporting reasons: Identified as a pullback resistance, where selling pressures could intensify and potentially cap any upward retracement.
1st support: 0.5671
Supporting reasons: Identified as a pullback support that aligns with the 161.8% Fibonacci extension, this area has provided strong support historically and may attract buying interest for a potential short-term bounce
1st resistance: 0.5988
Supporting reasons: Identified as an overlap resistance, indicating a potential area that could halt any further upward movement.
US30 (DJIA):
Potential Direction: Bullish
Overall momentum of the chart: Bullish
The price could continue to make a bullish rise toward the 1st resistance.
Pivot: 45,020.36
Supporting reasons: Identified as an overlap support, indicating a potential area where buying interest could pick up.
1st support: 42,889.86
Supporting reasons: Identified as a pullback support, suggesting a potential area where the price could stabilize once again.
1st resistance: 50,310.42
Supporting reasons: Identified as a resistance that is supported by the 161.8% Fibonacci extension, indicating a potential area that could halt any further upward movement.
DE40 (DAX):
Potential Direction: Bullish
Overall momentum of the chart: Bullish
The price could make a short-term pullback toward the pivot before rising again toward the 1st resistance
Pivot: 23,863.42
Supporting reasons: Identified as a pullback support, where renewed buying pressure could emerge to push the price higher.
1st support: 23,063.17153.96
Supporting reasons: Identified as a swing low support, indicating a key level where the price could stabilize once more.
1st resistance: 24,661.68
Supporting reasons: Identified as a swing high resistance, indicating a potential area that could halt any further upward movement.
US500 (S&P 500):
Potential Direction: Bullish
Overall momentum of the chart: Bullish
The price could make a short-term pullback toward the pivot before rising again toward the 1st resistance
Pivot: 6,505.98
Supporting reasons: Identified as a pullback support, where renewed buying pressure could emerge to push the price higher.
1st support: 6,141.15
Supporting reasons: Identified as a pullback support, indicating a potential level where the price could stabilize once again.
1st resistance: 6,978.39
Supporting reasons: Identified as a resistance that is supported by the 161.8% Fibonacci extension, indicating a potential area that could halt any further upward movement.
BTC/USD (Bitcoin):
Potential Direction: Bullish
Overall momentum of the chart: Bullish
The price could make a short-term pullback toward the pivot before rising again toward the 1st resistance
Pivot: 117.347
Supporting reasons: Identified as a pullback support, where renewed buying pressure could emerge to push the price higher.
1st support: 112,870.09
Supporting reasons: Identified as a pullback support, indicating a potential level where the price could stabilize once more.
1st resistance: 124.500
Supporting reasons: Identified as a swing high resistance, indicating a potential area that could halt any further upward movement.
ETH/USD (Ethereum):
Potential Direction: Bullish
Overall momentum of the chart: Bullish
The price could make a short-term pullback toward the pivot before rising again toward the 1st resistance
Pivot: 4,247.98
Supporting reasons: Identified as a pullback support, where renewed buying pressure could emerge to push the price higher.
1st support: 3,860.40
Supporting reasons: Identified as an overlap support that aligns with the 61.8% Fibonacci retracement, indicating a potential level where the price could stabilize once more.
1st resistance: 4,846.95
Supporting reasons: Identified as a swing high resistance, indicating a potential area that could halt any further upward movement.
WTI/USD (Oil):
Potential Direction: Bearish
Overall momentum of the chart: Bullish
The price could see a short-term pullback toward the pivot before continuing its bearish move down toward the 1st support.
Pivot: 62.32
Supporting reasons: Identified as a pullback resistance, where selling pressures could intensify and potentially cap any upward retracement.
1st support: 57.97
Supporting reasons: Identified as a swing low support, indicating a key level where the price could stabilize once more.
1st resistance: 65.95
Supporting reasons: Identified as an overlap resistance, indicating a potential area that could halt any further upward movement.
XAU/USD (GOLD):
Potential Direction: Bullish
Overall momentum of the chart: Bullish
The price could fall toward the pivot and make a bullish rise toward the 1st resistance.
Pivot: 3,693.59
Supporting reasons: Identified as a pullback support, indicating a potential area where buying interest could pick up.
1st support: 3,498.59
Supporting reasons: Identified as a pullback support, indicating a key level where the price could stabilize once more.
1st resistance: 3,895
Supporting reasons: Identified as a swing resistance, indicating a potential area that could halt any further upward movement.
The accuracy, completeness and timeliness of the information contained on this site cannot be guaranteed. IC Markets does not warranty, guarantee or make any representations, or assume any liability regarding financial results based on the use of the information in the site.
News, views, opinions, recommendations and other information obtained from sources outside of www.icmarkets.com, used in this site are believed to be reliable, but we cannot guarantee their accuracy or completeness. All such information is subject to change at any time without notice. IC Markets assumes no responsibility for the content of any linked site.
The fact that such links may exist does not indicate approval or endorsement of any material contained on any linked site. IC Markets is not liable for any harm caused by the transmission, through accessing the services or information on this site, of a computer virus, or other computer code or programming device that might be used to access, delete, damage, disable, disrupt or otherwise impede in any manner, the operation of the site or of any user’s software, hardware, data or property.
The post Monday 6th October 2025: Technical Outlook and Review first appeared on IC Markets | Official Blog.
The Week Ahead – Week Commencing 06 October 2025
421954 October 6, 2025 14:39 ICMarkets Market News
It was another interesting week for financial markets last week, with traders having to battle with a US shutdown that has delayed key data updates, including the Non-Farm Payrolls. So far, markets have remained strong, with major indices hitting fresh highs over the course of the week; however, there are doubts that the momentum can continue in the States and indeed globally if the US government shutdown continues.
It looks like being a lively start to this trading week, with the initial focus surely on Japanese markets after outsider Sanae Takaichi won this weekend’s leadership battle to become Japan’s first female Prime Minister. Her victory is likely to lead to a jump in Japanese stocks but a negative for the yen on dovish Bank of Japan repricing.
There will be a big question mark for the macroeconomic calendar for the week with regard to US data releases; however, most market participants are expecting last week’s missed numbers to be released this week, with the Non-Farms, as always, to be a big focus. In addition to the potential US data releases, we have a heavy central bank schedule, with key central bankers set to speak as well as the latest rate update from the RBNZ.
Here is our usual day-by-day breakdown of the major risk events this week:

Traders are expecting to see some gapping on the open for the yen and Japanese products on Monday after the surprise leadership victory for Sanae Takaichi over the weekend. There is little else on the calendar over the rest of the trading day, although we do hear from central bank heavy hitters, ECB President Christine Lagarde and Bank of England Governor Andrew Bailey.

It’s a quiet day on Tuesday with very little of note scheduled on the data front; however, we do have several central bankers speaking later in the day, with the ECB’s Lagarde speaking again along with Bundesbank’s Nagel, as well as Fed members Bostic, Bowman, Miran, and Kashkari. Canadian markets will also come into focus early in the New York session with the Ivey PMI data due out.

There is another strong central bank focus for traders on Wednesday, with the initial focus in the Asian session on New Zealand with the Reserve Bank of New Zealand’s latest interest rate decision due. Later in the session, we hear from Bank of Japan Governor Kazuo Ueda, which will have a strong focus after the weekend’s leadership change. The main focus later in the day will be the release of the FOMC minutes; however, around that, we have more updates scheduled from Fed members Musalem, Barr, and Kashkari, as well as probably the usual weekly US Crude Oil Inventory data.

Chinese markets return for the first time in a week in the Asian session, and that alone will see a big focus on them as they adjust to any moves in global markets. In addition to the reopening, we are also due to have Chinese new loans data released. The New York session may see a “double play” of weekly unemployment data as well as more “Fedspeak” from members Bowman and Barr, who are likely to be superseded by Fed Chair Jerome Powell when he speaks earlier in the session.

Friday has the propensity to be the busiest day of the week again, and it will come down to whether US data is back on the calendar and we get the Non-Farms update. The Asian session will see an early focus on Australian markets with RBA Governor Michele Bullock set to speak; however, there is little else on the calendar until the New York open, when we will get the Canadian employment data and maybe the US employment numbers.
The post The Week Ahead – Week Commencing 06 October 2025 first appeared on IC Markets | Official Blog.

General Market Analysis – 6/10/25
421953 October 6, 2025 14:39 ICMarkets Market News
US Stocks Push Higher Despite Shutdown – Dow up 0.5%
US stock markets brushed aside the ongoing US government shutdown to push to more records in trading on Friday. Both the S&P and the Dow drove higher to hit record closes as the market missed out on its usual first Friday of the month Non-Farm Payrolls hit. The Dow added 0.51% to close at 46,785, the S&P edged just 0.01% higher to 6,715, while the Nasdaq fell 0.28% to 22,780. The dollar remained in familiar ranges, the DXY dropping 0.14% to 97.71, while Treasury yields pushed higher, with both the 2- and 10-year yields adding 3.7 basis points on the day to close at 3.576% and 4.119% respectively. Oil prices did get a bit of a reprieve after losing close to 8% over the week, Brent rising 0.41% on Friday to $64.37, and WTI adding 0.66% to $60.88 a barrel. Gold resumed its push higher again, adding 0.78% to close at $3,886.54, just shy of its recent record high.
US Government Shutdown Continues
US markets have remained incredibly resilient in the face of the recent government shutdown; however, traders are starting to factor in bearish scenarios if the situation persists and the administration goes ahead with threatened job cuts. As the shutdown enters its sixth day with little sign of a resolution on the horizon, some investors fear that we could see some dramatic moves in the market, with one estimate suggesting a $15 billion loss in GDP per week if the shutdown continues. With the major US indices sitting at all-time highs, there is a fear that any corrections could be a lot harder than in normal circumstances. For the time being, markets are remaining resilient, but there are certainly some traders out there preparing to hit the ‘sell’ button if the shutdown continues and the economy looks like taking a substantial hit on the back of it.
Quiet Calendar Day Ahead, but Volatility Expected
It’s a quiet calendar day ahead for traders today in what is a relatively quiet calendar week; however, traders are still expecting to see plenty of moves with some markets sitting at historic levels and geopolitical updates anticipated across the sessions. We have already seen big moves for Japanese markets after the surprise victory for Sanae Takaichi over the weekend, as she became Japan’s first female Prime Minister. USDJPY saw huge gapping on the open as the market priced in a more dovish scenario for the Bank of Japan, and traders are expecting more moves as the trading day progresses. Australian and Chinese markets are on holiday today, which will reduce liquidity in the first session of the day. There is very little in the way of data on the calendar today; however, we do hear from some central bank heavyweights later in the day, with both ECB President Christine Lagarde and Bank of England Governor Andrew Bailey set to speak, and traders are expecting moves in their respective markets.
The post General Market Analysis – 6/10/25 first appeared on IC Markets | Official Blog.
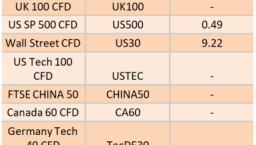
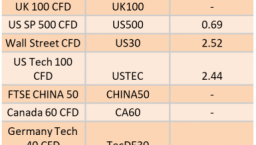
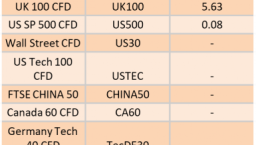
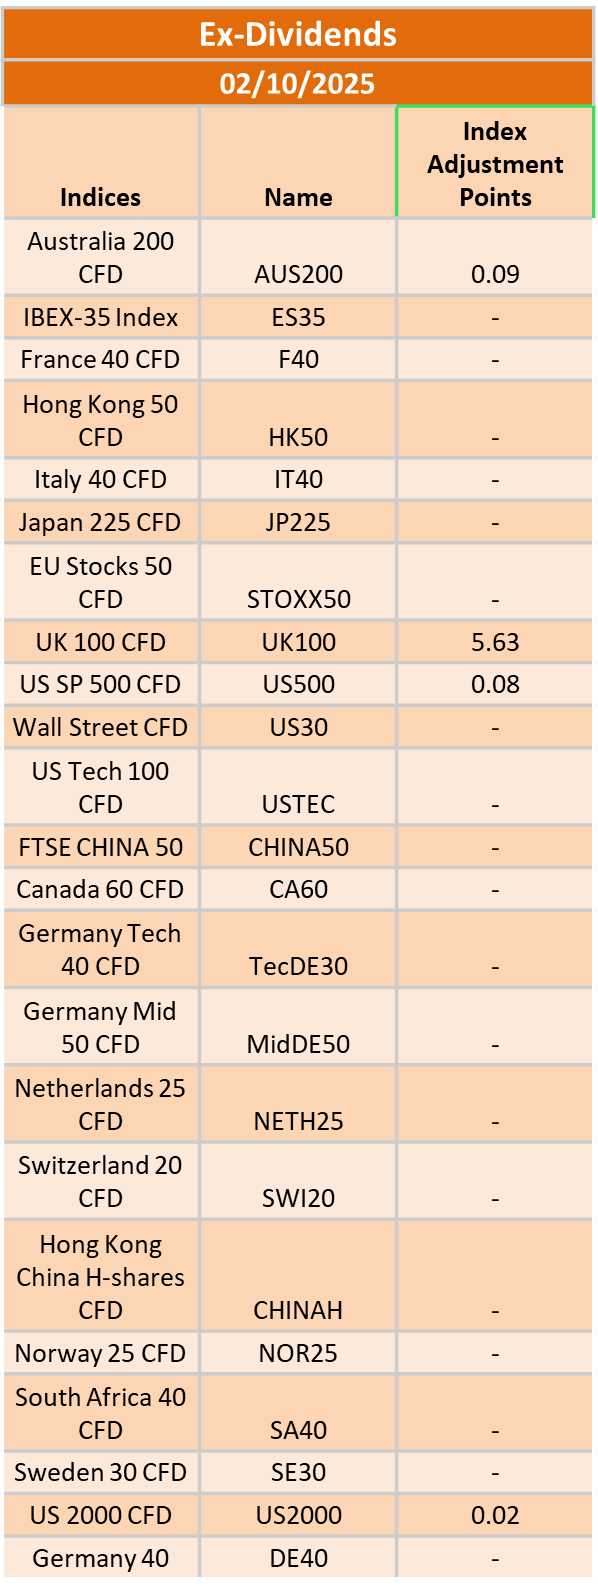
Ex-Dividend 6/10/2025
421951 October 3, 2025 17:14 ICMarkets Market News
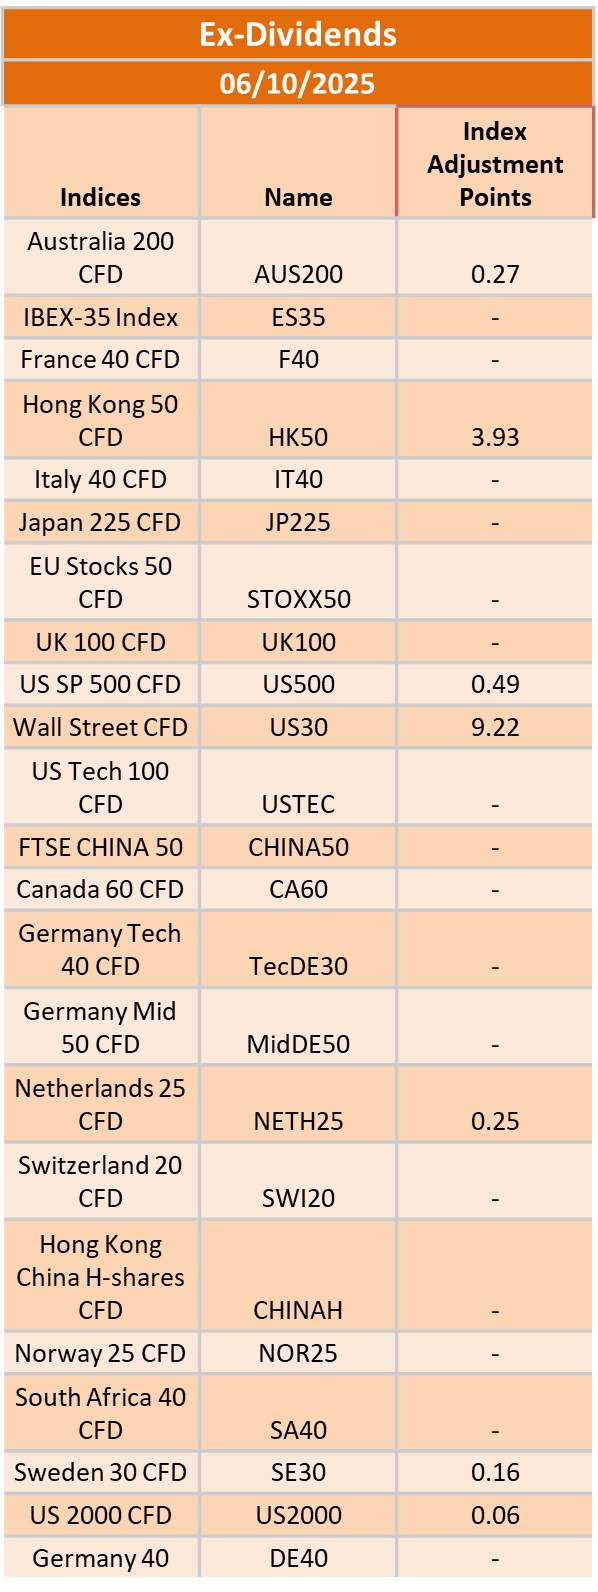
The post Ex-Dividend 6/10/2025 first appeared on IC Markets | Official Blog.
Ex-Dividend 3/10/2025
421949 October 2, 2025 17:00 ICMarkets Market News
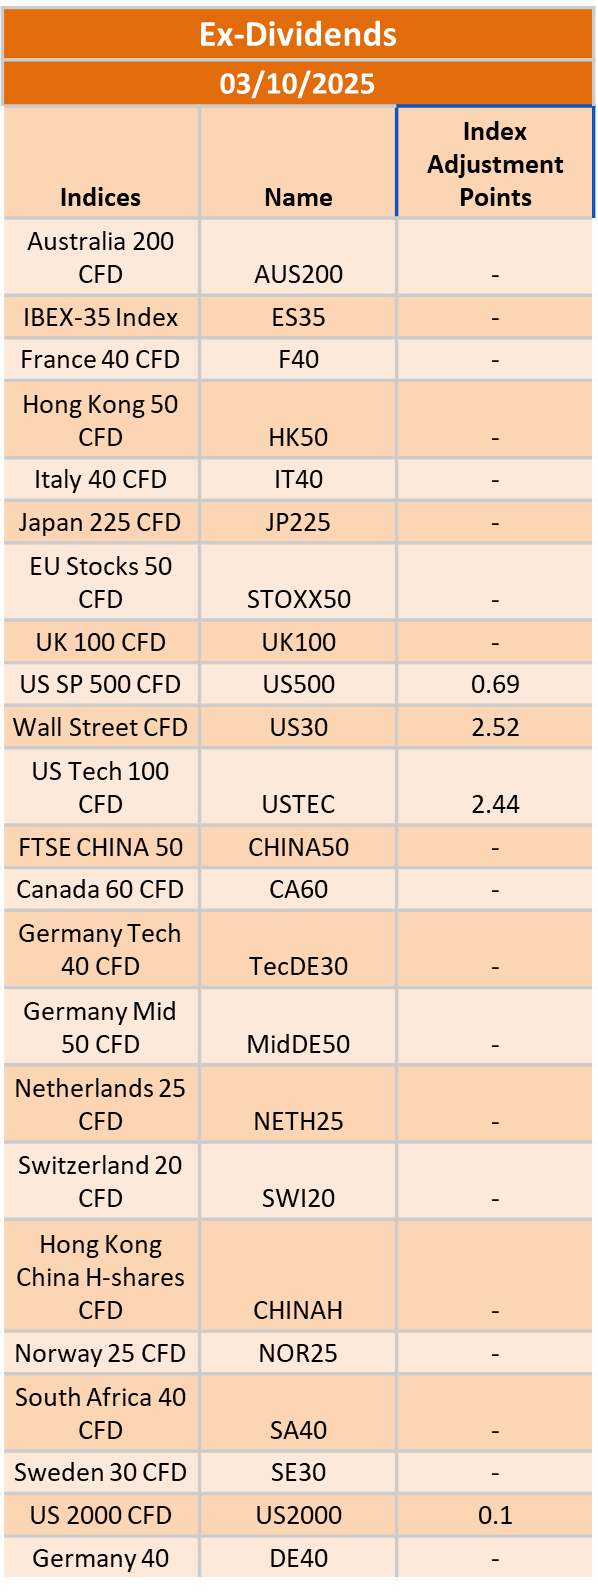
The post Ex-Dividend 3/10/2025 first appeared on IC Markets | Official Blog.
General Market Analysis – 2/10/25
421948 October 2, 2025 15:00 ICMarkets Market News
US Stocks Push Higher Despite Data and Shutdown – Nasdaq up 0.4%
US stocks pushed higher in trading yesterday despite more poor jobs data and a government shutdown, which means markets will not have their usual data as scheduled this week, including the key Non-Farms numbers tomorrow. The Dow added just 0.09% to move up to 46,411, while the other two major indices were dragged higher by the tech sector again, the S&P up 0.34% to 6,711 and the Nasdaq up 0.42% to 22,755. Treasury yields took a big hit after the ADP Non-Farms data came in well below expectations, the 2-year off 7.4 basis points to 3.535% and the benchmark 10-year off 5.2 basis points to 4.098%. The dollar dipped but recovered later in the day, the DXY closing up 0.05% at 97.83. Oil prices fell again to hit 16-week lows as oversupply concerns continued to weigh, both Brent and WTI falling 0.95% to $65.40 and $61.78 a barrel respectively. Gold again drove higher to hit another fresh all-time high, peaking at $3,895.09 before ultimately closing up 0.18% at $3,865.74 an ounce.
Investors Look at Shutdown Impact
US markets were relatively calm in trading yesterday given the fact that the US government has gone into shutdown, with President Trump threatening to use the closure to fire thousands of employees. Markets appear to be calling the government’s bluff at the moment, with stocks pushing higher as most investors look at other recent shutdowns which were resolved relatively swiftly. However, it has already been confirmed that we will not have key US employment data on Friday, a highlight of the global economic calendar, which could disturb traders and Fed officials alike. If it is just a small delay in the release and it can be rescheduled swiftly, then the impact is likely to be minimal. However, if the shutdown continues and traders and the Fed have to ‘fly blind’ into the next Fed meeting, then expect to see some negative moves for US markets.
Macroeconomic Calendar in Doubt for US Data
It was set to be a relatively quiet day ahead on the macroeconomic calendar today, and now could be even more so with US data unlikely to be released due to the US government shutdown. The Asian session again had very little on the cards today, and Chinese market holidays could affect liquidity, but markets are expected to start the day in a cautious manner as investors digest the US shutdown. We do definitely get some data after the European session commences, with key Swiss CPI data (exp. -0.2% m/m) due out. Traders are expecting to see moves in the franc around the release, with negative numbers likely to put more pressure on the SNB to cut rates further from their zero base where they currently sit. We were due to have the usual US Weekly Unemployment Claims (exp. 225k) released today once the US session started; however, that looks very much in doubt now with government workers on shutdown. Fed member Lorie Logan is set to speak today, and it’s likely that these updates will now have a greater impact on the market as investors attempt to analyze what a lack of data updates will mean for Fed thinking at the next meeting.
The post General Market Analysis – 2/10/25 first appeared on IC Markets | Official Blog.
Thursday 2nd October 2025: Technical Outlook and Review
421937 October 2, 2025 14:39 ICMarkets Market News
DXY (U.S. Dollar Index):
Potential Direction: Bearish
Overall momentum of the chart: Bearish
The price could see a short-term pullback toward the pivot before continuing its bearish move down toward the 1st support.
Pivot: 97.13
Supporting reasons: Identified an overlap resistance, where selling pressures could intensify and potentially cap any upward retracement.
1st support: 97.17
Supporting reasons: Identified as an overlap support, indicating a potential area where the price could again stabilize.
1st resistance: 98.13
Supporting reasons: Identified as a pullback resistance, indicating a potential area that could halt any further upward movement
EUR/USD:
Potential Direction: Bearish
Overall momentum of the chart: Bullish
The price has already reacted off the pivot and could continue to make a bearish move down toward the 1st support.
Pivot: 1.1773
Supporting reasons: Identified as an overlap resistance, where selling pressures could intensify and potentially cap any upward retracement..
1st support: 1.1676
Supporting reasons: Identified as a swing low support that aligns with the 61.8% Fibonacci projection, indicating a potential level where the price could stabilize once again.
1st resistance: 1.1867
Supporting reasons: Identified as a swing high resistance, indicating a potential level that could cap further upward movement.
EUR/JPY:
Potential Direction: Bearish
Overall momentum of the chart: Bullish
The price could see a short-term pullback toward the pivot before continuing its bearish move down toward the 1st support.
Pivot: 173.26
Supporting reasons: Identified as a pullback resistance, where selling pressures could intensify and potentially cap any upward retracement.
1st support: 172.13
Supporting reasons: Identified as a swing low support, indicating a potential area where the price could again stabilize.
1st resistance: 174.11
Supporting reasons: Identified as a pullback resistance, indicating a potential level that could cap further upward movement.
EUR/GBP:
Potential Direction: Bearish
Overall momentum of the chart: Bullish
The price could see a short-term pullback toward the pivot before continuing its bearish move down toward the 1st support.
Pivot: 0.8719
Supporting reasons: Identified as a pullback resistance, where selling pressures could intensify and potentially cap any upward retracement.
1st support: 0.8669
Supporting reasons: Identified as an overlap support that aligns with the 50% Fibonacci retracement, indicating a potential area where the price could stabilize once more.
1st resistance: 0.8750
Supporting reasons: Identified as a swing high resistance, indicating a potential level that could cap further upward movement.
GBP/USD:
Potential Direction: Bearish
Overall momentum of the chart: Bearish
The price could see a short-term pullback toward the pivot before continuing its bearish move down toward the 1st support.
Pivot: 1.3533
Supporting reasons: Identified as an overlap resistance, where selling pressures could intensify and potentially cap any upward retracement.
1st support: 1.3452
Supporting reasons: Identified as a swing low support, indicating a potential area where the price could stabilize once more.
1st resistance: 1.3588
Supporting reasons: Identified as a pullback resistance, indicating a potential level that could halt further upward movement.
GBP/JPY:
Potential Direction: Bearish
Overall momentum of the chart: Bullish
The price could see a short-term pullback toward the pivot before continuing its bearish move down toward the 1st support.
Pivot: 199.11
Supporting reasons: Identified as an overlap resistance, where selling pressures could intensify and potentially cap any upward retracement.
1st support: 198.03
Supporting reasons: Identified as a swing low support that aligns with the 161.8% Fibonacci extension, indicating a potential level where the price could stabilize once more.
1st resistance: 199.71
Supporting reasons: Identified as an overlap resistance, indicating a potential level that could halt further upward movement.
USD/CHF:
Potential Direction: Bullish
Overall momentum of the chart: Bullish
The price could make a short-term pullback toward the pivot before rising again toward the 1st resistance
Pivot: 0.7952
Supporting reasons: Identified as a pullback support, where renewed buying pressure could emerge to push the price higher.
1st support: 0.7909
Supporting reasons: Identified as an overlap support, indicating a potential level where the price could stabilize once again.
1st resistance: 0.8031
Supporting reasons: Identified as a pullback resistance that aligns closely with the 100% Fibonacci projection, indicating a potential level that could cap further upward movement.
USD/JPY:
Potential Direction: Bearish
Overall momentum of the chart: Bullish
The price could see a short-term pullback toward the pivot before continuing its bearish move down toward the 1st support.
Pivot: 147.44
Supporting reasons: Identified as a pullback resistance, where selling pressures could intensify and potentially cap any upward retracement.
1st support: 146.31
Supporting reasons: Identified as a swing low support, indicating a strong area where buyers might return, and the price could stabilize once again.
1st resistance: 148.54
Supporting reasons: Identified as a pullback resistance. This level represents the next key area where upward movement could be capped amid increased selling pressure
USD/CAD:
Potential Direction: Bullish
Overall momentum of the chart: Bearish
The price could fall toward the pivot and make a bullish bounce off toward the 1st resistance.
Pivot: 1.3906
Supporting reasons: Identified as an overlap support, indicating a potential area where buying interest could pick up.
1st support: 1.3860
Supporting reasons: Identified as a pullback support, indicating a key level where the price could stabilize once more.
1st resistance: 1.3991
Supporting reasons: Identified as a resistance that is supported by the 161.8% Fibonacci extension, making it a possible target for bullish advances and a level where some sellers could return to cap gains
AUD/USD:
Potential Direction: Bullish
Overall momentum of the chart: Bullish
The price could make a short-term pullback toward the pivot before rising again toward the 1st resistance
Pivot: 0.6582
Supporting reasons: Identified as a pullback support that aligns with the 61.8% Fibonacci retracement, indicating a potential area where buying interest could pick up
1st support: 0.6530
Supporting reasons: Identified as a swing low support, this area has provided strong support historically and may attract buying interest for a potential short-term bounce
1st resistance: 0.6637
Supporting reasons: Identified as a pullback resistance, indicating a potential area that could halt any further upward movement.
NZD/USD
Potential Direction: Bullish
Overall momentum of the chart: Bullish
The price could make a short-term pullback toward the pivot before rising again toward the 1st resistance
Pivot: 0.5790
Supporting reasons: Identified as an overlap support, indicating a potential area where buying interest could pick up
1st support: 0.5763
Supporting reasons: Identified as a swing low support, this area has provided strong support historically and may attract buying interest for a potential short-term bounce
1st resistance: 0.5835
Supporting reasons: Identified as a pullback resistance, indicating a potential area that could halt any further upward movement.
US30 (DJIA):
Potential Direction: Bullish
Overall momentum of the chart: Bullish
The price has already bounced off the pivot and could continue to make a bullish move toward the 1st resistance.
Pivot: 46,123.56
Supporting reasons: Identified as an overlap support, indicating a potential area where buying interest could pick up.
1st support: 45,765.51
Supporting reasons: Identified as an overlap support, suggesting a potential area where the price could stabilize once again.
1st resistance: 46,704.98
Supporting reasons: Identified as a swing high resistance that aligns with the 161.8% Fibonacci extension, indicating a potential area that could halt any further upward movement.
DE40 (DAX):
Potential Direction: Bullish
Overall momentum of the chart: Bullish
The price could make a short-term pullback toward the pivot before rising again toward the 1st resistance
Pivot: 23,932.45
Supporting reasons: Identified as a pullback support, indicating a potential area where buying interest could pick up
1st support: 23,708.88
Supporting reasons: Identified as an overlap support, indicating a key level where the price could stabilize once more.
1st resistance: 24,233.20
Supporting reasons: Identified as an overlap resistance that aligns with the 78.6% Fibonacci retracement, indicating a potential area that could halt any further upward movement.
US500 (S&P 500):
Potential Direction: Bullish
Overall momentum of the chart: Bullish
The price has already bounced off the pivot and could continue to make a bullish rise toward the 1st resistance
Pivot: 6,630.87
Supporting reasons: Identified as a pullback support, where renewed buying pressure could emerge to push the price higher.
1st support: 6,557.19
Supporting reasons: Identified as an overlap support, indicating a potential level where the price could stabilize once again.
1st resistance: 6,745.21
Supporting reasons: Identified as a resistance that is supported by the 100% Fibonacci projection, indicating a potential area that could halt any further upward movement.
BTC/USD (Bitcoin):
Potential Direction: Bullish
Overall momentum of the chart: Bullish
The price could make a short-term pullback toward the pivot before rising again toward the 1st resistance
Pivot: 114,556.40
Supporting reasons: Identified as a pullback support, where renewed buying pressure could emerge to push the price higher.
1st support: 111,937.85
Supporting reasons: Identified as a pullback support, indicating a potential level where the price could stabilize once more.
1st resistance: 118,912.50
Supporting reasons: Identified as a pullback resistance that aligns with the 100% Fibonacci projection, indicating a potential area that could halt any further upward movement.
ETH/USD (Ethereum):
Potential Direction: Bullish
Overall momentum of the chart: Bullish
The price could make a short-term pullback toward the pivot before rising again toward the 1st resistance
Pivot: 4,225.10
Supporting reasons: Identified as a pullback support, where renewed buying pressure could emerge to push the price higher.
1st support: 4,069.94
Supporting reasons: Identified as a pullback support, indicating a potential level where the price could stabilize once more.
1st resistance: 4,426.96
Supporting reasons: Identified as a pullback resistance that aligns closely with the 127.2% Fibonacci extension, indicating a potential area that could halt any further upward movement.
WTI/USD (Oil):
Potential Direction: Bearish
Overall momentum of the chart: Bullish
The price could see a short-term pullback toward the pivot before continuing its bearish move down toward the 1st support.
Pivot: 62.15
Supporting reasons: Identified as a pullback resistance, where selling pressures could intensify and potentially cap any upward retracement.
1st support: 60.63
Supporting reasons: Identified as a support that is supported by the 127.2% Fibonacci extension, indicating a key level where the price could stabilize once more.
1st resistance: 63.15
Supporting reasons: Identified as a pullback resistance, indicating a potential area that could halt any further upward movement.
XAU/USD (GOLD):
Potential Direction: Bullish
Overall momentum of the chart: Bullish
The price could fall toward the pivot and make a bullish rise toward the 1st resistance.
Pivot: 3,790.67
Supporting reasons: Identified as a pullback support that aligns with the 61.8% Fibonacci retracement, indicating a potential area where buying interest could pick up.
1st support: 3,724.29
Supporting reasons: Identified as a pullback support, indicating a key level where the price could stabilize once more.
1st resistance: 3,889.12
Supporting reasons: Identified as a swing resistance, indicating a potential area that could halt any further upward movement.
The accuracy, completeness and timeliness of the information contained on this site cannot be guaranteed. IC Markets does not warranty, guarantee or make any representations, or assume any liability regarding financial results based on the use of the information in the site.
News, views, opinions, recommendations and other information obtained from sources outside of www.icmarkets.com, used in this site are believed to be reliable, but we cannot guarantee their accuracy or completeness. All such information is subject to change at any time without notice. IC Markets assumes no responsibility for the content of any linked site.
The fact that such links may exist does not indicate approval or endorsement of any material contained on any linked site. IC Markets is not liable for any harm caused by the transmission, through accessing the services or information on this site, of a computer virus, or other computer code or programming device that might be used to access, delete, damage, disable, disrupt or otherwise impede in any manner, the operation of the site or of any user’s software, hardware, data or property.
The post Thursday 2nd October 2025: Technical Outlook and Review first appeared on IC Markets | Official Blog.
IC Markets Asia Fundamental Forecast | 02 October 2025
421936 October 2, 2025 14:39 ICMarkets Market News
IC Markets Asia Fundamental Forecast | 02 October 2025
What happened in the U.S. session?
Overnight during the U.S. session, the major financial headlines centered on the government shutdown, key macroeconomic data releases, and how these triggered sharp movements in specific markets. Here’s a direct summary and breakdown of the developments and their impacts. These developments show that, for now, equity traders are largely shrugging off shutdown risks, rotating into pharma and healthcare stories, while the broader market hedges with gold and Treasuries. Forthcoming days may see renewed volatility if the shutdown persists or labor data surprises materially.
What does it mean for the Asia Session?
Asian traders should remain alert to volatility from macro data releases, the AI-led tech rally, gold price action, and Fed policy expectations amid persistent US political uncertainties and regional market holidays. Asian traders should focus on tech-led equity rallies, gold near record levels, and rising expectations of Fed rate cuts driven by weak US jobs data and government shutdown concerns on Thursday, October 2, 2025. Key Asian economic releases, heightened AI optimism, and commodity price trends also warrant attention.
The Dollar Index (DXY)
Key news events today
Unemployment Claims (Tentative)
What can we expect from DXY today?
The U.S. dollar stabilized after recent declines but continues to face notable pressure from political and economic developments, including a government shutdown and expectations for upcoming Federal Reserve interest rate cuts. The dollar remains under pressure from political risks and monetary policy shifts, and near-term volatility is expected as markets respond to evolving data and events. The U.S. Dollar Index (DXY) hovered around 97.7 after four consecutive losing sessions, slightly down 0.08% for the day and 0.46% over the past month.
Central Bank Notes:
- The Federal Open Market Committee (FOMC) voted, by majority, to lower the federal funds rate target range by 25 basis points to 4.00%–4.25% at its September 16–17, 2025, meeting, marking the first policy rate adjustment since December 2024 after five consecutive holds.
- The Committee maintained its long-term objective of achieving maximum employment and 2% inflation, acknowledging recent labor market softening and continued tariff-driven price pressures.
- Policymakers expressed elevated concern about downside risks to growth, citing a stalling labor market, modest job creation, and an unemployment rate drifting up toward 4.4%. At the same time, inflation remains above target, with CPI at 3.2% and core inflation at 3.1% as of August 2025; higher energy and food prices, largely attributable to tariffs, continue to weigh on headline measures.
- Although economic activity expanded at a moderate pace in the third quarter, the growth outlook has weakened. Q3 GDP growth is estimated near 1.0% (annualized), with full-year 2025 GDP growth guidance revised to 1.2%, reflecting slowing household consumption and tighter financial conditions.
- In the updated Summary of Economic Projections, the unemployment rate is projected to average 4.5% for the year, with headline PCE inflation revised up slightly to 3.1% for 2025. The Committee anticipates core PCE inflation to remain stubborn, requiring sustained vigilance and a flexible approach to risk management.
- The Committee reiterated its data-dependent approach and openness to further adjustments should employment or inflation deviate meaningfully from current forecasts. Several members dissented, either advocating a larger 50-basis-point cut or preferring no adjustment at this meeting, revealing heightened divergence within the Committee.
- Balance sheet reduction continues at a measured pace. The monthly Treasury redemption cap remains at $5B and the agency MBS cap at $35B, as the Board aims to support orderly market conditions in the face of evolving global and domestic uncertainty.
- The next meeting is scheduled for 28 to 29 October 2025.
Next 24 Hours Bias
Weak Bearish
Gold (XAU)
Key news events today
Unemployment Claims (Tentative)
What can we expect from Gold today?
Gold surged to fresh record highs on Thursday, October 2, 2025, driven by a weaker US dollar, expectations of Federal Reserve interest rate cuts, and US government shutdown concerns. As of today, gold is trading near $3,860–$3,872 per troy ounce, following an overnight peak of nearly $3,895. Prices remain highly elevated, up over 45% year-on-year, with strong central bank and investor demand for safe-haven assets fueling the bullish momentum.
Next 24 Hours Bias
Medium Bullish
The Australian Dollar (AUD)
Key news events today
No major news event
What can we expect from AUD today?
The Australian Dollar softened slightly to 0.6607 against the US dollar today, as investors digested mixed economic data and the RBA’s hawkish pause on rates. Gold export weakness weighed on trade numbers, while the currency’s direction remains tied to global risk sentiment and imminent US data releases. The outlook for the AUD remains cautiously tilted upward so long as Australian data stabilizes and global conditions do not worsen.
Central Bank Notes:
- The RBA held its cash rate steady at 3.60% at its October meeting on 29–30 September 2025, marking a second consecutive pause after August’s 25 basis point cut. The move affirms the Bank’s data-dependent approach as inflation continues to trend within the target range.
- Inflation indicators remained stable through September, with headline CPI likely anchoring near 2.2%—comfortably within the 2–3% band. Insurance and housing costs remain sticky but are increasingly offset by moderation in discretionary goods.
- Trimmed mean inflation is estimated at around 2.8%, signaling underlying pressures remain contained. The Board continues to flag food and energy price volatility as short-term risks, though the broader disinflation narrative holds.
- Global conditions remain a source of uncertainty. U.S. policy expectations and uneven growth in China continue to weigh on commodities, even as trade disruptions have eased marginally since mid-year.
- Domestic growth shows resilience in the housing and services sectors, though manufacturing remains subdued. Household incomes have stabilized, but consumption remains only modest, capped by high borrowing costs.
- The labor market maintains relative tightness, though job growth has slowed notably since the first half of the year. Underutilization has ticked higher, but overall employment conditions remain supportive.
- Wage growth is plateauing, reflecting softer labour demand. Weak productivity continues to keep unit labour costs elevated, underscoring a medium-term concern highlighted repeatedly by the RBA.
- Household consumption prospects remain fragile. The combination of high rents and weak discretionary appetite suggests risks of a consumer-led slowdown in Q4 if confidence fails to rebound.
- The Board reiterated that subdued household spending poses risks to business sentiment and may dampen investment and job creation in the coming quarters.
- Monetary policy remains mildly restrictive. The RBA balanced confidence in inflation progress with caution around global and domestic demand risks, keeping further adjustments conditional on incoming data.
- The Bank reaffirmed its dual commitment to price stability and full employment, noting its readiness to act should conditions shift markedly.
- The next meeting is on 5 to 6 November 2025.
Next 24 Hours Bias
Weak Bullish
The Kiwi Dollar (NZD)
Key news events today
No major news event
What can we expect from NZD today?
The NZD is strengthening modestly on October 2 due to US dollar weakness, but the overall trend remains cautious. Markets expect the Reserve Bank of New Zealand to cut rates next week, amidst weak domestic growth and persistent downside risks, limiting any sustained rally for the kiwi.The New Zealand Dollar (NZD) saw moderate gains on trading around 0.5825 against the US dollar as risk appetite improved due to a struggling greenback amid US political gridlock and weak jobs data. Despite this recovery, the NZD remains under pressure from expectations of an upcoming Reserve Bank of New Zealand rate cut.
Central Bank Notes:
- The Monetary Policy Committee (MPC) agreed to cut the Official Cash Rate (OCR) by 25 basis points to 3.00% on 20 August 2025, marking a three-year low and continuing the easing cycle after July’s pause. The vote was split 4-2, with two members advocating a 50-basis-point cut, highlighting diverging views within the Committee.
- Policymakers indicated that significant uncertainty and a stalling economic recovery prompted this move, leaving the door open for further rate cuts later in the year, with a possible trough around 2.5% by December.
- Annual consumer price index inflation rose to 2.7% in the June quarter and is expected to reach 3% for the September quarter—at the upper end of the MPC’s 1 to 3% target band—but medium-term expectations remain anchored near the 2% midpoint.
- Despite the near-term uptick, headline inflation is projected to return toward 2% by mid-2026, as tradables inflation pressures ease and significant spare capacity continues to dampen domestic price momentum.
- Domestic financial conditions are broadly aligning with MPC expectations, as lower wholesale rates have translated into reduced borrowing costs for households. However, declining consumption and investment demand, higher unemployment, and subdued wage growth reflect ongoing economic slack.
- GDP growth stalled in the second quarter of 2025, contrasting with earlier projections. High-frequency indicators point to continued weakness driven by rising prices for essentials, weakening household savings, and constrained business lending.
- The MPC cautioned that ongoing global tariff uncertainties and policy shifts, especially recent changes in US trade regulations, could amplify market volatility and present both upside and downside risks to New Zealand’s recovery.
- Subject to medium-term inflation pressures continuing to ease as projected, the MPC signaled scope for further OCR cuts, possibly down to 2.5% by year-end, consistent with the latest Monetary Policy Statement outlook.
- The next meeting is on 22 October 2025.
Next 24 Hours Bias
Weak Bearish
The Japanese Yen (JPY)
Key news events today
No major news event
What can we expect from JPY today?
The Japanese Yen is trading strongly today near recent highs, underpinned by expectations of BoJ rate normalization and global risk sentiment, while the US Dollar is handicapped by dovish Fed bets and political uncertainty. All eyes remain on the BoJ’s upcoming moves and the outcome of Japan’s political leadership election for further JPY direction.
Central Bank Notes:
- The Policy Board of the Bank of Japan decided on 17 September, by a unanimous vote, to set the following guidelines for money market operations for the inter-meeting period:
- The Bank will encourage the uncollateralized overnight call rate to remain at around 0.5%.
- The BOJ will continue its gradual reduction of monthly outright purchases of Japanese Government Bonds (JGBs). The scheduled amount of long-term government bond purchases remains unchanged from the prior decision, with a quarterly reduction pace of about ¥400 billion through March 2026 and about ¥200 billion per quarter from April to June 2026 onward, aiming for a purchase level near ¥2 trillion in January to March 2027.
- Japan’s economy continues to show a moderate recovery, with household consumption supported by rising incomes, although corporate activity has softened somewhat. Overseas economies remain on a moderate growth path, with the impact of global trade policies still weighing on Japan’s export and industrial production outlook.
- On the price front, the year-on-year rate of change in consumer prices (excluding fresh food) remains in the mid-3% range. Inflationary pressures remain broad-based, with persistent cost-push factors in food and energy, alongside solid wage pass-through. However, input cost pressures from past import surges are showing early signs of easing.
- Short-term inflation momentum may moderate as cost-push effects diminish, though rent increases and service-related price gains tied to labor shortages are likely to provide support. Inflation expectations among firms and households continue a gradual upward drift.
- Looking ahead, the economy is projected to grow at a slower-than-trend pace in the near term due to external demand softness and cautious corporate investment plans. However, accommodative financial conditions and steady increases in real labor income are expected to underpin domestic demand.
- In the medium term, as overseas economies recover and global trade stabilizes, Japan’s growth potential is likely to improve. With persistent labor market tightness and rising medium- to long-term inflation expectations, core inflation is projected to remain on a gradual upward trend, converging toward the 2% price stability target in the latter half of the projection horizon.
- The next meeting is scheduled for 30 to 31 October 2025.
Next 24 Hours Bias
Weak Bullish
Oil
Key news events today
No major news event
What can we expect from Oil today?
Oil prices have rebounded slightly from their lowest levels in four months but remain under pressure due to expectations of rising OPEC+ supply, increasing U.S. inventories, and weak demand signals from Asia and the U.S. The market is focused on the upcoming OPEC+ meeting, with potential production decisions poised to influence price direction in the near term.
Next 24 Hours Bias
Medium Bearish
The post IC Markets Asia Fundamental Forecast | 02 October 2025 first appeared on IC Markets | Official Blog.
Thursday 2nd October 2025: Asian Markets Rise on Fed Rate Cut Hopes Despite U.S. Shutdown
421935 October 2, 2025 14:14 ICMarkets Market News
Global Markets:
- Asian Stock Markets : Nikkei up 0.74%, Shanghai Composite up 0.52%, Hang Seng up 1.47% ASX up 1.08%
- Commodities : Gold at $3,887.90 (-0.18%), Silver at $47.280 (-0.7%), Brent Oil at $65.59 (0.4%), WTI Oil at $62.09 (0.4%)
- Rates : US 10-year yield at 4.106, UK 10-year yield at 4.6980, Germany 10-year yield at 2.7134
News & Data:
- (USD) ADP Non-Farm Employment Change -32K to 52K expected
Markets Update:
Asian markets are trading mostly higher on Thursday, mirroring overnight gains on Wall Street, as optimism grew over the outlook for U.S. interest rates after a report showed an unexpected drop in private sector employment for September. Projections of further rate cuts this year and into next year strengthened market sentiment. Asian stocks had ended mixed on Wednesday.
According to CME Group’s FedWatch Tool, traders now see a 99% chance of a 25-basis-point cut and a slim 1% probability of a 50-basis-point cut at the Federal Reserve’s late-October meeting. Meanwhile, the U.S. government entered an official shutdown after lawmakers failed to pass a short-term spending bill, though analysts note shutdowns have historically had limited market impact. The release of Friday’s monthly U.S. jobs report may also be delayed.
In Australia, the S&P/ASX 200 jumped over 1% to 8,941, led by strong gains in miners, energy, technology, and gold stocks. Rio Tinto, BHP, and Mineral Resources rose between 2% and 3%, while Block and Appen gained nearly 3% and 4% respectively.
Japan’s Nikkei 225 advanced 0.28% to 44,676, snapping a four-session losing streak, lifted by technology stocks including Tokyo Electron and Advantest, though automakers and exporters lagged. South Korea rose 3%, while Hong Kong, Singapore, and Taiwan gained more than 1%. China remained closed for the National Day holiday.
Upcoming Events:
- Tentative GMT – USD Unemployment Claims
The post Thursday 2nd October 2025: Asian Markets Rise on Fed Rate Cut Hopes Despite U.S. Shutdown first appeared on IC Markets | Official Blog.
IC Markets Europe Fundamental Forecast | 02 October 2025
421934 October 2, 2025 14:14 ICMarkets Market News
IC Markets Europe Fundamental Forecast | 02 October 2025
What happened in the Asia session?
The Asia session was dominated by technology sector gains on major AI-related deals, stable gold performance amid US policy risk, robust regional macro releases in Singapore, and mixed sentiment in Japanese bonds and equity indices, with safe-haven flows and central bank signals impacting FX. Asian financial markets saw significant headlines and data releases, with technology stocks, select regional indices, and precious metals most impacted by the developments.
What does it mean for the Europe & US sessions?
Today’s sessions will be guided by the fallout from the U.S. government shutdown, record-setting equity markets, strength in pharmaceuticals, potential volatility from key macro data (jobs, services PMI, factory orders), gold’s highs, and a series of central bank speeches. Traders should watch sector moves in U.S. and European stocks, and pay attention to any updates on government negotiations and Fed signals for upcoming rate changes.
The Dollar Index (DXY)
Key news events today
Unemployment Claims (Tentative)
What can we expect from DXY today?
Today, the dollar is trading lower amid political uncertainty, a government shutdown, and expectations for further Fed rate cuts. Losses are most pronounced against safe-haven currencies and in key Asian sessions. Forecasts and technicals remain bearish, with analysts expecting continued weakness heading into year-end. The US dollar experienced renewed volatility today, as market participants reacted to the ongoing US government shutdown and political developments impacting Federal Reserve policy. The dollar index (DXY) settled near 97.7, registering a modest decline from the previous session amid broad market uncertainty.
Central Bank Notes:
- The Federal Open Market Committee (FOMC) voted, by majority, to lower the federal funds rate target range by 25 basis points to 4.00%–4.25% at its September 16–17, 2025, meeting, marking the first policy rate adjustment since December 2024 after five consecutive holds.
- The Committee maintained its long-term objective of achieving maximum employment and 2% inflation, acknowledging recent labor market softening and continued tariff-driven price pressures.
- Policymakers expressed elevated concern about downside risks to growth, citing a stalling labor market, modest job creation, and an unemployment rate drifting up toward 4.4%. At the same time, inflation remains above target, with CPI at 3.2% and core inflation at 3.1% as of August 2025; higher energy and food prices, largely attributable to tariffs, continue to weigh on headline measures.
- Although economic activity expanded at a moderate pace in the third quarter, the growth outlook has weakened. Q3 GDP growth is estimated near 1.0% (annualized), with full-year 2025 GDP growth guidance revised to 1.2%, reflecting slowing household consumption and tighter financial conditions.
- In the updated Summary of Economic Projections, the unemployment rate is projected to average 4.5% for the year, with headline PCE inflation revised up slightly to 3.1% for 2025. The Committee anticipates core PCE inflation to remain stubborn, requiring sustained vigilance and a flexible approach to risk management.
- The Committee reiterated its data-dependent approach and openness to further adjustments should employment or inflation deviate meaningfully from current forecasts. Several members dissented, either advocating a larger 50-basis-point cut or preferring no adjustment at this meeting, revealing heightened divergence within the Committee.
- Balance sheet reduction continues at a measured pace. The monthly Treasury redemption cap remains at $5B and the agency MBS cap at $35B, as the Board aims to support orderly market conditions in the face of evolving global and domestic uncertainty
- The next meeting is scheduled for 28 to 29 October 2025.
Next 24 Hours Bias
Weak Bearish
Gold (XAU)
Key news events today
Unemployment Claims (Tentative)
What can we expect from Gold today?
Gold prices hit new record highs today, trading near $3,872–$3,895 per ounce, driven by safe-haven demand amid the ongoing US government shutdown and market expectations of Federal Reserve interest rate cuts. Markets in Asia saw gold holding close to these historic peaks as the US dollar weakened on the back of softer labor market data, further boosting gold’s appeal as a hedge against uncertainty.
Next 24 Hours Bias
Medium Bullish
The Euro (EUR)
Key news events today
No major news event
What can we expect from EUR today?
The Euro is showing resilience amid a backdrop of US political drama and stable but slightly elevated Eurozone inflation, though traders should expect volatility as macroeconomic and geopolitical events play out over the coming days. Core inflation is steady at 2.3%, its lowest since January 2022, indicating the European Central Bank (ECB) will likely keep monetary policy steady for now.
Central Bank Notes:
- The Governing Council kept the three key ECB interest rates unchanged at its September 11, 2025, meeting. The main refinancing rate remains at 2.15%, the marginal lending facility at 2.40%, and the deposit facility at 2.00%. These levels have been maintained after the cuts earlier in 2025, reflecting the Council’s confidence that the current stance is consistent with the price stability mandate.
- Evidence that inflation is running close to the ECB’s medium-term target of 2% supported the decision to hold rates steady. Domestic price pressures are easing as wage growth continues to moderate, and financing conditions remain accommodative. Policymakers reaffirmed a data-dependent, meeting-by-meeting approach to further policy moves, with no pre-commitment to a predetermined path amid ongoing global and domestic risks.
- Eurosystem staff projections foresee headline inflation averaging 2.0% for 2025, 1.8% for 2026, and 2.0% in 2027. The 2025 and 2026 forecasts reflect a downward revision, primarily on lower energy costs and exchange rate effects, even as food inflation remains persistent. Core inflation (excluding energy and food) is expected at 2.0% for 2026 and 2027, with only minor changes since prior rounds.
- Real GDP growth in the euro area is projected at 1.1% for 2025, 1.1% for 2026, and 1.4% for 2027. A robust first quarter—partly due to firms accelerating exports ahead of anticipated tariff hikes—cushioned a weaker outlook for the remainder of 2025. While business investment continues to face uncertainty from ongoing global trade disputes, especially with the US, government investment and infrastructure spending are expected to provide some support to the outlook..
- Rising real incomes and continued strength in the labor market boost household spending. Despite some fading tailwind from previous rate cuts, financing conditions remain broadly favorable and are expected to underpin the resilience of private consumption and investment against outside shocks. Moderating wage growth and profit margin adjustments are helping to absorb residual cost pressures.
- Rising real incomes and continued strength in the labor market boost household spending. Despite some fading tailwind from previous rate cuts, financing conditions remain broadly favorable and are expected to underpin the resilience of private consumption and investment against outside shocks. Moderating wage growth and profit margin adjustments are helping to absorb residual cost pressures.
- All future interest rate decisions will continue to be guided by the integrated assessment of economic and financial data, the inflation outlook, and underlying inflation dynamics, and the effectiveness of monetary policy transmission—without any pre-commitment to a specific future rate path.
- The ECB’s Asset Purchase Programme (APP) and Pandemic Emergency Purchase Programme (PEPP) portfolios are declining predictably, as maturities have ceased to be reinvested. Balance-sheet normalization continues in line with the ECB’s previously communicated schedule.
- The next meeting is on 29 to 30 October 2025
Next 24 Hours Bias
Weak Bullish
The Swiss Franc (CHF)
Key news events today
CPI m/m (6:30 am GMT)
What can we expect from CHF today?
The Swiss Franc (CHF) strengthened slightly today, maintaining its recent momentum amid global economic uncertainty and safe-haven demand. The currency is trading near 0.7964 per USD, up nearly 0.92% over the last month, as investors continue to favor the Franc during the ongoing US government shutdown and tariff concerns. The SNB remains cautious, holding rates steady with some optimism for domestic inflation, while currency interventions and technical indicators point to continued strength for the Franc in the short term.
Central Bank Notes:
- The SNB maintained its key policy rate at 0% during its meeting on 25 September 2025, pausing a sequence of six consecutive rate cuts as inflation stabilized and the Swiss franc remained firm.
- Recent data showed a modest rebound in inflation, with Swiss consumer prices rising 0.2% year-on-year in August after staying above zero for three consecutive months; this helped alleviate fears of deflation that were mounting earlier in the year.
- The conditional inflation forecast remains broadly unchanged from June: headline inflation is expected to average 0.2% in 2025, 0.5% in 2026, and 0.7% in 2027. The risk of a negative rate move has diminished for now, but the SNB retains flexibility should inflationary pressures weaken again.
- The global economic outlook has deteriorated further, weighed down by heightened trade tensions—especially with the U.S.—and ongoing uncertainty in key Swiss export markets.
- Swiss GDP growth moderated in Q2 after a strong Q1 boosted by front-loaded U.S. exports. The SNB expects growth to slow and remain subdued, with forecasted GDP expansion between 1% and 1.5% in both 2025 and 2026.
- Labour market sentiment in the Swiss industrial sector has softened on concerns over export competitiveness and potential adjustments to production, but the overall growth outlook stays broadly unchanged
- The SNB reiterated its readiness to respond as needed if deflation risks re-emerge, emphasizing its commitment to medium-term price stability and a robust, transparent communication policy, with the introduction of more detailed monetary policy minutes beginning in October.
- The next meeting is on 11 December 2025.
Next 24 Hours Bias
Medium Bullish
The Pound (GBP)
Key news events today
No major news event
What can we expect from GBP today?
Today, the Pound held firm above 1.3480 against the Dollar, supported by robust UK economic data and a weaker USD amid US fiscal and data concerns. The outlook remains cautiously bullish for GBP, with attention now turning to upcoming US data and ongoing global risk dynamics. The British Pound (GBP) continued its recent rally today, edging modestly higher and holding firm against the US Dollar. The latest closing level for GBP/USD was 1.3484, reflecting a slight uptick and marking the fourth consecutive session of gains for the Pound.
Central Bank Notes:
- The Bank of England’s Monetary Policy Committee (MPC) voted on 18 September 2025 by a majority (expected split likely 7–2 or 6–3) to hold the Bank Rate steady at 4.00%, following the August rate cut. Most members cited persistent inflation and mixed indicators on growth and employment, while a minority favored further easing due to the cooling labor market and subdued GDP growth.
- The Committee decided to decrease the pace of quantitative tightening, planning to reduce the stock of UK government bond purchases by £67.5 billion over the next 12 months instead of the prior £100 billion pace, with the gilt balance now standing near £558 billion. This reflects increased volatility in bond markets and a shift to a more gradual approach.
- Headline inflation rose unexpectedly to 3.8% in July and is projected at 4% for September, above the Bank’s 2% target. Price pressures are driven by regulated energy costs and ongoing food price increases. While previous disinflation has been substantial, core inflation remains elevated and sticky.
- The MPC expects headline inflation to remain above target through Q4, with a resumption of the downward trend projected for early 2026 as energy and regulated price pressures abate. The Committee remains watchful for signs of persistent inflation despite previous policy tightening.
- UK GDP growth is stagnant, with business and consumer activity subdued. Recent labor market data show rising unemployment rates (now at 4.7%) and stabilizing wage growth (holding near 5%), indicating slack but continued wage price pressure. The Committee remains cautious amid lackluster demand and soft survey sentiment.
- Pay growth and employment indicators have moderated further, alongside confirmation from business surveys that pay settlements are slowing. The Committee expects wage growth to decelerate significantly through Q4 and the rest of 2025.
- Global uncertainty persists due to volatile energy prices, supply chain disruptions linked to Middle East conflicts, and renewed trade tensions. The MPC remains vigilant in tracking transmission of external cost/wage shocks to UK inflation.
- Risks to inflation are considered two-sided. While subdued domestic growth and softening labor activity suggest scope for easing, persistent inflation requires caution. The MPC anticipates a slow, gradual reduction path in rates, continuing its data-dependent approach with careful adjustment as warranted by economic developments.
- The Committee’s bias remains toward maintaining a restrictive monetary policy stance until firmer evidence emerges that inflation will return sustainably to the 2% target. All future decisions will remain highly data dependent, with a strong emphasis on evolving demand, inflation expectations, costs, and labor market conditions.
- The next meeting is on 6 November 2025.
Next 24 Hours Bias
Weak Bullish
The Canadian Dollar (CAD)
Key news events today
No major news event
What can we expect from CAD today?
The Canadian Dollar remains under pressure due to manufacturing sector contraction and sliding oil prices, even as GDP avoids sharp declines. Markets are pricing in a potential rate cut by the Bank of Canada, keeping the CAD’s outlook cautious for now. The Canadian Dollar (CAD) traded slightly softer as market sentiment responded to weak domestic manufacturing data and lower oil prices, despite some support from steady GDP growth in recent months.
Central Bank Notes:
- The Bank of Canada reduced its target for the overnight rate to 2.50% at its September 17 meeting, with the Bank Rate at 2.75% and the deposit rate at 2.25%. This marks the first rate cut since early 2025, as the Bank responded to a string of softer inflation prints and persistent economic headwinds.
- The Council cited continued U.S. tariff volatility and slow progress on trade negotiations as major contributors to ongoing uncertainty. While headline tariffs have not escalated further, the unpredictability of U.S. policy remains a significant risk for Canadian exports and business confidence.
- Uncertainty about U.S. trade policy and recurring tariff threats continued to weigh on growth prospects. The Bank flagged downside risks to the export sector, with survey data indicating ongoing hesitancy among manufacturers and exporters.
- After modest growth in Q1, Canada’s economy slipped into contraction, with GDP shrinking by 0.8% in Q2 and forecast to decrease again by 0.8% in Q3. Economic weakness has been most pronounced in manufacturing and goods-producing sectors affected by trade frictions and softer U.S. demand.
- Early estimates show that growth stabilized in September but remained well below the Bank’s 2% forecast for Q4. Manufacturing output has improved slightly—supported by a modest rebound in petroleum and mining activity—while consumer spending and retail sales were largely flat.
- Consumer spending remained subdued as households continued to limit discretionary purchases amid uncertainty and a slower job market. Housing activity stayed weak, despite earlier government efforts to boost affordability and modest gains in some real estate segments.
- Headline CPI inflation edged up to 1.9% in August, undershooting economist expectations but still showing emerging pressures from shelter and imported goods costs. Core inflation metrics were mixed, though price growth remains just below the Bank’s 2% target.
- The Governing Council reaffirmed its cautious approach, emphasizing that while further rate cuts are possible, the pace will hinge on the path of U.S. tariffs, domestic inflation dynamics, and signs of a sustainable recovery. The Bank remains vigilant against the risk of inflation falling below target in the face of economic slack.
- The next meeting is on 29 October 2025.
Next 24 Hours Bias
Weak Bearish
Oil
Key news events today
No major news event
What can we expect from Oil today?
Oil prices rebounded on Thursday, October 2, 2025, after hitting 16-week lows earlier in the week, but the market remains under pressure from rising OPEC+ supply, weak demand signals, and tighter geopolitical risks related to Russian crude. Brent crude traded near $65.70 per barrel and WTI around $62 per barrel, both slightly higher on the day but still down significantly from a month ago.
Next 24 Hours Bias
Medium Bearish
The post IC Markets Europe Fundamental Forecast | 02 October 2025 first appeared on IC Markets | Official Blog.
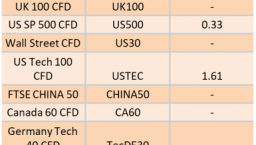
Ex-Dividend 2/10/2025
421932 October 1, 2025 17:00 ICMarkets Market News
The post Ex-Dividend 2/10/2025 first appeared on IC Markets | Official Blog.
Ex-Dividend 1/10/2025
421930 September 30, 2025 17:00 ICMarkets Market News

The post Ex-Dividend 1/10/2025 first appeared on IC Markets | Official Blog.