Articles
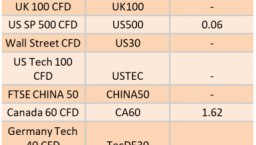
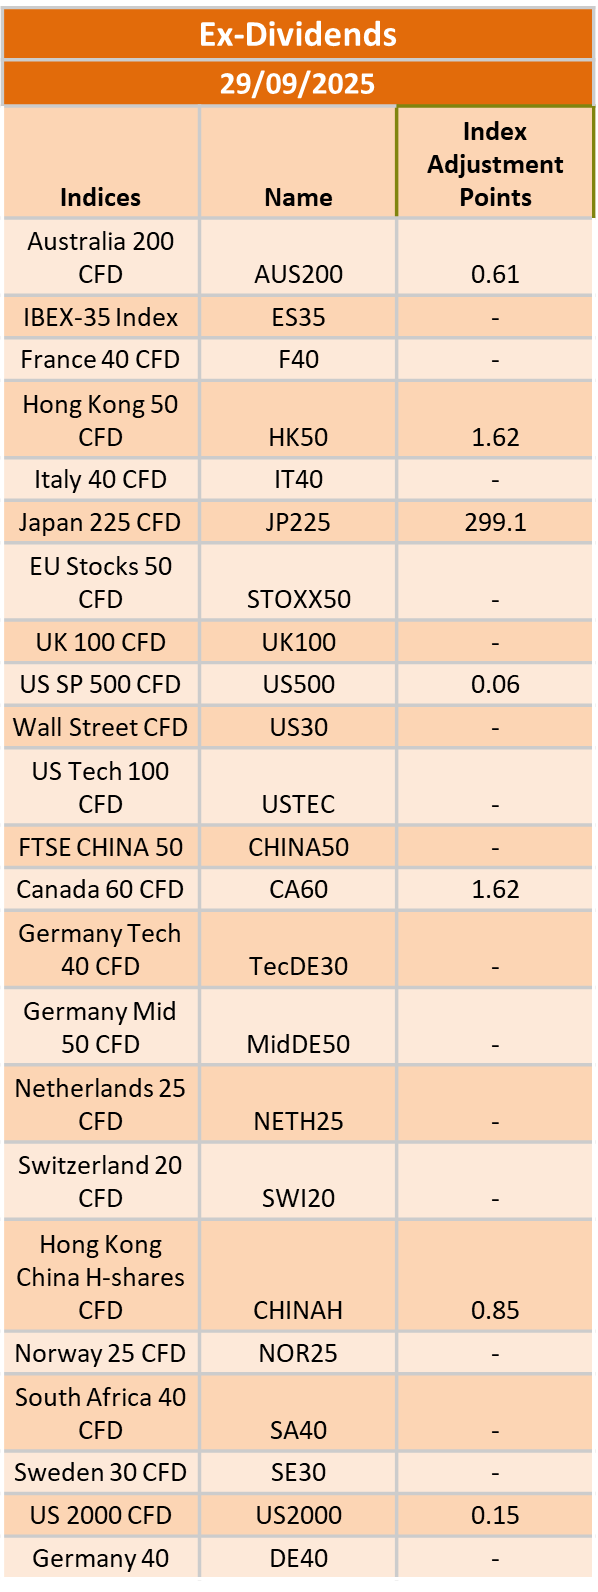
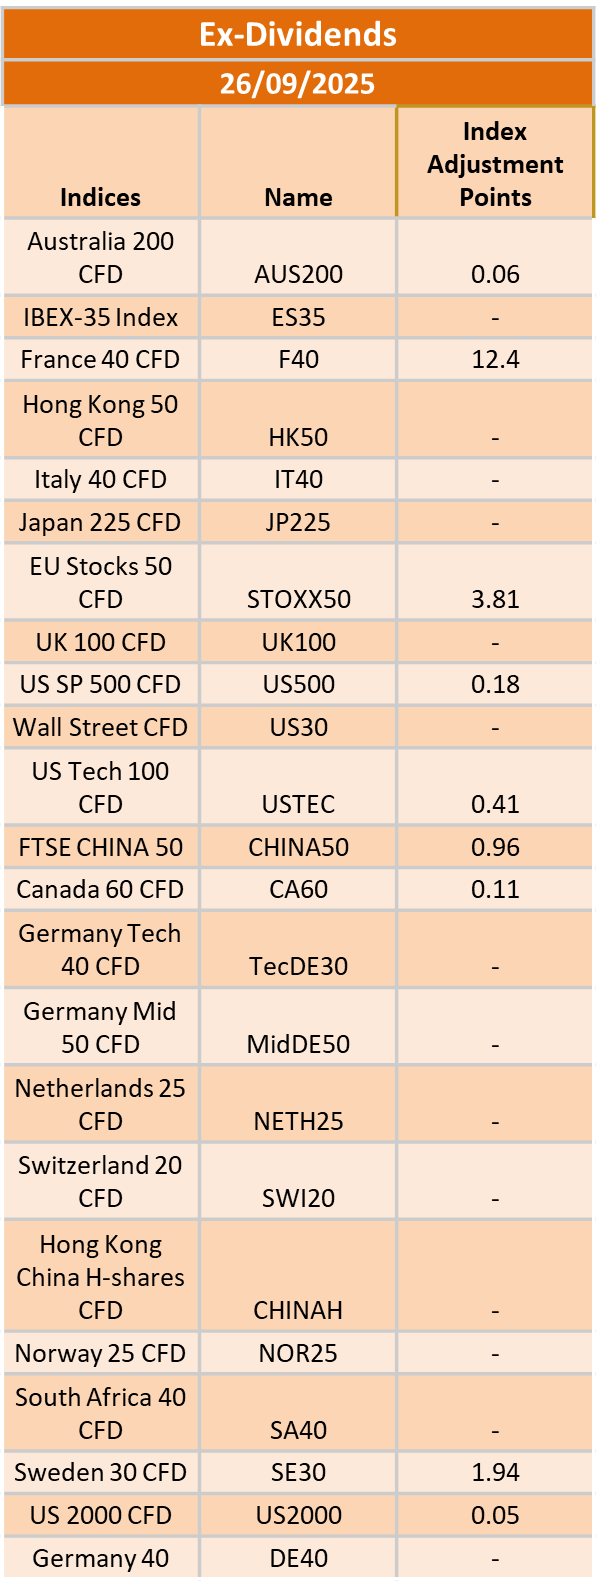
Ex-Dividend 29/9/2025
421857 September 26, 2025 17:39 ICMarkets Market News
The post Ex-Dividend 29/9/2025 first appeared on IC Markets | Official Blog.

General Market Analysis – 26/09/25
421856 September 26, 2025 16:14 ICMarkets Market News
US Stocks Fall After Stronger Data – S&P off 0.5%
The major US stock indices all fell in trading yesterday after weekly employment figures and GDP data beat expectations, pushing back on Fed interest rate cut expectations. The Dow fell 0.38% to 45,947, while the S&P and Nasdaq both lost 0.5% to close at 6,604 and 22,384, respectively. The dollar took another step up on the majors, the DXY rising 0.6% to 98.46. US Treasury yields also rallied, the 1-year up 5.1 basis points to 3.655% and the 10-year up 2.3 basis points to 4.170%. Oil prices pushed up again as geopolitical concerns continued to weigh, Brent up 0.43% to $69.61 and WTI up 0.37% to $65.23. Gold rose despite the stronger dollar, up 0.35% to $3,749.44 by the close.
Dollar Rises Again on Data and Could Fly Higher Tonight
The dollar jumped higher against most of the majors yesterday after a raft of US data came in stronger than expected. GDP data, Weekly Unemployment Claims numbers, and Durable Goods figures all exceeded expectations, reducing market pricing for Federal Reserve interest rate cuts moving forward and causing the dollar to break up from key resistance levels against the Euro, Pound, Swiss Franc, and the Yen. The market is still strongly pricing in another 25-basis point cut from the Fed in October; however, estimates dropped from 92% to 85%. These odds could drop further today with the Fed’s favorite inflation indicator due out. The Core PCE Price Index data is due early in the US day, with expectations that the month-on-month number will fall to +0.2%, while the year-on-year number could push up to 2.9%. Anything further north of either of these expectations should see the dollar resume its recent rise and push even higher into the weekend.
Inflation Data in Focus for Markets Today
The market focus will be mainly on the US session today and the key inflation update out of the States. There are, however, some other updates due across the trading day that will keep traders on their toes and could spark moves before New York opens. There will be a strong focus on Japanese markets with the Tokyo Core CPI number due early in the day. Expectations are for a 2.8% print for the year-on-year number, which could put more pressure on the Bank of Japan to raise rates. There is little on the cards in the European session, but the big data is due just after New York opens. Canadian GDP (exp. +0.1% m/m) data is scheduled, which may move the Loonie; however, the main data will be the US Core PCE Index number released at the same time (exp. +0.2% m/m). The Revised University of Michigan Consumer Sentiment and Inflation Expectations numbers are also due later in the day, but expect the inflation number to dominate flows.
The post General Market Analysis – 26/09/25 first appeared on IC Markets | Official Blog.
Friday 26th September 2025: Technical Outlook and Review
421843 September 26, 2025 16:00 ICMarkets Market News
DXY (U.S. Dollar Index):
Potential Direction: Bullish
Overall momentum of the chart: Bearish
The price could make a short-term pullback toward the pivot before rising again toward the 1st resistance
Pivot: 97.79
Supporting reasons: Identified as an overlap support, indicating a potential area where buying interest could pick up.
1st support: 97.17
Supporting reasons: Identified as an overlap support, indicating a potential area where the price could again stabilize.
1st resistance: 98.76
Supporting reasons: Identified as an overlap resistance that aligns with the 100% Fibonacci projection, acting as a ceiling for price and potentially preventing further upward movement.
EUR/USD:
Potential Direction: Bearish
Overall momentum of the chart: Bullish
The price could see a short-term pullback toward the pivot before continuing its bearish move down toward the 1st support.
Pivot: 1.1726
Supporting reasons: Identified as a pullback resistance, where selling pressures could intensify and potentially cap any upward retracement.
1st support: 1.1618
Supporting reasons: Identified as a swing low support that aligns with the 100% Fibonacci projection, providing a strong level where price could stabilize again if the market retraces deeper.
1st resistance: 1.1818
Supporting reasons: Identified as a swing high resistance, marking a key level that could temporarily halt upward momentum.
EUR/JPY:
Potential Direction: Bullish
Overall momentum of the chart: Bullish
The price could make a short-term pullback toward the pivot before rising again toward the 1st resistance
Pivot: 174.41
Supporting reasons: Identified as an overlap support, where renewed buying pressure could emerge to push the price higher.
1st Support: 173.78
Supporting reasons: Identified as a pullback support, marking a key stabilization zone if the price retraces deeper.
1st Resistance: 175.14
Supporting reasons: Identified as a resistance that is supported by the 161.8% Fibonacci extension, where upward momentum could face a potential barrier.
EUR/GBP:
Potential Direction: Bullish
Overall momentum of the chart: Bullish
The price could make a short-term pullback toward the pivot before rising again toward the 1st resistance
Pivot: 0.8713
Supporting reasons: Identified as an overlap support, indicating a potential area where buying interest could pick up.
1st support: 0.8669
Supporting reasons: Identified as an overlap support, providing a solid stabilization zone if price retraces.
1st resistance: 0.8763
Supporting reasons: Identified as a resistance that is supported by the 161.8% Fibonacci extension, making it a strong barrier where upward momentum could slow.
GBP/USD:
Potential Direction: Bearish
Overall momentum of the chart: Bullish
The price could see a short-term pullback toward the pivot before continuing its bearish move down toward the 1st support.
Pivot: 1.3460
Supporting reasons: Identified as a pullback resistance, where selling pressures could intensify and potentially cap any upward retracement.
1st support: 1.3312
Supporting reasons: Identified as an overlap support that aligns with the 78.6% Fibonacci projection, indicating a potential area where the price could stabilize once more.
1st resistance: 1.3533
Supporting reasons: Identified as an overlap resistance, indicating a potential level that could halt further upward movement.
GBP/JPY:
Potential Direction: Bearish
Overall momentum of the chart: Bullish
The price could continue to make a bearish move down toward the 1st support.
Pivot: 200.21
Supporting reasons: Identified as a pullback resistance that aligns with the 50% Fibonacci retracement, where selling pressures could intensify and potentially cap any upward retracement.
1st support: 199.00
Supporting reasons: Identified as an overlap support, indicating a potential level where the price could stabilize once more.
1st resistance: 201.14
Supporting reasons: Identified as a swing high resistance, indicating a potential level that could halt further upward movement.
USD/CHF:
Potential Direction: Bullish
Overall momentum of the chart: Bullish
The price could make a short-term pullback toward the pivot before rising again toward the 1st resistance
Pivot: 0.7972
Supporting reasons: Identified as a pullback support, where renewed buying pressure could emerge to push the price higher.
1st support: 0.7914
Supporting reasons: Identified as an overlap support, indicating a potential level where the price could stabilize once again.
1st resistance: 0.8031
Supporting reasons: Identified as a pullback resistance, indicating a potential level that could cap further upward movement.
USD/JPY:
Potential Direction: Bullish
Overall momentum of the chart: Bullish
The price could make a short-term pullback toward the pivot before rising again toward the 1st resistance
Pivot: 148.78
Supporting reasons: Identified as a pullback support, where renewed buying pressure could emerge to push the price higher.
1st support: 147.44
Supporting reasons: Identified as an overlap support, indicating a potential area where the price could again stabilize.
1st resistance: 150.75
Supporting reasons: Identified as a multi-swing high resistance, acting as a ceiling for price and potentially preventing further upward movement.
USD/CAD:
Potential Direction: Bullish
Overall momentum of the chart: Bearish
The price could make a short-term pullback toward the pivot before rising again toward the 1st resistance
Pivot: 1.3917
Supporting reasons: Identified as a pullback support, where renewed buying pressure could emerge to push the price higher.
1st support: 1.3880
Supporting reasons: Identified as a pullback support, indicating a potential area where the price could again stabilize.
1st resistance: 1.3991
Supporting reasons: Identified as a resistance that is supported by the 161.8% Fibonacci extension, acting as a ceiling for price and potentially preventing further upward movement.
AUD/USD:
Potential Direction: Bearish
Overall momentum of the chart: Bullish
The price could see a short-term pullback toward the pivot before continuing its bearish move down toward the 1st support.
Pivot: 0.6577
Supporting reasons: Identified as a pullback resistance, where selling pressures could intensify and potentially cap any upward retracement.
1st support: 0.6485
Supporting reasons: Identified as a support that aligns closely with the 78% Fibonacci retracement, providing a strong level where price could stabilize again if the market retraces deeper.
1st resistance: 0.6637
Supporting reasons: Identified as a pullback resistance, marking a key level that could temporarily halt upward momentum.
NZD/USD
Potential Direction: Bearish
Overall momentum of the chart: Bullish
The price could see a short-term pullback toward the pivot before continuing its bearish move down toward the 1st support.
Pivot: 0.5805
Supporting reasons: Identified as a pullback resistance, where selling pressures could intensify and potentially cap any upward retracement.
1st support: 0.5744
Supporting reasons: Identified as a support that is supported by 127.2% Fibonacci extension, providing a strong level where price could stabilize again if the market retraces deeper.
1st resistance: 0.5883
Supporting reasons: Identified as a pullback resistance, marking a key level that could temporarily halt upward momentum.
US30 (DJIA):
Potential Direction: Bearish
Overall momentum of the chart: Bullish
The price could see a short-term pullback toward the pivot before continuing its bearish move down toward the 1st support.
Pivot: 46,123.56
Supporting reasons: Identified as a pullback resistance, where selling pressures could intensify and potentially cap any upward retracement.
1st support: 45,756.51
Supporting reasons: Identified as an overlap support, providing a solid stabilization zone if price retraces.
1st resistance: 46,704.98
Supporting reasons: Identified as a swing high resistance, making it a strong barrier where upward momentum could slow.
DE40 (DAX):
Potential Direction: Bullish
Overall momentum of the chart: Bullish
The price could continue to make a bullish rise toward the 1st resistance
Pivot: 23,479.66
Supporting reasons: Identified as an overlap support, where renewed buying pressure could emerge to push the price higher.
1st support: 23,317.44
Supporting reasons: Identified as a multi-swing low support, indicating a key level where the price could stabilize once more.
1st resistance: 23,873.56
Supporting reasons: Identified as an overlap resistance, indicating a potential area that could halt any further upward movement.
US500 (S&P 500):
Potential Direction: Bearish
Overall momentum of the chart: Bullish
The price could see a short-term pullback toward the pivot before continuing its bearish move down toward the 1st support.
Pivot: 6,630.39
Supporting reasons: Identified as a pullback resistance, where selling pressures could intensify and potentially cap any upward retracement.
1st support: 6,545.23
Supporting reasons: Identified as an overlap support, providing a strong level where price could stabilize again if the market retraces deeper.
1st resistance: 6,696.24
Supporting reasons: Identified as a swing high resistance, marking a key level that could temporarily halt upward momentum.
BTC/USD (Bitcoin):
Potential Direction: Bearish
Overall momentum of the chart: Bullish
The price could see a short-term pullback toward the pivot before continuing its bearish move down toward the 1st support.
Pivot: 111,007.67
Supporting reasons: Identified as a pullback resistance, where selling pressures could intensify and potentially cap any upward retracement.
1st support: 107,363.95
Supporting reasons: Identified as a swing low support that aligns with the 100% Fibonacci projection, providing a strong level where price could stabilize again if the market retraces deeper.
1st resistance: 114,369.30
Supporting reasons: Identified as a pullbsck resistance, marking a key level that could temporarily halt upward momentum.
ETH/USD (Ethereum):
Potential Direction: Bearish
Overall momentum of the chart: Bullish
The price could see a short-term pullback toward the pivot before continuing its bearish move down toward the 1st support.
Pivot: 4,108.33
Supporting reasons: Identified as a pullback resistance, where selling pressures could intensify and potentially cap any upward retracement.
1st support: 3,734.82
Supporting reasons: Identified as a pullback support, providing a solid stabilization zone if the price retraces.
1st resistance: 4,411.91
Supporting reasons: Identified as a pullback resistance, making it a strong barrier where upward momentum could slow.
WTI/USD (Oil):
Potential Direction: Bullish
Overall momentum of the chart: Bullish
The price could make a short-term pullback toward the pivot before rising again toward the 1st resistance
Pivot: 64.72
Supporting reasons: Identified as a pullback support, where renewed buying pressure could emerge to push the price higher.
1st support: 62.09
Supporting reasons: Identified as a multi swing low support, providing a strong level where price could stabilize again if the market retraces deeper.
1st resistance: 66.82
Supporting reasons: Identified as a swing high resistance that aligns closely with the 161.8% Fibonacci extension, marking a key level that could temporarily halt upward momentum.
XAU/USD (GOLD):
Potential Direction: Bullish
Overall momentum of the chart: Bullish
The price could make a short-term pullback toward the pivot before rising again toward the 1st resistance
Pivot: 3,699.30
Supporting reasons: Identified as a pullback support that aligns closely with the 50% Fibonacci retracement, where renewed buying pressure could emerge to push the price higher.
1st support: 3,654.40
Supporting reasons: Identified as a pullback support, providing a strong level where price could stabilize again if the market retraces deeper.
1st resistance: 3,784.06
Supporting reasons: Identified as a multi-swing high resistance, marking a key level that could temporarily halt upward momentum.
The accuracy, completeness and timeliness of the information contained on this site cannot be guaranteed. IC Markets does not warranty, guarantee or make any representations, or assume any liability regarding financial results based on the use of the information in the site.
News, views, opinions, recommendations and other information obtained from sources outside of www.icmarkets.com, used in this site are believed to be reliable, but we cannot guarantee their accuracy or completeness. All such information is subject to change at any time without notice. IC Markets assumes no responsibility for the content of any linked site.
The fact that such links may exist does not indicate approval or endorsement of any material contained on any linked site. IC Markets is not liable for any harm caused by the transmission, through accessing the services or information on this site, of a computer virus, or other computer code or programming device that might be used to access, delete, damage, disable, disrupt or otherwise impede in any manner, the operation of the site or of any user’s software, hardware, data or property.
The post Friday 26th September 2025: Technical Outlook and Review first appeared on IC Markets | Official Blog.
IC Markets Asia Fundamental Forecast | 26 September 2025
421842 September 26, 2025 16:00 ICMarkets Market News
IC Markets Asia Fundamental Forecast | 26 September 2025
What happened in the U.S. session?
U.S. macro momentum surprised to the upside, notably in GDP and consumer resilience, shaking financial markets out of complacency. The most substantial moves were in FX (USD strength), bonds (yield rise), and equities (mild losses); commodities and cryptocurrencies exhibited volatility but generally trended lower as risk appetite ebbed. Markets are now wrestling with whether current strength will delay Fed rate cuts further, supporting the dollar and yields while weighing on risk assets.
What does it mean for the Asia Session?
For Asian traders on Friday, 26th September 2025, the session will be shaped by key macroeconomic releases, market sentiment driven by the Federal Reserve’s policy stance, currency volatility (particularly in the yen), and ongoing commodity price swings. Major economic data to watch includes Canadian GDP, the US Core PCE Price Index, and the Revised University of Michigan Consumer Sentiment—these releases could have notable ripple effects on forex and equity markets globally.
The Dollar Index (DXY)
Key news events today
Core PCE price index m/m (12:30 pm GMT)
Revised UoM consumer sentiment (2:00 pm GMT)
What can we expect from DXY today?
The US dollar weakened in choppy trading, as the positive impact from recent strong US economic data faded and markets awaited further direction from Federal Reserve officials and new inflation data. After a midweek boost driven by solid US durable goods orders, lower jobless claims, and a sharp upward revision in Q2 GDP, the dollar lost momentum ahead of the release of the Core PCE Price Index and the University of Michigan Consumer Sentiment report.
Central Bank Notes:
- The Federal Open Market Committee (FOMC) voted, by majority, to lower the federal funds rate target range by 25 basis points to 4.00%–4.25% at its September 16–17, 2025, meeting, marking the first policy rate adjustment since December 2024 after five consecutive holds.
- The Committee maintained its long-term objective of achieving maximum employment and 2% inflation, acknowledging recent labor market softening and continued tariff-driven price pressures.
- Policymakers expressed elevated concern about downside risks to growth, citing a stalling labor market, modest job creation, and an unemployment rate drifting up toward 4.4%. At the same time, inflation remains above target, with CPI at 3.2% and core inflation at 3.1% as of August 2025; higher energy and food prices, largely attributable to tariffs, continue to weigh on headline measures.
- Although economic activity expanded at a moderate pace in the third quarter, the growth outlook has weakened. Q3 GDP growth is estimated near 1.0% (annualized), with full-year 2025 GDP growth guidance revised to 1.2%, reflecting slowing household consumption and tighter financial conditions.
- In the updated Summary of Economic Projections, the unemployment rate is projected to average 4.5% for the year, with headline PCE inflation revised up slightly to 3.1% for 2025. The Committee anticipates core PCE inflation to remain stubborn, requiring sustained vigilance and a flexible approach to risk management.
- The Committee reiterated its data-dependent approach and openness to further adjustments should employment or inflation deviate meaningfully from current forecasts. Several members dissented, either advocating a larger 50-basis-point cut or preferring no adjustment at this meeting, revealing heightened divergence within the Committee.
- Balance sheet reduction continues at a measured pace. The monthly Treasury redemption cap remains at $5B and the agency MBS cap at $35B, as the Board aims to support orderly market conditions in the face of evolving global and domestic uncertainty.
- The next meeting is scheduled for 28 to 29 October 2025.
Next 24 Hours Bias
Medium Bearish
Gold (XAU)
Key news events today
Core PCE price index m/m (12:30 pm GMT)
Revised UoM consumer sentiment (2:00 pm GMT)
What can we expect from Gold today?
Gold prices today remain near their historic highs, trading in the $3,700–$3,790 range per ounce, as markets digest recent profit-taking and look ahead to further interest rate developments from the Federal Reserve. The overall bias for gold remains bullish due to ongoing rate cut expectations, geopolitical tensions, and robust ETF inflows, although periods of volatility and corrective pullbacks are being observed
Next 24 Hours Bias
Strong Bullish
The Australian Dollar (AUD)
Key news events today
No major news event
What can we expect from AUD today?
The Australian Dollar has rallied strongly following better-than-expected inflation data, with technicals supporting further upside. The AUD/USD pair is positioned for continued gains, contingent on supportive global risk appetite and stability in domestic economic policy. Medium-term outlooks from banks forecast a gradual strengthening for the AUD into late 2025, though downside risks remain from global growth and policy changes. These developments position the Australian Dollar as one of the best-performing major currencies today, supported by robust inflation data and positive technical signals.
Central Bank Notes:
- The RBA held its cash rate steady at 3.60% at its September meeting on 8–9 September 2025, following a 25 basis point reduction at the August meeting. This maintains a cautious yet supportive stance, with the decision largely anticipated given recent evidence of inflation settling within the target band.
- Inflation readings continue to ease, with headline CPI most likely tracking near 2.1–2.3%—comfortably within the 2–3% target range. September quarter figures are pending, but leading indicators show further moderation in non-housing components, even as insurance and housing-related costs remain sticky.
- The RBA’s preferred trimmed mean inflation is estimated at around 2.7%–2.9%, further reflecting progress toward the midpoint of the target range. Energy and food volatility still create some short-term uncertainty, but underlying inflation is broadly on track.
- Global conditions are a key source of risk. While U.S.–EU trade tensions have stabilized slightly, volatility in equities and commodities persists, with uncertainty feeding through to Australia’s trade and export outlook.
- Domestic demand shows tentative improvement. Real household incomes and a stabilizing housing sector have underpinned modest consumption growth, though business investment remains uneven—service sectors outperforming manufacturing and construction.
- Labor market tightness persists, but momentum continues to slow from earlier in the year. Employment gains remain, but job vacancies and hiring intentions have softened, with underutilization rising marginally for the second straight month.
- Wage growth has slowed in line with easing labour pressures, but unit labour costs remain elevated due to weak productivity. The RBA continues to flag subdued productivity as a medium-term cost risk.
- Forward indicators suggest household consumption may be softer than previously forecast. Elevated rents and high borrowing costs are dampening discretionary spending, despite modest income recovery.
- The Board continues to highlight the risk that household spending could underperform, potentially weighing on business investment and job creation if confidence remains subdued.
- Monetary policy remains mildly restrictive, in line with greater inflation control and ongoing economic rebalancing. The decision to hold rates recognizes both progress and ongoing uncertainties, with future moves explicitly tied to incoming data.
- The Reserve Bank reinforced its goals of price stability and full employment, stating readiness to adjust policy if economic or inflation outcomes diverge from baseline projections.
- The next meeting is on 29 to 30 September 2025.
Next 24 Hours Bias
Medium Bullish
The Kiwi Dollar (NZD)
Key news events today
No major news event
What can we expect from NZD today?
The New Zealand Dollar (NZD) traded weaker today, Friday, September 26, 2025, amid global forex market shifts and limited domestic data releases. The NZD/USD pair slipped to a five-month low, reflecting concerns around global risk sentiment and the resilience of the US dollar, which continues to attract flows as a safe haven.
Central Bank Notes:
- The Monetary Policy Committee (MPC) agreed to cut the Official Cash Rate (OCR) by 25 basis points to 3.00% on 20 August 2025, marking a three-year low and continuing the easing cycle after July’s pause. The vote was split 4-2, with two members advocating a 50-basis-point cut, highlighting diverging views within the Committee.
- Policymakers indicated that significant uncertainty and a stalling economic recovery prompted this move, leaving the door open for further rate cuts later in the year, with a possible trough around 2.5% by December.
- Annual consumer price index inflation rose to 2.7% in the June quarter and is expected to reach 3% for the September quarter—at the upper end of the MPC’s 1 to 3% target band—but medium-term expectations remain anchored near the 2% midpoint.
- Despite the near-term uptick, headline inflation is projected to return toward 2% by mid-2026, as tradables inflation pressures ease and significant spare capacity continues to dampen domestic price momentum.
- Domestic financial conditions are broadly aligning with MPC expectations, as lower wholesale rates have translated into reduced borrowing costs for households. However, declining consumption and investment demand, higher unemployment, and subdued wage growth reflect ongoing economic slack.
- GDP growth stalled in the second quarter of 2025, contrasting with earlier projections. High-frequency indicators point to continued weakness driven by rising prices for essentials, weakening household savings, and constrained business lending.
- The MPC cautioned that ongoing global tariff uncertainties and policy shifts, especially recent changes in US trade regulations, could amplify market volatility and present both upside and downside risks to New Zealand’s recovery.
- Subject to medium-term inflation pressures continuing to ease as projected, the MPC signaled scope for further OCR cuts, possibly down to 2.5% by year-end, consistent with the latest Monetary Policy Statement outlook.
- The next meeting is on 22 October 2025.
Next 24 Hours Bias
Medium Bullish
The Japanese Yen (JPY)
Key news events today
No major news event
What can we expect from JPY today?
On Friday, the yen traded volatily but slightly firmer amid BOJ signals toward gradual tightening and US rate cut uncertainty, with key levels for USD/JPY at 147 (support) and 150 (resistance). Traders remain cautious ahead of major inflation data from both the US and Japan, and the risk of Japanese intervention if yen weakness extends remains high.
Central Bank Notes:
- The Policy Board of the Bank of Japan decided on 17 September, by a unanimous vote, to set the following guidelines for money market operations for the inter-meeting period:
- The Bank will encourage the uncollateralized overnight call rate to remain at around 0.5%.
- The BOJ will continue its gradual reduction of monthly outright purchases of Japanese Government Bonds (JGBs). The scheduled amount of long-term government bond purchases remains unchanged from the prior decision, with a quarterly reduction pace of about ¥400 billion through March 2026 and about ¥200 billion per quarter from April to June 2026 onward, aiming for a purchase level near ¥2 trillion in January to March 2027.
- Japan’s economy continues to show a moderate recovery, with household consumption supported by rising incomes, although corporate activity has softened somewhat. Overseas economies remain on a moderate growth path, with the impact of global trade policies still weighing on Japan’s export and industrial production outlook.
- On the price front, the year-on-year rate of change in consumer prices (excluding fresh food) remains in the mid-3% range. Inflationary pressures remain broad-based, with persistent cost-push factors in food and energy, alongside solid wage pass-through. However, input cost pressures from past import surges are showing early signs of easing.
- Short-term inflation momentum may moderate as cost-push effects diminish, though rent increases and service-related price gains tied to labor shortages are likely to provide support. Inflation expectations among firms and households continue a gradual upward drift.
- Looking ahead, the economy is projected to grow at a slower-than-trend pace in the near term due to external demand softness and cautious corporate investment plans. However, accommodative financial conditions and steady increases in real labor income are expected to underpin domestic demand.
- In the medium term, as overseas economies recover and global trade stabilizes, Japan’s growth potential is likely to improve. With persistent labor market tightness and rising medium- to long-term inflation expectations, core inflation is projected to remain on a gradual upward trend, converging toward the 2% price stability target in the latter half of the projection horizon.
- The next meeting is scheduled for 30 to 31 October 2025.
Next 24 Hours Bias
Weak Bearish
Oil
Key news events today
No major news event
What can we expect from Oil today?
Oil prices have experienced notable volatility today, Friday, 26th September 2025, with recent movements driven by geopolitics, inventory surprises, and ongoing supply risks. Prices have pulled back slightly from a seven-week high reached earlier this week, as investors took profits following a rally sparked by U.S. crude stockpile declines and supply concerns around Russia, Kurdistan, and Venezuela.
Next 24 Hours Bias
Weak Bearish
The post IC Markets Asia Fundamental Forecast | 26 September 2025 first appeared on IC Markets | Official Blog.
Friday 26th September 2025: Asian Markets Slip on Fresh US Tariffs and Rate Uncertainty
421841 September 26, 2025 15:39 ICMarkets Market News
Global Markets:
- Asian Stock Markets : Nikkei down -0.55%, Shanghai Composite down -0.18%, Hang Seng down -0.65% ASX up 0.15%
- Commodities : Gold at $3,776.40 (0.14%), Silver at $45.065 (-0.11%), Brent Oil at $69.56 (0.20%), WTI Oil at $65.22 (0.37%)
- Rates : US 10-year yield at 4.177, UK 10-year yield at 4.7590, Germany 10-year yield at 2.7721
News & Data:
- (USD) Final GDP q/q 3.8% to 3.3% expected
- (USD) Unemployment Claims 218K to 233K expected
Markets Update:
Asian stock markets traded mostly lower on Friday, tracking weak Wall Street cues after U.S. President Donald Trump announced steep new tariffs of 25 to 100 percent on upholstered furniture, kitchen cabinets, heavy trucks and branded drugs starting October 1. Uncertainty over U.S. interest rate policy also weighed on sentiment despite upbeat economic data. Investors now await the release of U.S. personal income and spending data, including the Fed’s preferred inflation gauge.
In Australia, the S&P/ASX 200 edged up 0.08 percent to 8,780.30, supported by gains in miners and financials, offset partly by losses in technology and gold stocks. BHP and Rio Tinto advanced more than 1 percent, while Fortescue slipped marginally. Tech names Block, Xero and WiseTech declined, and gold miners traded mostly lower. Vulcan Energy Resources surged over 15 percent after securing a $179 million contract for a geothermal power project in Germany. The Aussie dollar traded at $0.654.
Japan’s Nikkei 225 slipped 0.27 percent to 45,629.79, pressured by declines in tech heavyweights Tokyo Electron and Advantest. SoftBank dropped nearly 3 percent, while exporters like Toyota and Sony gained modestly. Inflation in Tokyo rose 2.5 percent in September, slightly below expectations.
Elsewhere, South Korea and Taiwan slid sharply, while Singapore, Malaysia and Indonesia posted modest gains. On Wall Street, all three major indices extended losses Thursday, while European markets also ended lower. Crude oil edged up to $65.07 a barrel.
Upcoming Events:
- 12:30 PM GMT – CAD GDP m/m
- 12:30 PM GMT – USD Core PCE Price Index m/m
The post Friday 26th September 2025: Asian Markets Slip on Fresh US Tariffs and Rate Uncertainty first appeared on IC Markets | Official Blog.
IC Markets Europe Fundamental Forecast | 26 September 2025
421840 September 26, 2025 15:39 ICMarkets Market News
IC Markets Europe Fundamental Forecast | 26 September 2025
What happened in the Asia session?
Today’s Asia session was dominated by the fallout from President Trump’s aggressive tariff announcements and stronger-than-expected U.S. economic data, leading to notable declines in Asian equities (especially healthcare/biotech), local currencies, and technology stocks, while risk havens like gold and silver saw gains. Japan’s inflation growth slightly cooled
What does it mean for the Europe & US sessions?
Today’s European and U.S. trading sessions are set against a backdrop of heightened volatility, driven by President Trump’s new tariffs, pivotal U.S. inflation data, and cautious sentiment across equities and commodities. Traders should closely monitor the release of the U.S. Core PCE Price Index, geopolitical headlines, risk-off flows in equities, and the evolving impact of transatlantic trade shifts.
The Dollar Index (DXY)
Key news events today
Core PCE price index m/m (12:30 pm GMT)
Revised UoM consumer sentiment (2:00 pm GMT)
What can we expect from DXY today?
The dollar surged to multi-week highs today after impressive US economic data dampened prospects for imminent Fed rate cuts a development that drove global market volatility, hit equities and cryptos, and increased focus on upcoming US inflation figures for further guidance. US economic reports beat expectations, including robust GDP growth (revised up to an annualized 3.8%), lower-than-expected weekly jobless claims, and growth in durable goods and wholesale inventories.
Central Bank Notes:
- The Federal Open Market Committee (FOMC) voted, by majority, to lower the federal funds rate target range by 25 basis points to 4.00%–4.25% at its September 16–17, 2025, meeting, marking the first policy rate adjustment since December 2024 after five consecutive holds.
- The Committee maintained its long-term objective of achieving maximum employment and 2% inflation, acknowledging recent labor market softening and continued tariff-driven price pressures.
- Policymakers expressed elevated concern about downside risks to growth, citing a stalling labor market, modest job creation, and an unemployment rate drifting up toward 4.4%. At the same time, inflation remains above target, with CPI at 3.2% and core inflation at 3.1% as of August 2025; higher energy and food prices, largely attributable to tariffs, continue to weigh on headline measures.
- Although economic activity expanded at a moderate pace in the third quarter, the growth outlook has weakened. Q3 GDP growth is estimated near 1.0% (annualized), with full-year 2025 GDP growth guidance revised to 1.2%, reflecting slowing household consumption and tighter financial conditions.
- In the updated Summary of Economic Projections, the unemployment rate is projected to average 4.5% for the year, with headline PCE inflation revised up slightly to 3.1% for 2025. The Committee anticipates core PCE inflation to remain stubborn, requiring sustained vigilance and a flexible approach to risk management.
- The Committee reiterated its data-dependent approach and openness to further adjustments should employment or inflation deviate meaningfully from current forecasts. Several members dissented, either advocating a larger 50-basis-point cut or preferring no adjustment at this meeting, revealing heightened divergence within the Committee.
- Balance sheet reduction continues at a measured pace. The monthly Treasury redemption cap remains at $5B and the agency MBS cap at $35B, as the Board aims to support orderly market conditions in the face of evolving global and domestic uncertainty
- The next meeting is scheduled for 28 to 29 October 2025.
Next 24 Hours Bias
Weak Bearish
Gold (XAU)
Key news events today
Core PCE price index m/m (12:30 pm GMT)
Revised UoM consumer sentiment (2:00 pm GMT)
What can we expect from Gold today?
Gold’s near-term moves hinge on the forthcoming U.S. inflation data, while medium-term prospects remain positive on persistent safe-haven demand and global uncertainties. Watch for volatility at key technical levels and expect sharp moves as traders react to new macroeconomic signals. Gold prices eased slightly, trading just below $3,745 per ounce as stronger-than-expected U.S. economic data fueled the dollar and dampened expectations for imminent Federal Reserve rate cuts. Market participants are closely awaiting the release of the U.S. PCE inflation report, which is likely to influence the near-term direction for gold.
Next 24 Hours Bias
Strong Bullish
The Euro (EUR)
Key news events today
No major news event
What can we expect from EUR today?
The euro is strong against the dollar and other majors, but this is hurting exports, especially to the US, due to new trade tariffs and reduced competitiveness. Business sentiment in Europe is cautious, with a large share of US firms worried about future economic ties. Short-term technicals show potential for an upward move, but risks of a deeper decline remain if support fails. Overall, the Euro is showing resilience but facing significant headwinds from politics and trade. Markets are waiting for more economic signals and clarity on policy before making major moves.
Central Bank Notes:
- The Governing Council kept the three key ECB interest rates unchanged at its September 11, 2025, meeting. The main refinancing rate remains at 2.15%, the marginal lending facility at 2.40%, and the deposit facility at 2.00%. These levels have been maintained after the cuts earlier in 2025, reflecting the Council’s confidence that the current stance is consistent with the price stability mandate.
- Evidence that inflation is running close to the ECB’s medium-term target of 2% supported the decision to hold rates steady. Domestic price pressures are easing as wage growth continues to moderate, and financing conditions remain accommodative. Policymakers reaffirmed a data-dependent, meeting-by-meeting approach to further policy moves, with no pre-commitment to a predetermined path amid ongoing global and domestic risks.
- Eurosystem staff projections foresee headline inflation averaging 2.0% for 2025, 1.8% for 2026, and 2.0% in 2027. The 2025 and 2026 forecasts reflect a downward revision, primarily on lower energy costs and exchange rate effects, even as food inflation remains persistent. Core inflation (excluding energy and food) is expected at 2.0% for both 2026 and 2027, with only minor changes since prior rounds.
- Real GDP growth in the euro area is projected at 1.1% for 2025, 1.1% for 2026, and 1.4% for 2027. A robust first quarter—partly due to firms accelerating exports ahead of anticipated tariff hikes—cushioned a weaker outlook for the remainder of 2025. While business investment continues to face uncertainty from ongoing global trade disputes, especially with the US, government investment and infrastructure spending are expected to provide some support to the outlook..
- Rising real incomes and continued strength in the labor market back household spending. Despite some fading tailwind from previous rate cuts, financing conditions remain broadly favorable and are expected to underpin the resilience of private consumption and investment against outside shocks. Moderating wage growth and profit margin adjustments are helping to absorb residual cost pressures.
- Rising real incomes and continued strength in the labor market back household spending. Despite some fading tailwind from previous rate cuts, financing conditions remain broadly favorable and are expected to underpin the resilience of private consumption and investment against outside shocks. Moderating wage growth and profit margin adjustments are helping to absorb residual cost pressures.
- All future interest rate decisions will continue to be guided by the integrated assessment of economic and financial data, the inflation outlook, and underlying inflation dynamics, and the effectiveness of monetary policy transmission—without any pre-commitment to a specific future rate path.
- The ECB’s Asset Purchase Programme (APP) and Pandemic Emergency Purchase Programme (PEPP) portfolios are declining predictably, as reinvestment of maturities has ceased. Balance-sheet normalization continues in line with the ECB’s previously communicated schedule.
- The next meeting is on 29 to 30 October 2025
Next 24 Hours Bias
Weak Bearish
The Swiss Franc (CHF)
Key news events today
No major news event
What can we expect from CHF today?
EUR/CHF continues to consolidate near multi-month lows around 0.933, reflecting renewed Swiss franc strength amid cautious global sentiment, mixed Eurozone data, and after the SNB maintained its dovish policy stance and highlighted readiness to intervene in FX markets if necessary. The pair remains in a tight technical range with actionable levels at 0.931 (support) and 0.935–0.940 (resistance). Today’s EUR/CHF rate is approximately 0.93335, with the pair experiencing a marginal fall of -0.07% since yesterday, mainly influenced by cautious risk sentiment and shifts in investor focus to Swiss economic data and policy.
Central Bank Notes:
- The SNB maintained its key policy rate at 0% during its meeting on 25 September 2025, pausing a sequence of six consecutive rate cuts as inflation stabilized and the Swiss franc remained firm.
- Recent data showed a modest rebound in inflation, with Swiss consumer prices rising 0.2% year-on-year in August after staying above zero for three consecutive months; this helped alleviate fears of deflation that were mounting earlier in the year.
- The conditional inflation forecast remains broadly unchanged from June: headline inflation is expected to average 0.2% in 2025, 0.5% in 2026, and 0.7% in 2027. The risk of a negative rate move has diminished for now, but the SNB retains flexibility should inflationary pressures weaken again.
- The global economic outlook has deteriorated further, weighed down by heightened trade tensions—especially with the U.S.—and ongoing uncertainty in key Swiss export markets.
- Swiss GDP growth moderated in Q2 after a strong Q1 boosted by front-loaded U.S. exports. The SNB expects growth to slow and remain subdued, with forecasted GDP expansion between 1% and 1.5% in both 2025 and 2026.
- Labour market sentiment in the Swiss industrial sector has softened on concerns over export competitiveness and potential adjustments to production, but the overall growth outlook stays broadly unchanged
- The SNB reiterated its readiness to respond as needed if deflation risks re-emerge, emphasizing its commitment to medium-term price stability and a robust, transparent communication policy, with the introduction of more detailed monetary policy minutes beginning in October.
- The next meeting is on 11 December 2025.
Next 24 Hours Bias
Medium Bullish
The Pound (GBP)
Key news events today
No major news event
What can we expect from GBP today?
The British Pound (GBP) is slightly higher against the US Dollar today following a recent decline near multi-week lows, with GBP/USD last at approximately 1.3354—up just 0.13% from yesterday and still down over the past month due to persistent dollar strength and dovish signals from the Bank of England. The Bank of England governor and policymakers continue to signal further easing ahead, while some (like Megan Greene) are urging caution due to elevated UK inflation, now at 3.8% for August and expected to peak near 4%.
Central Bank Notes:
- The Bank of England’s Monetary Policy Committee (MPC) voted on 18 September 2025 by a majority (expected split likely 7–2 or 6–3) to hold the Bank Rate steady at 4.00%, following the August rate cut. Most members cited persistent inflation and mixed indicators on growth and employment, while a minority favored further easing due to the cooling labor market and subdued GDP growth.
- The Committee decided to decrease the pace of quantitative tightening, planning to reduce the stock of UK government bond purchases by £67.5 billion over the next 12 months instead of the prior £100 billion pace, with the gilt balance now standing near £558 billion. This reflects increased volatility in bond markets and a shift to a more gradual approach.
- Headline inflation rose unexpectedly to 3.8% in July and is projected at 4% for September, above the Bank’s 2% target. Price pressures are driven by regulated energy costs and ongoing food price increases. While previous disinflation has been substantial, core inflation remains elevated and sticky.
- The MPC expects headline inflation to remain above target through Q4, with a resumption of the downward trend projected for early 2026 as energy and regulated price pressures abate. The Committee remains watchful for signs of persistent inflation despite previous policy tightening.
- UK GDP growth is stagnant, with business and consumer activity subdued. Recent labor market data show rising unemployment rates (now at 4.7%) and stabilizing wage growth (holding near 5%), indicating slack but continued wage price pressure. The Committee remains cautious amid lackluster demand and soft survey sentiment.
- Pay growth and employment indicators have moderated further, alongside confirmation from business surveys that pay settlements are slowing. The Committee expects wage growth to decelerate significantly through Q4 and the rest of 2025.
- Global uncertainty persists due to volatile energy prices, supply chain disruptions linked to Middle East conflicts, and renewed trade tensions. The MPC remains vigilant in tracking transmission of external cost/wage shocks to UK inflation.
- Risks to inflation are considered two-sided. While subdued domestic growth and softening labor activity suggest scope for easing, persistent inflation requires caution. The MPC anticipates a slow, gradual reduction path in rates, continuing its data-dependent approach with careful adjustment as warranted by economic developments.
- The Committee’s bias remains toward maintaining a restrictive monetary policy stance until firmer evidence emerges that inflation will return sustainably to the 2% target. All future decisions will remain highly data dependent, with a strong emphasis on evolving demand, inflation expectations, costs, and labor market conditions.
- The next meeting is on 6 November 2025.
Next 24 Hours Bias
Weak Bullish
The Canadian Dollar (CAD)
Key news events today
GDP m/m (12:30 pm GMT)
What can we expect from CAD today?
The Canadian Dollar remains pressured by global interest rate differentials and expectations of further Bank of Canada easing. Despite occasional oil price gains, the loonie is underperforming against the US dollar, and technical forecasts suggest continued short-term downside risk but potential for gradual recovery into 2026 if monetary conditions reverse.
Central Bank Notes:
- The Bank of Canada reduced its target for the overnight rate to 2.50% at its September 17 meeting, with the Bank Rate at 2.75% and the deposit rate at 2.25%. This marks the first rate cut since early 2025, as the Bank responded to a string of softer inflation prints and persistent economic headwinds.
- The Council cited continued U.S. tariff volatility and slow progress on trade negotiations as major contributors to ongoing uncertainty. While headline tariffs have not escalated further, the unpredictability of U.S. policy remains a significant risk for Canadian exports and business confidence.
- Uncertainty about U.S. trade policy and recurring tariff threats continued to weigh on growth prospects. The Bank flagged downside risks to the export sector, with survey data indicating ongoing hesitancy among manufacturers and exporters.
- After modest growth in Q1, Canada’s economy slipped into contraction, with GDP shrinking by 0.8% in Q2 and forecast to decrease again by 0.8% in Q3. Economic weakness has been most pronounced in manufacturing and goods-producing sectors affected by trade frictions and softer U.S. demand.
- Early estimates show that growth stabilized in September but remained well below the Bank’s 2% forecast for Q4. Manufacturing output has improved slightly—supported by a modest rebound in petroleum and mining activity—while consumer spending and retail sales were largely flat.
- Consumer spending remained subdued as households continued to limit discretionary purchases amid uncertainty and a slower job market. Housing activity stayed weak, despite earlier government efforts to boost affordability and modest gains in some real estate segments.
- Headline CPI inflation edged up to 1.9% in August, undershooting economist expectations but still showing emerging pressures from shelter and imported goods costs. Core inflation metrics were mixed, though price growth remains just below the Bank’s 2% target.
- The Governing Council reaffirmed its cautious approach, emphasizing that while further rate cuts are possible, the pace will hinge on the path of U.S. tariffs, domestic inflation dynamics, and signs of a sustainable recovery. The Bank remains vigilant against the risk of inflation falling below target in the face of economic slack.
- The next meeting is on 29 October 2025.
Next 24 Hours Bias
Medium Bearish
Oil
Key news events today
No major news event
What can we expect from Oil today?
Oil prices climbed higher on Friday, September 26, 2025, with Brent trading above $69 per barrel and WTI above $65 per barrel, both posting gains of over 4% for the week—the largest weekly rise since June. These increases were driven by escalating geopolitical tensions, particularly Ukrainian drone attacks on Russian energy infrastructure and ensuing Russian restrictions on fuel exports, as well as a surprise decline in U.S. inventories.
Next 24 Hours Bias
Weak Bullish
The post IC Markets Europe Fundamental Forecast | 26 September 2025 first appeared on IC Markets | Official Blog.
Ex-Dividend 26/9/2025
421838 September 25, 2025 17:14 ICMarkets Market News
The post Ex-Dividend 26/9/2025 first appeared on IC Markets | Official Blog.
Thursday 25th September 2025: Technical Outlook and Review
421826 September 25, 2025 14:14 ICMarkets Market News
DXY (U.S. Dollar Index):
Potential Direction: Bullish
Overall momentum of the chart: Bearish
The price could make a short-term pullback toward the pivot before rising again toward the 1st resistance
Pivot: 97.14
Supporting reasons: Identified as a pullback support that aligns closely with the 50% Fibonacci retracement, where renewed buying pressure could emerge to push the price higher.
1st support: 96.47
Supporting reasons: Identified as a swing low support, indicating a potential area where the price could again stabilize.
1st resistance: 98.02
Supporting reasons: Identified as an overlap resistance, acting as a ceiling for price and potentially preventing further upward movement.
EUR/USD:
Potential Direction: Bullish
Overall momentum of the chart: Bullish
The price has already bounced off the pivot and could continue to make a bullish rise toward the 1st resistance
Pivot: 1.1734
Supporting reasons: Identified as an overlap support, where renewed buying pressure could emerge to push the price higher.
1st support: 1.1690
Supporting reasons: Identified as an overlap support, providing a strong level where price could stabilize again if the market retraces deeper.
1st resistance: 1.17787
Supporting reasons: Identified as a pullback resistance, marking a key level that could temporarily halt upward momentum.
EUR/JPY:
Potential Direction: Bullish
Overall momentum of the chart: Bullish
The price could make a short-term pullback toward the pivot before rising again toward the 1st resistance
Pivot: 173.78
Supporting reasons: Identified as a pullback support, where renewed buying pressure could emerge to push the price higher.
1st Support: 173.09
Supporting reasons: Identified as an overlap support, marking a key stabilization zone if the price retraces deeper.
1st Resistance: 175.01
Supporting reasons: Identified as a resistance that is supported by the 161.8% Fibonacci extension, where upward momentum could face a potential barrier.
EUR/GBP:
Potential Direction: Bullish
Overall momentum of the chart: Bullish
The price could make a short-term pullback toward the pivot before rising again toward the 1st resistance
Pivot: 0.8713
Supporting reasons: Identified as an overlap support, indicating a potential area where buying interest could pick up.
1st support: 0.8669
Supporting reasons: Identified as an overlap support, providing a solid stabilization zone if price retraces.
1st resistance: 0.8763
Supporting reasons: Identified as a resistance that is supported by the 161.8% Fibonacci extension, making it a strong barrier where upward momentum could slow.
GBP/USD:
Potential Direction: Bearish
Overall momentum of the chart: Bullish
The price could see a short-term pullback toward the pivot before continuing its bearish move down toward the 1st support.
Pivot: 1.3460
Supporting reasons: Identified as a pullback resistance, where selling pressures could intensify and potentially cap any upward retracement.
1st support: 1.3366
Supporting reasons: Identified as an overlap support that aligns with the 61.8% Fibonacci projection, indicating a potential area where the price could stabilize once more.
1st resistance: 1.3533
Supporting reasons: Identified as an overlap resistance, indicating a potential level that could halt further upward movement.
GBP/JPY:
Potential Direction: Bearish
Overall momentum of the chart: Bullish
The price could see a short-term pullback toward the pivot before continuing its bearish move down toward the 1st support.
Pivot: 200.21
Supporting reasons: Identified as a pullback resistance that aligns with the 50% Fibonacci retracement, where selling pressures could intensify and potentially cap any upward retracement.
1st support: 199.00
Supporting reasons: Identified as an overlap support, indicating a potential level where the price could stabilize once more.
1st resistance: 201.14
Supporting reasons: Identified as a swing high resistance, indicating a potential level that could halt further upward movement.
USD/CHF:
Potential Direction: Bullish
Overall momentum of the chart: Bullish
The price could make a short-term pullback toward the pivot before rising again toward the 1st resistance
Pivot: 0.7909
Supporting reasons: Identified as an overlap support that alings closely with the 50% Fibonacci retracement, where renewed buying pressure could emerge to push the price higher.
1st support: 0.7852
Supporting reasons: Identified as a swing low suppor, indicating a potential level where the price could stabilize once again.
1st resistance: 0.7986
Supporting reasons: Identified as an overlap resistance, indicating a potential level that could cap further upward movement.
USD/JPY:
Potential Direction: Bullish
Overall momentum of the chart: Bullish
The price could make a short-term pullback toward the pivot before rising again toward the 1st resistance
Pivot: 148.34
Supporting reasons: Identified as a pullback support, where renewed buying pressure could emerge to push the price higher.
1st support: 147.44
Supporting reasons: Identified as an overlap support, indicating a potential area where the price could again stabilize.
1st resistance: 149.19
Supporting reasons: Identified as a multi-swing high resistance that aligns with the 61.8% Fibonacci projection, acting as a ceiling for price and potentially preventing further upward movement.
USD/CAD:
Potential Direction: Bullish
Overall momentum of the chart: Bearish
The price could make a short-term pullback toward the pivot before rising again toward the 1st resistance
Pivot: 1.3881
Supporting reasons: Identified as a pullback support, where renewed buying pressure could emerge to push the price higher.
1st support: 1.3852
Supporting reasons: Identified as a pullback support, indicating a potential area where the price could again stabilize.
1st resistance: 1.3943
Supporting reasons: Identified as a swing high resistance that aligns with the 127.2% Fibonacci extension, acting as a ceiling for price and potentially preventing further upward movement.
AUD/USD:
Potential Direction: Bearish
Overall momentum of the chart: Bullish
The price could see a short-term pullback toward the pivot before continuing its bearish move down toward the 1st support.
Pivot: 0.6624
Supporting reasons: Identified as an overlap resistance, where selling pressures could intensify and potentially cap any upward retracement.
1st support: 0.6558
Supporting reasons: Identified as a pullback support that aligns closely with the 61.8% Fibonacci retracement, providing a strong level where price could stabilize again if the market retraces deeper.
1st resistance: 0.6689
Supporting reasons: Identified as an overlap resistance, marking a key level that could temporarily halt upward momentum.
NZD/USD
Potential Direction: Bearish
Overall momentum of the chart: Bullish
The price could see a short-term pullback toward the pivot before continuing its bearish move down toward the 1st support.
Pivot: 0.5883
Supporting reasons: Identified as a pullback resistance that aligns closely with the 38.2% Fibonacci retracement, where selling pressures could intensify and potentially cap any upward retracement.
1st support: 0.5804
Supporting reasons: Identified as a swing low support, providing a strong level where price could stabilize again if the market retraces deeper.
1st resistance: 0.5914
Supporting reasons: Identified as a pullback resistance, marking a key level that could temporarily halt upward momentum.
US30 (DJIA):
Potential Direction: Bullish
Overall momentum of the chart: Bullish
The price could make a short-term pullback toward the pivot before rising again toward the 1st resistance
Pivot: 46,123.56
Supporting reasons: Identified as an overlap support, where renewed buying pressure could emerge to push the price higher.
1st support: 45,756.51
Supporting reasons: Identified as an overlap support, providing a solid stabilization zone if price retraces.
1st resistance: 46,704.98
Supporting reasons: Identified as a swing high resistance, making it a strong barrier where upward momentum could slow.
DE40 (DAX):
Potential Direction: Bullish
Overall momentum of the chart: Bullish
The price could make a short-term pullback toward the pivot before rising again toward the 1st resistance
Pivot: 23,479.66
Supporting reasons: Identified as an overlap support, where renewed buying pressure could emerge to push the price higher.
1st support: 23,317.44
Supporting reasons: Identified as a multi-swing low support, indicating a key level where the price could stabilize once more.
1st resistance: 23,873.56
Supporting reasons: Identified as an overlap resistance, indicating a potential area that could halt any further upward movement.
US500 (S&P 500):
Potential Direction: Bearish
Overall momentum of the chart: Bullish
The price could see a short-term pullback toward the pivot before continuing its bearish move down toward the 1st support.
Pivot: 6,655.64
Supporting reasons: Identified as a pullback resistance, where selling pressures could intensify and potentially cap any upward retracement.
1st support: 6,594.19
Supporting reasons: Identified as an overlap support, providing a strong level where price could stabilize again if the market retraces deeper.
1st resistance: 6,696.24
Supporting reasons: Identified as a swing high resistance, marking a key level that could temporarily halt upward momentum.
BTC/USD (Bitcoin):
Potential Direction: Bearish
Overall momentum of the chart: Bullish
The price could see a short-term pullback toward the pivot before continuing its bearish move down toward the 1st support.
Pivot: 114,486.46
Supporting reasons: Identified as a pullback resistance that aligns with the 50% Fibonacci retracement, where selling pressures could intensify and potentially cap any upward retracement.
1st support: 109.777.81
Supporting reasons: Identified as an overlap support that aligns with the 78.6% Fibonacci retracement, providing a strong level where price could stabilize again if the market retraces deeper.
1st resistance: 117.415.29
Supporting reasons: Identified as a swing high resistance, marking a key level that could temporarily halt upward momentum.
ETH/USD (Ethereum):
Potential Direction: Bearish
Overall momentum of the chart: Bullish
The price could see a short-term pullback toward the pivot before continuing its bearish move down toward the 1st support.
Pivot: 4,237.70
Supporting reasons: Identified as a pullback resistance, where selling pressures could intensify and potentially cap any upward retracement.
1st support: 3,923.17
Supporting reasons: Identified as a pullback support that aligns with the 161.8% Fibonacci retracement, providing a solid stabilization zone if the price retraces.
1st resistance: 4,432.89
Supporting reasons: Identified as a pullback resistance, making it a strong barrier where upward momentum could slow.
WTI/USD (Oil):
Potential Direction: Bullish
Overall momentum of the chart: Bullish
The price could make a short-term pullback toward the pivot before rising again toward the 1st resistance
Pivot: 63.94
Supporting reasons: Identified as a pullback support, where renewed buying pressure could emerge to push the price higher.
1st support: 62.09
Supporting reasons: Identified as a multi swing low support, providing a strong level where price could stabilize again if the market retraces deeper.
1st resistance: 65.90
Supporting reasons: Identified as a pullback resistance, marking a key level that could temporarily halt upward momentum.
XAU/USD (GOLD):
Potential Direction: Bullish
Overall momentum of the chart: Bullish
The price could make a short-term pullback toward the pivot before rising again toward the 1st resistance
Pivot: 3,699.30
Supporting reasons: Identified as a pullback support that aligns closely with the 50% Fibonacci retracement, where renewed buying pressure could emerge to push the price higher.
1st support: 3,654.40
Supporting reasons: Identified as a pullback support, providing a strong level where price could stabilize again if the market retraces deeper.
1st resistance: 3,784.06
Supporting reasons: Identified as a multi-swing high resistance, marking a key level that could temporarily halt upward momentum.
The accuracy, completeness and timeliness of the information contained on this site cannot be guaranteed. IC Markets does not warranty, guarantee or make any representations, or assume any liability regarding financial results based on the use of the information in the site.
News, views, opinions, recommendations and other information obtained from sources outside of www.icmarkets.com, used in this site are believed to be reliable, but we cannot guarantee their accuracy or completeness. All such information is subject to change at any time without notice. IC Markets assumes no responsibility for the content of any linked site.
The fact that such links may exist does not indicate approval or endorsement of any material contained on any linked site. IC Markets is not liable for any harm caused by the transmission, through accessing the services or information on this site, of a computer virus, or other computer code or programming device that might be used to access, delete, damage, disable, disrupt or otherwise impede in any manner, the operation of the site or of any user’s software, hardware, data or property.
The post Thursday 25th September 2025: Technical Outlook and Review first appeared on IC Markets | Official Blog.
Thursday 25th September 2025: Asian Markets Slip as Powell’s Caution Tempers Rate Cut Optimism
421825 September 25, 2025 14:00 ICMarkets Market News
Global Markets:
- Asian Stock Markets : Nikkei up 0.12%, Shanghai Composite up 0.16%, Hang Seng up 0.31% ASX up 0.12%
- Commodities : Gold at $3,768.25 (0.01%), Silver at $44.255 (0.14%), Brent Oil at $69.04 (-0.39%), WTI Oil at $64.69 (-0.46%)
- Rates : US 10-year yield at 4.142, UK 10-year yield at 4.6720, Germany 10-year yield at 2.7474
News & Data:
- (USD) New Home Sales 800K to 650K expected
- (USD) Crude Oil Inventoriesc -0.6M to 0.8M expected
Markets Update:
Asian markets traded mostly lower in sluggish Thursday sessions, mirroring weak cues from Wall Street, as traders remained cautious amid persistent uncertainty over U.S. interest rates, sticky inflation, and a slowing job market. Sentiment was also weighed down by Fed Chair Jerome Powell’s warning that equity prices appear “fairly highly valued” and that aggressive rate cuts could reignite inflation. Still, investors are betting on two more rate cuts this year, with the CME FedWatch Tool showing a 94% chance of a 25-basis-point cut at the October meeting.
In Australia, the S&P/ASX 200 rose 0.24% to 8,785.70, supported by gains in energy stocks, miners, and select banks. Rio Tinto and BHP advanced over 3%, while Woodside Energy climbed more than 2%. Among banks, Westpac gained 1%, though Commonwealth Bank slipped nearly 1%.
Japan’s Nikkei 225 inched up 0.20% to 45,719.71, with automakers and exporters posting small gains. However, tech stocks were weak, with Advantest down 1.5% and Screen Holdings off nearly 2%. Notable movers included Sumitomo Metal Mining, surging almost 7%, while Sumitomo Pharma dropped 4%.
Elsewhere, markets in New Zealand, China, Hong Kong, Singapore, and Malaysia fell modestly, while Indonesia rose 1.1%. Wall Street closed lower overnight, with the Dow slipping 0.4% and the Nasdaq down
Upcoming Events:
- 12:30 PM GMT – USD Final GDP q/q
- 12:30 PM GMT – USD Unemployment Claims
The post Thursday 25th September 2025: Asian Markets Slip as Powell’s Caution Tempers Rate Cut Optimism first appeared on IC Markets | Official Blog.
IC Markets Europe Fundamental Forecast | 25 September 2025
421824 September 25, 2025 14:00 ICMarkets Market News
IC Markets Europe Fundamental Forecast | 25 September 2025
What happened in the Asia session?
The market mood in Asia was one of caution, with investors partially locking in profits after a strong rally and bracing for key U.S. macroeconomic data later in the week. The Japanese yen and oil remained the most sensitive assets to headline risk, while equities broadly paused ahead of scheduled data and global policy developments. The session was relatively quiet for major economic data releases, but market movements were still significant due to positioning ahead of quarter-end and anticipation of U.S. Federal Reserve policy updates.
What does it mean for the Europe & US sessions?
Today’s trading sessions are driven by the release of critical U.S. economic data, especially GDP, jobless claims, and durable goods orders, which are likely to set the tone for risk assets and FX. Central bank projections and inflation metrics remain at the forefront, with Friday’s PCE release expected to be pivotal. Tech, auto, and financial sectors present opportunities and volatility, while oil prices and geopolitics add further complexity for traders.
The Dollar Index (DXY)
Key news events today
Final GDP q/q (12:30 pm GMT)
Core Durable Goods Orders m/m (12:30 pm GMT)
Durable Goods Orders m/m (12:30 pm GMT)
Final GDP Price Index q/q (12:30 pm GMT)
Existing Home Sales (2:00 pm GMT)
What can we expect from DXY today?
The U.S. dollar remains firm, holding onto recent gains as traders respond to Federal Reserve signals and await key economic data releases. The dollar has shown significant strength against major currencies, particularly the Japanese yen, amid shifting interest rate expectations and broad positioning flows. Market participants have priced in about 43 basis points of Fed easing for the rest of 2025, but statements from Fed officials, including Chair Powell, suggest that future policy shifts will depend heavily on upcoming inflation and labor market data
Central Bank Notes:
- The Federal Open Market Committee (FOMC) voted, by majority, to lower the federal funds rate target range by 25 basis points to 4.00%–4.25% at its September 16–17, 2025, meeting, marking the first policy rate adjustment since December 2024 after five consecutive holds.
- The Committee maintained its long-term objective of achieving maximum employment and 2% inflation, acknowledging recent labor market softening and continued tariff-driven price pressures.
- Policymakers expressed elevated concern about downside risks to growth, citing a stalling labor market, modest job creation, and an unemployment rate drifting up toward 4.4%. At the same time, inflation remains above target, with CPI at 3.2% and core inflation at 3.1% as of August 2025; higher energy and food prices, largely attributable to tariffs, continue to weigh on headline measures.
- Although economic activity expanded at a moderate pace in the third quarter, the growth outlook has weakened. Q3 GDP growth is estimated near 1.0% (annualized), with full-year 2025 GDP growth guidance revised to 1.2%, reflecting slowing household consumption and tighter financial conditions.
- In the updated Summary of Economic Projections, the unemployment rate is projected to average 4.5% for the year, with headline PCE inflation revised up slightly to 3.1% for 2025. The Committee anticipates core PCE inflation to remain stubborn, requiring sustained vigilance and a flexible approach to risk management.
- The Committee reiterated its data-dependent approach and openness to further adjustments should employment or inflation deviate meaningfully from current forecasts. Several members dissented, either advocating a larger 50-basis-point cut or preferring no adjustment at this meeting, revealing heightened divergence within the Committee.
- Balance sheet reduction continues at a measured pace. The monthly Treasury redemption cap remains at $5B and the agency MBS cap at $35B, as the Board aims to support orderly market conditions in the face of evolving global and domestic uncertainty
- The next meeting is scheduled for 28 to 29 October 2025.
Next 24 Hours Bias
Weak Bearish
Gold (XAU)
Key news events today
Final GDP q/q (12:30 pm GMT)
Core Durable Goods Orders m/m (12:30 pm GMT)
Durable Goods Orders m/m (12:30 pm GMT)
Final GDP Price Index q/q (12:30 pm GMT)
Existing Home Sales (2:00 pm GMT)
What can we expect from Gold today?
Gold prices today are holding near recent all-time highs after a period of bullish momentum, supported by expectations of further U.S. rate cuts, geopolitical tensions, and strong demand from ETF inflows and central banks. Spot gold traded around $3,736-3,740 per ounce, virtually unchanged from the previous session and up roughly 10% for the month. The market remains cautious as traders await key U.S. economic data and further guidance from Federal Reserve officials.
Next 24 Hours Bias
Strong Bullish
The Euro (EUR)
Key news events today
No major news event
What can we expect from EUR today?
The Euro faces headwinds from deteriorating German business sentiment and mixed economic signals across the eurozone. While the ECB maintains a steady policy stance with inflation near target, concerns about trade redirection from China and political uncertainties in major economies like France continue to weigh on the currency. The technical outlook suggests further downside potential unless key resistance levels are broken convincingly.
Central Bank Notes:
- The Governing Council kept the three key ECB interest rates unchanged at its September 11, 2025, meeting. The main refinancing rate remains at 2.15%, the marginal lending facility at 2.40%, and the deposit facility at 2.00%. These levels have been maintained after the cuts earlier in 2025, reflecting the Council’s confidence that the current stance is consistent with the price stability mandate.
- Evidence that inflation is running close to the ECB’s medium-term target of 2% supported the decision to hold rates steady. Domestic price pressures are easing as wage growth continues to moderate, and financing conditions remain accommodative. Policymakers reaffirmed a data-dependent, meeting-by-meeting approach to further policy moves, with no pre-commitment to a predetermined path amid ongoing global and domestic risks.
- Eurosystem staff projections foresee headline inflation averaging 2.0% for 2025, 1.8% for 2026, and 2.0% in 2027. The 2025 and 2026 forecasts reflect a downward revision, primarily on lower energy costs and exchange rate effects, even as food inflation remains persistent. Core inflation (excluding energy and food) is expected at 2.0% for both 2026 and 2027, with only minor changes since prior rounds.
- Real GDP growth in the euro area is projected at 1.1% for 2025, 1.1% for 2026, and 1.4% for 2027. A robust first quarter—partly due to firms accelerating exports ahead of anticipated tariff hikes—cushioned a weaker outlook for the remainder of 2025. While business investment continues to face uncertainty from ongoing global trade disputes, especially with the US, government investment and infrastructure spending are expected to provide some support to the outlook..
- Rising real incomes and continued strength in the labor market back household spending. Despite some fading tailwind from previous rate cuts, financing conditions remain broadly favorable and are expected to underpin the resilience of private consumption and investment against outside shocks. Moderating wage growth and profit margin adjustments are helping to absorb residual cost pressures.
- Rising real incomes and continued strength in the labor market back household spending. Despite some fading tailwind from previous rate cuts, financing conditions remain broadly favorable and are expected to underpin the resilience of private consumption and investment against outside shocks. Moderating wage growth and profit margin adjustments are helping to absorb residual cost pressures.
- All future interest rate decisions will continue to be guided by the integrated assessment of economic and financial data, the inflation outlook, and underlying inflation dynamics, and the effectiveness of monetary policy transmission—without any pre-commitment to a specific future rate path.
- The ECB’s Asset Purchase Programme (APP) and Pandemic Emergency Purchase Programme (PEPP) portfolios are declining predictably, as reinvestment of maturities has ceased. Balance-sheet normalization continues in line with the ECB’s previously communicated schedule.
- The next meeting is on 29 to 30 October 2025
Next 24 Hours Bias
Weak Bearish
The Swiss Franc (CHF)
Key news events today
SNB Monetary Policy Assessment (7:30 am GMT)
SNB Policy Rate (7:30 am GMT)
SNB Press Conference (8:00 am GMT)
What can we expect from CHF today?
Today’s expected SNB decision to maintain rates at 0% underscores the central bank’s constrained position – unable to significantly weaken the currency through conventional monetary policy while facing limited intervention options. The franc’s strength appears likely to persist as long as global uncertainties remain elevated and Switzerland maintains its reputation for fiscal stability relative to other major economies.
Central Bank Notes:
- The SNB maintained its key policy rate at 0% during its meeting on 25 September 2025, pausing a sequence of six consecutive rate cuts as inflation stabilized and the Swiss franc remained firm.
- Recent data showed a modest rebound in inflation, with Swiss consumer prices rising 0.2% year-on-year in August after staying above zero for three consecutive months; this helped alleviate fears of deflation that were mounting earlier in the year.
- The conditional inflation forecast remains broadly unchanged from June: headline inflation is expected to average 0.2% in 2025, 0.5% in 2026, and 0.7% in 2027. The risk of a negative rate move has diminished for now, but the SNB retains flexibility should inflationary pressures weaken again.
- The global economic outlook has deteriorated further, weighed down by heightened trade tensions—especially with the U.S.—and ongoing uncertainty in key Swiss export markets.
- Swiss GDP growth moderated in Q2 after a strong Q1 boosted by front-loaded U.S. exports. The SNB expects growth to slow and remain subdued, with forecasted GDP expansion between 1% and 1.5% in both 2025 and 2026.
- Labour market sentiment in the Swiss industrial sector has softened on concerns over export competitiveness and potential adjustments to production, but the overall growth outlook stays broadly unchanged
- The SNB reiterated its readiness to respond as needed if deflation risks re-emerge, emphasizing its commitment to medium-term price stability and a robust, transparent communication policy, with the introduction of more detailed monetary policy minutes beginning in October.
- The next meeting is on 11 December 2025.
Next 24 Hours Bias
Medium Bullish
The Pound (GBP)
Key news events today
No major news event
What can we expect from GBP today?
Thursday’s pound developments reflect a currency under pressure from multiple fronts: hawkish BoE rhetoric limiting rate cut expectations, disappointing economic data suggesting growth momentum is stalling, persistently high inflation constraining policy flexibility, and renewed dollar strength. While the pound showed modest gains today, the overall trajectory remains challenging, with technical indicators suggesting further downside risks if key support levels are breached. Market participants are likely to remain cautious ahead of upcoming economic releases and the November budget announcement.
Central Bank Notes:
- The Bank of England’s Monetary Policy Committee (MPC) voted on 18 September 2025 by a majority (expected split likely 7–2 or 6–3) to hold the Bank Rate steady at 4.00%, following the August rate cut. Most members cited persistent inflation and mixed indicators on growth and employment, while a minority favored further easing due to the cooling labor market and subdued GDP growth.
- The Committee decided to decrease the pace of quantitative tightening, planning to reduce the stock of UK government bond purchases by £67.5 billion over the next 12 months instead of the prior £100 billion pace, with the gilt balance now standing near £558 billion. This reflects increased volatility in bond markets and a shift to a more gradual approach.
- Headline inflation rose unexpectedly to 3.8% in July and is projected at 4% for September, above the Bank’s 2% target. Price pressures are driven by regulated energy costs and ongoing food price increases. While previous disinflation has been substantial, core inflation remains elevated and sticky.
- The MPC expects headline inflation to remain above target through Q4, with a resumption of the downward trend projected for early 2026 as energy and regulated price pressures abate. The Committee remains watchful for signs of persistent inflation despite previous policy tightening.
- UK GDP growth is stagnant, with business and consumer activity subdued. Recent labor market data show rising unemployment rates (now at 4.7%) and stabilizing wage growth (holding near 5%), indicating slack but continued wage price pressure. The Committee remains cautious amid lackluster demand and soft survey sentiment.
- Pay growth and employment indicators have moderated further, alongside confirmation from business surveys that pay settlements are slowing. The Committee expects wage growth to decelerate significantly through Q4 and the rest of 2025.
- Global uncertainty persists due to volatile energy prices, supply chain disruptions linked to Middle East conflicts, and renewed trade tensions. The MPC remains vigilant in tracking transmission of external cost/wage shocks to UK inflation.
- Risks to inflation are considered two-sided. While subdued domestic growth and softening labor activity suggest scope for easing, persistent inflation requires caution. The MPC anticipates a slow, gradual reduction path in rates, continuing its data-dependent approach with careful adjustment as warranted by economic developments.
- The Committee’s bias remains toward maintaining a restrictive monetary policy stance until firmer evidence emerges that inflation will return sustainably to the 2% target. All future decisions will remain highly data dependent, with a strong emphasis on evolving demand, inflation expectations, costs, and labor market conditions.
- The next meeting is on 6 November 2025.
Next 24 Hours Bias
Weak Bullish
The Canadian Dollar (CAD)
Key news events today
No major news event
What can we expect from CAD today?
The Canadian dollar faces mounting challenges on September 25, 2025, trading at four-month lows against the US dollar amid a confluence of negative factors. The Bank of Canada’s recent rate cut to 2.50%, combined with Governor Macklem’s urgent calls for trade diversification and structural economic reforms, underscores the severity of current economic headwinds.
Central Bank Notes:
- The Bank of Canada reduced its target for the overnight rate to 2.50% at its September 17 meeting, with the Bank Rate at 2.75% and the deposit rate at 2.25%. This marks the first rate cut since early 2025, as the Bank responded to a string of softer inflation prints and persistent economic headwinds.
- The Council cited continued U.S. tariff volatility and slow progress on trade negotiations as major contributors to ongoing uncertainty. While headline tariffs have not escalated further, the unpredictability of U.S. policy remains a significant risk for Canadian exports and business confidence.
- Uncertainty about U.S. trade policy and recurring tariff threats continued to weigh on growth prospects. The Bank flagged downside risks to the export sector, with survey data indicating ongoing hesitancy among manufacturers and exporters.
- After modest growth in Q1, Canada’s economy slipped into contraction, with GDP shrinking by 0.8% in Q2 and forecast to decrease again by 0.8% in Q3. Economic weakness has been most pronounced in manufacturing and goods-producing sectors affected by trade frictions and softer U.S. demand.
- Early estimates show that growth stabilized in September but remained well below the Bank’s 2% forecast for Q4. Manufacturing output has improved slightly—supported by a modest rebound in petroleum and mining activity—while consumer spending and retail sales were largely flat.
- Consumer spending remained subdued as households continued to limit discretionary purchases amid uncertainty and a slower job market. Housing activity stayed weak, despite earlier government efforts to boost affordability and modest gains in some real estate segments.
- Headline CPI inflation edged up to 1.9% in August, undershooting economist expectations but still showing emerging pressures from shelter and imported goods costs. Core inflation metrics were mixed, though price growth remains just below the Bank’s 2% target.
- The Governing Council reaffirmed its cautious approach, emphasizing that while further rate cuts are possible, the pace will hinge on the path of U.S. tariffs, domestic inflation dynamics, and signs of a sustainable recovery. The Bank remains vigilant against the risk of inflation falling below target in the face of economic slack.
- The next meeting is on 29 October 2025.
Next 24 Hours Bias
Medium Bearish
Oil
Key news events today
No major news event
What can we expect from Oil today?
Oil markets on September 25, 2025, experienced a modest pullback following Wednesday’s surge to seven-week highs. The complex interplay between bullish factors (unexpected U.S. inventory draws, Ukrainian attacks on Russian refineries, escalating geopolitical tensions) and bearish elements (approaching demand seasonality, OPEC+ production increases, potential Kurdish export resumption) continues to drive volatility.
Next 24 Hours Bias
Weak Bullish
The post IC Markets Europe Fundamental Forecast | 25 September 2025 first appeared on IC Markets | Official Blog.
General Market Analysis – 25/09/25
421823 September 25, 2025 13:39 ICMarkets Market News
Stocks Drift Ahead of Inflation Numbers – Dow down 0.4%
US stock indices drifted lower again in trading yesterday as investors locked in profits ahead of key inflation data on Friday. The Dow dropped 0.37% to 46,121, the S&P fell 0.28% to 6,637, and the Nasdaq fell 0.34% to 22,497. The dollar rallied strongly against most of the majors, with the DXY up 0.61% to 97.87 as yields pushed higher, the 2-year up 4.1 basis points to 3.604%, and the benchmark 10-year up 4 basis points to 4.147%. Oil prices jumped higher to hit 7-week highs after US inventory data came in much lower than expected and news of further Ukrainian strikes on Russian oil facilities hit the market, with Brent up 2.23% to $69.14 and WTI up 2.21% to $64.81. Gold fell off recent record levels in line with the stronger greenback, down 0.74% on the day to close at $3,736.16 an ounce.
Dollar Rallies to Key Levels Again on the Majors
The dollar rallied strongly in trading yesterday as traders continued to weigh comments from Fed Chair Jerome Powell that he is still focused on inflation numbers as well as jobs data ahead of tomorrow’s key PCE number. The dollar index rallied 0.6% on the day, and the dollar now sits at key levels against some of the world’s major currencies. Euro and Cable are both now trading just above key support lines, while USDJPY and USDCHF are very close to big resistance levels on the daily charts. There are still five trading sessions ahead of key inflation numbers in the US tomorrow, but there is a strong chance that these levels could break before the data release and we see a further rally in the greenback. If that is backed up by a stronger-than-expected PCE number, then we should see fresh ranges for the majors into next week.
Traders Prepare for Another Busy Day Ahead
It looks like being another busy trading day ahead for markets as traders eye pending key inflation data from the US tomorrow and react to a fairly lively last day. Asian markets are set to open mixed after indices slipped on Wall Street overnight, and there is little on the calendar to change momentum in the first session of the day. Things should liven up once the London session kicks off, with a big focus on Swiss markets early in the day when the Swiss National Bank makes its latest interest rate call. They are expected to keep rates on hold, but traders are anticipating volatility in the franc on any forward guidance, with rates especially vulnerable while sitting at 0%. The New York session sees a big US data drop early in the day with Final GDP (exp. 3.3% q/q), Weekly Unemployment Claims (exp. 233k), and Durable Goods (exp. -0.3% m/m) all out at the same time. Existing Home Sales (exp. 3.96m) data is also out later in the session, and we hear from a barrage of Fed members including Schmid, Williams, Bowman, Barr, Logan, and Daly. However, expect investors to maintain a wary eye on tomorrow’s PCE number throughout the session.
The post General Market Analysis – 25/09/25 first appeared on IC Markets | Official Blog.
IC Markets Asia Fundamental Forecast | 25 September 2025
421822 September 25, 2025 13:39 ICMarkets Market News
IC Markets Asia Fundamental Forecast | 25 September 2025
What happened in the U.S. session?
The U.S. session overnight was characterized by caution on Fed rate cut timing, surprise strength in housing data, ongoing geopolitical headlines, and sharp moves in commodities and interest rates. Tech equities and safe-haven assets sold off, while defense stocks and the dollar gained. Treasury yields rose, crude oil rallied, and macroeconomic releases added volatility to both risk assets and defensive plays.
What does it mean for the Asia Session?
Thursday’s Asian session presents a mixed environment with key inflation data from Japan, continued technology sector strength, and central bank policy divergence creating both opportunities and risks. The Tokyo CPI release will be particularly critical for setting BOJ expectations and yen direction, while the broader theme of Fed easing versus potential BOJ tightening continues to shape currency and equity markets across the region. Traders should remain alert to any unexpected developments in the ongoing U.S.-China trade situation and monitor commodity price movements as global growth concerns persist.
The Dollar Index (DXY)
Key news events today
Final GDP q/q (12:30 pm GMT)
Core Durable Goods Orders m/m (12:30 pm GMT)
Durable Goods Orders m/m (12:30 pm GMT)
Final GDP Price Index q/q (12:30 pm GMT)
Existing Home Sales (2:00 pm GMT)
What can we expect from DXY today?
The US dollar experienced a notable rebound, climbing to three-week highs as Fed Chair Powell adopted a more cautious stance on future rate cuts. While markets still expect additional easing, Powell’s emphasis on “two-sided risks” and data-dependent policy has reduced expectations for aggressive dovishness. Despite this recent strength, the dollar remains down over 10% for the year, reflecting broader concerns about Fed policy, labor market weakness, and global capital reallocation. Key factors to watch include upcoming employment data, inflation reports, and the Fed’s October meeting, which will determine whether this dollar recovery can sustain or if the broader weakening trend resumes into the fourth quarter.
Central Bank Notes:
- The Federal Open Market Committee (FOMC) voted, by majority, to lower the federal funds rate target range by 25 basis points to 4.00%–4.25% at its September 16–17, 2025, meeting, marking the first policy rate adjustment since December 2024 after five consecutive holds.
- The Committee maintained its long-term objective of achieving maximum employment and 2% inflation, acknowledging recent labor market softening and continued tariff-driven price pressures.
- Policymakers expressed elevated concern about downside risks to growth, citing a stalling labor market, modest job creation, and an unemployment rate drifting up toward 4.4%. At the same time, inflation remains above target, with CPI at 3.2% and core inflation at 3.1% as of August 2025; higher energy and food prices, largely attributable to tariffs, continue to weigh on headline measures.
- Although economic activity expanded at a moderate pace in the third quarter, the growth outlook has weakened. Q3 GDP growth is estimated near 1.0% (annualized), with full-year 2025 GDP growth guidance revised to 1.2%, reflecting slowing household consumption and tighter financial conditions.
- In the updated Summary of Economic Projections, the unemployment rate is projected to average 4.5% for the year, with headline PCE inflation revised up slightly to 3.1% for 2025. The Committee anticipates core PCE inflation to remain stubborn, requiring sustained vigilance and a flexible approach to risk management.
- The Committee reiterated its data-dependent approach and openness to further adjustments should employment or inflation deviate meaningfully from current forecasts. Several members dissented, either advocating a larger 50-basis-point cut or preferring no adjustment at this meeting, revealing heightened divergence within the Committee.
- Balance sheet reduction continues at a measured pace. The monthly Treasury redemption cap remains at $5B and the agency MBS cap at $35B, as the Board aims to support orderly market conditions in the face of evolving global and domestic uncertainty.
- The next meeting is scheduled for 28 to 29 October 2025.
Next 24 Hours Bias
Medium Bearish
Gold (XAU)
Key news events today
Final GDP q/q (12:30 pm GMT)
Core Durable Goods Orders m/m (12:30 pm GMT)
Durable Goods Orders m/m (12:30 pm GMT)
Final GDP Price Index q/q (12:30 pm GMT)
Existing Home Sales (2:00 pm GMT)
What can we expect from Gold today?
Gold’s remarkable 2025 performance continues as the metal trades near all-time highs, supported by a confluence of factors including Federal Reserve easing expectations, robust central bank buying, record ETF inflows, ongoing geopolitical tensions, and a weaker US dollar. While Powell’s cautious stance has introduced some near-term volatility, the underlying bullish drivers remain intact. Friday’s PCE data will be crucial for determining whether gold can break decisively above the $3,800 resistance level or faces a technical correction.
Next 24 Hours Bias
Strong Bullish
The Australian Dollar (AUD)
Key news events today
No major news event
What can we expect from AUD today?
The Australian Dollar experienced significant strengthening on Wednesday following the release of higher-than-expected August CPI data, which showed inflation accelerating to 3.0% annually. This development has reduced expectations for near-term RBA rate cuts, with markets now pricing in a hold at the September 30 meeting and decreased probability of a November cut. While the currency gained ground against major peers, underlying economic conditions remain mixed, with the labor market softening and PMI data showing deceleration in business activity. The RBA’s path forward will likely depend on upcoming quarterly inflation data and continued assessment of global economic uncertainties, particularly regarding China’s economic health and its impact on Australian commodity exports.
Central Bank Notes:
- The RBA held its cash rate steady at 3.60% at its September meeting on 8–9 September 2025, following a 25 basis point reduction at the August meeting. This maintains a cautious yet supportive stance, with the decision largely anticipated given recent evidence of inflation settling within the target band.
- Inflation readings continue to ease, with headline CPI most likely tracking near 2.1–2.3%—comfortably within the 2–3% target range. September quarter figures are pending, but leading indicators show further moderation in non-housing components, even as insurance and housing-related costs remain sticky.
- The RBA’s preferred trimmed mean inflation is estimated at around 2.7%–2.9%, further reflecting progress toward the midpoint of the target range. Energy and food volatility still create some short-term uncertainty, but underlying inflation is broadly on track.
- Global conditions are a key source of risk. While U.S.–EU trade tensions have stabilized slightly, volatility in equities and commodities persists, with uncertainty feeding through to Australia’s trade and export outlook.
- Domestic demand shows tentative improvement. Real household incomes and a stabilizing housing sector have underpinned modest consumption growth, though business investment remains uneven—service sectors outperforming manufacturing and construction.
- Labor market tightness persists, but momentum continues to slow from earlier in the year. Employment gains remain, but job vacancies and hiring intentions have softened, with underutilization rising marginally for the second straight month.
- Wage growth has slowed in line with easing labour pressures, but unit labour costs remain elevated due to weak productivity. The RBA continues to flag subdued productivity as a medium-term cost risk.
- Forward indicators suggest household consumption may be softer than previously forecast. Elevated rents and high borrowing costs are dampening discretionary spending, despite modest income recovery.
- The Board continues to highlight the risk that household spending could underperform, potentially weighing on business investment and job creation if confidence remains subdued.
- Monetary policy remains mildly restrictive, in line with greater inflation control and ongoing economic rebalancing. The decision to hold rates recognizes both progress and ongoing uncertainties, with future moves explicitly tied to incoming data.
- The Reserve Bank reinforced its goals of price stability and full employment, stating readiness to adjust policy if economic or inflation outcomes diverge from baseline projections.
- The next meeting is on 29 to 30 September 2025.
Next 24 Hours Bias
Medium Bullish
The Kiwi Dollar (NZD)
Key news events today
No major news event
What can we expect from NZD today?
The New Zealand dollar faces a challenging period as it navigates through economic contraction, aggressive monetary easing expectations, and leadership transition at the central bank. While the appointment of Anna Breman as the new RBNZ governor provides some stability and continuity, the currency remains under pressure from weak domestic fundamentals and expectations of substantial interest rate cuts ahead. The NZD’s performance will largely depend on upcoming economic data releases and the new governor’s policy approach when she takes office in December 2025.
Central Bank Notes:
- The Monetary Policy Committee (MPC) agreed to cut the Official Cash Rate (OCR) by 25 basis points to 3.00% on 20 August 2025, marking a three-year low and continuing the easing cycle after July’s pause. The vote was split 4-2, with two members advocating a 50-basis-point cut, highlighting diverging views within the Committee.
- Policymakers indicated that significant uncertainty and a stalling economic recovery prompted this move, leaving the door open for further rate cuts later in the year, with a possible trough around 2.5% by December.
- Annual consumer price index inflation rose to 2.7% in the June quarter and is expected to reach 3% for the September quarter—at the upper end of the MPC’s 1 to 3% target band—but medium-term expectations remain anchored near the 2% midpoint.
- Despite the near-term uptick, headline inflation is projected to return toward 2% by mid-2026, as tradables inflation pressures ease and significant spare capacity continues to dampen domestic price momentum.
- Domestic financial conditions are broadly aligning with MPC expectations, as lower wholesale rates have translated into reduced borrowing costs for households. However, declining consumption and investment demand, higher unemployment, and subdued wage growth reflect ongoing economic slack.
- GDP growth stalled in the second quarter of 2025, contrasting with earlier projections. High-frequency indicators point to continued weakness driven by rising prices for essentials, weakening household savings, and constrained business lending.
- The MPC cautioned that ongoing global tariff uncertainties and policy shifts, especially recent changes in US trade regulations, could amplify market volatility and present both upside and downside risks to New Zealand’s recovery.
- Subject to medium-term inflation pressures continuing to ease as projected, the MPC signaled scope for further OCR cuts, possibly down to 2.5% by year-end, consistent with the latest Monetary Policy Statement outlook.
- The next meeting is on 22 October 2025.
Next 24 Hours Bias
Medium Bullish
The Japanese Yen (JPY)
Key news events today
Tokyo Core CPI y/y (11:30 pm GMT)
What can we expect from JPY today?
The Japanese yen continues to face headwinds as it approaches the psychologically important 150 level against the dollar. While the BoJ maintained its cautious approach in September, growing internal dissent and the surprise announcement of asset sales signal an increasing willingness to normalize policy. Political uncertainty surrounding the October 4 LDP leadership election adds another layer of complexity to the monetary policy outlook. Key upcoming events include Tokyo CPI data on Friday and the potential for intervention if the yen weakens significantly past 150. Market expectations remain tilted toward a BoJ rate hike in October, which could provide support for the currency in the coming weeks.
Central Bank Notes:
- The Policy Board of the Bank of Japan decided on 17 September, by a unanimous vote, to set the following guidelines for money market operations for the inter-meeting period:
- The Bank will encourage the uncollateralized overnight call rate to remain at around 0.5%.
- The BOJ will continue its gradual reduction of monthly outright purchases of Japanese Government Bonds (JGBs). The scheduled amount of long-term government bond purchases remains unchanged from the prior decision, with a quarterly reduction pace of about ¥400 billion through March 2026 and about ¥200 billion per quarter from April to June 2026 onward, aiming for a purchase level near ¥2 trillion in January to March 2027.
- Japan’s economy continues to show a moderate recovery, with household consumption supported by rising incomes, although corporate activity has softened somewhat. Overseas economies remain on a moderate growth path, with the impact of global trade policies still weighing on Japan’s export and industrial production outlook.
- On the price front, the year-on-year rate of change in consumer prices (excluding fresh food) remains in the mid-3% range. Inflationary pressures remain broad-based, with persistent cost-push factors in food and energy, alongside solid wage pass-through. However, input cost pressures from past import surges are showing early signs of easing.
- Short-term inflation momentum may moderate as cost-push effects diminish, though rent increases and service-related price gains tied to labor shortages are likely to provide support. Inflation expectations among firms and households continue a gradual upward drift.
- Looking ahead, the economy is projected to grow at a slower-than-trend pace in the near term due to external demand softness and cautious corporate investment plans. However, accommodative financial conditions and steady increases in real labor income are expected to underpin domestic demand.
- In the medium term, as overseas economies recover and global trade stabilizes, Japan’s growth potential is likely to improve. With persistent labor market tightness and rising medium- to long-term inflation expectations, core inflation is projected to remain on a gradual upward trend, converging toward the 2% price stability target in the latter half of the projection horizon.
- The next meeting is scheduled for 30 to 31 October 2025.
Next 24 Hours Bias
Weak Bearish
Oil
Key news events today
No major news event
What can we expect from Oil today?
Oil markets are characterized by a complex interplay of tightening short-term supply conditions and longer-term oversupply concerns. Immediate bullish factors include surprise US inventory draws, ongoing export disruptions from Iraq’s Kurdistan region, and escalating geopolitical tensions as Ukrainian attacks intensify pressure on Russian energy infrastructure. However, OPEC+’s continued production increases and forecasts of significant global inventory builds suggest downward pressure on prices in the coming quarters. The market remains highly sensitive to geopolitical developments, with the Russia-Ukraine conflict and Middle East tensions maintaining a substantial risk premium in current pricing.
Next 24 Hours Bias
Weak Bearish
The post IC Markets Asia Fundamental Forecast | 25 September 2025 first appeared on IC Markets | Official Blog.