Articles

IC Markets Asia Fundamental Forecast | 24 September 2025
421821 September 24, 2025 16:14 ICMarkets Market News
IC Markets Asia Fundamental Forecast | 24 September 2025
What happened in the U.S. session?
The overnight U.S. session was characterized by mixed economic data showing deceleration but resilience. While the PMI data and Richmond Fed survey pointed to slowing growth momentum, the significant improvement in the current account deficit provided a positive offset. Powell’s cautious approach to future rate cuts created uncertainty in markets, leading to profit-taking in tech stocks despite continued record highs. Gold emerged as the standout performer, benefiting from multiple tailwinds, including Fed dovishness, geopolitical tensions, and safe-haven demand. The U.S. dollar remained under pressure near multi-year lows, while oil markets found support from supply concerns and geopolitical risks.
What does it mean for the Asia Session?
Wednesday’s session will be dominated by Australia’s crucial inflation data, which could significantly impact RBA policy expectations and regional currency markets. The broader environment of US dollar weakness, record-high gold prices, and divergent central bank policies creates both opportunities and risks for Asian traders. While global equity momentum remains positive, economic data from China and Europe will provide important clues about global growth trajectories. Traders should particularly watch for any shifts in Fed policy expectations and ongoing developments in geopolitical tensions that could drive safe-haven flows.
The Dollar Index (DXY)
Key news events today
New Home Sales (2:00 pm GMT)
What can we expect from DXY today?
The US Dollar faces continued headwinds as markets digest the Fed’s shift toward an easing cycle amid persistent inflation and labor market weakness. While technical analysis suggests potential for a near-term rebound from current levels, the fundamental backdrop of expected rate cuts, policy uncertainty, and reduced safe-haven demand continues to pressure the greenback. Key economic data releases this week, including core PCE inflation data on Friday, will be crucial for determining the dollar’s near-term direction and the Fed’s October policy decision.
Central Bank Notes:
- The Federal Open Market Committee (FOMC) voted, by majority, to lower the federal funds rate target range by 25 basis points to 4.00%–4.25% at its September 16–17, 2025, meeting, marking the first policy rate adjustment since December 2024 after five consecutive holds.
- The Committee maintained its long-term objective of achieving maximum employment and 2% inflation, acknowledging recent labor market softening and continued tariff-driven price pressures.
- Policymakers expressed elevated concern about downside risks to growth, citing a stalling labor market, modest job creation, and an unemployment rate drifting up toward 4.4%. At the same time, inflation remains above target, with CPI at 3.2% and core inflation at 3.1% as of August 2025; higher energy and food prices, largely attributable to tariffs, continue to weigh on headline measures.
- Although economic activity expanded at a moderate pace in the third quarter, the growth outlook has weakened. Q3 GDP growth is estimated near 1.0% (annualized), with full-year 2025 GDP growth guidance revised to 1.2%, reflecting slowing household consumption and tighter financial conditions.
- In the updated Summary of Economic Projections, the unemployment rate is projected to average 4.5% for the year, with headline PCE inflation revised up slightly to 3.1% for 2025. The Committee anticipates core PCE inflation to remain stubborn, requiring sustained vigilance and a flexible approach to risk management.
- The Committee reiterated its data-dependent approach and openness to further adjustments should employment or inflation deviate meaningfully from current forecasts. Several members dissented, either advocating a larger 50-basis-point cut or preferring no adjustment at this meeting, revealing heightened divergence within the Committee.
- Balance sheet reduction continues at a measured pace. The monthly Treasury redemption cap remains at $5B and the agency MBS cap at $35B, as the Board aims to support orderly market conditions in the face of evolving global and domestic uncertainty.
- The next meeting is scheduled for 28 to 29 October 2025.
Next 24 Hours Bias
Medium Bearish
Gold (XAU)
Key news events today
New Home Sales (2:00 pm GMT)
What can we expect from Gold today?
Gold’s record-breaking performance reflects a confluence of factors, including dovish Federal Reserve expectations, China’s strategic gold initiatives, persistent central bank buying, and ongoing geopolitical uncertainties. While technical indicators suggest potential for near-term consolidation around current levels, the fundamental backdrop remains supportive for higher prices. Key resistance at $3,800 represents the next major test, with many analysts projecting further gains toward $4,000 or higher in the coming months. The upcoming PCE inflation data on Friday will provide crucial insights into the Fed’s policy trajectory and could significantly influence gold’s near-term direction.
Next 24 Hours Bias
Strong Bullish
The Australian Dollar (AUD)
Key news events today
CPI y/y (1:30 am GMT)
What can we expect from AUD today?
The Australian Dollar enters the final week of September 2025 at a critical juncture. While the currency has shown resilience with monthly gains, upcoming data releases, including the September 24 CPI indicator and the September 30 RBA decision will be pivotal. The combination of slowing domestic economic momentum, mixed Chinese data, and global trade uncertainties suggests continued volatility ahead. Market participants are closely watching for signs that August’s inflation spike was temporary rather than indicative of broader price pressures, which could significantly influence the RBA’s policy trajectory and the AUD’s direction through year-end.
Central Bank Notes:
- The RBA held its cash rate steady at 3.60% at its September meeting on 8–9 September 2025, following a 25 basis point reduction at the August meeting. This maintains a cautious yet supportive stance, with the decision largely anticipated given recent evidence of inflation settling within the target band.
- Inflation readings continue to ease, with headline CPI most likely tracking near 2.1–2.3%—comfortably within the 2–3% target range. September quarter figures are pending, but leading indicators show further moderation in non-housing components, even as insurance and housing-related costs remain sticky.
- The RBA’s preferred trimmed mean inflation is estimated at around 2.7%–2.9%, further reflecting progress toward the midpoint of the target range. Energy and food volatility still create some short-term uncertainty, but underlying inflation is broadly on track.
- Global conditions are a key source of risk. While U.S.–EU trade tensions have stabilized slightly, volatility in equities and commodities persists, with uncertainty feeding through to Australia’s trade and export outlook.
- Domestic demand shows tentative improvement. Real household incomes and a stabilizing housing sector have underpinned modest consumption growth, though business investment remains uneven—service sectors outperforming manufacturing and construction.
- Labor market tightness persists, but momentum continues to slow from earlier in the year. Employment gains remain, but job vacancies and hiring intentions have softened, with underutilization rising marginally for the second straight month.
- Wage growth has slowed in line with easing labour pressures, but unit labour costs remain elevated due to weak productivity. The RBA continues to flag subdued productivity as a medium-term cost risk.
- Forward indicators suggest household consumption may be softer than previously forecast. Elevated rents and high borrowing costs are dampening discretionary spending, despite modest income recovery.
- The Board continues to highlight the risk that household spending could underperform, potentially weighing on business investment and job creation if confidence remains subdued.
- Monetary policy remains mildly restrictive, in line with greater inflation control and ongoing economic rebalancing. The decision to hold rates recognizes both progress and ongoing uncertainties, with future moves explicitly tied to incoming data.
- The Reserve Bank reinforced its goals of price stability and full employment, stating readiness to adjust policy if economic or inflation outcomes diverge from baseline projections.
- The next meeting is on 29 to 30 September 2025.
Next 24 Hours Bias
Medium Bullish
The Kiwi Dollar (NZD)
Key news events today
No major news event
What can we expect from NZD today?
The New Zealand Dollar faces a challenging environment with several critical developments converging. The historic appointment of the first female RBNZ Governor represents a significant institutional milestone, but the new leader will inherit substantial challenges, including economic weakness, market pressure for aggressive rate cuts, and the need to restore central bank credibility.
Central Bank Notes:
- The Monetary Policy Committee (MPC) agreed to cut the Official Cash Rate (OCR) by 25 basis points to 3.00% on 20 August 2025, marking a three-year low and continuing the easing cycle after July’s pause. The vote was split 4-2, with two members advocating a 50-basis-point cut, highlighting diverging views within the Committee.
- Policymakers indicated that significant uncertainty and a stalling economic recovery prompted this move, leaving the door open for further rate cuts later in the year, with a possible trough around 2.5% by December.
- Annual consumer price index inflation rose to 2.7% in the June quarter and is expected to reach 3% for the September quarter—at the upper end of the MPC’s 1 to 3% target band—but medium-term expectations remain anchored near the 2% midpoint.
- Despite the near-term uptick, headline inflation is projected to return toward 2% by mid-2026, as tradables inflation pressures ease and significant spare capacity continues to dampen domestic price momentum.
- Domestic financial conditions are broadly aligning with MPC expectations, as lower wholesale rates have translated into reduced borrowing costs for households. However, declining consumption and investment demand, higher unemployment, and subdued wage growth reflect ongoing economic slack.
- GDP growth stalled in the second quarter of 2025, contrasting with earlier projections. High-frequency indicators point to continued weakness driven by rising prices for essentials, weakening household savings, and constrained business lending.
- The MPC cautioned that ongoing global tariff uncertainties and policy shifts, especially recent changes in US trade regulations, could amplify market volatility and present both upside and downside risks to New Zealand’s recovery.
- Subject to medium-term inflation pressures continuing to ease as projected, the MPC signaled scope for further OCR cuts, possibly down to 2.5% by year-end, consistent with the latest Monetary Policy Statement outlook.
- The next meeting is on 22 October 2025.
Next 24 Hours Bias
Medium Bullish
The Japanese Yen (JPY)
Key news events today
No major news event
What can we expect from JPY today?
The Japanese Yen faces a complex environment heading into late September 2025. While the BoJ maintains its cautious approach to rate hikes, growing hawkish sentiment within the board and the decision to begin asset sales signal a gradual shift toward policy normalization. Inflation remains above the 2% target but is showing signs of moderation, particularly in energy costs due to government subsidies. The manufacturing sector continues to struggle with trade headwinds, though services remain resilient. Market participants are closely watching the upcoming Tokyo CPI data and any further signals from BoJ officials regarding the timing of future rate adjustments.
Central Bank Notes:
- The Policy Board of the Bank of Japan decided on 17 September, by a unanimous vote, to set the following guidelines for money market operations for the inter-meeting period:
- The Bank will encourage the uncollateralized overnight call rate to remain at around 0.5%.
- The BOJ will continue its gradual reduction of monthly outright purchases of Japanese Government Bonds (JGBs). The scheduled amount of long-term government bond purchases remains unchanged from the prior decision, with a quarterly reduction pace of about ¥400 billion through March 2026 and about ¥200 billion per quarter from April to June 2026 onward, aiming for a purchase level near ¥2 trillion in January to March 2027.
- Japan’s economy continues to show a moderate recovery, with household consumption supported by rising incomes, although corporate activity has softened somewhat. Overseas economies remain on a moderate growth path, with the impact of global trade policies still weighing on Japan’s export and industrial production outlook.
- On the price front, the year-on-year rate of change in consumer prices (excluding fresh food) remains in the mid-3% range. Inflationary pressures remain broad-based, with persistent cost-push factors in food and energy, alongside solid wage pass-through. However, input cost pressures from past import surges are showing early signs of easing.
- Short-term inflation momentum may moderate as cost-push effects diminish, though rent increases and service-related price gains tied to labor shortages are likely to provide support. Inflation expectations among firms and households continue a gradual upward drift.
- Looking ahead, the economy is projected to grow at a slower-than-trend pace in the near term due to external demand softness and cautious corporate investment plans. However, accommodative financial conditions and steady increases in real labor income are expected to underpin domestic demand.
- In the medium term, as overseas economies recover and global trade stabilizes, Japan’s growth potential is likely to improve. With persistent labor market tightness and rising medium- to long-term inflation expectations, core inflation is projected to remain on a gradual upward trend, converging toward the 2% price stability target in the latter half of the projection horizon.
- The next meeting is scheduled for 30 to 31 October 2025.
Next 24 Hours Bias
Weak Bearish
Oil
Key news events today
EIA crude oil inventories (2:30 pm GMT)
What can we expect from Oil today?
A pivotal moment for oil markets emerged as multiple factors converged to create complex price dynamics. While short-term supply disruption concerns from the Kurdistan pipeline delay and geopolitical tensions provided upward pressure, the outlook of fundamental oversupply continued to weigh on longer-term price expectations. The market demonstrated the dual nature of current oil dynamics: immediate supply risks supporting prices in the near term, while structural oversupply from OPEC+ production increases and modest demand growth point toward significantly lower prices by late 2025 and into 2026.
Next 24 Hours Bias
Weak Bearish
The post IC Markets Asia Fundamental Forecast | 24 September 2025 first appeared on IC Markets | Official Blog.
General Market Analysis – 24/09/25
421820 September 24, 2025 16:14 ICMarkets Market News
US Stocks Fall After Powell Comments – Nasdaq down 1%
US stocks fell in trading yesterday, ending a three-day streak where they hit fresh highs repeatedly, as Fed Chair Jerome Powell advised that inflation concerns are on par with a falling labour market. The Dow lost 0.19% to 45,656, the S&P fell 0.55% to 6,656, but the Nasdaq took the brunt of the pain, losing 0.95% to move back down to 22,573. The dollar was relatively steady on the day, the DXY drifting 0.10% lower to 97.24, while Treasury yields also fell, the 2-year down 1.7 basis points to 3.586% and the 10-year down 4.1 basis points to 4.106%. Oil prices jumped as news hit the market that the deal to resume exports from Kurdish ports stalled, Brent up 1.92% to $67.85 and WTI up 2.17% to $63.63. Gold surged again in early trade to record yet another fresh all-time high just south of $3,800 before drifting lower, ultimately closing up 0.45% at $3,764.01 an ounce.
Correlations Falling Could Signal Corrections Ahead
Traditional correlations across some financial products have appeared to break down in recent weeks, and for some, over the course of the last several months. Narratives around moves from financial commentators are lacking consistency, with different products tending to write their own story recently. For instance, since the Fed meeting last week, we have seen the dollar and US yields push higher, supposedly on the back of a less dovish Fed outlook. However, US stock indices powered higher from all-time highs to yet more all-time highs on the back of more anticipated rate cuts from the Fed. We also have gold smashing new highs on haven buying, while the aforementioned stock markets are also hitting record levels. Usually, these situations don’t tend to last too long, and we see a correction in one of the products. The trick for traders will be picking the right one and timing when to jump on the trend reversal.
Quieter Trading Day Ahead for Investors
It’s a quieter calendar day ahead for traders, although given recent moves and updates, most market participants are expecting to see more volatility in the market as we progress through the sessions today. The big data event of the day will fall in the Asian session, with all eyes on the Australian market for the latest CPI release. The market is expecting to see a pickup in the year-on-year number to 2.9%, and anything off that print should see strong reactions in RBA rate move expectations and in the Aussie dollar. The European session sees the release of the latest German IFO Business Climate data, which could move the euro if it misses the expected 89.3 print, while the New York session has the monthly New Home Sales (exp. 650k) and the weekly US Crude Oil Inventory number (last -9.3mio) releases. However, overall, most traders are expecting updates on the newswires to hold greater sway.
The post General Market Analysis – 24/09/25 first appeared on IC Markets | Official Blog.
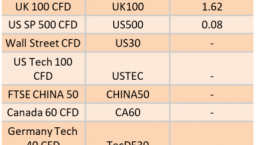
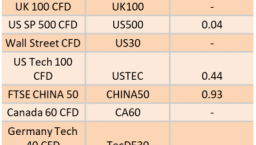
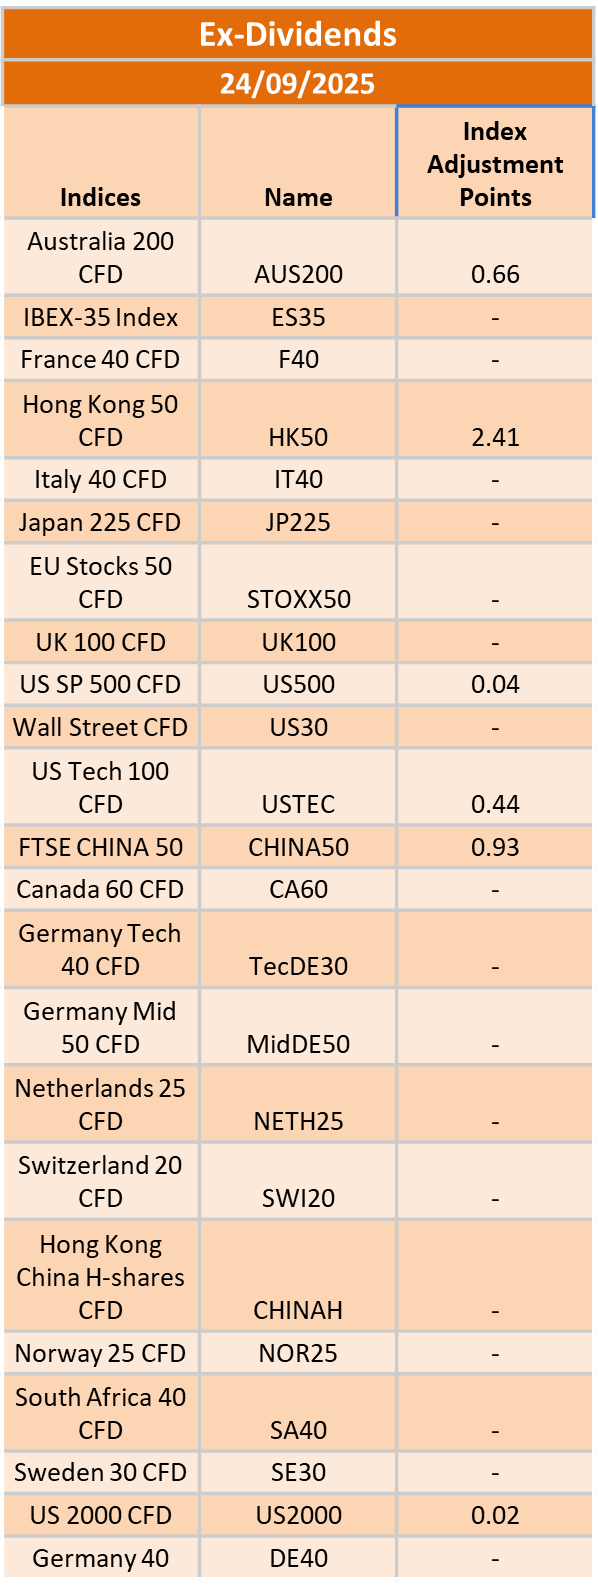
Ex-Dividend 25/9/2025
421818 September 24, 2025 16:00 ICMarkets Market News
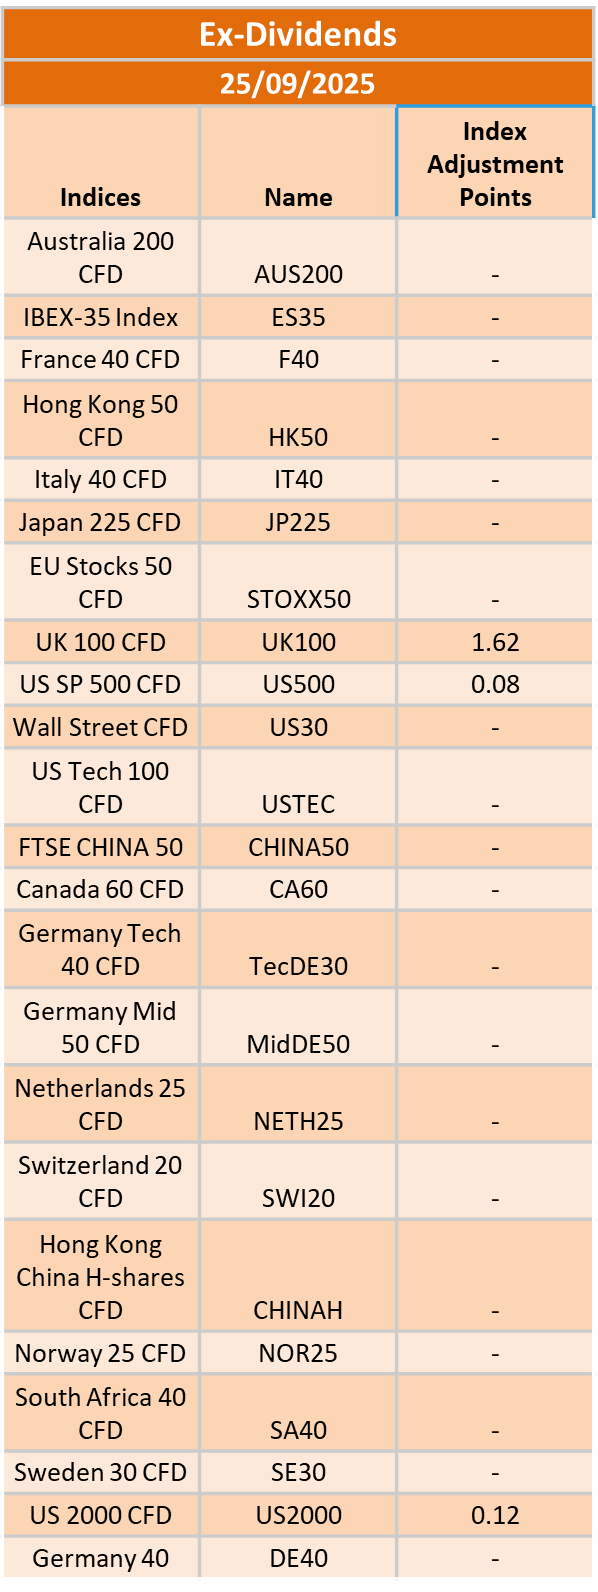
The post Ex-Dividend 25/9/2025 first appeared on IC Markets | Official Blog.
Wednesday 24th September 2025: Stocks in Asia Decline as Powell Offers Little Rate Guidance
421817 September 24, 2025 16:00 ICMarkets Market News
Global Markets:
- Asian Stock Markets : Nikkei up 0.01%, Shanghai Composite up 0.47%, Hang Seng up 0.85% ASX down -1.04%
- Commodities : Gold at $3,800.92 (-0.36%), Silver at $44.405 (-0.46%), Brent Oil at $67.65 (0.03%), WTI Oil at $63.47 (0.09%)
- Rates : US 10-year yield at 4.106, UK 10-year yield at 4.6860, Germany 10-year yield at 2.7520
News & Data:
- (USD) Flash Manufacturing PMI 52.0 to 52.2 expected
- (USD) Flash Services PMI 53.9 to 54.0 expected
Markets Update:
Asian stock markets are mostly lower on Wednesday, tracking the negative cues from Wall Street amid uncertainty over U.S. interest rate policy. Fed Chair Jerome Powell offered little clarity on the path of rates, while renewed U.S. trade tensions and escalating geopolitical risks in Europe and the Middle East further dampened sentiment. On Tuesday, Asian markets had ended mixed.
Powell described equity valuations as “fairly highly valued,” noting the Fed faces a “challenging situation” balancing inflation risks with employment concerns. Fed Governor Stephen Miran again urged deeper cuts, having earlier supported a 50-basis-point move, while Fed officials Alberto Musalem and Beth Hammack called for caution. Markets still expect two more cuts this year, with CME’s FedWatch Tool showing a 94% chance of a quarter-point reduction at the October meeting.
In Australia, the S&P/ASX 200 fell 0.95% to 8,762, dragged by tech, financials, and gold miners, though iron ore and energy stocks offered some support. Japan’s Nikkei 225 slipped to 45,300, with mixed sector moves: SoftBank gained, while Fast Retailing and major automakers declined. PMI data showed manufacturing remained in contraction, slipping to 48.4.
Elsewhere, South Korea, Taiwan, and Singapore traded lower, while Hong Kong and Indonesia gained. On Wall Street, the Nasdaq dropped 1%, the S&P 500 fell 0.6%, and the Dow dipped 0.2%. Crude oil jumped over 2% on supply concerns.
Upcoming Events:
- 02:00 PM GMT – USD New Home Sales
- 02:30 PM GMT – USD Crude Oil Inventories
The post Wednesday 24th September 2025: Stocks in Asia Decline as Powell Offers Little Rate Guidance first appeared on IC Markets | Official Blog.
IC Markets Europe Fundamental Forecast | 24 September 2025
421816 September 24, 2025 15:39 ICMarkets Market News
IC Markets Europe Fundamental Forecast | 24 September 2025
What happened in the Asia session?
The Asia trading session on September 24, 2025, was dominated by mixed economic data that reinforced divergent monetary policy expectations across the region. Australia’s higher-than-expected inflation significantly boosted the Australian dollar and reduced rate cut probabilities, while Japan’s deteriorating manufacturing conditions weighed on the yen and complicated Bank of Japan policy decisions.
What does it mean for the Europe & US sessions?
The current trading environment is characterized by heightened uncertainty as central banks navigate complex economic crosscurrents. While the Fed has begun its easing cycle, Powell’s cautious stance signals a measured approach ahead. Commodity markets are benefiting from supply concerns and safe-haven demand, while currency markets reflect diverging central bank policies and economic fundamentals. European markets face ongoing challenges from trade tensions and weaker growth, creating opportunities for tactical positioning across asset classes.
The Dollar Index (DXY)
Key news events today
New Home Sales (2:00 pm GMT)
What can we expect from DXY today?
The US dollar faces a complex environment as it attempts to stabilize near multi-year lows. While Fed Chair Powell’s cautious stance on future rate cuts has provided some temporary support, internal Fed divisions and mixed economic data continue to create uncertainty. The dollar’s near-term direction will likely depend heavily on Friday’s PCE inflation data and whether the Fed maintains its measured approach to policy easing or succumbs to pressure for more aggressive action. Market participants remain focused on the delicate balance between supporting a softening labor market and preventing inflation from re-accelerating.
Central Bank Notes:
- The Federal Open Market Committee (FOMC) voted, by majority, to lower the federal funds rate target range by 25 basis points to 4.00%–4.25% at its September 16–17, 2025, meeting, marking the first policy rate adjustment since December 2024 after five consecutive holds.
- The Committee maintained its long-term objective of achieving maximum employment and 2% inflation, acknowledging recent labor market softening and continued tariff-driven price pressures.
- Policymakers expressed elevated concern about downside risks to growth, citing a stalling labor market, modest job creation, and an unemployment rate drifting up toward 4.4%. At the same time, inflation remains above target, with CPI at 3.2% and core inflation at 3.1% as of August 2025; higher energy and food prices, largely attributable to tariffs, continue to weigh on headline measures.
- Although economic activity expanded at a moderate pace in the third quarter, the growth outlook has weakened. Q3 GDP growth is estimated near 1.0% (annualized), with full-year 2025 GDP growth guidance revised to 1.2%, reflecting slowing household consumption and tighter financial conditions.
- In the updated Summary of Economic Projections, the unemployment rate is projected to average 4.5% for the year, with headline PCE inflation revised up slightly to 3.1% for 2025. The Committee anticipates core PCE inflation to remain stubborn, requiring sustained vigilance and a flexible approach to risk management.
- The Committee reiterated its data-dependent approach and openness to further adjustments should employment or inflation deviate meaningfully from current forecasts. Several members dissented, either advocating a larger 50-basis-point cut or preferring no adjustment at this meeting, revealing heightened divergence within the Committee.
- Balance sheet reduction continues at a measured pace. The monthly Treasury redemption cap remains at $5B and the agency MBS cap at $35B, as the Board aims to support orderly market conditions in the face of evolving global and domestic uncertainty
- The next meeting is scheduled for 28 to 29 October 2025.
Next 24 Hours Bias
Medium Bearish
Gold (XAU)
Key news events today
New Home Sales (2:00 pm GMT)
What can we expect from Gold today?
Gold consolidated near record highs on Wednesday as investors processed Fed Chair Powell’s cautious commentary while maintaining expectations for further rate cuts. Despite a modest retreat from Tuesday’s peak, the precious metal remains supported by massive ETF inflows, continued central bank buying, and escalating geopolitical tensions. With key inflation data due Friday and analyst price targets reaching $4,000-$5,000, gold’s bull market appears positioned to continue despite near-term technical headwinds.
Next 24 Hours Bias
Medium Bullish
The Euro (EUR)
Key news events today
German ifo Business Climate (8:00 am GMT)
What can we expect from EUR today?
The eurozone economy shows resilience with continued growth for nine consecutive months, though momentum remains modest. While services drive expansion, manufacturing faces renewed contraction amid weakening demand. The ECB’s unchanged monetary policy stance reflects confidence in the inflation outlook, but political instability in France and persistent trade uncertainties pose risks to the recovery. Germany’s fiscal expansion provides crucial support, but the sustainability of growth depends on resolving structural challenges and enhancing European unity on economic policies.
Central Bank Notes:
- The Governing Council kept the three key ECB interest rates unchanged at its September 11, 2025, meeting. The main refinancing rate remains at 2.15%, the marginal lending facility at 2.40%, and the deposit facility at 2.00%. These levels have been maintained after the cuts earlier in 2025, reflecting the Council’s confidence that the current stance is consistent with the price stability mandate.
- Evidence that inflation is running close to the ECB’s medium-term target of 2% supported the decision to hold rates steady. Domestic price pressures are easing as wage growth continues to moderate, and financing conditions remain accommodative. Policymakers reaffirmed a data-dependent, meeting-by-meeting approach to further policy moves, with no pre-commitment to a predetermined path amid ongoing global and domestic risks.
- Eurosystem staff projections foresee headline inflation averaging 2.0% for 2025, 1.8% for 2026, and 2.0% in 2027. The 2025 and 2026 forecasts reflect a downward revision, primarily on lower energy costs and exchange rate effects, even as food inflation remains persistent. Core inflation (excluding energy and food) is expected at 2.0% for both 2026 and 2027, with only minor changes since prior rounds.
- Real GDP growth in the euro area is projected at 1.1% for 2025, 1.1% for 2026, and 1.4% for 2027. A robust first quarter—partly due to firms accelerating exports ahead of anticipated tariff hikes—cushioned a weaker outlook for the remainder of 2025. While business investment continues to face uncertainty from ongoing global trade disputes, especially with the US, government investment and infrastructure spending are expected to provide some support to the outlook..
- Rising real incomes and continued strength in the labor market back household spending. Despite some fading tailwind from previous rate cuts, financing conditions remain broadly favorable and are expected to underpin the resilience of private consumption and investment against outside shocks. Moderating wage growth and profit margin adjustments are helping to absorb residual cost pressures.
- Rising real incomes and continued strength in the labor market back household spending. Despite some fading tailwind from previous rate cuts, financing conditions remain broadly favorable and are expected to underpin the resilience of private consumption and investment against outside shocks. Moderating wage growth and profit margin adjustments are helping to absorb residual cost pressures.
- All future interest rate decisions will continue to be guided by the integrated assessment of economic and financial data, the inflation outlook, and underlying inflation dynamics, and the effectiveness of monetary policy transmission—without any pre-commitment to a specific future rate path.
- The ECB’s Asset Purchase Programme (APP) and Pandemic Emergency Purchase Programme (PEPP) portfolios are declining predictably, as reinvestment of maturities has ceased. Balance-sheet normalization continues in line with the ECB’s previously communicated schedule.
- The next meeting is on 29 to 30 October 2025
Next 24 Hours Bias
Medium Bullish
The Swiss Franc (CHF)
Key news events today
No major news event
What can we expect from CHF today?
The Swiss franc’s performance reflects a convergence of supportive factors: Federal Reserve dovishness, persistent safe-haven demand, and the SNB’s cautious policy stance. While tomorrow’s SNB meeting is expected to result in unchanged rates, the franc’s structural strength appears likely to persist as global uncertainties support its safe-haven appeal. The currency’s resilience despite economic headwinds underscores its enduring role as a global stability anchor, even as traditional intervention patterns evolve under new SNB leadership.
Central Bank Notes:
- The SNB eased monetary policy by lowering its key policy rate by 25 basis points, from 0.25% to 0% on 19 June 2025, marking the sixth consecutive reduction.
- Inflationary pressure has decreased further as compared to the previous quarter, decreasing from 0.3% in February to -0.1% in May, mainly attributable to lower prices in tourism and oil products.
- Compared to March, the new conditional inflation forecast is lower in the short term. In the medium term, there is hardly any change from March, putting the average annual inflation at 0.2% for 2025, 0.5% for 2026, and 0.7% for 2027.
- The global economy continued to grow at a moderate pace in the first quarter of 2025, but the global economic outlook for the coming quarters has deteriorated due to the increase in trade tensions.
- Swiss GDP growth was strong in the first quarter of 2025, but this development was largely because, as in other countries, exports to the U.S. were brought forward.
- Following the strong first quarter, growth is likely to slow again and remain rather subdued over the remainder of the year; the SNB expects GDP growth of 1% to 1.5% for 2025 as a whole, while also anticipating GDP growth of 1% to 1.5% for 2026.
- The SNB will continue to monitor the situation closely and will adjust its monetary policy if necessary to ensure inflation remains within the range consistent with price stability over the medium term.
- The next meeting is on 25 September 2025.
Next 24 Hours Bias
Medium Bullish
The Pound (GBP)
Key news events today
No major news event
What can we expect from GBP today?
Wednesday, September 24, 2025, marked a challenging day for the British pound, with multiple headwinds converging to pressure the currency. The combination of sharply deteriorating PMI data indicating broad-based economic weakness, persistent inflation concerns, mounting fiscal pressures from record government borrowing, and cautious monetary policy from the Bank of England created a perfect storm for sterling weakness. With the November budget looming and expectations for significant tax rises growing, the pound faces continued uncertainty in the near term. Investors are closely watching for any signs of economic stabilization and clearer fiscal policy direction from the government to restore confidence in the UK’s economic outlook.
Central Bank Notes:
- The Bank of England’s Monetary Policy Committee (MPC) voted on 18 September 2025 by a majority (expected split likely 7–2 or 6–3) to hold the Bank Rate steady at 4.00%, following the August rate cut. Most members cited persistent inflation and mixed indicators on growth and employment, while a minority favored further easing due to the cooling labor market and subdued GDP growth.
- The Committee decided to decrease the pace of quantitative tightening, planning to reduce the stock of UK government bond purchases by £67.5 billion over the next 12 months instead of the prior £100 billion pace, with the gilt balance now standing near £558 billion. This reflects increased volatility in bond markets and a shift to a more gradual approach.
- Headline inflation rose unexpectedly to 3.8% in July and is projected at 4% for September, above the Bank’s 2% target. Price pressures are driven by regulated energy costs and ongoing food price increases. While previous disinflation has been substantial, core inflation remains elevated and sticky.
- The MPC expects headline inflation to remain above target through Q4, with a resumption of the downward trend projected for early 2026 as energy and regulated price pressures abate. The Committee remains watchful for signs of persistent inflation despite previous policy tightening.
- UK GDP growth is stagnant, with business and consumer activity subdued. Recent labor market data show rising unemployment rates (now at 4.7%) and stabilizing wage growth (holding near 5%), indicating slack but continued wage price pressure. The Committee remains cautious amid lackluster demand and soft survey sentiment.
- Pay growth and employment indicators have moderated further, alongside confirmation from business surveys that pay settlements are slowing. The Committee expects wage growth to decelerate significantly through Q4 and the rest of 2025.
- Global uncertainty persists due to volatile energy prices, supply chain disruptions linked to Middle East conflicts, and renewed trade tensions. The MPC remains vigilant in tracking transmission of external cost/wage shocks to UK inflation.
- Risks to inflation are considered two-sided. While subdued domestic growth and softening labor activity suggest scope for easing, persistent inflation requires caution. The MPC anticipates a slow, gradual reduction path in rates, continuing its data-dependent approach with careful adjustment as warranted by economic developments.
- The Committee’s bias remains toward maintaining a restrictive monetary policy stance until firmer evidence emerges that inflation will return sustainably to the 2% target. All future decisions will remain highly data dependent, with a strong emphasis on evolving demand, inflation expectations, costs, and labor market conditions.
- The next meeting is on 6 November 2025.
Next 24 Hours Bias
Medium Bullish
The Canadian Dollar (CAD)
Key news events today
No major news event
What can we expect from CAD today?
The Canadian dollar faces headwinds from multiple factors, including the Bank of Canada’s dovish pivot, deteriorating employment conditions, manufacturing sector weakness, and declining oil prices. The currency’s recent performance reflects these fundamental challenges, with the USD/CAD pair trading near multi-week highs. While technical indicators suggest potential for near-term consolidation, the broader outlook remains challenged by persistent economic uncertainties and unfavorable interest rate differentials with the United States.
Central Bank Notes:
- The Bank of Canada reduced its target for the overnight rate to 2.50% at its September 17 meeting, with the Bank Rate at 2.75% and the deposit rate at 2.25%. This marks the first rate cut since early 2025, as the Bank responded to a string of softer inflation prints and persistent economic headwinds.
- The Council cited continued U.S. tariff volatility and slow progress on trade negotiations as major contributors to ongoing uncertainty. While headline tariffs have not escalated further, the unpredictability of U.S. policy remains a significant risk for Canadian exports and business confidence.
- Uncertainty about U.S. trade policy and recurring tariff threats continued to weigh on growth prospects. The Bank flagged downside risks to the export sector, with survey data indicating ongoing hesitancy among manufacturers and exporters.
- After modest growth in Q1, Canada’s economy slipped into contraction, with GDP shrinking by 0.8% in Q2 and forecast to decrease again by 0.8% in Q3. Economic weakness has been most pronounced in manufacturing and goods-producing sectors affected by trade frictions and softer U.S. demand.
- Early estimates show that growth stabilized in September but remained well below the Bank’s 2% forecast for Q4. Manufacturing output has improved slightly—supported by a modest rebound in petroleum and mining activity—while consumer spending and retail sales were largely flat.
- Consumer spending remained subdued as households continued to limit discretionary purchases amid uncertainty and a slower job market. Housing activity stayed weak, despite earlier government efforts to boost affordability and modest gains in some real estate segments.
- Headline CPI inflation edged up to 1.9% in August, undershooting economist expectations but still showing emerging pressures from shelter and imported goods costs. Core inflation metrics were mixed, though price growth remains just below the Bank’s 2% target.
- The Governing Council reaffirmed its cautious approach, emphasizing that while further rate cuts are possible, the pace will hinge on the path of U.S. tariffs, domestic inflation dynamics, and signs of a sustainable recovery. The Bank remains vigilant against the risk of inflation falling below target in the face of economic slack.
- The next meeting is on 29 October 2025.
Next 24 Hours Bias
Medium Bearish
Oil
Key news events today
EIA crude oil inventories (2:30 pm GMT)
What can we expect from Oil today?
Oil prices rallied, driven by the largest U.S. inventory draw in seven weeks, continued disruption of Kurdistan oil exports, and escalating geopolitical tensions involving Russia and Ukraine. While these factors provided near-term support, the broader market faces significant challenges from OPEC+ production increases, accelerating EV adoption, displacing over 5 million bpd by 2030, and structural oversupply concerns. The market remains in a delicate balance between short-term supply disruptions and longer-term demand headwinds, with prices trading within established ranges as investors weigh competing forces.
Next 24 Hours Bias
Weak Bearish
The post IC Markets Europe Fundamental Forecast | 24 September 2025 first appeared on IC Markets | Official Blog.
Wednesday 24th September 2025: Technical Outlook and Review
421806 September 24, 2025 15:39 ICMarkets Market News
DXY (U.S. Dollar Index):
Potential Direction: Bullish
Overall momentum of the chart: Bearish
The price could make a short-term pullback toward the pivot before rising again toward the 1st resistance
Pivot: 97.14
Supporting reasons: Identified as a pullback support that aligns closely with the 50% Fibonacci retracement, where renewed buying pressure could emerge to push the price higher.
1st support: 96.47
Supporting reasons: Identified as a swing low support, indicating a potential area where the price could again stabilize.
1st resistance: 98.02
Supporting reasons: Identified as an overlap resistance, acting as a ceiling for price and potentially preventing further upward movement.
EUR/USD:
Potential Direction: Bearish
Overall momentum of the chart: Bullish
The price could see a short-term pullback toward the pivot before continuing its bearish move down toward the 1st support.
Pivot: 1.1811
Supporting reasons: Identified as a pullback resistance that aligns with the 50% Fibonacci retracement, where selling pressures could intensify and potentially cap any upward retracement.
1st support: 1.1733
Supporting reasons: Identified as an overlap support, providing a strong level where price could stabilize again if the market retraces deeper.
1st resistance: 1.1919
Supporting reasons: Identified as a swing high resistance, marking a key level that could temporarily halt upward momentum.
EUR/JPY:
Potential Direction: Bullish
Overall momentum of the chart: Bullish
The price could make a short-term pullback toward the pivot before rising again toward the 1st resistance
Pivot: 173.78
Supporting reasons: Identified as a pullback support, where renewed buying pressure could emerge to push the price higher.
1st Support: 173.09
Supporting reasons: Identified as an overlap support, marking a key stabilization zone if the price retraces deeper.
1st Resistance: 175.01
Supporting reasons: Identified as a resistance that is supported by the 161.8% Fibonacci extension, where upward momentum could face a potential barrier.
EUR/GBP:
Potential Direction: Bullish
Overall momentum of the chart: Bullish
The price could make a short-term pullback toward the pivot before rising again toward the 1st resistance
Pivot: 0.8706
Supporting reasons: Identified as a pullback support, indicating a potential area where buying interest could pick up.
1st support: 0.8669
Supporting reasons: Identified as an overlap support, providing a solid stabilization zone if price retraces.
1st resistance: 0.8763
Supporting reasons: Identified as a resistance that is supported by the 161.8% Fibonacci extension, making it a strong barrier where upward momentum could slow.
GBP/USD:
Potential Direction: Bearish
Overall momentum of the chart: Bullish
The price could see a short-term pullback toward the pivot before continuing its bearish move down toward the 1st support.
Pivot: 1.3590
Supporting reasons: Identified as a pullback resistance, where selling pressures could intensify and potentially cap any upward retracement.
1st support: 1.3458
Supporting reasons: Identified as an overlap support that aligns with the 61.8% Fibonacci retracement, indicating a potential area where the price could stabilize once more.
1st resistance: 1.3672
Supporting reasons: Identified as a swing high resistance, indicating a potential level that could halt further upward movement.
GBP/JPY:
Potential Direction: Bearish
Overall momentum of the chart: Bullish
The price could see a short-term pullback toward the pivot before continuing its bearish move down toward the 1st support.
Pivot: 200.21
Supporting reasons: Identified as a pullback resistance that aligns with the 50% Fibonacci retracement, where selling pressures could intensify and potentially cap any upward retracement.
1st support: 199.00
Supporting reasons: Identified as an overlap support, indicating a potential level where the price could stabilize once more.
1st resistance: 201.14
Supporting reasons: Identified as a swing high resistance, indicating a potential level that could halt further upward movement.
USD/CHF:
Potential Direction: Bullish
Overall momentum of the chart: Bullish
The price could make a short-term pullback toward the pivot before rising again toward the 1st resistance
Pivot: 0.7895
Supporting reasons: Identified as a pullback support, where renewed buying pressure could emerge to push the price higher.
1st support: 0.7852
Supporting reasons: Identified as a swing low suppor, indicating a potential level where the price could stabilize once again.
1st resistance: 0.7986
Supporting reasons: Identified as an overlap resistance, indicating a potential level that could cap further upward movement.
USD/JPY:
Potential Direction: Bullish
Overall momentum of the chart: Bullish
The price could make a short-term pullback toward the pivot before rising again toward the 1st resistance
Pivot: 147.07
Supporting reasons: Identified as a pullback support, where renewed buying pressure could emerge to push the price higher.
1st support: 145.87
Supporting reasons: Identified as a swing low support, indicating a potential area where the price could again stabilize.
1st resistance: 148.77
Supporting reasons: Identified as a multi swing high resistance, acting as a ceiling for price and potentially preventing further upward movement.
USD/CAD:
Potential Direction: Bearish
Overall momentum of the chart: Bearish
The price could see a short-term pullback toward the pivot before continuing its bearish move down toward the 1st support.
Pivot: 1.3832
Supporting reasons: Identified as a pullback resistance that aligns with the 61.8% Fibonacci retracement, where selling pressures could intensify and potentially cap any upward retracement.
1st support: 1.3770
Supporting reasons: Identified as an overlap, indicating a potential area where the price could again stabilize.
1st resistance: 1.3917
Supporting reasons: Identified as a swing high resistance, acting as a ceiling for price and potentially preventing further upward movement.
AUD/USD:
Potential Direction: Bearish
Overall momentum of the chart: Bullish
The price could see a short-term pullback toward the pivot before continuing its bearish move down toward the 1st support.
Pivot: 0.6637
Supporting reasons: Identified as a pullback resistance, where selling pressures could intensify and potentially cap any upward retracement.
1st support: 0.6558
Supporting reasons: Identified as a pullback support that aligns closely with the 61.8% Fibonacci retracement, providing a strong level where price could stabilize again if the market retraces deeper.
1st resistance: 0.6689
Supporting reasons: Identified as a swing high resistance, marking a key level that could temporarily halt upward momentum.
NZD/USD
Potential Direction: Bearish
Overall momentum of the chart: Bullish
The price could see a short-term pullback toward the pivot before continuing its bearish move down toward the 1st support.
Pivot: 0.5915
Supporting reasons: Identified as a pullback resistance that aligns closely with the 50% Fibonacci retracement, where selling pressures could intensify and potentially cap any upward retracement.
1st support: 0.5837
Supporting reasons: Identified as a swing low support, providing a strong level where price could stabilize again if the market retraces deeper.
1st resistance: 0.5946
Supporting reasons: Identified as a pullback resistance, marking a key level that could temporarily halt upward momentum.
US30 (DJIA):
Potential Direction: Bullish
Overall momentum of the chart: Bullish
The price could make a short-term pullback toward the pivot before rising again toward the 1st resistance
Pivot: 46,123.56
Supporting reasons: Identified as an overlap support, where renewed buying pressure could emerge to push the price higher.
1st support: 45,756.51
Supporting reasons: Identified as an overlap support, providing a solid stabilization zone if price retraces.
1st resistance: 46,704.98
Supporting reasons: Identified as a swing high resistance, making it a strong barrier where upward momentum could slow.
DE40 (DAX):
Potential Direction: Bearish
Overall momentum of the chart: Bullish
The price could see a short-term pullback toward the pivot before continuing its bearish move down toward the 1st support.
Pivot: 23,479.66
Supporting reasons: Identified as an overlap resistance, where selling pressures could intensify and potentially cap any upward retracement.
1st support: 23,317.44
Supporting reasons: Identified as a multi swing low support, indicating a key level where the price could stabilize once more.
1st resistance: 23,873.56
Supporting reasons: Identified as an overlap resistance, indicating a potential area that could halt any further upward movement.
US500 (S&P 500):
Potential Direction: Bullish
Overall momentum of the chart: Bullish
The price could make a short-term pullback toward the pivot before rising again toward the 1st resistance
Pivot: 6,65.64
Supporting reasons: Identified as a pullback support, where renewed buying pressure could emerge to push the price higher.
1st support: 6,594.19
Supporting reasons: Identified as an overlap support, providing a strong level where price could stabilize again if the market retraces deeper.
1st resistance: 6,696.24
Supporting reasons: Identified as a swing high resistance, marking a key level that could temporarily halt upward momentum.
BTC/USD (Bitcoin):
Potential Direction: Bearish
Overall momentum of the chart: Bullish
The price could see a short-term pullback toward the pivot before continuing its bearish move down toward the 1st support.
Pivot: 114,486.46
Supporting reasons: Identified as a pullback resistance, where selling pressures could intensify and potentially cap any upward retracement.
1st support: 109.777.81
Supporting reasons: Identified as an overlap support that aligns with the 78.6% Fibonacci retracement, providing a strong level where price could stabilize again if the market retraces deeper.
1st resistance: 117.415.29
Supporting reasons: Identified as a swing high resistance, marking a key level that could temporarily halt upward momentum.
ETH/USD (Ethereum):
Potential Direction: Bearish
Overall momentum of the chart: Bullish
The price could see a short-term pullback toward the pivot before continuing its bearish move down toward the 1st support.
Pivot: 4,261.33
Supporting reasons: Identified as a pullback resistance, where selling pressures could intensify and potentially cap any upward retracement.
1st support: 3,923.17
Supporting reasons: Identified as a pullback support that aligns with the 161.8% Fibonacci retracement, providing a solid stabilization zone if the price retraces.
1st resistance: 4,477.54
Supporting reasons: Identified as an overlap resistance, making it a strong barrier where upward momentum could slow.
WTI/USD (Oil):
Potential Direction: Bullish
Overall momentum of the chart: Bullish
The price could make a short-term pullback toward the pivot before rising again toward the 1st resistance
Pivot: 63.50
Supporting reasons: Identified as a pullback support, where renewed buying pressure could emerge to push the price higher.
1st support: 62.09
Supporting reasons: Identified as a multi swing low support, providing a strong level where price could stabilize again if the market retraces deeper.
1st resistance: 64.99
Supporting reasons: Identified as a pullback resistance, marking a key level that could temporarily halt upward momentum.
XAU/USD (GOLD):
Potential Direction: Bullish
Overall momentum of the chart: Bullish
The price could make a short-term pullback toward the pivot before rising again toward the 1st resistance
Pivot: 3,699.30
Supporting reasons: Identified as a pullback support that aligns closely with the 50% Fibonacci retracement, where renewed buying pressure could emerge to push the price higher.
1st support: 3,654.40
Supporting reasons: Identified as a pullback support, providing a strong level where price could stabilize again if the market retraces deeper.
1st resistance: 3,784.06
Supporting reasons: Identified as a multi-swing high resistance, marking a key level that could temporarily halt upward momentum.
The accuracy, completeness and timeliness of the information contained on this site cannot be guaranteed. IC Markets does not warranty, guarantee or make any representations, or assume any liability regarding financial results based on the use of the information in the site.
News, views, opinions, recommendations and other information obtained from sources outside of www.icmarkets.com, used in this site are believed to be reliable, but we cannot guarantee their accuracy or completeness. All such information is subject to change at any time without notice. IC Markets assumes no responsibility for the content of any linked site.
The fact that such links may exist does not indicate approval or endorsement of any material contained on any linked site. IC Markets is not liable for any harm caused by the transmission, through accessing the services or information on this site, of a computer virus, or other computer code or programming device that might be used to access, delete, damage, disable, disrupt or otherwise impede in any manner, the operation of the site or of any user’s software, hardware, data or property.
The post Wednesday 24th September 2025: Technical Outlook and Review first appeared on IC Markets | Official Blog.
Ex-Dividend 24/9/2025
421770 September 23, 2025 17:00 ICMarkets Market News
The post Ex-Dividend 24/9/2025 first appeared on IC Markets | Official Blog.
General Market Analysis – 23/09/25
421762 September 23, 2025 14:14 ICMarkets Market News
US Stocks Push to Record Levels Again – Nasdaq up 0.7%
US stocks kicked off the week on the front foot yesterday, with all three major indices closing at fresh record highs. The Dow added 0.14% to finish at 46,381, the S&P gained 0.44% to 6,693, while the Nasdaq led the charge with a 0.70% jump to 22,788. The dollar softened, with the DXY slipping 0.32% to 97.32, as traders digested a busy slate of Fed commentary. Conversely, Treasury yields edged higher, with the 2-year up 3.1 bps to 3.603% and the 10-year climbing 1.9 bps to 4.147%. Commodities were mixed; oil held steady, with Brent down 0.14% at $66.59 and WTI off 0.13% at $62.32, while gold stole the show, surging 1.66% to $3,746.70 to break further into uncharted territory.
The 2025 Gold Rush Continues
Gold powered higher to new all-time highs in trading yesterday in what were otherwise fairly quiet market conditions. It had closed on Friday just shy of the previous record level, just above $3,700 an ounce, but the flow was all one-way traffic for most of the day as it added 1.66% to close just under $3,750. What initially looked like a stop-loss run continued through the trading day, and for now there seems to be no respite in the world’s favourite precious metal’s ascent. At the moment, there doesn’t seem to be a solid fundamental reason for the move, which probably means we are seeing a big portfolio reallocation. Some commentators are pointing to the Fed cut as the driver of the move, but we certainly haven’t seen that kind of reaction from the dollar or US yields since last week. For now, traders will have to continue to trade what they see in front of them, and at the moment that appears to be more topside and fresh highs for gold.
PMI Data in Focus for Traders with a Touch of Fed
It’s PMI day again, with flash manufacturing and services numbers due out across the globe. Data from Australia, France, Germany, the Eurozone, the UK, and the US will all be digested. The numbers should give a clearer read on growth momentum heading into the final quarter of the year, and traders are expecting to see moves in local markets if anything comes in significantly off expectations. We also have more central banker updates due today: the Bank of England’s Chief Economist, Huw Pill, speaks during the London session, but the highlight is likely to come later in the day when we hear from FOMC Chairman Jerome Powell for the first time since last week’s Fed meeting.
The post General Market Analysis – 23/09/25 first appeared on IC Markets | Official Blog.
The Week Ahead – Week Commencing 22 September 2025
421756 September 23, 2025 14:14 ICMarkets Market News
Stock markets again closed out the week on or near all-time highs as investor confidence in the States pushed higher after the Fed delivered its first interest rate cut for the year on Wednesday. Global markets jumped on the US bandwagon, and investors are hoping for more of the same in the week ahead.
There is a good mix of data and central bank updates in the coming days, although this week the latter will be from verbal updates as various committee members are let off their meeting curfews to share their thoughts with us after a raft of rate decisions over the last few days.
Traders are expecting plenty of volatility across financial products, with risk events spread nicely across the next few days as well as the high potential for more geopolitical surprises to keep them on their toes.
Here is our usual day-by-day breakdown of the major risk events this week:

There is a raft of central bank speakers on Monday to kick off the week, with the highlights likely to be the RBA’s Governor Michele Bullock, who speaks early in the Asian session, and the BOE’s Andrew Bailey, who speaks towards the end of the day. We also have Chinese Loan Prime Rate updates later in the session, which could see moves in local markets. We are hit hard and fast with central banker updates during the London and New York sessions, with the MPC’s Pill and the Buba’s Nagel speaking earlier in the day, followed by the Fed’s Williams, Musalem, Miran, Barkin, and Hammock.

It is PMI day on Tuesday, with Flash Manufacturing and Services data due out across the globe, including updates from Australia, France, Germany, the EU, the UK, and the US. More central bankers are in action as well, with the MPC’s Pill again on the rostrum along with the Fed’s Bostic, but the highlight is likely to be when we hear from Fed Chair Jerome Powell towards the end of the day.

The initial focus in Asia will be on Australian markets, with the key CPI data due out early in the piece. We have German IFO numbers and US New Home Sales data out later in the day, but traders are expecting a quieter day overall.

It’s a relatively quiet calendar start to the day on Thursday with not much scheduled; however, all eyes will be on Swiss markets early in the London session with the Swiss National Bank set to announce its latest interest rate decision. There is a plethora of US data due later in the day, with Final GDP, Weekly Unemployment Claims, Durable Goods, and Existing Home Sales numbers all due to be released. We also hear from Fed members Goolsbee, Williams, Bowman, Barr, Logan, and Daly during the session.

Japanese markets will be in focus for the Asian session, with the key Tokyo Core CPI numbers due out. There is little of note due out in the European session, but we do have probably the most impactful data event scheduled just after the New York open, with the US Core PCE Price Index number due out. This comes alongside the Canadian GDP number, but expect the US inflation number to have a greater impact. The Fed’s Barkin and Bowman also speak again during the afternoon.
The post The Week Ahead – Week Commencing 22 September 2025 first appeared on IC Markets | Official Blog.
Tuesday 23th September 2025: Asian Stocks Trade Mixed; Australia Rises on Fed Rate Cut Hopes
421755 September 23, 2025 14:00 ICMarkets Market News
Global Markets:
- Asian Stock Markets : Nikkei up 0.99%, Shanghai Composite down -1.18%, Hang Seng down -1.02% ASX up 0.45%
- Commodities : Gold at $3,781.47 (0.17%), Silver at $44.308 (0.21%), Brent Oil at $66.24 (-0.50%), WTI Oil at $61.99 (-0.47%)
- Rates : US 10-year yield at 4.145, UK 10-year yield at 4.7110, Germany 10-year yield at 2.7481
News & Data:
- (EURz Consumer confidence -15 to -15 expected
Markets Update:
Asian stock markets traded mixed on Tuesday, tracking the broadly positive cues from Wall Street overnight. Optimism over potential U.S. Federal Reserve rate cuts supported sentiment, though lingering geopolitical tensions in Europe and the Middle East limited gains. Markets across Asia had also ended mixed on Monday.
After reducing rates by a quarter point last week, the Fed is expected to deliver similar cuts at its October and December meetings. Investors are awaiting the release of the Fed’s preferred consumer price inflation data later in the day, while remarks from Fed officials, including Chair Jerome Powell, could influence the outlook.
In Australia, equities advanced for a third straight session. The benchmark S&P/ASX 200 rose 39.70 points or 0.45 percent to 8,850.60, supported by mining, technology, and banking stocks. The All Ordinaries gained 38.80 points or 0.43 percent.
Among miners, BHP and Rio Tinto edged up 0.5 percent each, while Mineral Resources climbed 2 percent. Gold producers also outperformed, led by Resolute Mining’s nearly 5 percent surge. Banks traded higher across the board. Meanwhile, Myer shares tumbled almost 28 percent after reporting weaker net profit, while Telix Pharmaceuticals soared over 8 percent on regulatory approval news.
Elsewhere, Taiwan gained 1.2 percent, while Singapore, South Korea, and Malaysia posted modest advances. However, China, Hong Kong, New Zealand, and Indonesia declined. Japanese markets were closed for a holiday.
On Wall Street, major indices closed at record highs, led by gains in technology stocks.
Upcoming Events:
- 01:45 PM GMT – USD Core Retail Sales m/m
- 01:45 PM GMT – USD Retail Sales m/m
- 04:35 PM GMT – USD Fed Chail Powell speaks
The post Tuesday 23th September 2025: Asian Stocks Trade Mixed; Australia Rises on Fed Rate Cut Hopes first appeared on IC Markets | Official Blog.
IC Markets Europe Fundamental Forecast | 23 September 2025
421754 September 23, 2025 14:00 ICMarkets Market News
IC Markets Europe Fundamental Forecast | 23 September 2025
What happened in the Asia session?
Tuesday’s Asia session was characterized by continued technology sector leadership driven by AI optimism, while traditional economic indicators showed mixed signals. The session highlighted the divergence between high-growth tech sectors and broader economic fundamentals, with investors closely monitoring upcoming PMI data and central bank communications for future market direction.
What does it mean for the Europe & US sessions?
Today’s trading sessions feature a critical confluence of economic data and central bank communications. European markets await Flash PMI readings that will provide the first major snapshots of September economic trends, while U.S. traders focus on Fed Chair Powell’s speech and Current Account data. The backdrop includes record-high gold prices, pressured oil markets, and continued currency volatility as central banks navigate the complex balance between growth support and inflation control. Market participants should monitor PMI data for signs of economic resilience or weakness, while Fed communications may provide crucial insights into the pace of future rate cuts.
The Dollar Index (DXY)
Key news events today
Flash manufacturing PMI (1:45 pm GMT)
Flash services PMI (1:45 pm GMT)
Richmond manufacturing index (2:00 pm GMT)
Fed Chair Powell speaks (4:35 pm GMT)
What can we expect from DXY today?
The US Dollar is facing a complex set of cross-currents. While Fed officials are adopting a more cautious tone on rate cuts and Treasury yields are rising, the dollar remains under pressure from policy uncertainties, including the risk of a government shutdown, immigration policy changes, and ongoing tariff impacts. Chair Powell’s speech today will be critical in clarifying the Fed’s policy trajectory, while the upcoming PMI data will provide insights into economic momentum. Together, these factors suggest continued volatility for the dollar in the near term.
Central Bank Notes:
- The Federal Open Market Committee (FOMC) voted, by majority, to lower the federal funds rate target range by 25 basis points to 4.00%–4.25% at its September 16–17, 2025, meeting, marking the first policy rate adjustment since December 2024 after five consecutive holds.
- The Committee maintained its long-term objective of achieving maximum employment and 2% inflation, acknowledging recent labor market softening and continued tariff-driven price pressures.
- Policymakers expressed elevated concern about downside risks to growth, citing a stalling labor market, modest job creation, and an unemployment rate drifting up toward 4.4%. At the same time, inflation remains above target, with CPI at 3.2% and core inflation at 3.1% as of August 2025; higher energy and food prices, largely attributable to tariffs, continue to weigh on headline measures.
- Although economic activity expanded at a moderate pace in the third quarter, the growth outlook has weakened. Q3 GDP growth is estimated near 1.0% (annualized), with full-year 2025 GDP growth guidance revised to 1.2%, reflecting slowing household consumption and tighter financial conditions.
- In the updated Summary of Economic Projections, the unemployment rate is projected to average 4.5% for the year, with headline PCE inflation revised up slightly to 3.1% for 2025. The Committee anticipates core PCE inflation to remain stubborn, requiring sustained vigilance and a flexible approach to risk management.
- The Committee reiterated its data-dependent approach and openness to further adjustments should employment or inflation deviate meaningfully from current forecasts. Several members dissented, either advocating a larger 50-basis-point cut or preferring no adjustment at this meeting, revealing heightened divergence within the Committee.
- Balance sheet reduction continues at a measured pace. The monthly Treasury redemption cap remains at $5B and the agency MBS cap at $35B, as the Board aims to support orderly market conditions in the face of evolving global and domestic uncertainty
- The next meeting is scheduled for 28 to 29 October 2025.
Next 24 Hours Bias
Medium Bearish
Gold (XAU)
Key news events today
Flash manufacturing PMI (1:45 pm GMT)
Flash services PMI (1:45 pm GMT)
Richmond manufacturing index (2:00 pm GMT)
Fed Chair Powell speaks (4:35 pm GMT)
What can we expect from Gold today?
Gold’s record-breaking rally on September 23, 2025, reflects a convergence of supportive factors, including Federal Reserve policy expectations, persistent central bank buying, escalating geopolitical tensions, and structural shifts in global monetary systems. With Chair Powell’s speech today and Friday’s critical PCE inflation data, the precious metal faces near-term volatility while maintaining strong fundamental support from both institutional and safe-haven demand.
Next 24 Hours Bias
Medium Bullish
The Euro (EUR)
Key news events today
French flash manufacturing PMI (7:15 am GMT)
French flash services PMI (7:15 am GMT)
German flash manufacturing PMI (7:30 am GMT)
German flash services PMI (7:30 am GMT)
Flash manufacturing PMI (8:00 am GMT)
Flash services PMI (8:00 am GMT)
What can we expect from EUR today?
The Euro enters the final quarter of 2025 from a position of relative strength, buoyed by dollar weakness and Fed easing expectations. However, domestic challenges, including French political paralysis, slowing economic momentum, and stalled reforms to enhance the currency’s global status, present significant headwinds. While the technical outlook remains constructive with EUR/USD trading near multi-year highs, the currency’s medium-term trajectory will largely depend on Europe’s ability to address its political divisions and economic challenges while capitalizing on the ongoing shift in global monetary policy dynamics.
Central Bank Notes:
- The Governing Council kept the three key ECB interest rates unchanged at its September 11, 2025, meeting. The main refinancing rate remains at 2.15%, the marginal lending facility at 2.40%, and the deposit facility at 2.00%. These levels have been maintained after the cuts earlier in 2025, reflecting the Council’s confidence that the current stance is consistent with the price stability mandate.
- Evidence that inflation is running close to the ECB’s medium-term target of 2% supported the decision to hold rates steady. Domestic price pressures are easing as wage growth continues to moderate, and financing conditions remain accommodative. Policymakers reaffirmed a data-dependent, meeting-by-meeting approach to further policy moves, with no pre-commitment to a predetermined path amid ongoing global and domestic risks.
- Eurosystem staff projections foresee headline inflation averaging 2.0% for 2025, 1.8% for 2026, and 2.0% in 2027. The 2025 and 2026 forecasts reflect a downward revision, primarily on lower energy costs and exchange rate effects, even as food inflation remains persistent. Core inflation (excluding energy and food) is expected at 2.0% for both 2026 and 2027, with only minor changes since prior rounds.
- Real GDP growth in the euro area is projected at 1.1% for 2025, 1.1% for 2026, and 1.4% for 2027. A robust first quarter—partly due to firms accelerating exports ahead of anticipated tariff hikes—cushioned a weaker outlook for the remainder of 2025. While business investment continues to face uncertainty from ongoing global trade disputes, especially with the US, government investment and infrastructure spending are expected to provide some support to the outlook..
- Rising real incomes and continued strength in the labor market back household spending. Despite some fading tailwind from previous rate cuts, financing conditions remain broadly favorable and are expected to underpin the resilience of private consumption and investment against outside shocks. Moderating wage growth and profit margin adjustments are helping to absorb residual cost pressures.
- Rising real incomes and continued strength in the labor market back household spending. Despite some fading tailwind from previous rate cuts, financing conditions remain broadly favorable and are expected to underpin the resilience of private consumption and investment against outside shocks. Moderating wage growth and profit margin adjustments are helping to absorb residual cost pressures.
- All future interest rate decisions will continue to be guided by the integrated assessment of economic and financial data, the inflation outlook, and underlying inflation dynamics, and the effectiveness of monetary policy transmission—without any pre-commitment to a specific future rate path.
- The ECB’s Asset Purchase Programme (APP) and Pandemic Emergency Purchase Programme (PEPP) portfolios are declining predictably, as reinvestment of maturities has ceased. Balance-sheet normalization continues in line with the ECB’s previously communicated schedule.
- The next meeting is on 29 to 30 October 2025
Next 24 Hours Bias
Medium Bullish
The Swiss Franc (CHF)
Key news events today
No major news event
What can we expect from CHF today?
The Swiss franc enters the SNB’s September 25 policy meeting from a position of considerable strength, trading near multi-year highs against the dollar. While the central bank is widely expected to pause its easing cycle at 0%, the franc’s resilience reflects both traditional safe-haven demand and structural factors, including Switzerland’s fiscal discipline and monetary policy credibility. The currency’s strength continues to create deflationary pressures domestically while supporting its role as a hedge against global economic uncertainty and currency debasement concerns.
Central Bank Notes:
- The SNB eased monetary policy by lowering its key policy rate by 25 basis points, from 0.25% to 0% on 19 June 2025, marking the sixth consecutive reduction.
- Inflationary pressure has decreased further as compared to the previous quarter, decreasing from 0.3% in February to -0.1% in May, mainly attributable to lower prices in tourism and oil products.
- Compared to March, the new conditional inflation forecast is lower in the short term. In the medium term, there is hardly any change from March, putting the average annual inflation at 0.2% for 2025, 0.5% for 2026, and 0.7% for 2027.
- The global economy continued to grow at a moderate pace in the first quarter of 2025, but the global economic outlook for the coming quarters has deteriorated due to the increase in trade tensions.
- Swiss GDP growth was strong in the first quarter of 2025, but this development was largely because, as in other countries, exports to the U.S. were brought forward.
- Following the strong first quarter, growth is likely to slow again and remain rather subdued over the remainder of the year; the SNB expects GDP growth of 1% to 1.5% for 2025 as a whole, while also anticipating GDP growth of 1% to 1.5% for 2026.
- The SNB will continue to monitor the situation closely and will adjust its monetary policy if necessary to ensure inflation remains within the range consistent with price stability over the medium term.
- The next meeting is on 25 September 2025.
Next 24 Hours Bias
Medium Bullish
The Pound (GBP)
Key news events today
Flash manufacturing PMI (8:30 am GMT)
Flash services PMI (8:30 am GMT)
What can we expect from GBP today?
The British pound faces a challenging environment as fiscal concerns overshadow modest economic improvements. While the currency showed resilience on Monday, the combination of elevated borrowing figures, speculation about significant tax rises in November, and cautious Bank of England policy stance continues to weigh on sterling. Market focus remains firmly fixed on the November Budget, with analysts suggesting limited appetite for trading UK macro news until fiscal clarity emerges. The pound’s near-term trajectory will likely depend heavily on today’s PMI data and any signals from policymakers about the government’s fiscal strategy.
Central Bank Notes:
- The Bank of England’s Monetary Policy Committee (MPC) voted on 18 September 2025 by a majority (expected split likely 7–2 or 6–3) to hold the Bank Rate steady at 4.00%, following the August rate cut. Most members cited persistent inflation and mixed indicators on growth and employment, while a minority favored further easing due to the cooling labor market and subdued GDP growth.
- The Committee decided to decrease the pace of quantitative tightening, planning to reduce the stock of UK government bond purchases by £67.5 billion over the next 12 months instead of the prior £100 billion pace, with the gilt balance now standing near £558 billion. This reflects increased volatility in bond markets and a shift to a more gradual approach.
- Headline inflation rose unexpectedly to 3.8% in July and is projected at 4% for September, above the Bank’s 2% target. Price pressures are driven by regulated energy costs and ongoing food price increases. While previous disinflation has been substantial, core inflation remains elevated and sticky.
- The MPC expects headline inflation to remain above target through Q4, with a resumption of the downward trend projected for early 2026 as energy and regulated price pressures abate. The Committee remains watchful for signs of persistent inflation despite previous policy tightening.
- UK GDP growth is stagnant, with business and consumer activity subdued. Recent labor market data show rising unemployment rates (now at 4.7%) and stabilizing wage growth (holding near 5%), indicating slack but continued wage price pressure. The Committee remains cautious amid lackluster demand and soft survey sentiment.
- Pay growth and employment indicators have moderated further, alongside confirmation from business surveys that pay settlements are slowing. The Committee expects wage growth to decelerate significantly through Q4 and the rest of 2025.
- Global uncertainty persists due to volatile energy prices, supply chain disruptions linked to Middle East conflicts, and renewed trade tensions. The MPC remains vigilant in tracking transmission of external cost/wage shocks to UK inflation.
- Risks to inflation are considered two-sided. While subdued domestic growth and softening labor activity suggest scope for easing, persistent inflation requires caution. The MPC anticipates a slow, gradual reduction path in rates, continuing its data-dependent approach with careful adjustment as warranted by economic developments.
- The Committee’s bias remains toward maintaining a restrictive monetary policy stance until firmer evidence emerges that inflation will return sustainably to the 2% target. All future decisions will remain highly data dependent, with a strong emphasis on evolving demand, inflation expectations, costs, and labor market conditions.
- The next meeting is on 6 November 2025.
Next 24 Hours Bias
Medium Bullish
The Canadian Dollar (CAD)
Key news events today
No major news event
What can we expect from CAD today?
The Canadian dollar faces a complex environment balancing between economic recovery signs (retail sales rebound) and persistent challenges (manufacturing contraction, labour market weakness). While the Bank of Canada’s dovish stance and ongoing trade uncertainties weigh on the currency, improving consumer spending and potential Fed rate cuts provide some support. Governor Macklem’s speech today will be crucial for providing direction on how the central bank plans to navigate current trade and economic challenges, potentially influencing CAD volatility in the near term.
Central Bank Notes:
- The Bank of Canada reduced its target for the overnight rate to 2.50% at its September 17 meeting, with the Bank Rate at 2.75% and the deposit rate at 2.25%. This marks the first rate cut since early 2025, as the Bank responded to a string of softer inflation prints and persistent economic headwinds.
- The Council cited continued U.S. tariff volatility and slow progress on trade negotiations as major contributors to ongoing uncertainty. While headline tariffs have not escalated further, the unpredictability of U.S. policy remains a significant risk for Canadian exports and business confidence.
- Uncertainty about U.S. trade policy and recurring tariff threats continued to weigh on growth prospects. The Bank flagged downside risks to the export sector, with survey data indicating ongoing hesitancy among manufacturers and exporters.
- After modest growth in Q1, Canada’s economy slipped into contraction, with GDP shrinking by 0.8% in Q2 and forecast to decrease again by 0.8% in Q3. Economic weakness has been most pronounced in manufacturing and goods-producing sectors affected by trade frictions and softer U.S. demand.
- Early estimates show that growth stabilized in September but remained well below the Bank’s 2% forecast for Q4. Manufacturing output has improved slightly—supported by a modest rebound in petroleum and mining activity—while consumer spending and retail sales were largely flat.
- Consumer spending remained subdued as households continued to limit discretionary purchases amid uncertainty and a slower job market. Housing activity stayed weak, despite earlier government efforts to boost affordability and modest gains in some real estate segments.
- Headline CPI inflation edged up to 1.9% in August, undershooting economist expectations but still showing emerging pressures from shelter and imported goods costs. Core inflation metrics were mixed, though price growth remains just below the Bank’s 2% target.
- The Governing Council reaffirmed its cautious approach, emphasizing that while further rate cuts are possible, the pace will hinge on the path of U.S. tariffs, domestic inflation dynamics, and signs of a sustainable recovery. The Bank remains vigilant against the risk of inflation falling below target in the face of economic slack.
- The next meeting is on 29 October 2025.
Next 24 Hours Bias
Medium Bearish
Oil
Key news events today
API crude oil stock (8:30 pm GMT)
What can we expect from Oil today?
The oil market on September 23, 2025, was characterized by persistent bearish sentiment driven primarily by oversupply concerns outweighing geopolitical risks. The key developments include the Iraq-Kurdistan pipeline restart agreement, adding 230,000 bpd to global supply, continued OPEC+ production increases, and new EU sanctions on Russian energy, effective in 2027. Despite ongoing tensions in the Middle East and Europe, these geopolitical factors have failed to provide sustainable price support as markets focus on the anticipated global oil surplus in late 2025 and 2026.
Next 24 Hours Bias
Weak Bearish
The post IC Markets Europe Fundamental Forecast | 23 September 2025 first appeared on IC Markets | Official Blog.
Tuesday 23th September 2025: Technical Outlook and Review
421741 September 23, 2025 13:39 ICMarkets Market News
DXY (U.S. Dollar Index):
Potential Direction: Bullish
Overall momentum of the chart: Bearish
The price could make a short-term pullback toward the pivot before rising again toward the 1st resistance
Pivot: 97.14
Supporting reasons: Identified as a pullback support that aligns closely with the 50% Fibonacci retracement, where renewed buying pressure could emerge to push the price higher.
1st support: 96.47
Supporting reasons: Identified as a swing low support, indicating a potential area where the price could again stabilize.
1st resistance: 98.02
Supporting reasons: Identified as an overlap resistance, acting as a ceiling for price and potentially preventing further upward movement.
EUR/USD:
Potential Direction: Bearish
Overall momentum of the chart: Bullish
The price could see a short-term pullback toward the pivot before continuing its bearish move down toward the 1st support.
Pivot: 1.1811
Supporting reasons: Identified as a pullback resistance that aligns with the 38.2% Fibonacci retracement, where selling pressures could intensify and potentially cap any upward retracement.
1st support: 1.1678
Supporting reasons: Identified as an overlap support, providing a strong level where price could stabilize again if the market retraces deeper.
1st resistance: 1.1919
Supporting reasons: Identified as a swing high resistance, marking a key level that could temporarily halt upward momentum.
EUR/JPY:
Potential Direction: Bullish
Overall momentum of the chart: Bullish
The price could make a short-term pullback toward the pivot before rising again toward the 1st resistance
Pivot: 173.78
Supporting reasons: Identified as a pullback support, where renewed buying pressure could emerge to push the price higher.
1st Support: 173.09
Supporting reasons: Identified as an overlap support, marking a key stabilization zone if the price retraces deeper.
1st Resistance: 175.01
Supporting reasons: Identified as a resistance that is supported by the 161.8% Fibonacci extension, where upward momentum could face a potential barrier.
EUR/GBP:
Potential Direction: Bullish
Overall momentum of the chart: Bullish
The price could make a short-term pullback toward the pivot before rising again toward the 1st resistance
Pivot: 0.8706
Supporting reasons: Identified as a pullback support, indicating a potential area where buying interest could pick up.
1st support: 0.8669
Supporting reasons: Identified as an overlap support, providing a solid stabilization zone if price retraces.
1st resistance: 0.8763
Supporting reasons: Identified as a resistance that is supported by the 161.8% Fibonacci extension, making it a strong barrier where upward momentum could slow.
GBP/USD:
Potential Direction: Bearish
Overall momentum of the chart: Bullish
The price could see a short-term pullback toward the pivot before continuing its bearish move down toward the 1st support.
Pivot: 1.3590
Supporting reasons: Identified as a pullback resistance, where selling pressures could intensify and potentially cap any upward retracement.
1st support: 1.3458
Supporting reasons: Identified as an overlap support that aligns with the 61.8% Fibonacci retracement, indicating a potential area where the price could stabilize once more.
1st resistance: 1.3672
Supporting reasons: Identified as a swing high resistance, indicating a potential level that could halt further upward movement.
GBP/JPY:
Potential Direction: Bearish
Overall momentum of the chart: Bullish
The price could see a short-term pullback toward the pivot before continuing its bearish move down toward the 1st support.
Pivot: 200.21
Supporting reasons: Identified as a pullback resistance that aligns with the 50% Fibonacci retracement, where selling pressures could intensify and potentially cap any upward retracement.
1st support: 199.00
Supporting reasons: Identified as an overlap support, indicating a potential level where the price could stabilize once more.
1st resistance: 201.14
Supporting reasons: Identified as a swing high resistance, indicating a potential level that could halt further upward movement.
USD/CHF:
Potential Direction: Bullish
Overall momentum of the chart: Bullish
The price could make a short-term pullback toward the pivot before rising again toward the 1st resistance
Pivot: 0.7895
Supporting reasons: Identified as a pullback support, where renewed buying pressure could emerge to push the price higher.
1st support: 0.7851
Supporting reasons: Identified as a swing low support that aligns with the 100% Fibonacci projection, indicating a potential level where the price could stabilize once again.
1st resistance: 0.7986
Supporting reasons: Identified as an overlap resistance, indicating a potential level that could cap further upward movement.
USD/JPY:
Potential Direction: Bullish
Overall momentum of the chart: Bullish
The price could make a short-term pullback toward the pivot before rising again toward the 1st resistance
Pivot: 147.07
Supporting reasons: Identified as a pullback support, where renewed buying pressure could emerge to push the price higher.
1st support: 145.87
Supporting reasons: Identified as a swing low support, indicating a potential area where the price could again stabilize.
1st resistance: 149.00
Supporting reasons: Identified as an overlap resistance that aligns with the 127.2% Fibonacci extension, acting as a ceiling for price and potentially preventing further upward movement.
USD/CAD:
Potential Direction: Bearish
Overall momentum of the chart: Bearish
The price could see a short-term pullback toward the pivot before continuing its bearish move down toward the 1st support.
Pivot: 1.3828
Supporting reasons: Identified as a pullback resistance that aligns with the 61.8% Fibonacci retracement, where selling pressures could intensify and potentially cap any upward retracement.
1st support: 1.3770
Supporting reasons: Identified as an overlap, indicating a potential area where the price could again stabilize.
1st resistance: 1.3875
Supporting reasons: Identified as an overlap resistance, acting as a ceiling for price and potentially preventing further upward movement.
AUD/USD:
Potential Direction: Bearish
Overall momentum of the chart: Bullish
The price could see a short-term pullback toward the pivot before continuing its bearish move down toward the 1st support.
Pivot: 0.6637
Supporting reasons: Identified as a pullback resistance, where selling pressures could intensify and potentially cap any upward retracement.
1st support: 0.6558
Supporting reasons: Identified as a pullback support that aligns closely with the 61.8% Fibonacci retracement, providing a strong level where price could stabilize again if the market retraces deeper.
1st resistance: 0.6689
Supporting reasons: Identified as a swing high resistance, marking a key level that could temporarily halt upward momentum.
NZD/USD
Potential Direction: Bearish
Overall momentum of the chart: Bullish
The price could see a short-term pullback toward the pivot before continuing its bearish move down toward the 1st support.
Pivot: 0.5915
Supporting reasons: Identified as a pullback resistance that aligns closely with the 50% Fibonacci retracement, where selling pressures could intensify and potentially cap any upward retracement.
1st support: 0.5837
Supporting reasons: Identified as a swing low support, providing a strong level where price could stabilize again if the market retraces deeper.
1st resistance: 0.5946
Supporting reasons: Identified as a pullback resistance, marking a key level that could temporarily halt upward momentum.
US30 (DJIA):
Potential Direction: Bullish
Overall momentum of the chart: Bullish
The price could make a short-term pullback toward the pivot before rising again toward the 1st resistance
Pivot: 46,123.56
Supporting reasons: Identified as an overlap support, where renewed buying pressure could emerge to push the price higher.
1st support: 45,756.51
Supporting reasons: Identified as an overlap support, providing a solid stabilization zone if price retraces.
1st resistance: 46,443.48
Supporting reasons: Identified as a swing high resistance that aligns with the 161.8% Fibonacci extension, making it a strong barrier where upward momentum could slow.
DE40 (DAX):
Potential Direction: Bearish
Overall momentum of the chart: Bullish
The price could see a short-term pullback toward the pivot before continuing its bearish move down toward the 1st support.
Pivot: 23,594.12
Supporting reasons: Identified as a pullback resistance that aligns with the 50% Fibonacci retracement, where selling pressures could intensify and potentially cap any upward retracement.
1st support: 23,317.44
Supporting reasons: Identified as a swing low support, indicating a key level where the price could stabilize once more.
1st resistance: 23,873.56
Supporting reasons: Identified as an overlap resistance, indicating a potential area that could halt any further upward movement.
US500 (S&P 500):
Potential Direction: Bearish
Overall momentum of the chart: Bullish
The price could see a short-term pullback toward the pivot before continuing its bearish move down toward the 1st support.
Pivot: 6,655.64
Supporting reasons: Identified as a pullback resistance, where selling pressures could intensify and potentially cap any upward retracement.
1st support: 6,594.19
Supporting reasons: Identified as an overlap support, providing a strong level where price could stabilize again if the market retraces deeper.
1st resistance: 6,6893.66
Supporting reasons: Identified as a resistance that is supported by the 161.8% Fibonacci extension, marking a key level that could temporarily halt upward momentum.
BTC/USD (Bitcoin):
Potential Direction: Bearish
Overall momentum of the chart: Bullish
The price could see a short-term pullback toward the pivot before continuing its bearish move down toward the 1st support.
Pivot: 114,486.46
Supporting reasons: Identified as a pullback resistance, where selling pressures could intensify and potentially cap any upward retracement.
1st support: 109.777.81
Supporting reasons: Identified as an overlap support that aligns with the 78.6% Fibonacci retracement, providing a strong level where price could stabilize again if the market retraces deeper.
1st resistance: 117.415.29
Supporting reasons: Identified as a swing high resistance, marking a key level that could temporarily halt upward momentum.
ETH/USD (Ethereum):
Potential Direction: Bearish
Overall momentum of the chart: Bullish
The price could see a short-term pullback toward the pivot before continuing its bearish move down toward the 1st support.
Pivot: 4,261.33
Supporting reasons: Identified as a pullback resistance, where selling pressures could intensify and potentially cap any upward retracement.
1st support: 3,923.17
Supporting reasons: Identified as a pullback support that aligns with the 161.8% Fibonacci retracement, providing a solid stabilization zone if the price retraces.
1st resistance: 4,477.54
Supporting reasons: Identified as an overlap resistance, making it a strong barrier where upward momentum could slow.
WTI/USD (Oil):
Potential Direction: Bearish
Overall momentum of the chart: Bullish
The price could see a short-term pullback toward the pivot before continuing its bearish move down toward the 1st support.
Pivot: 63,50
Supporting reasons: Identified as a pullback resistance, where selling pressures could intensify and potentially cap any upward retracement.
1st support: 62.09
Supporting reasons: Identified as a multi swing low support, providing a strong level where price could stabilize again if the market retraces deeper.
1st resistance: 64.99
Supporting reasons: Identified as a pullback resistance, marking a key level that could temporarily halt upward momentum.
XAU/USD (GOLD):
Potential Direction: Bullish
Overall momentum of the chart: Bullish
The price could make a short-term pullback toward the pivot before rising again toward the 1st resistance
Pivot: 3,699.30
Supporting reasons: Identified as a pullback support, where renewed buying pressure could emerge to push the price higher.
1st support: 3,654.40
Supporting reasons: Identified as a pullback support, providing a strong level where price could stabilize again if the market retraces deeper.
1st resistance: 3,754.57
Supporting reasons: Identified as a resistance that is supported by the 161.8% Fibonacci extension, marking a key level that could temporarily halt upward momentum.
The accuracy, completeness and timeliness of the information contained on this site cannot be guaranteed. IC Markets does not warranty, guarantee or make any representations, or assume any liability regarding financial results based on the use of the information in the site.
News, views, opinions, recommendations and other information obtained from sources outside of www.icmarkets.com, used in this site are believed to be reliable, but we cannot guarantee their accuracy or completeness. All such information is subject to change at any time without notice. IC Markets assumes no responsibility for the content of any linked site.
The fact that such links may exist does not indicate approval or endorsement of any material contained on any linked site. IC Markets is not liable for any harm caused by the transmission, through accessing the services or information on this site, of a computer virus, or other computer code or programming device that might be used to access, delete, damage, disable, disrupt or otherwise impede in any manner, the operation of the site or of any user’s software, hardware, data or property.
The post Tuesday 23th September 2025: Technical Outlook and Review first appeared on IC Markets | Official Blog.