Articles

IC Markets Asia Fundamental Forecast | 23 September 2025
421740 September 23, 2025 13:39 ICMarkets Market News
IC Markets Asia Fundamental Forecast | 23 September 2025
What happened in the U.S. session?
Markets remain buoyant, helped by the Fed’s dovish pivot and strong tech sector performance, but heightened volatility is expected as traders await substantial macro data later in the week. Safe-haven assets like gold have outperformed in the face of inflation risks, while cryptocurrencies saw a reversal. The U.S. dollar stays resilient, and treasuries are steady as investors brace for further central bank guidance.
What does it mean for the Asia Session?
Asian traders should be alert to fresh PMI data from Europe and the U.S., key comments from Fed Chair Powell, and any shifts in risk sentiment following the recent Fed rate cut. U.S. fiscal issues and global central bank activity are likely to drive cross-asset volatility, with special attention warranted on JPY, AUD, USD moves, and gold and oil trends.
The Dollar Index (DXY)
Key news events today
Flash manufacturing PMI (1:45 pm GMT)
Flash services PMI (1:45 pm GMT)
Richmond manufacturing index (2:00 pm GMT)
Fed Chair Powell speaks (4:35 pm GMT)
What can we expect from DXY today?
The US Dollar is softer, reflecting growing rate cut expectations and mild underperformance in PMI data. Fed Chair Powell’s comments are the main risk event for additional moves, with traders focused on any signals of more dovish policy. Equities are boosted by easier monetary policy, while commodities benefit from the weaker dollar. Dollar sentiment and volatility remain closely tied to US macro data and Federal Reserve guidance throughout the day.
Central Bank Notes:
- The Federal Open Market Committee (FOMC) voted, by majority, to lower the federal funds rate target range by 25 basis points to 4.00%–4.25% at its September 16–17, 2025, meeting, marking the first policy rate adjustment since December 2024 after five consecutive holds.
- The Committee maintained its long-term objective of achieving maximum employment and 2% inflation, acknowledging recent labor market softening and continued tariff-driven price pressures.
- Policymakers expressed elevated concern about downside risks to growth, citing a stalling labor market, modest job creation, and an unemployment rate drifting up toward 4.4%. At the same time, inflation remains above target, with CPI at 3.2% and core inflation at 3.1% as of August 2025; higher energy and food prices, largely attributable to tariffs, continue to weigh on headline measures.
- Although economic activity expanded at a moderate pace in the third quarter, the growth outlook has weakened. Q3 GDP growth is estimated near 1.0% (annualized), with full-year 2025 GDP growth guidance revised to 1.2%, reflecting slowing household consumption and tighter financial conditions.
- In the updated Summary of Economic Projections, the unemployment rate is projected to average 4.5% for the year, with headline PCE inflation revised up slightly to 3.1% for 2025. The Committee anticipates core PCE inflation to remain stubborn, requiring sustained vigilance and a flexible approach to risk management.
- The Committee reiterated its data-dependent approach and openness to further adjustments should employment or inflation deviate meaningfully from current forecasts. Several members dissented, either advocating a larger 50-basis-point cut or preferring no adjustment at this meeting, revealing heightened divergence within the Committee.
- Balance sheet reduction continues at a measured pace. The monthly Treasury redemption cap remains at $5B and the agency MBS cap at $35B, as the Board aims to support orderly market conditions in the face of evolving global and domestic uncertainty.
- The next meeting is scheduled for 28 to 29 October 2025.
Next 24 Hours Bias
Medium Bearish
Gold (XAU)
Key news events today
Flash manufacturing PMI (1:45 pm GMT)
Flash services PMI (1:45 pm GMT)
Richmond manufacturing index (2:00 pm GMT)
Fed Chair Powell speaks (4:35 pm GMT)
What can we expect from Gold today?
Gold’s performance reflects a confluence of supportive factors creating an exceptionally bullish environment. The Federal Reserve’s pivot toward monetary easing, combined with persistent central bank demand, robust ETF inflows, and ongoing geopolitical tensions, has propelled the precious metal to historic heights. With year-to-date gains exceeding 42% and strong technical momentum, gold continues to demonstrate its enduring appeal as both an inflation hedge and portfolio diversifier during periods of economic and geopolitical uncertainty.
Next 24 Hours Bias
Strong Bullish
The Australian Dollar (AUD)
Key news events today
No major news event
What can we expect from AUD today?
The Australian Dollar faces a challenging environment as it navigates between domestic economic resilience and external headwinds. While strong PMI data and gradual RBA easing provide some support, the currency is pressured by US Dollar strength and China’s economic slowdown. Key catalysts this week include today’s PMI data, Wednesday’s inflation reading, and ongoing Fed communications, all of which will influence the AUD’s trajectory toward the RBA’s September 30 meeting. The currency’s ability to hold above key technical support levels will be crucial for maintaining its recent gains and preventing further declines toward multi-month lows.
Central Bank Notes:
- The RBA held its cash rate steady at 3.60% at its September meeting on 8–9 September 2025, following a 25 basis point reduction at the August meeting. This maintains a cautious yet supportive stance, with the decision largely anticipated given recent evidence of inflation settling within the target band.
- Inflation readings continue to ease, with headline CPI most likely tracking near 2.1–2.3%—comfortably within the 2–3% target range. September quarter figures are pending, but leading indicators show further moderation in non-housing components, even as insurance and housing-related costs remain sticky.
- The RBA’s preferred trimmed mean inflation is estimated at around 2.7%–2.9%, further reflecting progress toward the midpoint of the target range. Energy and food volatility still create some short-term uncertainty, but underlying inflation is broadly on track.
- Global conditions are a key source of risk. While U.S.–EU trade tensions have stabilized slightly, volatility in equities and commodities persists, with uncertainty feeding through to Australia’s trade and export outlook.
- Domestic demand shows tentative improvement. Real household incomes and a stabilizing housing sector have underpinned modest consumption growth, though business investment remains uneven—service sectors outperforming manufacturing and construction.
- Labor market tightness persists, but momentum continues to slow from earlier in the year. Employment gains remain, but job vacancies and hiring intentions have softened, with underutilization rising marginally for the second straight month.
- Wage growth has slowed in line with easing labour pressures, but unit labour costs remain elevated due to weak productivity. The RBA continues to flag subdued productivity as a medium-term cost risk.
- Forward indicators suggest household consumption may be softer than previously forecast. Elevated rents and high borrowing costs are dampening discretionary spending, despite modest income recovery.
- The Board continues to highlight the risk that household spending could underperform, potentially weighing on business investment and job creation if confidence remains subdued.
- Monetary policy remains mildly restrictive, in line with greater inflation control and ongoing economic rebalancing. The decision to hold rates recognizes both progress and ongoing uncertainties, with future moves explicitly tied to incoming data.
- The Reserve Bank reinforced its goals of price stability and full employment, stating readiness to adjust policy if economic or inflation outcomes diverge from baseline projections.
- The next meeting is on 29 to 30 September 2025.
Next 24 Hours Bias
Medium Bullish
The Kiwi Dollar (NZD)
Key news events today
No major news event
What can we expect from NZD today?
The New Zealand dollar is under significant pressure following the shocking GDP contraction that has fundamentally altered the monetary policy outlook. While trade data shows some resilience with strong export growth, the domestic economy’s weakness has prompted economists to call for aggressive rate cuts. The RBNZ is widely expected to deliver at least 25 basis points of easing in October, with a meaningful probability of a larger 50 basis point cut. The currency’s near-term trajectory will likely depend on incoming economic data and the extent of RBNZ policy action, with key support levels being tested around 0.5850.
Central Bank Notes:
- The Monetary Policy Committee (MPC) agreed to cut the Official Cash Rate (OCR) by 25 basis points to 3.00% on 20 August 2025, marking a three-year low and continuing the easing cycle after July’s pause. The vote was split 4-2, with two members advocating a 50-basis-point cut, highlighting diverging views within the Committee.
- Policymakers indicated that significant uncertainty and a stalling economic recovery prompted this move, leaving the door open for further rate cuts later in the year, with a possible trough around 2.5% by December.
- Annual consumer price index inflation rose to 2.7% in the June quarter and is expected to reach 3% for the September quarter—at the upper end of the MPC’s 1 to 3% target band—but medium-term expectations remain anchored near the 2% midpoint.
- Despite the near-term uptick, headline inflation is projected to return toward 2% by mid-2026, as tradables inflation pressures ease and significant spare capacity continues to dampen domestic price momentum.
- Domestic financial conditions are broadly aligning with MPC expectations, as lower wholesale rates have translated into reduced borrowing costs for households. However, declining consumption and investment demand, higher unemployment, and subdued wage growth reflect ongoing economic slack.
- GDP growth stalled in the second quarter of 2025, contrasting with earlier projections. High-frequency indicators point to continued weakness driven by rising prices for essentials, weakening household savings, and constrained business lending.
- The MPC cautioned that ongoing global tariff uncertainties and policy shifts, especially recent changes in US trade regulations, could amplify market volatility and present both upside and downside risks to New Zealand’s recovery.
- Subject to medium-term inflation pressures continuing to ease as projected, the MPC signaled scope for further OCR cuts, possibly down to 2.5% by year-end, consistent with the latest Monetary Policy Statement outlook.
- The next meeting is on 22 October 2025.
Next 24 Hours Bias
Weak Bullish
The Japanese Yen (JPY)
Key news events today
No major news event
What can we expect from JPY today?
The Japanese yen faces a complex environment with the BoJ signaling gradual policy normalization while political uncertainty creates hesitation about aggressive tightening. Today’s Fed Chair Powell speech and upcoming Japanese PMI data will provide crucial direction for near-term yen performance. While the September 19 BoJ meeting showed increased hawkish sentiment with two dissenting votes, the yen’s inability to sustain gains highlights the challenging backdrop of divergent monetary policies and political risks. Markets continue to price in approximately 75% probability of a BoJ rate hike at the October meeting, making this a critical period for yen direction.
Central Bank Notes:
- The Policy Board of the Bank of Japan decided on 17 September, by a unanimous vote, to set the following guidelines for money market operations for the inter-meeting period:
- The Bank will encourage the uncollateralized overnight call rate to remain at around 0.5%.
- The BOJ will continue its gradual reduction of monthly outright purchases of Japanese Government Bonds (JGBs). The scheduled amount of long-term government bond purchases remains unchanged from the prior decision, with a quarterly reduction pace of about ¥400 billion through March 2026 and about ¥200 billion per quarter from April to June 2026 onward, aiming for a purchase level near ¥2 trillion in January to March 2027.
- Japan’s economy continues to show a moderate recovery, with household consumption supported by rising incomes, although corporate activity has softened somewhat. Overseas economies remain on a moderate growth path, with the impact of global trade policies still weighing on Japan’s export and industrial production outlook.
- On the price front, the year-on-year rate of change in consumer prices (excluding fresh food) remains in the mid-3% range. Inflationary pressures remain broad-based, with persistent cost-push factors in food and energy, alongside solid wage pass-through. However, input cost pressures from past import surges are showing early signs of easing.
- Short-term inflation momentum may moderate as cost-push effects diminish, though rent increases and service-related price gains tied to labor shortages are likely to provide support. Inflation expectations among firms and households continue a gradual upward drift.
- Looking ahead, the economy is projected to grow at a slower-than-trend pace in the near term due to external demand softness and cautious corporate investment plans. However, accommodative financial conditions and steady increases in real labor income are expected to underpin domestic demand.
- In the medium term, as overseas economies recover and global trade stabilizes, Japan’s growth potential is likely to improve. With persistent labor market tightness and rising medium- to long-term inflation expectations, core inflation is projected to remain on a gradual upward trend, converging toward the 2% price stability target in the latter half of the projection horizon.
- The next meeting is scheduled for 30 to 31 October 2025.
Next 24 Hours Bias
Weak Bearish
Oil
Key news events today
API crude oil stock (8:30 pm GMT)
What can we expect from Oil today?
Oil markets on Tuesday, September 23, 2025, face a complex interplay of competing forces. While geopolitical tensions in Europe and the Middle East provide short-term price support, fundamental oversupply concerns dominate the longer-term outlook. The combination of increasing Iraqi exports, potential Kurdistan pipeline restarts, significant U.S. inventory builds, and weakening global demand growth creates a bearish foundation for oil prices.
Next 24 Hours Bias
Weak Bearish
The post IC Markets Asia Fundamental Forecast | 23 September 2025 first appeared on IC Markets | Official Blog.
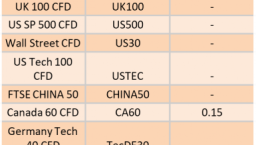
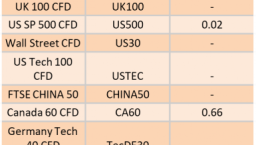
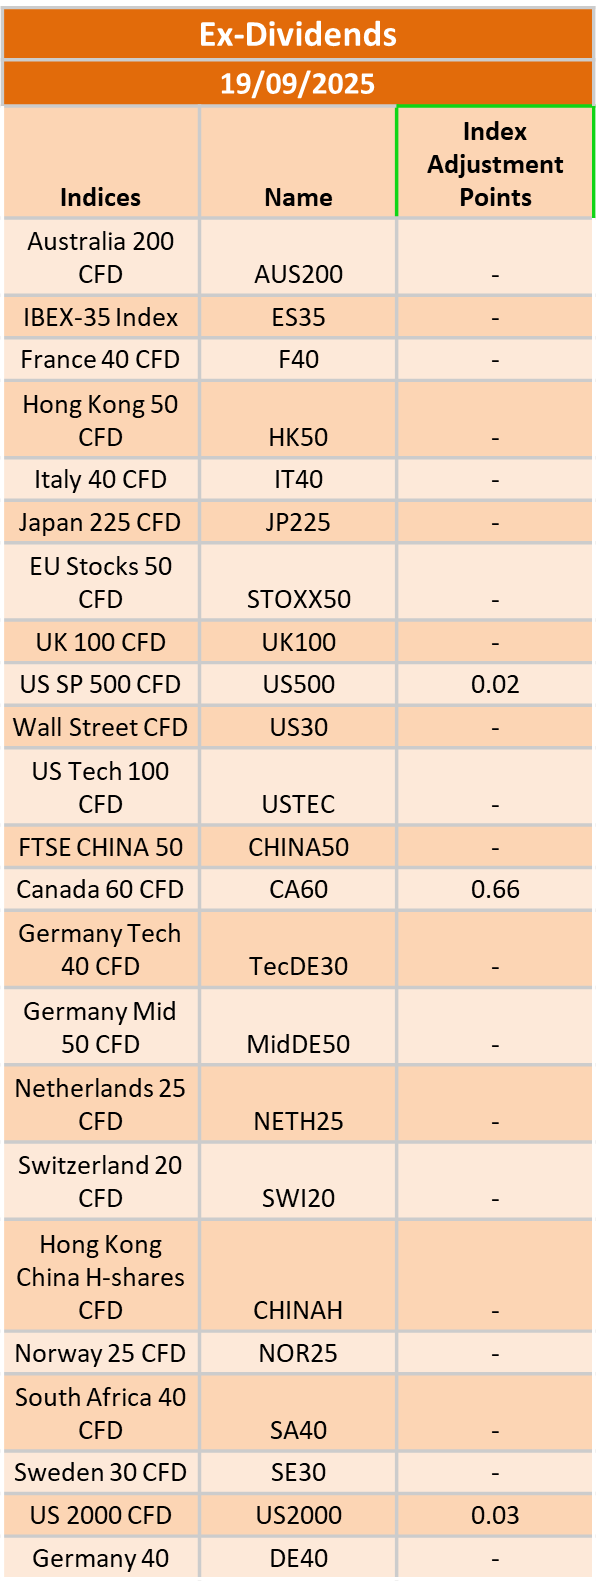
Ex-Dividend 23/9/2025
421736 September 23, 2025 11:00 ICMarkets Market News
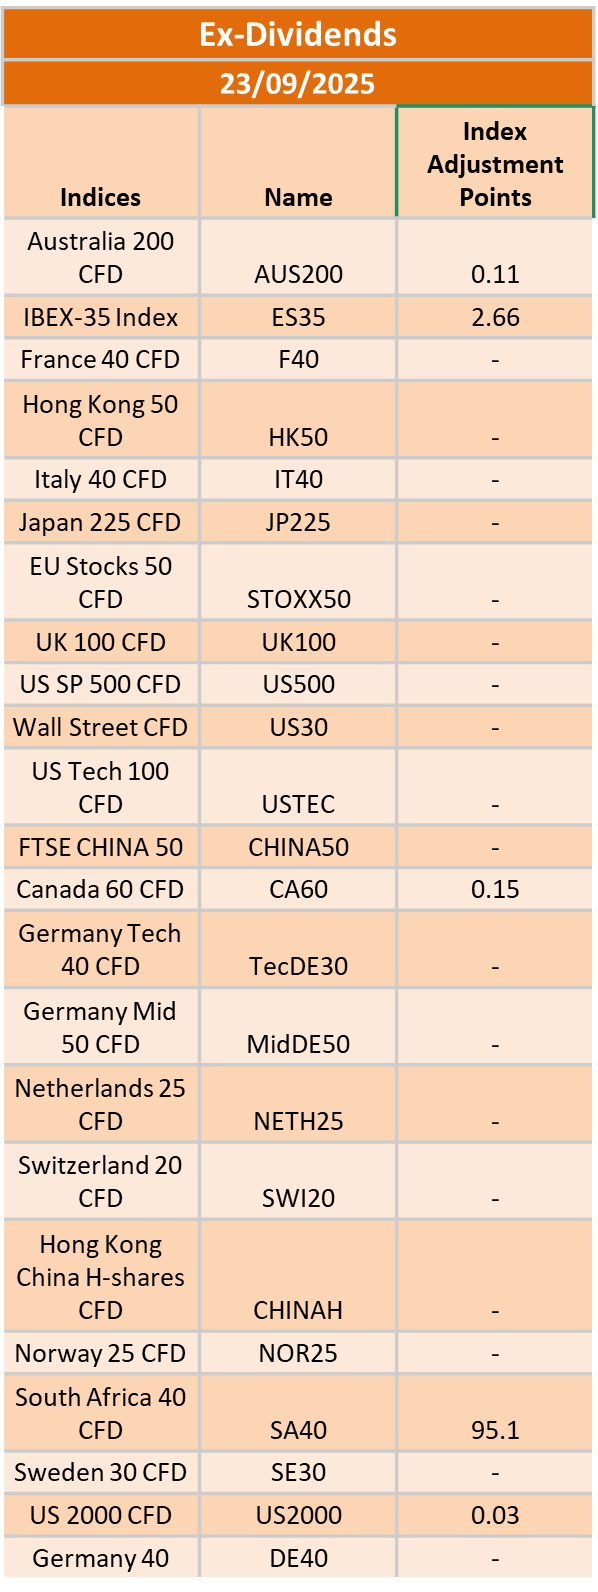
The post Ex-Dividend 23/9/2025 first appeared on IC Markets | Official Blog.
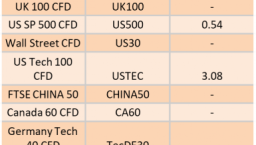
Ex-Dividend 22/9/2025
421699 September 19, 2025 17:14 ICMarkets Market News
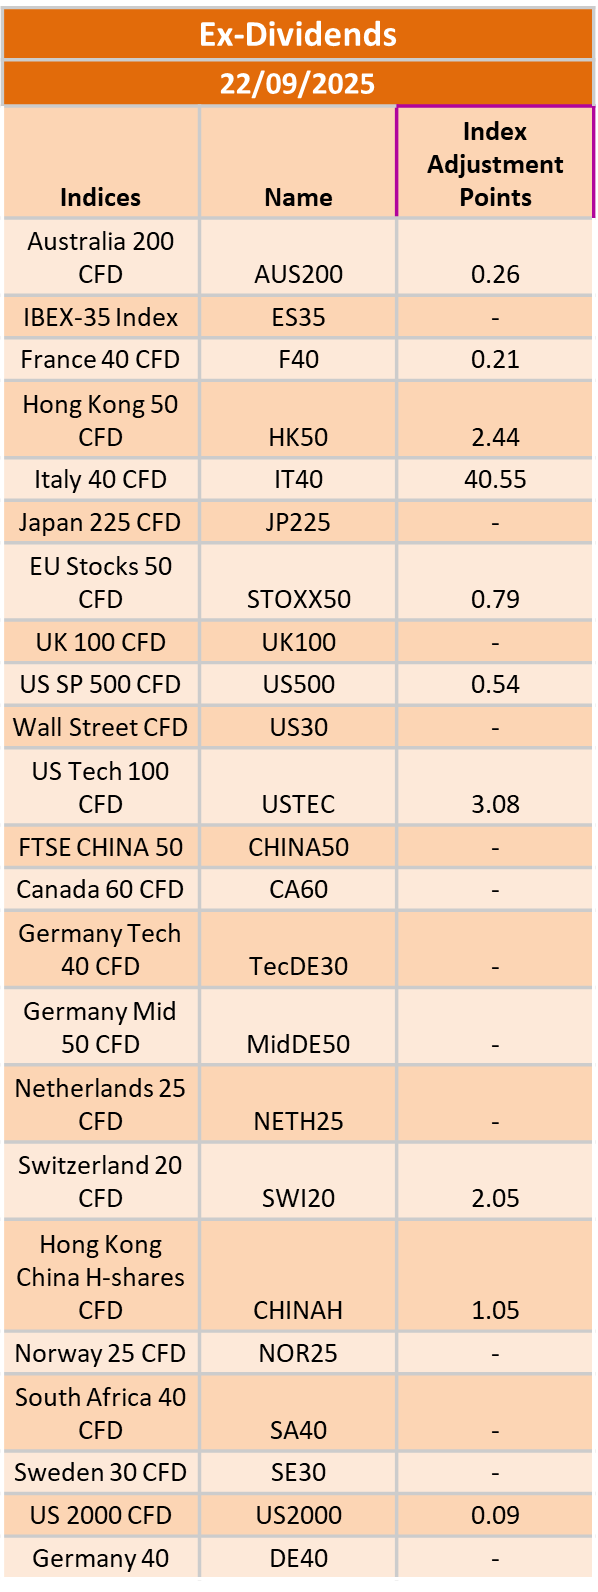
The post Ex-Dividend 22/9/2025 first appeared on IC Markets | Official Blog.
IC Markets Asia Fundamental Forecast | 19 September 2025
421695 September 19, 2025 14:14 ICMarkets Market News
IC Markets Asia Fundamental Forecast | 19 September 2025
What happened in the U.S. session?
The overnight U.S. session was dominated by the Fed’s interest rate cut and its guidance for fewer future reductions than market expectations, creating volatility and sector rotation within equities. Financials and consumer staples outperformed, while technology and housing-related stocks faced pressure due to both Fed messaging and disappointing housing data. The U.S. dollar exhibited notable volatility around the Fed’s announcement, and commodities such as oil and gold responded to both macro headlines and inventory data.
What does it mean for the Asia Session?
On 19th September 2025, Asian traders should focus on the Bank of Japan’s rate decision and press conference for monetary policy signals, UK and Canadian retail sales for consumer trend insights, and potential action in equity and currency markets driven by Chinese economic data and international political developments. Market participants should be especially vigilant for surprise BOJ commentary and any hints of further stimulus from China, as these could sharply impact FX and equity volatility.
The Dollar Index (DXY)
Key news events today
No major news event
What can we expect from DXY today?
The US dollar has continued its recent downtrend, largely influenced by the US Federal Reserve’s decision to cut interest rates by 25 basis points earlier this week, with dovish signals suggesting more cuts are likely this year. This has led to widespread dollar weakness across major currency pairs, while expectations of further US policy easing dominate market sentiment. The US dollar is broadly weaker today as markets digest the Fed’s dovish signals and soft US economic data, with the outlook remaining bearish barring an unexpected policy surprise.
Central Bank Notes:
- The Federal Open Market Committee (FOMC) voted, by majority, to lower the federal funds rate target range by 25 basis points to 4.00%–4.25% at its September 16–17, 2025, meeting, marking the first policy rate adjustment since December 2024 after five consecutive holds.
- The Committee maintained its long-term objective of achieving maximum employment and 2% inflation, acknowledging recent labor market softening and continued tariff-driven price pressures.
- Policymakers expressed elevated concern about downside risks to growth, citing a stalling labor market, modest job creation, and an unemployment rate drifting up toward 4.4%. At the same time, inflation remains above target, with CPI at 3.2% and core inflation at 3.1% as of August 2025; higher energy and food prices, largely attributable to tariffs, continue to weigh on headline measures.
- Although economic activity expanded at a moderate pace in the third quarter, the growth outlook has weakened. Q3 GDP growth is estimated near 1.0% (annualized), with full-year 2025 GDP growth guidance revised to 1.2%, reflecting slowing household consumption and tighter financial conditions.
- In the updated Summary of Economic Projections, the unemployment rate is projected to average 4.5% for the year, with headline PCE inflation revised up slightly to 3.1% for 2025. The Committee anticipates core PCE inflation to remain stubborn, requiring sustained vigilance and a flexible approach to risk management.
- The Committee reiterated its data-dependent approach and openness to further adjustments should employment or inflation deviate meaningfully from current forecasts. Several members dissented, either advocating a larger 50-basis-point cut or preferring no adjustment at this meeting, revealing heightened divergence within the Committee.
- Balance sheet reduction continues at a measured pace. The monthly Treasury redemption cap remains at $5B and the agency MBS cap at $35B, as the Board aims to support orderly market conditions in the face of evolving global and domestic uncertainty.
- The next meeting is scheduled for 28 to 29 October 2025.
Next 24 Hours Bias
Medium Bearish
Gold (XAU)
Key news events today
No major news event
What can we expect from Gold today?
Gold prices continued their historic rally into Friday, September 19th, 2025, hovering near record highs in anticipation of further central bank easing and ongoing investor demand for safe havens amid economic uncertainty. Gold remains in focus as investors respond to central bank policy, economic uncertainty, and inflation, positioning the metal for potential further gains into late 2025.
Next 24 Hours Bias
Strong Bullish
The Australian Dollar (AUD)
Key news events today
No major news event
What can we expect from AUD today?
The Australian Dollar is performing strongly against major currencies, supported by resilient commodity prices and bullish risk sentiment, although softer employment data has tempered recent gains slightly. Today, the Australian Dollar (AUD) is trading near multi-month highs against the US Dollar, underpinned by stable commodity prices and a relatively strong economic outlook. However, some recent data, such as weaker employment growth, have surprised to the downside and contributed to softer government yields.
Central Bank Notes:
- The RBA held its cash rate steady at 3.60% at its September meeting on 8–9 September 2025, following a 25 basis point reduction at the August meeting. This maintains a cautious yet supportive stance, with the decision largely anticipated given recent evidence of inflation settling within the target band.
- Inflation readings continue to ease, with headline CPI most likely tracking near 2.1–2.3%—comfortably within the 2–3% target range. September quarter figures are pending, but leading indicators show further moderation in non-housing components, even as insurance and housing-related costs remain sticky.
- The RBA’s preferred trimmed mean inflation is estimated at around 2.7%–2.9%, further reflecting progress toward the midpoint of the target range. Energy and food volatility still create some short-term uncertainty, but underlying inflation is broadly on track.
- Global conditions are a key source of risk. While U.S.–EU trade tensions have stabilized slightly, volatility in equities and commodities persists, with uncertainty feeding through to Australia’s trade and export outlook.
- Domestic demand shows tentative improvement. Real household incomes and a stabilizing housing sector have underpinned modest consumption growth, though business investment remains uneven—service sectors outperforming manufacturing and construction.
- Labor market tightness persists, but momentum continues to slow from earlier in the year. Employment gains remain, but job vacancies and hiring intentions have softened, with underutilization rising marginally for the second straight month.
- Wage growth has slowed in line with easing labour pressures, but unit labour costs remain elevated due to weak productivity. The RBA continues to flag subdued productivity as a medium-term cost risk.
- Forward indicators suggest household consumption may be softer than previously forecast. Elevated rents and high borrowing costs are dampening discretionary spending, despite modest income recovery.
- The Board continues to highlight the risk that household spending could underperform, potentially weighing on business investment and job creation if confidence remains subdued.
- Monetary policy remains mildly restrictive, in line with greater inflation control and ongoing economic rebalancing. The decision to hold rates recognizes both progress and ongoing uncertainties, with future moves explicitly tied to incoming data.
- The Reserve Bank reinforced its goals of price stability and full employment, stating readiness to adjust policy if economic or inflation outcomes diverge from baseline projections.
- The next meeting is on 29 to 30 September 2025.
Next 24 Hours Bias
Medium Bullish
The Kiwi Dollar (NZD)
Key news events today
No major news event
What can we expect from NZD today?
NZD came under heavy pressure today as markets reacted to weak GDP numbers and reinforced expectations for central bank rate cuts. With technical and fundamental factors aligned to the downside, sentiment remains bearish for the New Zealand Dollar in the near term. The New Zealand Dollar experienced sharp declines today, mainly due to disappointing GDP data and ongoing expectations for monetary policy easing by the Reserve Bank of New Zealand (RBNZ).
Central Bank Notes:
- The Monetary Policy Committee (MPC) agreed to cut the Official Cash Rate (OCR) by 25 basis points to 3.00% on 20 August 2025, marking a three-year low and continuing the easing cycle after July’s pause. The vote was split 4-2, with two members advocating a 50-basis-point cut, highlighting diverging views within the Committee.
- Policymakers indicated that significant uncertainty and a stalling economic recovery prompted this move, leaving the door open for further rate cuts later in the year, with a possible trough around 2.5% by December.
- Annual consumer price index inflation rose to 2.7% in the June quarter and is expected to reach 3% for the September quarter—at the upper end of the MPC’s 1 to 3% target band—but medium-term expectations remain anchored near the 2% midpoint.
- Despite the near-term uptick, headline inflation is projected to return toward 2% by mid-2026, as tradables inflation pressures ease and significant spare capacity continues to dampen domestic price momentum.
- Domestic financial conditions are broadly aligning with MPC expectations, as lower wholesale rates have translated into reduced borrowing costs for households. However, declining consumption and investment demand, higher unemployment, and subdued wage growth reflect ongoing economic slack.
- GDP growth stalled in the second quarter of 2025, contrasting with earlier projections. High-frequency indicators point to continued weakness driven by rising prices for essentials, weakening household savings, and constrained business lending.
- The MPC cautioned that ongoing global tariff uncertainties and policy shifts, especially recent changes in US trade regulations, could amplify market volatility and present both upside and downside risks to New Zealand’s recovery.
- Subject to medium-term inflation pressures continuing to ease as projected, the MPC signaled scope for further OCR cuts, possibly down to 2.5% by year-end, consistent with the latest Monetary Policy Statement outlook.
- The next meeting is on 22 October 2025.
Next 24 Hours Bias
Weak Bullish
The Japanese Yen (JPY)
Key news events today
BOJ Policy Rate (3:00 am GMT)
Monetary Policy Statement (2:30 am GMT)
BOJ Press Conference (6:30 am GMT)
What can we expect from JPY today?
The latest developments for the Japanese Yen on Friday, September 19, 2025, center around the Bank of Japan’s monetary policy meeting. The central bank is widely expected to keep its key interest rate unchanged at 0.5%. Market participants closely monitor Governor Kazuo Ueda’s press conference for clues on future policy tightening, as persistent inflation, political uncertainty, and trade dynamics with the U.S. influence the BoJ’s cautious stance.
Central Bank Notes:
- The Policy Board of the Bank of Japan decided on 17 September, by a unanimous vote, to set the following guidelines for money market operations for the inter-meeting period:
- The Bank will encourage the uncollateralized overnight call rate to remain at around 0.5%.
- The BOJ will continue its gradual reduction of monthly outright purchases of Japanese Government Bonds (JGBs). The scheduled amount of long-term government bond purchases remains unchanged from the prior decision, with a quarterly reduction pace of about ¥400 billion through March 2026 and about ¥200 billion per quarter from April to June 2026 onward, aiming for a purchase level near ¥2 trillion in January to March 2027.
- Japan’s economy continues to show a moderate recovery, with household consumption supported by rising incomes, although corporate activity has softened somewhat. Overseas economies remain on a moderate growth path, with the impact of global trade policies still weighing on Japan’s export and industrial production outlook.
- On the price front, the year-on-year rate of change in consumer prices (excluding fresh food) remains in the mid-3% range. Inflationary pressures remain broad-based, with persistent cost-push factors in food and energy, alongside solid wage pass-through. However, input cost pressures from past import surges are showing early signs of easing.
- Short-term inflation momentum may moderate as cost-push effects diminish, though rent increases and service-related price gains tied to labor shortages are likely to provide support. Inflation expectations among firms and households continue a gradual upward drift.
- Looking ahead, the economy is projected to grow at a slower-than-trend pace in the near term due to external demand softness and cautious corporate investment plans. However, accommodative financial conditions and steady increases in real labor income are expected to underpin domestic demand.
- In the medium term, as overseas economies recover and global trade stabilizes, Japan’s growth potential is likely to improve. With persistent labor market tightness and rising medium- to long-term inflation expectations, core inflation is projected to remain on a gradual upward trend, converging toward the 2% price stability target in the latter half of the projection horizon.
- The next meeting is scheduled for 30 to 31 October 2025.
Next 24 Hours Bias
Weak Bearish
Oil
Key news events today
No major news event
What can we expect from Oil today?
Oil prices on Friday, September 19, 2025, ended the trading week on a lower note due to concerns over a US economic slowdown, rising global supply, and persistent geopolitical tensions. Brent crude settled near $67.44/barrel, while WTI traded below $64/barrel, with both benchmarks seeing moderate declines from earlier in the week. Oil prices face ongoing downward pressure, with supply-side risks, economic uncertainty, and technical signals indicating a cautious outlook for the remainder of September 2025.
Next 24 Hours Bias
Weak Bearish
The post IC Markets Asia Fundamental Forecast | 19 September 2025 first appeared on IC Markets | Official Blog.
Friday 19th September 2025: Technical Outlook and Review
421678 September 19, 2025 14:00 ICMarkets Market News
DXY (U.S. Dollar Index):
Potential Direction: Bearish
Overall momentum of the chart: Bearish
The price could see a short-term pullback toward the pivot before continuing its bearish move down toward the 1st support.
Pivot: 97.49
Supporting reasons: Identified as a pullback resistance that aligns closely with the 61.8% Fibonacci retracement, where selling pressures could intensify and potentially cap any upward retracement.
1st support: 96.47
Supporting reasons: Identified as a swing low support that aligns with the 127.2% Fibonacci extension, indicating a potential area where the price could again stabilize.
1st resistance: 98.12
Supporting reasons: Identified as an overlap resistance, acting as a ceiling for price and potentially preventing further upward movement.
EUR/USD:
Potential Direction: Bullish
Overall momentum of the chart: Bullish
The price is testing the pivot and could make a bullish rise toward the 1st resistance
Pivot: 1.1768
Supporting reasons: Identified as a pullback support, where buying pressure could emerge and provide a base for the next upward move.
1st support: 1.1678
Supporting reasons: Identified as an overlap support, providing a strong level where price could stabilize again if the market retraces deeper.
1st resistance: 1.1895
Supporting reasons: Identified as a resistance that is supported by 127.2% Fibonacci extension and the 127.2% Fibonacci projection, marking a key level that could temporarily halt upward momentum.
EUR/JPY:
Potential Direction: Bullish
Overall momentum of the chart: Bullish
The price could make a short-term pullback toward the pivot before rising again toward the 1st resistance
Pivot: 173.78
Supporting reasons: Identified as a pullback support, where renewed buying pressure could emerge to push the price higher.
1st Support: 173.09
Supporting reasons: Identified as an overlap support, marking a key stabilization zone if the price retraces deeper.
1st Resistance: 175.01
Supporting reasons: Identified as a resistance that is supported by the 161.8% Fibonacci extension, where upward momentum could face a potential barrier.
EUR/GBP:
Potential Direction: Bullish
Overall momentum of the chart: Bullish
The price could make a short-term pullback toward the pivot before rising again toward the 1st resistance
Pivot: 0.8678
Supporting reasons: Identified as a pullback support, indicating a potential area where buying interest could pick up.
1st support: 0.8658
Supporting reasons: Identified as an overlap support, providing a solid stabilization zone if price retraces.
1st resistance: 0.8712
Supporting reasons: Identified as a swing high resistance, making it a strong barrier where upward momentum could slow.
GBP/USD:
Potential Direction: Bearish
Overall momentum of the chart: Bullish
The price could see a short-term pullback toward the pivot before continuing its bearish move down toward the 1st support.
Pivot: 1.3614
Supporting reasons: Identified as a pullback resistance, where selling pressures could intensify and potentially cap any upward retracement.
1st support: 1.3480
Supporting reasons: Identified as a pullback support that aligns with the 61.8% Fibonacci retracement, indicating a potential area where the price could stabilize once more.
1st resistance: 1.3691
Supporting reasons: Identified as an overlap resistance, indicating a potential level that could halt further upward movement.
GBP/JPY:
Potential Direction: Bullish
Overall momentum of the chart: Bullish
The price could make a short-term pullback toward the pivot before rising again toward the 1st resistance
Pivot: 200.21
Supporting reasons: Identified as a pullback support that aligns with the 61.8% Fibonacci retracement, where renewed buying pressure could emerge to push the price higher.
1st support: 199.64
Supporting reasons: Identified as an overlap support, indicating a potential level where the price could stabilize once more.
1st resistance: 201.14
Supporting reasons: Identified as a swing high resistance, indicating a potential level that could halt further upward movement.
USD/CHF:
Potential Direction: Bullish
Overall momentum of the chart: Bullish
The price could make a short-term pullback toward the pivot before rising again toward the 1st resistance
Pivot: 0.7895
Supporting reasons: Identified as a pullback support, where renewed buying pressure could emerge to push the price higher.
1st support: 0.7851
Supporting reasons: Identified as a swing low support that aligns with the 100% Fibonacci projection, indicating a potential level where the price could stabilize once again.
1st resistance: 0.7986
Supporting reasons: Identified as an overlap resistance, indicating a potential level that could cap further upward movement.
USD/JPY:
Potential Direction: Bullish
Overall momentum of the chart: Bullish
The price could make a short-term pullback toward the pivot before rising again toward the 1st resistance
Pivot: 147.07
Supporting reasons: Identified as a pullback support, where renewed buying pressure could emerge to push the price higher.
1st support: 145.87
Supporting reasons: Identified as a swing low support, indicating a potential area where the price could again stabilize.
1st resistance: 149.00
Supporting reasons: Identified as an overlap resistance, acting as a ceiling for price and potentially preventing further upward movement.
USD/CAD:
Potential Direction: Bearish
Overall momentum of the chart: Bearish
The price could see a short-term pullback toward the pivot before continuing its bearish move down toward the 1st support.
Pivot: 1.3816
Supporting reasons: Identified as a pullback resistance that aligns with the 50% Fibonacci retracement, where selling pressures could intensify and potentially cap any upward retracement.
1st support: 1.3724
Supporting reasons: Identified as an overlap, indicating a potential area where the price could again stabilize.
1st resistance: 1.3879
Supporting reasons: Identified as an overlap resistance, acting as a ceiling for price and potentially preventing further upward movement.
AUD/USD:
Potential Direction: Bullish
Overall momentum of the chart: Bullish
The price could see a pullback toward the pivot before making a bullish rise toward the 1st resistance
Pivot: 0.6637
Supporting reasons: Identified as a pullback support, where buying pressure could emerge and provide a base for the next upward move.
1st support: 0.6558
Supporting reasons: Identified as a pullback support, providing a strong level where price could stabilize again if the market retraces deeper.
1st resistance: 0.6689
Supporting reasons: Identified as a swing high resistance, marking a key level that could temporarily halt upward momentum.
NZD/USD
Potential Direction: Bullish
Overall momentum of the chart: Bullish
The price is testing the pivot and could make a bullish rise toward the 1st resistance
Pivot: 0.5883
Supporting reasons: Identified as an overlap support that aligns with the 78.6 Fibonacci retracement, where buying pressure could emerge and provide a base for the next upward move.
1st support: 0.5837
Supporting reasons: Identified as a swing low support, providing a strong level where price could stabilize again if the market retraces deeper.
1st resistance: 0.5927
Supporting reasons: Identified as a pullback resistance, marking a key level that could temporarily halt upward momentum.
US30 (DJIA):
Potential Direction: Bullish
Overall momentum of the chart: Bullish
The price has already bounced off the pivot and could continue its bullish move toward the 1st resistance.
Pivot: 45,675.57
Supporting reasons: Identified as an overlap support, indicating a potential area where buying interest could pick up.
1st support: 45,297.04
Supporting reasons: Identified as an overlap support, providing a solid stabilization zone if price retraces.
1st resistance: 46,129.86
Supporting reasons: Identified as a resistance that is supported with the 161.8% Fibonacci extension, making it a strong barrier where upward momentum could slow.
DE40 (DAX):
Potential Direction: Bullish
Overall momentum of the chart: Bullish
The price could make a short-term pullback toward the pivot before rising again toward the 1st resistance
Pivot: 23,545.77
Supporting reasons: Identified as a pullback support, where renewed buying pressure could emerge to push the price higher.
1st support: 23,317.44
Supporting reasons: Identified as a swing low support, indicating a key level where the price could stabilize once more.
1st resistance: 23,873.56
Supporting reasons: Identified as an overlap resistance, indicating a potential area that could halt any further upward movement.
US500 (S&P 500):
Potential Direction: Bullish
Overall momentum of the chart: Bullish
The price could see a pullback toward the pivot before making a bullish rise toward the 1st resistance
Pivot: 6,630.29
Supporting reasons: Identified as a pullback support, where buying pressure could emerge and provide a base for the next upward move.
1st support: 6,594.19
Supporting reasons: Identified as an overlap support, providing a strong level where price could stabilize again if the market retraces deeper.
1st resistance: 6,687.72
Supporting reasons: Identified as a resistance that is supported by the 161.8% Fibonacci extension, marking a key level that could temporarily halt upward momentum.
BTC/USD (Bitcoin):
Potential Direction: Bullish
Overall momentum of the chart: Bullish
The price has already bounced off the pivot and could continue its bullish move toward the 1st resistance.
Pivot: 115,494.52
Supporting reasons: Identified as an overlap support, where buying pressure could emerge and provide a base for the next upward move.
1st support: 112,962.02
Supporting reasons: Identified as a pullback support, providing a strong level where price could stabilize again if the market retraces deeper.
1st resistance: 118.235.69
Supporting reasons: Identified as an overlap that aligns with the 161.8% Fibonacci extension, marking a key level that could temporarily halt upward momentum.
ETH/USD (Ethereum):
Potential Direction: Bullish
Overall momentum of the chart: Bullish
The price has already bounced off the pivot and could continue its bullish move toward the 1st resistance.
Pivot: 4,477.50
Supporting reasons: Identified as an overlap support that aligns with the 61.8% Fibonacci retracement, indicating a potential area where buying interest could pick up.
1st support: 4,239.45
Supporting reasons: Identified as an overlap support, providing a solid stabilization zone if price retraces.
1st resistance: 4,761.40
Supporting reasons: Identified as an overlap resistance, making it a strong barrier where upward momentum could slow.
WTI/USD (Oil):
Potential Direction: Bullish
Overall momentum of the chart: Bullish
The price could see a pullback toward the pivot before making a bullish rise toward the 1st resistance
Pivot: 63.50
Supporting reasons: Identified as an overlap support, where buying pressure could emerge and provide a base for the next upward move.
1st support: 62.09
Supporting reasons: Identified as a swing low support, providing a strong level where price could stabilize again if the market retraces deeper.
1st resistance: 65.38
Supporting reasons: Identified as a pullback resistance that aligns with the 78.6% Fibonacci retracement, marking a key level that could temporarily halt upward momentum.
XAU/USD (GOLD):
Potential Direction: Bearish
Overall momentum of the chart: Bullish
The price could see a short-term pullback toward the pivot before continuing its bearish move down toward the 1st support.
Pivot: 3,653.06
Supporting reasons: Identified as a pullback resistance, where selling pressures could intensify and potentially cap any upward retracement.
1st support: 3,597.43
Supporting reasons: Identified as a pullback support that aligns closely with the 127.2% Fibonacci extension, providing a strong level where price could stabilize again if the market retraces deeper.
1st resistance: 3,697.76
Supporting reasons: Identified as a swing high resistance, marking a key level that could temporarily halt upward momentum.
The accuracy, completeness and timeliness of the information contained on this site cannot be guaranteed. IC Markets does not warranty, guarantee or make any representations, or assume any liability regarding financial results based on the use of the information in the site.
News, views, opinions, recommendations and other information obtained from sources outside of www.icmarkets.com, used in this site are believed to be reliable, but we cannot guarantee their accuracy or completeness. All such information is subject to change at any time without notice. IC Markets assumes no responsibility for the content of any linked site.
The fact that such links may exist does not indicate approval or endorsement of any material contained on any linked site. IC Markets is not liable for any harm caused by the transmission, through accessing the services or information on this site, of a computer virus, or other computer code or programming device that might be used to access, delete, damage, disable, disrupt or otherwise impede in any manner, the operation of the site or of any user’s software, hardware, data or property.
The post Friday 19th September 2025: Technical Outlook and Review first appeared on IC Markets | Official Blog.
IC Markets Europe Fundamental Forecast | 19 September 2025
421677 September 19, 2025 14:00 ICMarkets Market News
IC Markets Europe Fundamental Forecast | 19 September 2025
What happened in the Asia session?
The BOJ maintained an ultra-cautious position, offering no surprises, causing yen softness and catalyzing risk-on flows into Japanese and Asia-Pacific equities. The broader context was risk appetite fueled by the Fed’s rate cut the previous night, which set records for U.S. and global equity indices. FX volatility (notably in USD/JPY) and adjustments in gold and oil were pronounced, but equities led the reaction on the back of dovish central banks and continued stimulus.
What does it mean for the Europe & US sessions?
As the new trading day begins, attention is focused on the BOJ’s rate decision and accompanying statements, U.K. and Canadian retail sector releases, and several U.S. PMI and inventory indicators. Market participants should stay alert to policy signals from central banks and shifts in consumer and retail trends. In the U.S., after recently lowering the Federal Funds rate by 0.25%, the Federal Reserve has signaled two more possible cuts this year, citing softening labor market conditions even as inflation risks linger.
The Dollar Index (DXY)
Key news events today
No major news event
What can we expect from DXY today?
The US Dollar is navigating between dovish Fed policy and supportive fundamentals on Friday, September 19, 2025. While the Fed’s rate cut initially weakened the dollar, Chair Powell’s cautious messaging and resilient economic data have provided support. The BoJ’s expected inaction today may further benefit the dollar against the yen in the near term, though medium-term trends favor yen strength as monetary policy divergence plays out. Markets continue to price in additional Fed cuts while monitoring global central bank actions and economic data for direction.
Central Bank Notes:
- The Federal Open Market Committee (FOMC) voted, by majority, to lower the federal funds rate target range by 25 basis points to 4.00%–4.25% at its September 16–17, 2025, meeting, marking the first policy rate adjustment since December 2024 after five consecutive holds.
- The Committee maintained its long-term objective of achieving maximum employment and 2% inflation, acknowledging recent labor market softening and continued tariff-driven price pressures.
- Policymakers expressed elevated concern about downside risks to growth, citing a stalling labor market, modest job creation, and an unemployment rate drifting up toward 4.4%. At the same time, inflation remains above target, with CPI at 3.2% and core inflation at 3.1% as of August 2025; higher energy and food prices, largely attributable to tariffs, continue to weigh on headline measures.
- Although economic activity expanded at a moderate pace in the third quarter, the growth outlook has weakened. Q3 GDP growth is estimated near 1.0% (annualized), with full-year 2025 GDP growth guidance revised to 1.2%, reflecting slowing household consumption and tighter financial conditions.
- In the updated Summary of Economic Projections, the unemployment rate is projected to average 4.5% for the year, with headline PCE inflation revised up slightly to 3.1% for 2025. The Committee anticipates core PCE inflation to remain stubborn, requiring sustained vigilance and a flexible approach to risk management.
- The Committee reiterated its data-dependent approach and openness to further adjustments should employment or inflation deviate meaningfully from current forecasts. Several members dissented, either advocating a larger 50-basis-point cut or preferring no adjustment at this meeting, revealing heightened divergence within the Committee.
- Balance sheet reduction continues at a measured pace. The monthly Treasury redemption cap remains at $5B and the agency MBS cap at $35B, as the Board aims to support orderly market conditions in the face of evolving global and domestic uncertainty
- The next meeting is scheduled for 28 to 29 October 2025.
Next 24 Hours Bias
Medium Bearish
Gold (XAU)
Key news events today
No major news event
What can we expect from Gold today?
Gold faces near-term consolidation following its retreat from record highs after the Fed’s cautious rate cut approach. While technical indicators suggest potential for further short-term weakness toward the $3,580-$3,600 support zone, the fundamental backdrop remains strongly supportive. The combination of expected monetary easing, dollar weakness, robust central bank buying, and geopolitical uncertainties continues to underpin gold’s long-term bullish trajectory.
Next 24 Hours Bias
Medium Bullish
The Euro (EUR)
Key news events today
No major news event
What can we expect from EUR today?
The Euro maintains its strong position near four-year highs despite some volatility following the Fed’s rate cut. The ECB’s pause in its easing cycle, combined with stable inflation around the 2% target and improved growth projections, supports the Euro’s strength. However, the currency faces near-term consolidation as markets digest the implications of divergent monetary policies between the ECB and Fed. The Euro’s 14% gain in 2025 reflects improved economic fundamentals and reduced policy uncertainty, though officials remain cautious about future inflation risks.
Central Bank Notes:
- The Governing Council kept the three key ECB interest rates unchanged at its September 11, 2025, meeting. The main refinancing rate remains at 2.15%, the marginal lending facility at 2.40%, and the deposit facility at 2.00%. These levels have been maintained after the cuts earlier in 2025, reflecting the Council’s confidence that the current stance is consistent with the price stability mandate.
- Evidence that inflation is running close to the ECB’s medium-term target of 2% supported the decision to hold rates steady. Domestic price pressures are easing as wage growth continues to moderate, and financing conditions remain accommodative. Policymakers reaffirmed a data-dependent, meeting-by-meeting approach to further policy moves, with no pre-commitment to a predetermined path amid ongoing global and domestic risks.
- Eurosystem staff projections foresee headline inflation averaging 2.0% for 2025, 1.8% for 2026, and 2.0% in 2027. The 2025 and 2026 forecasts reflect a downward revision, primarily on lower energy costs and exchange rate effects, even as food inflation remains persistent. Core inflation (excluding energy and food) is expected at 2.0% for both 2026 and 2027, with only minor changes since prior rounds.
- Real GDP growth in the euro area is projected at 1.1% for 2025, 1.1% for 2026, and 1.4% for 2027. A robust first quarter—partly due to firms accelerating exports ahead of anticipated tariff hikes—cushioned a weaker outlook for the remainder of 2025. While business investment continues to face uncertainty from ongoing global trade disputes, especially with the US, government investment and infrastructure spending are expected to provide some support to the outlook..
- Household spending is backed by rising real incomes and continued strength in the labor market. Despite some fading tailwind from previous rate cuts, financing conditions remain broadly favorable and are expected to underpin the resilience of private consumption and investment against outside shocks. Moderating wage growth and profit margin adjustments are helping to absorb residual cost pressures.
- Household spending is backed by rising real incomes and continued strength in the labor market. Despite some fading tailwind from previous rate cuts, financing conditions remain broadly favorable and are expected to underpin the resilience of private consumption and investment against outside shocks. Moderating wage growth and profit margin adjustments are helping to absorb residual cost pressures.
- All future interest rate decisions will continue to be guided by the integrated assessment of economic and financial data, the inflation outlook, and underlying inflation dynamics, and the effectiveness of monetary policy transmission—without any pre-commitment to a specific future rate path.
- The ECB’s Asset Purchase Programme (APP) and Pandemic Emergency Purchase Programme (PEPP) portfolios are declining predictably, as reinvestment of maturities has ceased. Balance-sheet normalization continues in line with the ECB’s previously communicated schedule.
- The next meeting is on 29 to 30 October 2025
Next 24 Hours Bias
Medium Bullish
The Swiss Franc (CHF)
Key news events today
No major news event
What can we expect from CHF today?
The Swiss Franc continues to dominate currency markets on Friday, September 19, 2025, driven by persistent safe-haven demand amid global uncertainties. While the SNB maintains an accommodative policy with rates at zero, officials signal reluctance to return to negative territory despite ongoing deflationary pressures. The combination of US trade tensions, geopolitical risks, and Switzerland’s economic challenges creates a complex environment where the franc’s strength both reflects its safe-haven status and poses risks to the export-dependent economy.
Central Bank Notes:
- The SNB eased monetary policy by lowering its key policy rate by 25 basis points, from 0.25% to 0% on 19 June 2025, marking the sixth consecutive reduction.
- Inflationary pressure has decreased further as compared to the previous quarter, decreasing from 0.3% in February to -0.1% in May, mainly attributable to lower prices in tourism and oil products.
- Compared to March, the new conditional inflation forecast is lower in the short term. In the medium term, there is hardly any change from March, putting the average annual inflation at 0.2% for 2025, 0.5% for 2026, and 0.7% for 2027.
- The global economy continued to grow at a moderate pace in the first quarter of 2025, but the global economic outlook for the coming quarters has deteriorated due to the increase in trade tensions.
- Swiss GDP growth was strong in the first quarter of 2025, but this development was largely because, as in other countries, exports to the U.S. were brought forward.
- Following the strong first quarter, growth is likely to slow again and remain rather subdued over the remainder of the year; the SNB expects GDP growth of 1% to 1.5% for 2025 as a whole, while also anticipating GDP growth of 1% to 1.5% for 2026.
- The SNB will continue to monitor the situation closely and will adjust its monetary policy if necessary to ensure inflation remains within the range consistent with price stability over the medium term.
- The next meeting is on 25 September 2025.
Next 24 Hours Bias
Medium Bullish
The Pound (GBP)
Key news events today
Retail Sales m/m (6:00 am GMT)
What can we expect from GBP today?
Sterling’s recent gains reflect cautious optimism pending BoE policy outcomes, but upside is seen as limited unless economic data surprises or the BoE signals a policy shift. Overall, market focus today is on the tone of the BoE statement and any hints about future rate cuts. Labor market data shows stable unemployment at 4.7%, wage growth of 4.8% (excluding bonuses), and a slight fall in payrolls by 8,000—broadly in line with forecasts and suggesting a gradually slowing jobs market.
Central Bank Notes:
- The Bank of England’s Monetary Policy Committee (MPC) voted on 18 September 2025 by a majority (expected split likely 7–2 or 6–3) to hold the Bank Rate steady at 4.00%, following the August rate cut. Most members cited persistent inflation and mixed indicators on growth and employment, while a minority favored further easing due to the cooling labor market and subdued GDP growth.
- The Committee decided to decrease the pace of quantitative tightening, planning to reduce the stock of UK government bond purchases by £67.5 billion over the next 12 months instead of the prior £100 billion pace, with the gilt balance now standing near £558 billion. This reflects increased volatility in bond markets and a shift to a more gradual approach.
- Headline inflation rose unexpectedly to 3.8% in July and is projected at 4% for September, above the Bank’s 2% target. Price pressures are driven by regulated energy costs and ongoing food price increases. While previous disinflation has been substantial, core inflation remains elevated and sticky.
- The MPC expects headline inflation to remain above target through Q4, with a resumption of the downward trend projected for early 2026 as energy and regulated price pressures abate. The Committee remains watchful for signs of persistent inflation despite previous policy tightening.
- UK GDP growth is stagnant, with business and consumer activity subdued. Recent labor market data show rising unemployment rates (now at 4.7%) and stabilizing wage growth (holding near 5%), indicating slack but continued wage price pressure. The Committee remains cautious amid lackluster demand and soft survey sentiment.
- Pay growth and employment indicators have moderated further, alongside confirmation from business surveys that pay settlements are slowing. The Committee expects wage growth to decelerate significantly through Q4 and the rest of 2025.
- Global uncertainty persists due to volatile energy prices, supply chain disruptions linked to Middle East conflicts, and renewed trade tensions. The MPC remains vigilant in tracking transmission of external cost/wage shocks to UK inflation.
- Risks to inflation are considered two-sided. While subdued domestic growth and softening labor activity suggest scope for easing, persistent inflation requires caution. The MPC anticipates a slow, gradual reduction path in rates, continuing its data-dependent approach with careful adjustment as warranted by economic developments.
- The Committee’s bias remains toward maintaining a restrictive monetary policy stance until firmer evidence emerges that inflation will return sustainably to the 2% target. All future decisions will remain highly data dependent, with a strong emphasis on evolving demand, inflation expectations, costs, and labor market conditions.
- The next meeting is on 6 November 2025.
Next 24 Hours Bias
Medium Bullish
The Canadian Dollar (CAD)
Key news events today
Core Retail Sales m/m (12:30 pm GMT)
Retail Sales m/m (12:30 pm GMT)
What can we expect from CAD today?
The Canadian dollar faces continued pressure following the Bank of Canada’s rate cut on Wednesday, with the central bank signaling readiness for additional easing if economic conditions deteriorate further. While avoiding recession, Canada’s economy is adjusting to trade disruptions, with slow growth expected through the remainder of 2025. The upcoming retail sales data today and the potential for further monetary easing in October remain key factors for CAD direction in the near term.
Central Bank Notes:
- The Bank of Canada reduced its target for the overnight rate to 2.50% at its September 17 meeting, with the Bank Rate at 2.75% and the deposit rate at 2.25%. This marks the first rate cut since early 2025, as the Bank responded to a string of softer inflation prints and persistent economic headwinds.
- The Council cited continued U.S. tariff volatility and slow progress on trade negotiations as major contributors to ongoing uncertainty. While headline tariffs have not escalated further, the unpredictability of U.S. policy remains a significant risk for Canadian exports and business confidence.
- Uncertainty about U.S. trade policy and recurring tariff threats continued to weigh on growth prospects. The Bank flagged downside risks to the export sector, with survey data indicating ongoing hesitancy among manufacturers and exporters.
- After modest growth in Q1, Canada’s economy slipped into contraction, with GDP shrinking by 0.8% in Q2 and forecast to decrease again by 0.8% in Q3. Economic weakness has been most pronounced in manufacturing and goods-producing sectors affected by trade frictions and softer U.S. demand.
- Early estimates show that growth stabilized in September but remained well below the Bank’s 2% forecast for Q4. Manufacturing output has improved slightly—supported by a modest rebound in petroleum and mining activity—while consumer spending and retail sales were largely flat.
- Consumer spending remained subdued as households continued to limit discretionary purchases amid uncertainty and a slower job market. Housing activity stayed weak, despite earlier government efforts to boost affordability and modest gains in some real estate segments.
- Headline CPI inflation edged up to 1.9% in August, undershooting economist expectations but still showing emerging pressures from shelter and imported goods costs. Core inflation metrics were mixed, though price growth remains just below the Bank’s 2% target.
- The Governing Council reaffirmed its cautious approach, emphasizing that while further rate cuts are possible, the pace will hinge on the path of U.S. tariffs, domestic inflation dynamics, and signs of a sustainable recovery. The Bank remains vigilant against the risk of inflation falling below target in the face of economic slack.
- The next meeting is on 29 October 2025.
Next 24 Hours Bias
Medium Bearish
Oil
Key news events today
No major news event
What can we expect from Oil today?
Friday’s oil market is characterized by competing forces: while the Fed’s rate cut and supply disruptions from Ukrainian strikes on Russian infrastructure provide upward pressure, concerns about US economic weakness and rising distillate inventories are weighing on prices. The market continues to assess whether OPEC+’s aggressive return of supply can be absorbed without further price declines, especially as the peak summer driving season concludes. Global oil demand averaged 104.4 million bpd through September 17, rising modestly year-over-year but slightly below forecasts.
Next 24 Hours Bias
Weak Bearish
The post IC Markets Europe Fundamental Forecast | 19 September 2025 first appeared on IC Markets | Official Blog.
General Market Analysis – 19/09/25
421676 September 19, 2025 13:39 ICMarkets Market News
Stocks Hit Fresh Records After Fed Cut – Nasdaq up 0.94%
US equities surged to fresh record highs again overnight, building on the momentum from the Fed’s first rate cut of the year. The Dow closed up 0.27% at 46,142, the S&P added 0.48% to 6,631, and the Nasdaq led the way higher, jumping 0.94% to 22,470. Bond markets were also active, with Treasury yields pushing higher as weekly unemployment claims came in stronger than expected. The 2-year yield ticked up 1 bp to 3.56%, while the 10-year rose nearly 2 bps to 4.10%. The dollar also rallied, climbing 0.50% to 97.36. Commodities struggled on the day, with oil sliding further as traders priced in slowing US growth. Brent slipped 0.63% to $67.52, while WTI dropped 0.75% to $63.57. Gold also eased back into recent ranges, losing 0.42% to $3,643.48.
Bank of Japan in Focus for Yen Traders Today
The Bank of Japan is scheduled to deliver its latest interest rate update this morning in the Asian session, and yen traders are preparing for a busy day. The market is fully expecting the bank to keep rates at 0.5%; however, as always, the forward guidance in the Policy Statement and later press conference will likely spark strong moves in the currency. The main focus will be on inflation and any hints about further rate hikes, and anything more hawkish will likely see some good yen buying coming into the market. USDJPY dipped to 145.47 on the Fed rate cut on Wednesday but has since jumped nearly 2% to trade around the 148.20 level this morning. Resistance now comes in at the 200-day moving average at 148.64 and a long-term trendline just above 149.00, and traders will be looking to fade moves to those levels if we do hear a more hawkish tone today.
Another Busy Trading Day to End the Week
It looks like being a busy day to close out the trading week, with another key central bank rate call due to kick off the day and more data out later. Yen traders are preparing for a lively session with the Bank of Japan rate decision and press conference due during the Asian session. As usual, there is no fixed time for the announcement, but it usually comes out around Tokyo lunchtime. The focus will then shift to retail sales data out of the UK (exp. +0.4% m/m) this afternoon and Canada (exp. -0.6% m/m) later in the US session, with moves expected in their respective currencies. Traders will also be watching comments from FOMC member Mary Daly in the early hours of tomorrow morning, which will be closely monitored given the Fed’s move on Wednesday and political moves against the committee.
The post General Market Analysis – 19/09/25 first appeared on IC Markets | Official Blog.
Friday 19th September 2025: Asian Stocks Mixed as Fed Cut Lifts Tech
421675 September 19, 2025 13:39 ICMarkets Market News
Global Markets:
- Asian Stock Markets : Nikkei down -0.77%, Shanghai Composite down -0.36%, Hang Seng down -0.33% ASX up 0.37%
- Commodities : Gold at $3,687.90 (0.26%), Silver at $42.498 (0.90%), Brent Oil at $67.16 (-0.42%), WTI Oil at $63.23 (-0.53%)
- Rates : US 10-year yield at 4.120, UK 10-year yield at 4.6810, Germany 10-year yield at 2.7160
News & Data:
- (GBP) Official Bank Rate 4.00% to 4.00% expected
- (USD) Unemployment Claims 231K to 241K expected
Markets Update:
Asian stock markets traded mixed on Friday, tracking Wall Street’s overnight gains as investors assessed the U.S. Federal Reserve’s latest quarter-point rate cut. Fed projections signaled two more cuts this year but only one in 2026, with policymakers divided on the outlook.
Technology stocks lifted sentiment across the region, echoing Nasdaq’s rally after Intel surged nearly 23 percent on news of a collaboration with Nvidia to co-develop next-generation data center and PC products.
In Australia, the S&P/ASX 200 advanced 72.10 points or 0.82 percent to 8,817.30, with financials, energy, and tech stocks offsetting mixed mining performance. Oil names like Origin Energy gained over 3 percent, while tech firms such as Zip and Block rose up to 3 percent. Banks also saw broad gains, led by Commonwealth Bank. Telix Pharmaceuticals jumped more than 7 percent after Citi rated it a “buy.”
Japan’s Nikkei 225 climbed 348.65 points or 0.77 percent to 45,652.08, touching a record high earlier in the session. Automakers Toyota and Honda advanced, while tech majors Advantest and Screen Holdings gained sharply. Inflation data showed consumer prices rising 2.7 percent annually in August, easing from July, as the Bank of Japan prepared to conclude its policy meeting, widely expected to keep rates unchanged.
Elsewhere, markets were mixed: China, Singapore, South Korea, and Malaysia slipped, while New Zealand and Hong Kong advanced modestly.
On Wall Street, the Nasdaq led Thursday’s rally, up 0.9 percent, with the S&P 500 and Dow also closing higher.
Upcoming Events:
- 12:30 PM GMT – CAD Core Retail Sales m/m
- 12:30 PM GMT – CAD Retail Sales m/m
The post Friday 19th September 2025: Asian Stocks Mixed as Fed Cut Lifts Tech first appeared on IC Markets | Official Blog.
Ex-Dividend 19/9/2025
421647 September 18, 2025 17:41 ICMarkets Market News
The post Ex-Dividend 19/9/2025 first appeared on IC Markets | Official Blog.
IC Markets Asia Fundamental Forecast | 18 September 2025
421641 September 18, 2025 15:07 ICMarkets Market News
IC Markets Asia Fundamental Forecast | 18 September 2025
What happened in the U.S. session?
The U.S. session was marked by caution and tight trading ranges as markets awaited clarity from the Federal Reserve’s rate decision. Equity indices moved little except for standout company and sector-specific stories, the dollar found modest strength, and both safe havens (like Treasuries, gold) and commodities (like oil) responded mildly to macro data and evolving Fed expectations.
What does it mean for the Asia Session?
Thursday presents a data-heavy session for Asian markets with Australia’s employment figures and the UK’s monetary policy decision as primary catalysts. The broader backdrop remains supportive for risk assets given expectations for continued global monetary easing, though persistent inflation concerns, particularly in the UK, highlight the divergent paths central banks are taking. Oil market volatility and US-China trade developments add additional layers of complexity to the trading environment.
The Dollar Index (DXY)
Key news events today
Unemployment Claims (12:30 pm GMT)
Philly Fed Manufacturing Index (12:30 pm GMT)
What can we expect from DXY today?
Thursday, September 18, 2025, represents a continuation of the dollar’s bearish momentum following the Fed’s rate cut decision. The combination of deteriorating labor market conditions, political uncertainty around Fed independence, and expectations for continued monetary easing has created a perfect storm for dollar weakness. While inflation risks could provide temporary support, the broader trend suggests continued pressure on the greenback as the Fed embarks on its easing cycle. Market participants are closely monitoring upcoming economic data and Fed communications for signals about the pace and extent of future rate cuts.
Central Bank Notes:
- The Federal Open Market Committee (FOMC) voted, by majority, to lower the federal funds rate target range by 25 basis points to 4.00%–4.25% at its September 16–17, 2025, meeting, marking the first policy rate adjustment since December 2024 after five consecutive holds.
- The Committee maintained its long-term objective of achieving maximum employment and 2% inflation, acknowledging recent labor market softening and continued tariff-driven price pressures.
- Policymakers expressed elevated concern about downside risks to growth, citing a stalling labor market, modest job creation, and an unemployment rate drifting up toward 4.4%. At the same time, inflation remains above target, with CPI at 3.2% and core inflation at 3.1% as of August 2025; higher energy and food prices, largely attributable to tariffs, continue to weigh on headline measures.
- Although economic activity expanded at a moderate pace in the third quarter, the growth outlook has weakened. Q3 GDP growth is estimated near 1.0% (annualized), with full-year 2025 GDP growth guidance revised to 1.2%, reflecting slowing household consumption and tighter financial conditions.
- In the updated Summary of Economic Projections, the unemployment rate is projected to average 4.5% for the year, with headline PCE inflation revised up slightly to 3.1% for 2025. The Committee anticipates core PCE inflation to remain stubborn, requiring sustained vigilance and a flexible approach to risk management.
- The Committee reiterated its data-dependent approach and openness to further adjustments should employment or inflation deviate meaningfully from current forecasts. Several members dissented, either advocating a larger 50-basis-point cut or preferring no adjustment at this meeting, revealing heightened divergence within the Committee.
- Balance sheet reduction continues at a measured pace. The monthly Treasury redemption cap remains at $5B and the agency MBS cap at $35B, as the Board aims to support orderly market conditions in the face of evolving global and domestic uncertainty.
- The next meeting is scheduled for 28 to 29 October 2025.
Next 24 Hours Bias
Medium Bearish
Gold (XAU)
Key news events today
Unemployment Claims (12:30 pm GMT)
Philly Fed Manufacturing Index (12:30 pm GMT)
What can we expect from Gold today?
Thursday, September 18, 2025, finds gold in a consolidation phase following its record-breaking rally to $3,703. The Federal Reserve’s 25 basis point rate cut has been well-received by markets, reinforcing expectations for continued monetary easing that should support gold prices. While technical indicators suggest some near-term consolidation or minor correction is possible, the fundamental backdrop remains strongly supportive with multiple catalysts, including dovish Fed policy, geopolitical tensions, and robust central bank demand.
Next 24 Hours Bias
Strong Bullish
The Australian Dollar (AUD)
Key news events today
Employment Change (1:30 am GMT)
Unemployment Rate (1:30 am GMT)
What can we expect from AUD today?
The AUD is near multi-month highs driven by steady domestic data and anticipation of central bank decisions. Labour market releases show stable job growth and unemployment, providing underlying support for the currency. RBA policy remains cautious, focusing on inflation and employment. Upcoming Fed decisions and Chinese demand for commodities will shape AUD’s next moves.
Central Bank Notes:
- The RBA held its cash rate steady at 3.60% at its September meeting on 8–9 September 2025, following a 25 basis point reduction at the August meeting. This maintains a cautious yet supportive stance, with the decision largely anticipated given recent evidence of inflation settling within the target band.
- Inflation readings continue to ease, with headline CPI most likely tracking near 2.1–2.3%—comfortably within the 2–3% target range. September quarter figures are pending, but leading indicators show further moderation in non-housing components, even as insurance and housing-related costs remain sticky.
- The RBA’s preferred trimmed mean inflation is estimated at around 2.7%–2.9%, further reflecting progress toward the midpoint of the target range. Energy and food volatility still create some short-term uncertainty, but underlying inflation is broadly on track.
- Global conditions are a key source of risk. While U.S.–EU trade tensions have stabilized slightly, volatility in equities and commodities persists, with uncertainty feeding through to Australia’s trade and export outlook.
- Domestic demand shows tentative improvement. Real household incomes and a stabilizing housing sector have underpinned modest consumption growth, though business investment remains uneven—service sectors outperforming manufacturing and construction.
- Labor market tightness persists, but momentum continues to slow from earlier in the year. Employment gains remain, but job vacancies and hiring intentions have softened, with underutilization rising marginally for the second straight month.
- Wage growth has slowed in line with easing labour pressures, but unit labour costs remain elevated due to weak productivity. The RBA continues to flag subdued productivity as a medium-term cost risk.
- Forward indicators suggest household consumption may be softer than previously forecast. Elevated rents and high borrowing costs are dampening discretionary spending, despite modest income recovery.
- The Board continues to highlight the risk that household spending could underperform, potentially weighing on business investment and job creation if confidence remains subdued.
- Monetary policy remains mildly restrictive, in line with greater inflation control and ongoing economic rebalancing. The decision to hold rates recognizes both progress and ongoing uncertainties, with future moves explicitly tied to incoming data.
- The Reserve Bank reinforced its goals of price stability and full employment, stating readiness to adjust policy if economic or inflation outcomes diverge from baseline projections.
- The next meeting is on 29 to 30 September 2025.
Next 24 Hours Bias
Medium Bullish
The Kiwi Dollar (NZD)
Key news events today
No major news event
What can we expect from NZD today?
The New Zealand Dollar (NZD) on Thursday, 18th of September 2025, is trading cautiously as markets react to domestic economic data and global central bank decisions. The focus is on GDP figures and expectations for further monetary easing by the Reserve Bank of New Zealand (RBNZ), alongside significant moves in global currency markets due to anticipated U.S. Federal Reserve actions.
Central Bank Notes:
- The Monetary Policy Committee (MPC) agreed to cut the Official Cash Rate (OCR) by 25 basis points to 3.00% on 20 August 2025, marking a three-year low and continuing the easing cycle after July’s pause. The vote was split 4-2, with two members advocating a 50-basis-point cut, highlighting diverging views within the Committee.
- Policymakers indicated that significant uncertainty and a stalling economic recovery prompted this move, leaving the door open for further rate cuts later in the year, with a possible trough around 2.5% by December.
- Annual consumer price index inflation rose to 2.7% in the June quarter and is expected to reach 3% for the September quarter—at the upper end of the MPC’s 1 to 3% target band—but medium-term expectations remain anchored near the 2% midpoint.
- Despite the near-term uptick, headline inflation is projected to return toward 2% by mid-2026, as tradables inflation pressures ease and significant spare capacity continues to dampen domestic price momentum.
- Domestic financial conditions are broadly aligning with MPC expectations, as lower wholesale rates have translated into reduced borrowing costs for households. However, declining consumption and investment demand, higher unemployment, and subdued wage growth reflect ongoing economic slack.
- GDP growth stalled in the second quarter of 2025, contrasting with earlier projections. High-frequency indicators point to continued weakness driven by rising prices for essentials, weakening household savings, and constrained business lending.
- The MPC cautioned that ongoing global tariff uncertainties and policy shifts, especially recent changes in US trade regulations, could amplify market volatility and present both upside and downside risks to New Zealand’s recovery.
- Subject to medium-term inflation pressures continuing to ease as projected, the MPC signaled scope for further OCR cuts, possibly down to 2.5% by year-end, consistent with the latest Monetary Policy Statement outlook.
- The next meeting is on 22 October 2025.
Next 24 Hours Bias
Weak Bullish
The Japanese Yen (JPY)
Key news events today
No major news events.
What can we expect from JPY today?
Investor attention is firmly on the BoJ’s meeting and the Fed’s rate decision, with Japanese yen price action dictated by global monetary policy and ongoing domestic weakness in trade data. While market risk is slowly shifting toward potential Fed rate cuts, the BoJ’s cautious stance and domestic challenges limit the yen’s ability to strengthen significantly in the near term.
Central Bank Notes:
- The Policy Board of the Bank of Japan decided on 17 September, by a unanimous vote, to set the following guidelines for money market operations for the inter-meeting period:
- The Bank will encourage the uncollateralized overnight call rate to remain at around 0.5%.
- The BOJ will continue its gradual reduction of monthly outright purchases of Japanese Government Bonds (JGBs). The scheduled amount of long-term government bond purchases remains unchanged from the prior decision, with a quarterly reduction pace of about ¥400 billion through March 2026 and about ¥200 billion per quarter from April to June 2026 onward, aiming for a purchase level near ¥2 trillion in January to March 2027.
- Japan’s economy continues to show a moderate recovery, with household consumption supported by rising incomes, although corporate activity has softened somewhat. Overseas economies remain on a moderate growth path, with the impact of global trade policies still weighing on Japan’s export and industrial production outlook.
- On the price front, the year-on-year rate of change in consumer prices (excluding fresh food) remains in the mid-3% range. Inflationary pressures remain broad-based, with persistent cost-push factors in food and energy, alongside solid wage pass-through. However, input cost pressures from past import surges are showing early signs of easing.
- Short-term inflation momentum may moderate as cost-push effects diminish, though rent increases and service-related price gains tied to labor shortages are likely to provide support. Inflation expectations among firms and households continue a gradual upward drift.
- Looking ahead, the economy is projected to grow at a slower-than-trend pace in the near term due to external demand softness and cautious corporate investment plans. However, accommodative financial conditions and steady increases in real labor income are expected to underpin domestic demand.
- In the medium term, as overseas economies recover and global trade stabilizes, Japan’s growth potential is likely to improve. With persistent labor market tightness and rising medium- to long-term inflation expectations, core inflation is projected to remain on a gradual upward trend, converging toward the 2% price stability target in the latter half of the projection horizon.
- The next meeting is scheduled for 30 to 31 October 2025.
Next 24 Hours Bias
Medium Bullish
Oil
Key news events today
No major news event
What can we expect from Oil today?
The US Energy Information Administration projects Brent crude could decline further, averaging $59 per barrel in Q4 2025, due to accumulating global inventories and the shift in OPEC+ policy. While supply risks persist, especially from geopolitical flashpoints and potential Middle East instability, the markets are currently focused on demand concerns and looming global surplus . Analysts are watching the US Fed’s rate decision closely, as lower rates could eventually stimulate economic activity and oil demand, but near-term sentiment remains cautious, skewed toward further price softness.
Next 24 Hours Bias
Medium Bearish
The post IC Markets Asia Fundamental Forecast | 18 September 2025 first appeared on IC Markets | Official Blog.
Thursday 18th September 2025: Technical Outlook and Review
421627 September 18, 2025 14:39 ICMarkets Market News
DXY (U.S. Dollar Index):
Potential Direction: Bearish
Overall momentum of the chart: Bearish
The price could see a short-term pullback toward the pivot before continuing its bearish move down toward the 1st support.
Pivot: 97.36
Supporting reasons: Identified as a pullback resistance, where selling pressures could intensify and potentially cap any upward retracement.
1st support: 96.47
Supporting reasons: Identified as a swing low support that aligns with the 127.2% Fibonacci extension, indicating a potential area where the price could again stabilize.
1st resistance: 98.12
Supporting reasons: Identified as an overlap resistance, acting as a ceiling for price and potentially preventing further upward movement.
EUR/USD:
Potential Direction: Bullish
Overall momentum of the chart: Bullish
The price could see a pullback toward the pivot before making a bullish rise toward the 1st resistance
Pivot: 1.1768
Supporting reasons: Identified as a pullback support, where buying pressure could emerge and provide a base for the next upward move.
1st support: 1.1678
Supporting reasons: Identified as an overlap support, providing a strong level where price could stabilize again if the market retraces deeper.
1st resistance: 1.1895
Supporting reasons: Identified as a resistance that is supported by 127.2% Fibonacci extension and the 127.2% Fibonacci projection, marking a key level that could temporarily halt upward momentum.
EUR/JPY:
Potential Direction: Bullish
Overall momentum of the chart: Bullish
The price has already bounced off the pivot and could continue its bullish move toward the 1st resistance.
Pivot: 173.25
Supporting reasons: Identified as a pullback support, where renewed buying pressure could emerge to push the price higher.
1st Support: 172.66
Supporting reasons: Identified as a pullback support, marking a key stabilization zone if the price retraces deeper.
1st Resistance: 173.90
Supporting reasons: Identified as a swing high resistance, where upward momentum could face a potential barrier.
EUR/GBP:
Potential Direction: Bullish
Overall momentum of the chart: Bullish
The price has already bounced off the pivot and could continue its bullish move toward the 1st resistance.
Pivot: 0.8658
Supporting reasons: Identified as a pullback support that aligns with the 61.8% Fibonacci retracement, indicating a potential area where buying interest could pick up.
1st support: 0.8637
Supporting reasons: Identified as a multi-swing low support, providing a solid stabilization zone if price retraces.
1st resistance: 0.8690
Supporting reasons: Identified as an overlap resistance, making it a strong barrier where upward momentum could slow.
GBP/USD:
Potential Direction: Bullish
Overall momentum of the chart: Bullish
The price could make a short-term pullback toward the pivot before rising again toward the 1st resistance
Pivot: 1.3576
Supporting reasons: Identified as a pullback support, where renewed buying pressure could emerge to push the price higher.
1st support: 1.3480
Supporting reasons: Identified as a pullback support, indicating a potential area where the price could stabilize once more.
1st resistance: 1.3691
Supporting reasons: Identified as a pullback resistance that aligns with the 161.8% Fibonacci extension, indicating a potential level that could halt further upward movement.
GBP/JPY:
Potential Direction: Bullish
Overall momentum of the chart: Bullish
The price has already bounced off the pivot and could continue its bullish move toward the 1st resistance.
Pivot: 199.56
Supporting reasons: Identified as a pullback support that aligns with the 61.8% Fibonacci retracement, where renewed buying pressure could emerge to push the price higher.
1st support: 198.57
Supporting reasons: Identified as a swing low support, indicating a potential level where the price could stabilize once more.
1st resistance: 200.71
Supporting reasons: Identified as a swing high resistance, indicating a potential level that could halt further upward movement.
USD/CHF:
Potential Direction: Bearish
Overall momentum of the chart: Bullish
The price could see a short-term pullback toward the pivot before continuing its bearish move down toward the 1st support.
Pivot: 0.7917
Supporting reasons: Identified as a pullback resistance, where selling pressures could intensify and potentially cap any upward retracement.
1st support: 0.7851
Supporting reasons: Identified as a support that is supported by the 100% Fibonacci projection, indicating a potential level where the price could stabilize once again.
1st resistance: 0.7986
Supporting reasons: Identified as an overlap resistance, indicating a potential level that could cap further upward movement.
USD/JPY:
Potential Direction: Bearish
Overall momentum of the chart: Bullish
The price has already reacted off the pivot and could continue its bearish move down toward the 1st support.
Pivot: 147.07
Supporting reasons: Identified as a pullback resistance, where selling pressures could intensify and potentially cap any upward retracement.
1st support: 146.03
Supporting reasons: Identified as a swing low support that aligns with the 78.6% Fibonacci projection, indicating a potential area where the price could again stabilize.
1st resistance: 147.90
Supporting reasons: Identified as an overlap resistance, acting as a ceiling for price and potentially preventing further upward movement.
USD/CAD:
Potential Direction: Bearish
Overall momentum of the chart: Bearish
The price could see a short-term pullback toward the pivot before continuing its bearish move down toward the 1st support.
Pivot: 1.3793
Supporting reasons: Identified as a pullback resistance that aligns with the 38.2% Fibonacci retracement, where selling pressures could intensify and potentially cap any upward retracement.
1st support: 1.3724
Supporting reasons: Identified as an overlap that aligns with the 161.8% Fibonacci extension, indicating a potential area where the price could again stabilize.
1st resistance: 1.3830
Supporting reasons: Identified as a pullback resistance that aligns with the 61.8% Fibonacci retracement, acting as a ceiling for price and potentially preventing further upward movement.
AUD/USD:
Potential Direction: Bullish
Overall momentum of the chart: Bullish
The price could see a pullback toward the pivot before making a bullish rise toward the 1st resistance
Pivot: 0.6619
Supporting reasons: Identified as a pullback support, where buying pressure could emerge and provide a base for the next upward move.
1st support: 0.6558
Supporting reasons: Identified as a pullback support, providing a strong level where price could stabilize again if the market retraces deeper.
1st resistance: 0.6689
Supporting reasons: Identified as a resistance that is supported by the 127.2% Fibonacci extension, marking a key level that could temporarily halt upward momentum.
NZD/USD
Potential Direction: Bullish
Overall momentum of the chart: Bullish
The price could see a pullback toward the pivot before making a bullish rise toward the 1st resistance
Pivot: 0.5913
Supporting reasons: Identified as an overlap support that aligns with the 50% Fibonacci retracement, where buying pressure could emerge and provide a base for the next upward move.
1st support: 0.5883
Supporting reasons: Identified as a pullback support, providing a strong level where price could stabilize again if the market retraces deeper.
1st resistance: 0.5966
Supporting reasons: Identified as a pullback resistance, marking a key level that could temporarily halt upward momentum.
US30 (DJIA):
Potential Direction: Bullish
Overall momentum of the chart: Bullish
The price has already bounced off the pivot and could continue its bullish move toward the 1st resistance.
Pivot: 45,675.57
Supporting reasons: Identified as an overlap support, indicating a potential area where buying interest could pick up.
1st support: 45,297.04
Supporting reasons: Identified as an overlap support, providing a solid stabilization zone if price retraces.
1st resistance: 46,129.86
Supporting reasons: Identified as a resistance that is supported with the 161.8% Fibonacci extension, making it a strong barrier where upward momentum could slow.
DE40 (DAX):
Potential Direction: Bearish
Overall momentum of the chart: Bullish
The price is rising toward the pivot and could make a bearish move toward the 1st support.
Pivot: 23,545.77
Supporting reasons: Identified as a pullback resistance, indicating a potential area where selling pressures could intensify.
1st support: 23,237.71
Supporting reasons: Identified as a support that is supported by the 161.8% Fibonacci extension, indicating a key level where the price could stabilize once more.
1st resistance: 23,873.56
Supporting reasons: Identified as an overlap resistance, indicating a potential area that could halt any further upward movement.
US500 (S&P 500):
Potential Direction: Bullish
Overall momentum of the chart: Bullish
The price could see a pullback toward the pivot before making a bullish rise toward the 1st resistance
Pivot: 6,593.20
Supporting reasons: Identified as a pullback support, where buying pressure could emerge and provide a base for the next upward move.
1st support: 6,547.19
Supporting reasons: Identified as a pullback support, providing a strong level where price could stabilize again if the market retraces deeper.
1st resistance: 6,657.32
Supporting reasons: Identified as a resistance that is supported by the 100% Fibonacci projection, marking a key level that could temporarily halt upward momentum.
BTC/USD (Bitcoin):
Potential Direction: Bullish
Overall momentum of the chart: Bullish
The price has already bounced off the pivot and could continue its bullish move toward the 1st resistance.
Pivot: 115,494.52
Supporting reasons: Identified as a pullback support, where buying pressure could emerge and provide a base for the next upward move.
1st support: 112,962.02
Supporting reasons: Identified as a pullback support, providing a strong level where price could stabilize again if the market retraces deeper.
1st resistance: 118.235.69
Supporting reasons: Identified as an overlap that aligns with the 161.8% Fibonacci extension, marking a key level that could temporarily halt upward momentum.
ETH/USD (Ethereum):
Potential Direction: Bullish
Overall momentum of the chart: Bullish
The price has already bounced off the pivot and could continue its bullish move toward the 1st resistance.
Pivot: 4,477.50
Supporting reasons: Identified as an overlap support that aligns with the 61.8% Fibonacci retracement, indicating a potential area where buying interest could pick up.
1st support: 4,239.45
Supporting reasons: Identified as an overlap support, providing a solid stabilization zone if price retraces.
1st resistance: 4,761.40
Supporting reasons: Identified as an overlap resistance, making it a strong barrier where upward momentum could slow.
WTI/USD (Oil):
Potential Direction: Bullish
Overall momentum of the chart: Bullish
The price could see a pullback toward the pivot before making a bullish rise toward the 1st resistance
Pivot: 63.93
Supporting reasons: Identified as a pullback support, where buying pressure could emerge and provide a base for the next upward move.
1st support: 62.09
Supporting reasons: Identified as a swing low support, providing a strong level where price could stabilize again if the market retraces deeper.
1st resistance: 66.15
Supporting reasons: Identified as an overlap resistance that aligns closely with the 161.8% Fibonacci extension, marking a key level that could temporarily halt upward momentum.
XAU/USD (GOLD):
Potential Direction: Bearish
Overall momentum of the chart: Bullish
The price could see a short-term pullback toward the pivot before continuing its bearish move down toward the 1st support.
Pivot: 3,674.77
Supporting reasons: Identified as a pullback resistance, where selling pressures could intensify and potentially cap any upward retracement.
1st support: 3,624.94
Supporting reasons: Identified as a swing low support, providing a strong level where price could stabilize again if the market retraces deeper.
1st resistance: 3,697.76
Supporting reasons: Identified as a swing high resistance, marking a key level that could temporarily halt upward momentum.
The accuracy, completeness and timeliness of the information contained on this site cannot be guaranteed. IC Markets does not warranty, guarantee or make any representations, or assume any liability regarding financial results based on the use of the information in the site.
News, views, opinions, recommendations and other information obtained from sources outside of www.icmarkets.com, used in this site are believed to be reliable, but we cannot guarantee their accuracy or completeness. All such information is subject to change at any time without notice. IC Markets assumes no responsibility for the content of any linked site.
The fact that such links may exist does not indicate approval or endorsement of any material contained on any linked site. IC Markets is not liable for any harm caused by the transmission, through accessing the services or information on this site, of a computer virus, or other computer code or programming device that might be used to access, delete, damage, disable, disrupt or otherwise impede in any manner, the operation of the site or of any user’s software, hardware, data or property.
The post Thursday 18th September 2025: Technical Outlook and Review first appeared on IC Markets | Official Blog.
IC Markets Europe Fundamental Forecast | 18 September 2025
421626 September 18, 2025 14:39 ICMarkets Market News
IC Markets Europe Fundamental Forecast | 18 September 2025
What happened in the Asia session?
Today’s Asia session was defined by the fallout from the Fed’s quarter-point rate cut and Australia’s worse-than-expected jobs data, which pressured the AUD and weighed on local equities. Regional equities were mixed, with Japan’s Nikkei continuing to set the pace, while safe-haven flows supported the yen and gold. Markets are now awaiting outcomes from the BOJ meeting and Japanese inflation data later in the week.
What does it mean for the Europe & US sessions?
Today’s trading environment is characterized by central bank caution amid persistent inflation concerns. The BoE is expected to pause rate cuts despite economic weakness, while the Fed’s measured approach has strengthened the dollar and pressured commodities. Employment data from Australia and the US both show labor market softening, though inflation remains the primary concern for policymakers globally. Traders should monitor any dovish surprises from the BoE and manufacturing data for signs of economic momentum shifts.
The Dollar Index (DXY)
Key news events today
Unemployment Claims (12:30 pm GMT)
Philly Fed Manufacturing Index (12:30 pm GMT)
What can we expect from DXY today?
Thursday’s dollar performance reflected the ongoing market adjustment to the Fed’s dovish pivot, with the currency showing modest strength despite underlying concerns about labor market deterioration. The dollar’s recovery from Wednesday’s lows suggests markets are taking a more balanced view of the Fed’s cautious approach to further easing, though significant uncertainty remains about the pace of future rate cuts.
Central Bank Notes:
- The Federal Open Market Committee (FOMC) voted, by majority, to lower the federal funds rate target range by 25 basis points to 4.00%–4.25% at its September 16–17, 2025, meeting, marking the first policy rate adjustment since December 2024 after five consecutive holds.
- The Committee maintained its long-term objective of achieving maximum employment and 2% inflation, acknowledging recent labor market softening and continued tariff-driven price pressures.
- Policymakers expressed elevated concern about downside risks to growth, citing a stalling labor market, modest job creation, and an unemployment rate drifting up toward 4.4%. At the same time, inflation remains above target, with CPI at 3.2% and core inflation at 3.1% as of August 2025; higher energy and food prices, largely attributable to tariffs, continue to weigh on headline measures.
- Although economic activity expanded at a moderate pace in the third quarter, the growth outlook has weakened. Q3 GDP growth is estimated near 1.0% (annualized), with full-year 2025 GDP growth guidance revised to 1.2%, reflecting slowing household consumption and tighter financial conditions.
- In the updated Summary of Economic Projections, the unemployment rate is projected to average 4.5% for the year, with headline PCE inflation revised up slightly to 3.1% for 2025. The Committee anticipates core PCE inflation to remain stubborn, requiring sustained vigilance and a flexible approach to risk management.
- The Committee reiterated its data-dependent approach and openness to further adjustments should employment or inflation deviate meaningfully from current forecasts. Several members dissented, either advocating a larger 50-basis-point cut or preferring no adjustment at this meeting, revealing heightened divergence within the Committee.
- Balance sheet reduction continues at a measured pace. The monthly Treasury redemption cap remains at $5B and the agency MBS cap at $35B, as the Board aims to support orderly market conditions in the face of evolving global and domestic uncertainty
- The next meeting is scheduled for 28 to 29 October 2025.
Next 24 Hours Bias
Weak Bearish
Gold (XAU)
Key news events today
Unemployment Claims (12:30 pm GMT)
Philly Fed Manufacturing Index (12:30 pm GMT)
What can we expect from Gold today?
Gold’s performance on September 18, 2025, reflects a classic “buy the rumor, sell the news” reaction to the Fed’s rate cut decision. While prices pulled back from record highs, the fundamental backdrop remains supportive with continued central bank buying, geopolitical tensions, dollar weakness, and expectations for further monetary policy easing. The precious metal has gained an impressive 39% year-to-date, and despite near-term volatility, analysts remain constructive on gold’s longer-term trajectory toward the $4,000 level and beyond.
Next 24 Hours Bias
Strong Bullish
The Euro (EUR)
Key news events today
No major news event
What can we expect from EUR today?
The euro showed resilience despite minor Thursday weakness, maintaining near four-year highs against the dollar. Key supportive factors include eurozone inflation stabilizing at the ECB’s 2% target, improved economic growth projections, and market expectations that the central bank’s rate-cutting cycle has concluded. However, ongoing trade policy uncertainty and mixed economic indicators suggest cautious optimism, with the ECB maintaining its data-dependent approach while emphasizing that the disinflationary process is complete.
Central Bank Notes:
- The Governing Council kept the three key ECB interest rates unchanged at its September 11, 2025, meeting. The main refinancing rate remains at 2.15%, the marginal lending facility at 2.40%, and the deposit facility at 2.00%. These levels have been maintained after the cuts earlier in 2025, reflecting the Council’s confidence that the current stance is consistent with the price stability mandate.
- Evidence that inflation is running close to the ECB’s medium-term target of 2% supported the decision to hold rates steady. Domestic price pressures are easing as wage growth continues to moderate, and financing conditions remain accommodative. Policymakers reaffirmed a data-dependent, meeting-by-meeting approach to further policy moves, with no pre-commitment to a predetermined path amid ongoing global and domestic risks.
- Eurosystem staff projections foresee headline inflation averaging 2.0% for 2025, 1.8% for 2026, and 2.0% in 2027. The 2025 and 2026 forecasts reflect a downward revision, primarily on lower energy costs and exchange rate effects, even as food inflation remains persistent. Core inflation (excluding energy and food) is expected at 2.0% for both 2026 and 2027, with only minor changes since prior rounds.
- Real GDP growth in the euro area is projected at 1.1% for 2025, 1.1% for 2026, and 1.4% for 2027. A robust first quarter—partly due to firms accelerating exports ahead of anticipated tariff hikes—cushioned a weaker outlook for the remainder of 2025. While business investment continues to face uncertainty from ongoing global trade disputes, especially with the US, government investment and infrastructure spending are expected to provide some support to the outlook..
- Household spending is backed by rising real incomes and continued strength in the labor market. Despite some fading tailwind from previous rate cuts, financing conditions remain broadly favorable and are expected to underpin the resilience of private consumption and investment against outside shocks. Moderating wage growth and profit margin adjustments are helping to absorb residual cost pressures.
- Household spending is backed by rising real incomes and continued strength in the labor market. Despite some fading tailwind from previous rate cuts, financing conditions remain broadly favorable and are expected to underpin the resilience of private consumption and investment against outside shocks. Moderating wage growth and profit margin adjustments are helping to absorb residual cost pressures.
- All future interest rate decisions will continue to be guided by the integrated assessment of economic and financial data, the inflation outlook, and underlying inflation dynamics, and the effectiveness of monetary policy transmission—without any pre-commitment to a specific future rate path.
- The ECB’s Asset Purchase Programme (APP) and Pandemic Emergency Purchase Programme (PEPP) portfolios are declining predictably, as reinvestment of maturities has ceased. Balance-sheet normalization continues in line with the ECB’s previously communicated schedule.
- The next meeting is on 29 to 30 October 2025
Next 24 Hours Bias
Medium Bullish
The Swiss Franc (CHF)
Key news events today
No major news event
What can we expect from CHF today?
The Swiss Franc continues to attract safe-haven flows as global uncertainty lingers, with its value versus the USD and other major currencies close to recent highs. The Swiss National Bank is expected to hold rates steady, and no major new data or surprises are anticipated today. Global strategists view CHF as a preferred safe-haven, particularly in comparison to the Japanese yen, given Switzerland’s fiscal stability and prudent central bank policy.
Central Bank Notes:
- The SNB eased monetary policy by lowering its key policy rate by 25 basis points, from 0.25% to 0% on 19 June 2025, marking the sixth consecutive reduction.
- Inflationary pressure has decreased further as compared to the previous quarter, decreasing from 0.3% in February to -0.1% in May, mainly attributable to lower prices in tourism and oil products.
- Compared to March, the new conditional inflation forecast is lower in the short term. In the medium term, there is hardly any change from March, putting the average annual inflation at 0.2% for 2025, 0.5% for 2026, and 0.7% for 2027.
- The global economy continued to grow at a moderate pace in the first quarter of 2025, but the global economic outlook for the coming quarters has deteriorated due to the increase in trade tensions.
- Swiss GDP growth was strong in the first quarter of 2025, but this development was largely because, as in other countries, exports to the U.S. were brought forward.
- Following the strong first quarter, growth is likely to slow again and remain rather subdued over the remainder of the year; the SNB expects GDP growth of 1% to 1.5% for 2025 as a whole, while also anticipating GDP growth of 1% to 1.5% for 2026.
- The SNB will continue to monitor the situation closely and will adjust its monetary policy if necessary to ensure inflation remains within the range consistent with price stability over the medium term.
- The next meeting is on 25 September 2025.
Next 24 Hours Bias
Medium Bullish
The Pound (GBP)
Key news events today
Monetary Policy Summary(11:00 am GMT)
MPC Official Bank Rate Votes (11:00 am GMT)
Official Bank Rate (11:00 am GMT)
What can we expect from GBP today?
Sterling’s recent gains reflect cautious optimism pending BoE policy outcomes, but upside is seen as limited unless economic data surprises or the BoE signals a policy shift. Overall, market focus today is on the tone of the BoE statement and any hints about future rate cuts. Labor market data shows stable unemployment at 4.7%, wage growth of 4.8% (excluding bonuses), and a slight fall in payrolls by 8,000—broadly in line with forecasts and suggesting a gradually slowing jobs market.
Central Bank Notes:
- The Bank of England’s Monetary Policy Committee (MPC) voted on 18 September 2025 by a majority (expected split likely 7–2 or 6–3) to hold the Bank Rate steady at 4.00%, following the August rate cut. Most members cited persistent inflation and mixed indicators on growth and employment, while a minority favored further easing due to the cooling labor market and subdued GDP growth.
- The Committee decided to decrease the pace of quantitative tightening, planning to reduce the stock of UK government bond purchases by £67.5 billion over the next 12 months instead of the prior £100 billion pace, with the gilt balance now standing near £558 billion. This reflects increased volatility in bond markets and a shift to a more gradual approach.
- Headline inflation rose unexpectedly to 3.8% in July and is projected at 4% for September, above the Bank’s 2% target. Price pressures are driven by regulated energy costs and ongoing food price increases. While previous disinflation has been substantial, core inflation remains elevated and sticky.
- The MPC expects headline inflation to remain above target through Q4, with a resumption of the downward trend projected for early 2026 as energy and regulated price pressures abate. The Committee remains watchful for signs of persistent inflation despite previous policy tightening.
- UK GDP growth is stagnant, with business and consumer activity subdued. Recent labor market data show rising unemployment rates (now at 4.7%) and stabilizing wage growth (holding near 5%), indicating slack but continued wage price pressure. The Committee remains cautious amid lackluster demand and soft survey sentiment.
- Pay growth and employment indicators have moderated further, alongside confirmation from business surveys that pay settlements are slowing. The Committee expects wage growth to decelerate significantly through Q4 and the rest of 2025.
- Global uncertainty persists due to volatile energy prices, supply chain disruptions linked to Middle East conflicts, and renewed trade tensions. The MPC remains vigilant in tracking transmission of external cost/wage shocks to UK inflation.
- Risks to inflation are considered two-sided. While subdued domestic growth and softening labor activity suggest scope for easing, persistent inflation requires caution. The MPC anticipates a slow, gradual reduction path in rates, continuing its data-dependent approach with careful adjustment as warranted by economic developments.
- The Committee’s bias remains toward maintaining a restrictive monetary policy stance until firmer evidence emerges that inflation will return sustainably to the 2% target. All future decisions will remain highly data dependent, with a strong emphasis on evolving demand, inflation expectations, costs, and labor market conditions.
- The next meeting is on 6 November 2025.
Next 24 Hours Bias
Medium Bullish
The Canadian Dollar (CAD)
Key news events today
No major news event
What can we expect from CAD today?
The Canadian dollar remains under slight pressure following the rate cut, with the central bank signaling flexibility for further action if economic weakness persists. Traders are awaiting the US Federal Reserve signals and watching oil prices and trade policy for further direction. The USD/CAD exchange rate is currently around 1.3760, with CAD to USD at about 0.726. Exchange rates have fluctuated in a relatively tight range over the past week, and CAD is up about 0.7% weekly after the rate cut.
Central Bank Notes:
- The Bank of Canada reduced its target for the overnight rate to 2.50% at its September 17 meeting, with the Bank Rate at 2.75% and the deposit rate at 2.25%. This marks the first rate cut since early 2025, as the Bank responded to a string of softer inflation prints and persistent economic headwinds.
- The Council cited continued U.S. tariff volatility and slow progress on trade negotiations as major contributors to ongoing uncertainty. While headline tariffs have not escalated further, the unpredictability of U.S. policy remains a significant risk for Canadian exports and business confidence.
- Uncertainty about U.S. trade policy and recurring tariff threats continued to weigh on growth prospects. The Bank flagged downside risks to the export sector, with survey data indicating ongoing hesitancy among manufacturers and exporters.
- After modest growth in Q1, Canada’s economy slipped into contraction, with GDP shrinking by 0.8% in Q2 and forecast to decrease again by 0.8% in Q3. Economic weakness has been most pronounced in manufacturing and goods-producing sectors affected by trade frictions and softer U.S. demand.
- Early estimates show that growth stabilized in September but remained well below the Bank’s 2% forecast for Q4. Manufacturing output has improved slightly—supported by a modest rebound in petroleum and mining activity—while consumer spending and retail sales were largely flat.
- Consumer spending remained subdued as households continued to limit discretionary purchases amid uncertainty and a slower job market. Housing activity stayed weak, despite earlier government efforts to boost affordability and modest gains in some real estate segments.
- Headline CPI inflation edged up to 1.9% in August, undershooting economist expectations but still showing emerging pressures from shelter and imported goods costs. Core inflation metrics were mixed, though price growth remains just below the Bank’s 2% target.
- The Governing Council reaffirmed its cautious approach, emphasizing that while further rate cuts are possible, the pace will hinge on the path of U.S. tariffs, domestic inflation dynamics, and signs of a sustainable recovery. The Bank remains vigilant against the risk of inflation falling below target in the face of economic slack.
- The next meeting is on 29 October 2025.
Next 24 Hours Bias
Weak Bearish
Oil
Key news events today
No major news event
What can we expect from Oil today?
Oil markets on September 18, 2025, reflect a complex interplay of bearish supply-demand fundamentals and ongoing geopolitical risks. While the Federal Reserve’s rate cut provides potential longer-term demand support, immediate concerns about U.S. economic weakness, rising distillate inventories, and OPEC+ production increases are keeping prices under pressure. The market continues to trade within its established $5 range, with Brent around $68 and WTI near $64, as traders await clearer signals about global economic recovery and supply disruption risks from the ongoing Russia-Ukraine conflict.
Next 24 Hours Bias
Medium Bearish
The post IC Markets Europe Fundamental Forecast | 18 September 2025 first appeared on IC Markets | Official Blog.