Articles

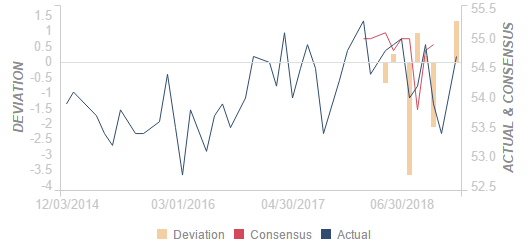
NZ: Unemployment rate likely to bounce to 4.1% in Q4 – ANZ
20980 January 31, 2019 12:53 FXStreet Market News
Liz Kendall, senior economist at ANZ, expects to see a small bounce in the New Zealand’s unemployment rate from 3.9% to 4.1% in Q4.
Key Quotes
“Last quarter we saw a large fall, likely reflecting some noise, amidst genuine tightening in the labour market. But while the labour market is in a strong position, we may have seen the best this cycle has to offer.”
“Wage inflation is expected to have firmed to 2.1% y/y, reflecting previous tightening in the labour market, the higher minimum wage, and a boost from last year’s nurses’ pay settlement. But underlying wage inflation is expected to continue to improve only gradually.”
EUR/USD: Focus shifts to Eurozone GDP after dovish Fed
20979 January 31, 2019 12:33 FXStreet Market News
- Dovish Fed has likely put EUR/USD on the path to re-test of recent highs near 1.1570.
- US-DE (German) 10-year yield spread is looking south, favors upside in the EUR.
A better-than-expected Eurozone GDP would only accentuate bullish pressures and allow a sustained rally to 1.16 and above.
The EUR/USD pair clocked a 20-day high of 1.1508 in Asia and could soon test monthly highs near 1.1570, courtesy of the dovish Fed.
The US central bank kept rates unchanged and discarded promises of further gradual increased. It added further that the next move in rates could be up or down and expressed willingness to adjust the quantitative tightening program if the economy continues to trend south.
That is a significant dovish change from the previous stance, which cited interest rates as the primary tool.
The dollar, therefore, could remain under pressure in the near-term. The bond yield differentials are also biased toward the EUR bulls.
For instance, the spread between the US and German 10-year government bond yield fell to 248 basis points earlier today and could slide further toward the recent low of 239 basis points in the EUR-positive manner, having witnessed an ascending triangle breakdown on the daily chart on Tuesday.
Further, the EUR could pick up a strong bid in Europe if both the German jobs data and the Eurozone Q4 GDP data blow past expectations, dashing hopes of a dovish change in the ECB’s forward guidance.
A convincing break above the recent high of 1.1570, however, may remain elusive if the Eurozone GDP shows a sharp deceleration in the economy. The data, due at 10:00 GMT, is expected to show the economy expanded 0.2 percent quarter-on-quarter in the fourth quarter. In annualized terms, however, the growth rate is seen slowing to 1.2 percent from the previous quarter’s print of 1.6 percent.
EUR/USD Technical Levels
EUR/USD
Overview:
Today Last Price: 1.1503
Today Daily change: 0.0022 pips
Today Daily change %: 0.19%
Today Daily Open: 1.1481
Trends:
Daily SMA20: 1.1422
Daily SMA50: 1.1393
Daily SMA100: 1.1446
Daily SMA200: 1.1568
Levels:
Previous Daily High: 1.1502
Previous Daily Low: 1.1406
Previous Weekly High: 1.1418
Previous Weekly Low: 1.1289
Previous Monthly High: 1.1486
Previous Monthly Low: 1.1269
Daily Fibonacci 38.2%: 1.1466
Daily Fibonacci 61.8%: 1.1443
Daily Pivot Point S1: 1.1424
Daily Pivot Point S2: 1.1367
Daily Pivot Point S3: 1.1327
Daily Pivot Point R1: 1.152
Daily Pivot Point R2: 1.156
Daily Pivot Point R3: 1.1617
GBP/JPY Technical Analysis: Head-and-shoulders or descending triangle
20978 January 31, 2019 12:03 FXStreet Market News
The GBP/JPY pair has charted both the head-and-shoulders bearish reversal pattern and the descending triangle pattern on the hourly chart.
Hourly chart
-636845034266377649.png)
As seen above, the JPY cross is bouncing off the head-and-shoulders neckline support of 142.75. A break below that level would confirm a bear reversal and allow a drop to 140.66 (target as per the measured move method).
The pair, however, is more likely to move above 143.15 and confirm a descending triangle breakout as the primary trend is bullish – 5, 10-day MAs are trending north.
A descending triangle breakout, if confirmed, would open up upside toward the immediate hurdle at 143.60.
Trend: Bullish above 143.15
GBP/JPY
Overview:
Today Last Price: 143.05
Today Daily change: 28 pips
Today Daily change %: 0.20%
Today Daily Open: 142.77
Trends:
Daily SMA20: 140.7
Daily SMA50: 141.8
Daily SMA100: 144.38
Daily SMA200: 145.17
Levels:
Previous Daily High: 143.6
Previous Daily Low: 142.73
Previous Weekly High: 144.85
Previous Weekly Low: 140.62
Previous Monthly High: 145.52
Previous Monthly Low: 138.86
Daily Fibonacci 38.2%: 143.06
Daily Fibonacci 61.8%: 143.27
Daily Pivot Point S1: 142.46
Daily Pivot Point S2: 142.16
Daily Pivot Point S3: 141.59
Daily Pivot Point R1: 143.34
Daily Pivot Point R2: 143.91
Daily Pivot Point R3: 144.21
RBA forecasts to be consistent with on hold policy – Westpac
20977 January 31, 2019 11:53 FXStreet Market News
Bill Evans, analyst at Westpac, suggests that the first RBA meeting of 2019 takes place on Tuesday and believes that the RBA will lower their growth forecast in response to recent data but maintain an outlook consistent with rates remaining on hold.
Key Quotes
“Of course there will be no rate change following the Board meeting but there will be considerable interest in the Governor’s Statement and the subsequent communications.”
“The key as to whether the Reserve Bank will placate markets and adopt a pure neutral bias by eliminating the “next move up” in its commentary will hinge on how it reassesses its forecasts which will be released with the February Statement on Monetary Policy (SOMP) on February 8.”
“We expect the RBA will forecast growth of 3% in 2019 and 3% in 2020. That higher growth will reflect a limited slowdown in housing construction and no meaningful wealth effect. Those growth forecasts are still above trend and likely to ensure the view that the next move in rates will be up.”
“Accordingly, despite lowering its growth forecasts for 2018 and 2019, we expect the Bank will retain its current stance that the next move in rates will be up.”
USD/JPY Technical Analysis: prints fresh-two week lows, focus on today’s close
20976 January 31, 2019 11:33 FXStreet Market News
The USD/JPY pair fell to 108.79 – the lowest level since Jan. 17 – soon before press time and risks falling further, courtesy of the Fed’s dovish turn.
Daily chat
-636845013354744303.png)
As seen above, the pair created a bearish outside-day reversal candle yesterday, signaling an end of the corrective bounce from the lows below 105.00 seen on Jan. 3.
A close below 108.81 (yesterday’s low) would validate the bearish outside-day and open the doors for a sustained drop to 107.50.
Other factors are also aligned in favor of the bears. For instance, the 5- and 10-day MAs have produced a bearish crossover and the 14-day RSI is reporting bearish conditions with below-50 reading.
Trend: bearish
USD/JPY
Overview:
Today Last Price: 108.78
Today Daily change: -17 pips
Today Daily change %: -0.16%
Today Daily Open: 108.95
Trends:
Daily SMA20: 108.94
Daily SMA50: 110.93
Daily SMA100: 111.92
Daily SMA200: 111.26
Levels:
Previous Daily High: 109.74
Previous Daily Low: 108.81
Previous Weekly High: 110
Previous Weekly Low: 109.14
Previous Monthly High: 113.83
Previous Monthly Low: 109.55
Daily Fibonacci 38.2%: 109.17
Daily Fibonacci 61.8%: 109.39
Daily Pivot Point S1: 108.59
Daily Pivot Point S2: 108.23
Daily Pivot Point S3: 107.65
Daily Pivot Point R1: 109.53
Daily Pivot Point R2: 110.11
Daily Pivot Point R3: 110.47
USD/INR: gap down open likely on “patient Fed”
20975 January 31, 2019 11:03 FXStreet Market News
- The rupee is likely to gap higher on dovish Fed.
- 71.52 is the near-term level to beat for the bulls.
The Indian rupee is likely to open higher against the greenback, courtesy of the dovish Fed.
The USD/INR, pair which closed 0.22 percent lower at 71.22 yesterday, could drop below 71 in early trade.
The US Federal Reserve kept rates unchanged as expected and said that the next move in rates could be up or down, discarding the previous language of further gradual rate hikes.
It added further that the quantitative tightening program (balance sheet normalization) could be adjusted if the economy continues to trend south.
Fed’s dovish turn is good news for high current account deficit economies like India, although the upside in the INR could be limited, given the uncertainty surrounding the national elections.
The Indian currency could also come under pressure if the government gives a populist interim budget on Friday.
Technically speaking, the gap down opening will neutralize the bullish outlook forward by the falling wedge breakout, confirmed on Jan. 18 and only a move above 71.52 would revive the bullish outlook.
Technical Levels
USD/INR
Overview:
Today Last Price: 70.995
Today Daily change: 0.0800 pips
Today Daily change %: 0.11%
Today Daily Open: 70.915
Trends:
Daily SMA20: 70.7536
Daily SMA50: 70.6839
Daily SMA100: 71.8103
Daily SMA200: 70.2348
Levels:
Previous Daily High: 71.64
Previous Daily Low: 70.82
Previous Weekly High: 71.535
Previous Weekly Low: 70.865
Previous Monthly High: 72.82
Previous Monthly Low: 69.505
Daily Fibonacci 38.2%: 71.1332
Daily Fibonacci 61.8%: 71.3268
Daily Pivot Point S1: 70.61
Daily Pivot Point S2: 70.305
Daily Pivot Point S3: 69.79
Daily Pivot Point R1: 71.43
Daily Pivot Point R2: 71.945
Daily Pivot Point R3: 72.25
China’s official manufacturing PMI shrank for second straight month in Jan – Reuters
20974 January 31, 2019 10:53 FXStreet Market News
Reuters offers additional insights into the official Chinese manufacturing and non-manufacturing PMI reports published by the National Bureau of Statistics (NBS)
Key Highlights:
“Activity in China’s manufacturing sector shrank for the second straight month in January pointing to further strains on the economy that could heighten risks to global growth.
Anxiety about cooling demand in China is rippling through the world’s financial markets and weighing on other Asian economies after a string of sales warnings from heavy machinery producer Caterpillar to iPhone maker Apple.
Even with increasing government efforts to spur activity, concerns are growing that China may be at risk of a sharper-than-expected slowdown if the trade war with the United States drags on.
An acceleration in service sector activity for the second straight month, reflecting some pockets of strength in the economy despite worries about faltering consumer demand.”
USD/CNH Technical Analysis: bounce likely as RSI drops below 30 on key timeframes
20973 January 31, 2019 10:03 FXStreet Market News
The USD/CNH pair looks overdue for a corrective bounce, as the relative strength indices (RSIs) on the hourly, 4-hour and daily chart are reporting oversold conditions.
Hourly chart
-636844967718293171.png)
- The above chart is showing a bullish divergence of the RSI. The pair, therefore, could soon test the downward sloping 50-hour MA of 6.7382.
Trend: oversold bounce likely
USD/CNH
Overview:
Today Last Price: 6.7078
Today Daily change: -56 pips
Today Daily change %: -0.08%
Today Daily Open: 6.7134
Trends:
Daily SMA20: 6.7928
Daily SMA50: 6.8568
Daily SMA100: 6.8846
Daily SMA200: 6.7508
Levels:
Previous Daily High: 6.7526
Previous Daily Low: 6.702
Previous Weekly High: 6.8189
Previous Weekly Low: 6.7525
Previous Monthly High: 6.9509
Previous Monthly Low: 6.826
Daily Fibonacci 38.2%: 6.7214
Daily Fibonacci 61.8%: 6.7333
Daily Pivot Point S1: 6.6928
Daily Pivot Point S2: 6.6721
Daily Pivot Point S3: 6.6422
Daily Pivot Point R1: 6.7433
Daily Pivot Point R2: 6.7732
Daily Pivot Point R3: 6.7939
BoJ’s Amamiya: Markets continue to make unstable moves but Japan’s economy is recovering steadily
20972 January 31, 2019 09:53 FXStreet Market News
The Bank of Japan (BoJ) Deputy Governor Amamiya is on the wires now, via Reuters, making a scheduled speech on the monetary policy and Japanese economy.
Amamiya said that the BoJ must continue with easing to achieve the price target, adding that he is mindful that BoJ policy could destabilise financial markets but the risk is not large.
On the Japanese economy, he noted that the markets continue to make unstable moves but Japan’s economy is recovering steadily.
Additional Comments:
Must scrutinise economic developments while keeping in mind signals from markets.
Risks to our baseline economic forecast heightening, mainly from overseas developments.
PBOC set the yuan reference rate at 6.7025
20971 January 31, 2019 09:33 FXStreet Market News
The People’s Bank of China (PBOC) set the yuan reference rate at 6.7025 vs the previous day’s fix of 6.7343.