Articles

Turkey Foreign Arrivals: 13.23% (September) vs previous 17.17%
39389 October 31, 2019 16:33 FXStreet Market News
AUD/USD sits near three-month tops, comfortably above 0.6900 handle
39388 October 31, 2019 16:03 FXStreet Market News
France Consumer Price Index (EU norm) (MoM) above expectations (-0.3%) in October: Actual (-0.1%)
39387 October 31, 2019 15:53 FXStreet Market News
Thursday 31st October: Asian stocks mixed as Fed cuts Rates; APEC summit cancelled
39386 October 31, 2019 15:33 ICMarkets Market News
Global Markets:
- Asian Stock Markets : Nikkei up
0.37%, Shanghai Composite down 0.44%, Hang Seng up 0.77%, ASX down 0.39% - Commodities : Gold at $1499.95
(+0.22%), Silver at $17.93 (+0.37%), Brent Oil at $60.37 (+0.22%), WTI Oil at
$55.14 (+0.15%) - Rates : US 10-year yield at
1.777, UK 10-year yield at 0.684, Germany 10-year yield at -0.362
News & Data:
- (CNY) Manufacturing PMI 49.3 vs
49.9 expected - (AUD) Building Approvals m/m
7.60% vs 0.10% expected - (NZD) ANZ Business Confidence
-42.4 vs -53.5 previous - (USD) Federal Funds Rate
<1.75% vs <1.75% expected - (USD) Crude Oil Inventories
5.7M vs 0.5M expected - (CAD) Overnight Rate 1.75% vs
1.75% expected - (USD) Advance GDP Price Index
q/q 1.70% vs 1.80% expected - (USD) Advance GDP q/q 1.90% vs
1.60% expected - (USD) ADP Non-Farm Employment
Change 125K vs 125K expected - (EUR) German Prelim CPI m/m
0.10% vs 0.00% expected - China launches 5G mobile phone
services - Cancelling APEC summit will not
affect the arrangements of China-US trade talks - HSBC cuts Hong Kong prime rate
for first time in 11 years
Markets Update:
Asian stock markets are mixed on Thursday
following the positive cues overnight from Wall Street after the U.S. Federal
Reserve cut interest rates for the third time this year, but hinted it may put
further monetary policy easing on hold.
Investors also digested news that Chile has
cancelled the Asia-Pacific Economic Cooperation or APEC summit scheduled to be
held in Santiago in mid-November, citing violent protests across the country.
U.S. President Donald Trump and Chinese President Xi Jinping were due to meet
at the summit to discuss and possibly sign phase one of a U.S.-China trade
deal.
Mainland Chinese stocks shed earlier gains
by the afternoon. The Shanghai composite slipped 0.4% and the Shenzhen
component fell 0.6%. China reported Thursday that factory activity in the
country contracted for the sixth straight month in October. The official
Purchasing Managers’ Index (PMI) came in at 49.3 for October. In September, the
official manufacturing PMI was 49.8, according to the country’s statistics
bureau. The 50 level for PMI readings separates expansion from contraction.
In Japan, the Nikkei 225 rose 0.4%, with
shares of index heavyweight Softbank Group surging 3.8%. The Topix index
recovered from its earlier slip to rise slightly. The Bank of Japan announced
Thursday that it would be keeping monetary policy steady, but signaled in its
forward guidance a readiness to cut rates if required. South Korea’s Kospi
gained 0.9%. Elsewhere, the S&P/ASX 200 in Australia was down 0.4%, with
the heavily weighted financial subindex down more than 1% as shares of
Australia and New Zealand Banking Group tumbled more than 3% after the firm
announced that its statutory profit after tax for the full year ended September
30 2019 had plunged 7% year-on-year.
The yield on benchmark 10-year Treasury
notes fell to 1.7785% in Asia on Thursday, while the two-year yield eased
slightly to 1.6216%. The dollar index against a basket of six major currencies
fell 0.34% to 97.318, extending declines from Wednesday.
In the energy market, oil futures erased
loses and rose in Asia on Thursday after as a massive buildup in U.S. crude
stock piles triggered a decline in futures on Wednesday.
Upcoming Events:
- 03:32 AM GMT – (JPY) BOJ Outlook Report
- 03:32 AM GMT – (JPY) Monetary Policy Statement
- 06:30 AM GMT – (JPY) BOJ Press Conference
- 08:00 AM GMT – (EUR) Spanish Flash GDP q/q
- 10:00 AM GMT – (EUR) CPI Flash Estimate y/y
- 12:30 PM GMT – (CAD) GDP m/m
- 12:30 PM GMT – (CAD) RMPI m/m
- 12:30 PM GMT – (USD) Core PCE Price Index m/m
- 12:30 PM GMT – (USD) Employment Cost Index q/q
- 12:30 PM GMT – (USD) Personal Spending m/m
- 01:45 PM GMT – (USD) Chicago PMI
- 03:30 PM GMT – (CHF) SNB Chairman Jordan Speaks
- &more…
China’s ForeignMin: Two heads of state have been maintaining contact through various means on trade
39385 October 31, 2019 15:33 FXStreet Market News
Germany Retail Sales (YoY) came in at 3.4%, below expectations (3.5%) in September
39381 October 31, 2019 15:03 FXStreet Market News
EUR/USD path of least resistance is up after the Fed – Confluence Detector
39380 October 31, 2019 14:53 FXStreet Market News
EUR Futures: further upside well on the cards
39379 October 31, 2019 14:33 FXStreet Market News
Asian stocks cheer global central bankers’ easy money policies
39378 October 31, 2019 14:03 FXStreet Market News
US-China trade talks are progressing smoothly and will move forward as planned – Global Times
39377 October 31, 2019 13:53 FXStreet Market News
Japan Annualized Housing Starts: 0.897M (September) vs 0.891M
39376 October 31, 2019 13:33 FXStreet Market News
Thursday 31st October: Technical outlook and review.
39373 October 31, 2019 13:03 ICMarkets Market News
Key risk events today:
BoJ Outlook Report, Monetary Policy
Statement and Press Conference; Spanish Flash GDP q/q; Canada GDP m/m; Canada
RMPI m/m; US Core PCE Price Index m/m; US Employment Cost Index q/q; US
Personal Spending m/m; US Personal Income m/m; US Unemployment Claims; Chicago
PMI; SNB Chairman Thomas Jordan Speaks.
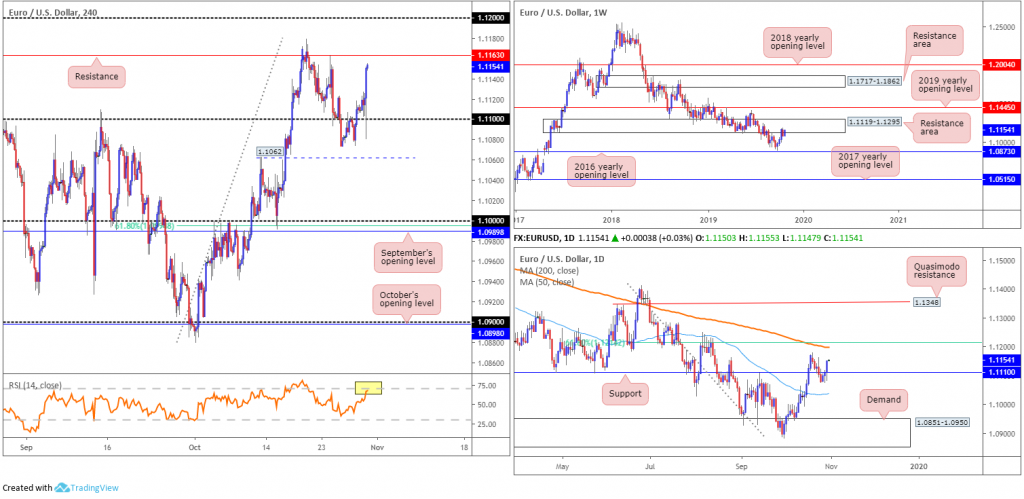
EUR/USD:
The Federal Open Market Committee
(FOMC) cut its benchmark funds rate by 25 basis points to a range of 1.5% to 1.75%
on Wednesday, as expected, but specified the moves to ease policy could be approaching
a pause.
Initially, the dollar index advanced following
the Fed rate decision. However, through the course of Powell’s press
conference, the USD was offered, travelling from a high of 98.00 to 97.45, after
Chair Powell signalled rate hikes were not on the table, leaving the bias for
monetary policy to be on hold.
EUR/USD action concluded Wednesday on
strong footing, adding more than 38 points, or 0.35%.
Chart studies reveal weekly movement
trades back within the parapets of a long-standing resistance area drawn from 1.1119-1.1295.
A break of this zone has the 2019 yearly opening level to target at 1.1445,
whereas a push lower has the 2016 yearly opening level at 1.0873 in sight. Concerning
trend direction, the primary downtrend has been in motion since topping in
early 2018 at 1.2555.
Daily price trades within touching
distance of last Monday’s high at 1.1179, closely shadowed by the 200-day SMA
(orange – 1.1197) and 61.8% Fibonacci retracement ratio at 1.1211. In terms of
the H4 timeframe, resistance at 1.1163 is next in the firing line after
establishing support off the 1.11 handle. Continued bidding may lead to an
approach towards the 1.12 handle, which, according to daily structure, aligns
closely with both the 200-day SMA and the 61.8% Fibonacci ratio. In addition to
this, indicator-based traders may wish to acknowledge the relative strength
index (RSI) is seen approaching overbought status (yellow).
Areas of
consideration:
Though a reaction may develop from H4
resistance at 1.1163 today, most traders likely have their crosshairs fixed on
the 1.12 handle for shorts today. Knowing this barrier merges with the 200-day
SMA at 1.1197 and a 61.8% daily Fibonacci resistance at 1.1211, as well as
weekly price trading within a resistance area at 1.1119-1.1295, sellers likely
consider this a high-probability sell zone.
Conservative traders, however, may opt to wait and see if a H4 bearish candlestick formation emerges before pulling the trigger, in an attempt to avoid any whipsaw through 1.12, which is common viewing around psychological numbers (entry/risk can then be set according to this structure).
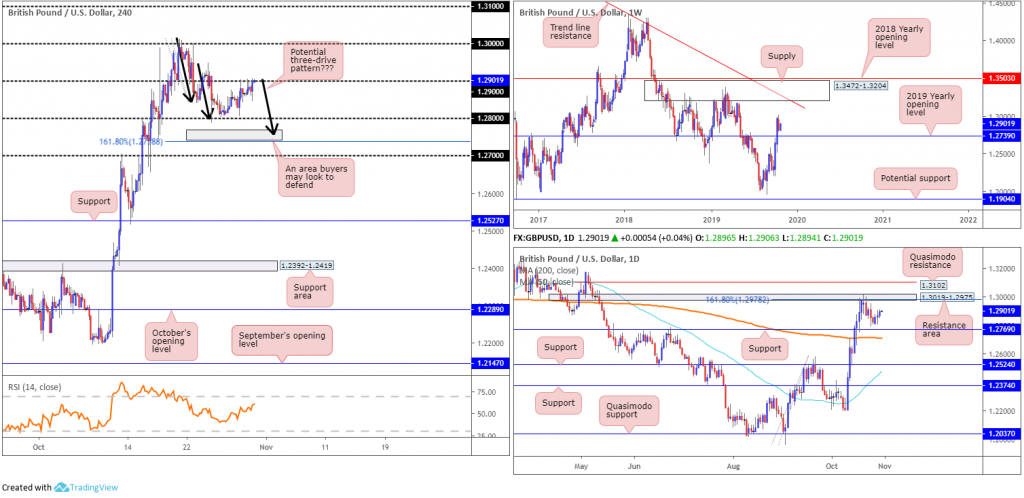
GBP/USD:
The British pound modestly extended
its advance against the dollar Wednesday, largely on the back of the Federal
Reserve cutting its benchmark funds rate by 25 basis points to a range of 1.5%
to 1.75%. UK lawmakers also approved a bill for setting the next election date
to December 12th, with the vote winning 438 to 20. With an election now booked,
Brexit news flow may slow as campaigning gets underway.
From a technical standpoint, price
action remains pretty much unchanged in terms of structure. H4 flow engages
with the 1.29 handle, with a break perhaps cheering a run to the key figure
1.30. As highlighted in Wednesday’s technical briefing, though, a retest at
1.28 is also still in sight. Traders considering longs off this boundary,
nevertheless, may want to acknowledge the grey zone sited just beneath, comprised
of a weekly support at 1.2739, daily support at 1.2769 and a 161.8% H4
Fibonacci ext. point at 1.2738. Additionally, a potential H4 three-drive formation
also terminates within the zone (black arrows) at 1.2755. 1.2738/1.2769 is
likely an area price will test should we run stops beneath 1.28.
Areas of consideration:
A decisive H4 close north of 1.29
today could set the technical stage for a bullish theme, targeting the
underside of a daily resistance area at 1.3019-1.2975, followed by 1.30 on the
H4. To take advantage of any upside above 1.29, traders either typically enter
on the breakout candle and position stops beneath the lower shadow or, more
conservatively, wait and see if a retest at 1.29 forms before making a
decision.
A conservative long from 1.2738/1.2769 is also still a possibility: H4 price to test the zone and close back above 1.28. Entry at the close of the breakout candle with a protective stop-loss order sited beneath its lower shadow is, therefore, an option to consider, targeting a move to 1.29 and possibly higher.
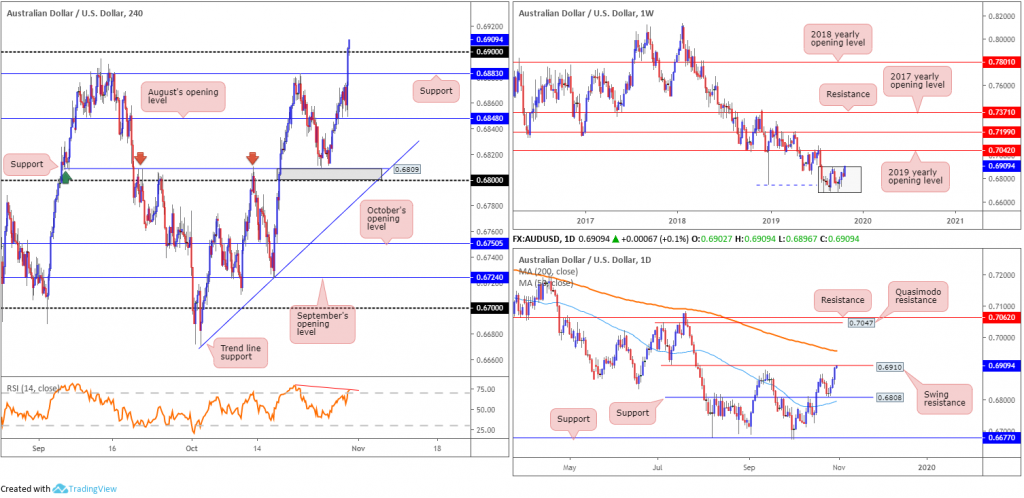
AUD/USD:
AUD/USD bulls entered an offensive
phase Wednesday, bolstered by the Fed recently cutting interest rates to a
range of 1.5% to 1.75%, and markets continuing to soak up trade-deal optimism.
Technically, though, weekly price is
seen challenging the upper edge of its range between 0.6894/0.6677 (light grey).
A pivotal move higher here exposes the 2019 yearly opening level at 0.7042,
which, as you can see, has served well as support/resistance on several
occasions in the past.
Before pressing for higher ground on
the weekly timeframe, daily traders must contend with a swing resistance
plotted at 0.6910. A break of this level, although helping to confirm a bullish
bias, has nearby resistance in the shape of a 200-day SMA (orange – 0.6955).
The 50-day SMA (blue – 0.6795) currently faces northbound, while the said
200-day SMA still points south.
A closer reading of price action on
the H4 timeframe reveals the unit trading north of 0.69, which is typically
considered a bullish indicator. Indicator-based traders may also note the
relative strength index (RSI) displays bearish divergence out of overbought
territory (red line).
Areas of consideration:
AUD/USD’s technical framework, according to our chart studies, is at a critical crossroads. While H4 price recently brushed aside 0.69, the fact we’re trading at the top edge of a weekly range at 0.6894 and daily resistance is in sight at 0.6910, buying may be hampered. Though until H4 price reclaims 0.69 to the downside and possibly even H4 support at 0.6883, selling the higher-timeframe structure is chancy. Sub 0.6883, it appears the pair has room to press to at least August’s opening level at 0.6848 as the initial downside target.
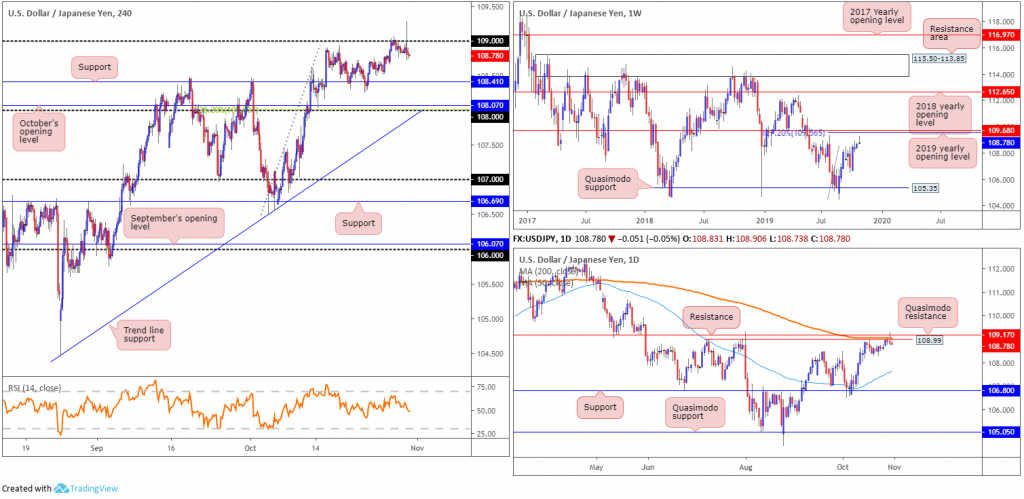
USD/JPY:
Thanks largely to the Fed cutting
interest rates and specifying moves to ease policy could be approaching a pause,
USD/JPY flow on the H4 timeframe witnessed a horrid stop run take shape through
109, testing highs of 109.28 before ending the day unmoved.
Although most traders short the 109
handle were likely taken out on the back of yesterday’s move, the opportunity
to re-enter the market short is certainly there. As highlighted in Wednesday’s
technical briefing, the reasons behind favouring a move lower from 109 stems
from higher-timeframe structure between 109.17/108.99 (comprised of a resistance
level at 109.17, the 200-day SMA [orange/109.05 – seen flattening] and
Quasimodo resistance at 108.99).
In the event sellers make a stand from
the said daily resistances, the 50-day SMA (blue – 107.63) is in view, followed
by support at 106.80. The only grumble to a downside move is weekly price
exhibiting scope for a pop higher to the 2019 yearly opening level at 109.68,
which happens to merge closely with a 127.2% Fibonacci ext. point at 109.56.
Areas of consideration:
Entry at current price is certainly an option today, with protective stop-loss orders plotted above yesterday’s high at 109.28. The fact we have robust daily resistance in motion alongside a daily shooting star candlestick pattern (considered a bearish signal) is likely enough to draw in sellers to at least H4 support at 108.41, with a move to 108 also a possibility.
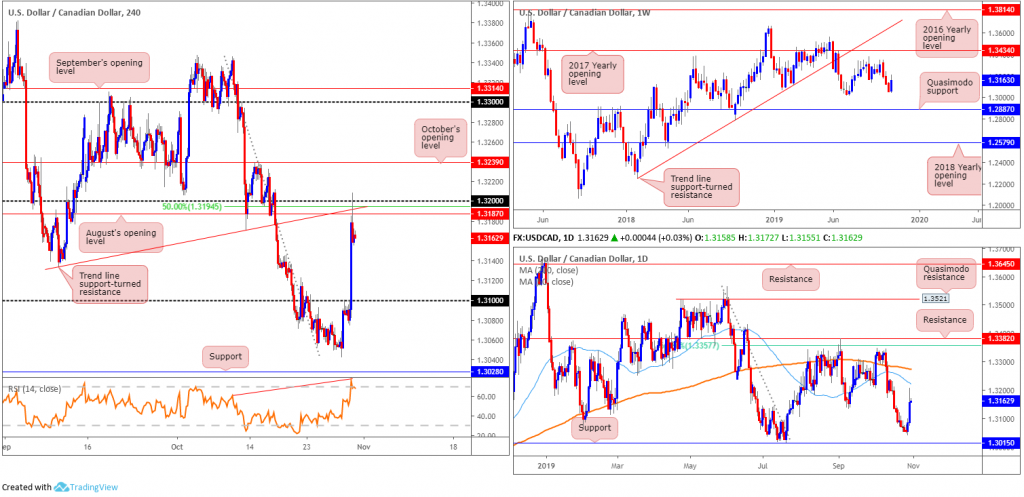
USD/CAD:
The Canadian dollar fell sharply
against its US counterpart Wednesday, with USD/CAD adding more than 70 points,
or 0.55%. The Bank of Canada (BoC) kept interest rates unchanged, as expected,
though tweaked the conclusion of its statement, noting heightened concerns
about the outlook for growth. The day concluded with H4 price testing, albeit
marginally surpassing, the 1.32 handle and settling at 1.3158. In addition to
the BoC, the US Federal Reserve cut its benchmark funds rate by 25 basis points
to a range of 1.5% to 1.75%, as expected, but specified the moves to ease
policy could be approaching a pause.
Supporting a technical selloff from
the 1.32 handle, chart studies also display a 50.0% retracement ratio at
1.3194, August’s opening level at 1.3187, a trend line support-turned
resistance etched from the low 1.3134 and the relative strength index (RSI)
producing a hidden bearish divergence signal within overbought territory.
With respect to the higher-timeframe
landscape, resistance is not expected to develop until reaching the 50-day SMA
(blue – 1.3223) and 200-day SMA (orange – 1.3724). Interestingly, though, both
moving averages are facing a southerly position at the moment.
Areas of consideration:
In light of the technical confluence supporting 1.32 as resistance on the H4 scale this morning, this could promote further selling today. However, entering at current price places the trader at a slight disadvantage in regards to risk/reward. Waiting and seeing if price action retests 1.32 a second time may be the alternative, entering on the back of the rejection candle’s structure and targeting a move to 1.31.
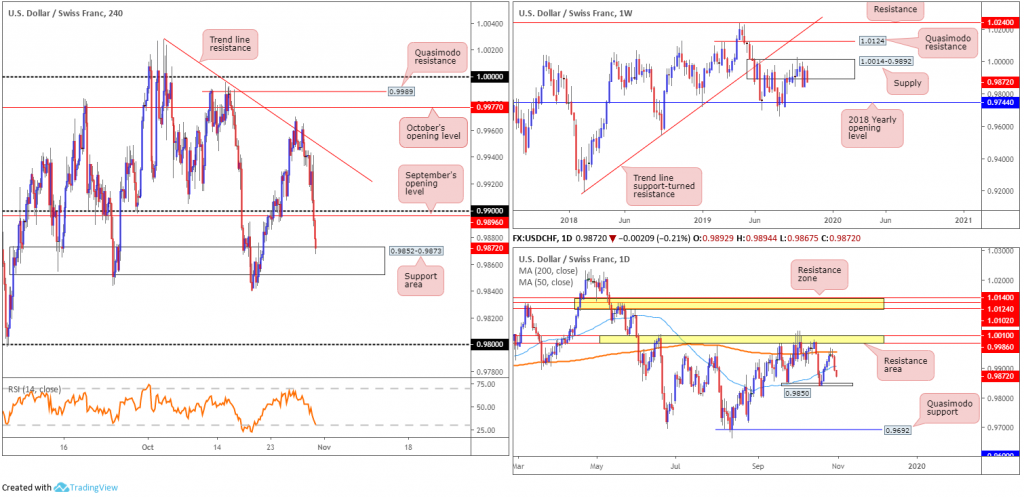
USD/CHF:
Broad-based dollar selling on the back
of recent Fed action weighed on the USD/CHF Wednesday, consequently forming a
near-full-bodied daily bearish candle that closed beneath the 50-day SMA (blue
– 0.9906). While considered a bearish signal, traders are urged to pencil in
nearby support surfacing around the 0.9850ish range.
Supply on the weekly timeframe at
1.0014-0.9892 remains in play, and despite recent selling, still resembles somewhat
of a fragile tone. The beginning of October witnessed a penetration to the
outer edge of the supply area’s limit, possibly tripping a portion of buy stops
and weakening sellers. According to the primary trend, price reflects a
slightly bullish tone; however, do remain aware we have been rangebound since
the later part of 2015 (0.9444/1.0240).
After crossing beneath 0.99 on the H4
scale yesterday, the candles ran into an interesting area of support at 0.9852-0.9873
this morning. Confirmed by the relative strength index (RSI) testing oversold
territory, the pair is likely to bounce from here and retest the
underside of 0.99. Whether the unit has enough oomph to dethrone 0.99 and push
for higher ground remains to be seen in light of daily price driving through
its 50-day SMA.
Areas of consideration:
Searching for lower-timeframe buying opportunities out of the H4 support area at 0.9852-0.9873, with an upside target set at the 0.99 handle, is certainly an idea worthy of interest this morning. This could simply be a lower-timeframe bullish candlestick configuration, a trend line break/retest or even a break of resistance. Traders are, however, urged to ensure risk/reward offers more than a 1:2 ratio to 0.99.
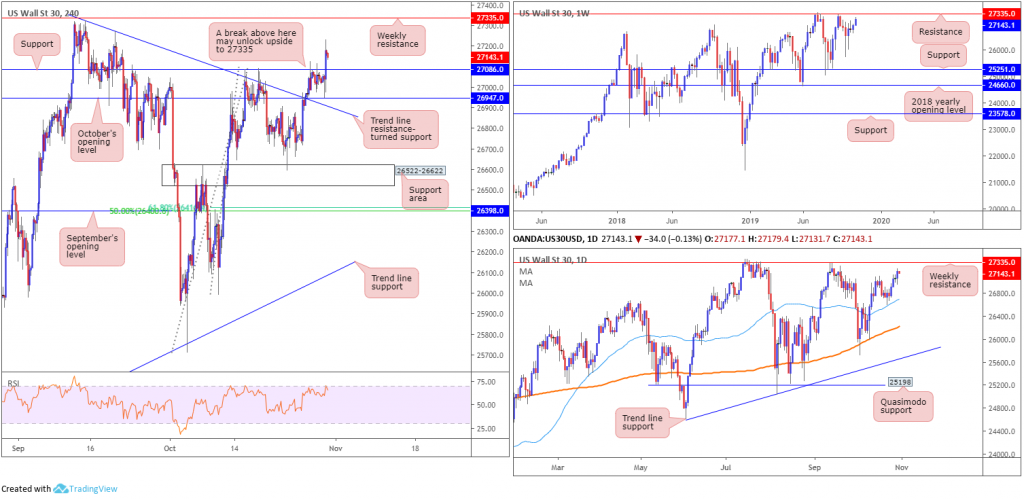
Dow
Jones Industrial Average:
US equities firmed Wednesday following
the Federal Reserve cutting interest rates, as expected, and signalling it was
unlikely to move in either direction any time soon as inflation remains muted. The Dow
Jones Industrial Average added 115.27 points, or 0.43%; the S&P 500 advanced
9.88 points, or 0.33% and the tech-heavy Nasdaq 100 also added 35.60 points, or
0.44%.
For those who read Wednesday’s
technical briefing you may recall the following points:
Technically, the Dowholds beneath
H4 resistance at 27086, after tunnelling through October’s opening
level fixed at 26947 and trend line resistance pencilled in from the high at
27321.
Resistance at 27335 remains a focal
point on the weekly chart, sited only a few points south of the all-time high
27388. And, despite a minor setback to 21452, the primary trend in this market
remains facing northbound. Research on the daily timeframe shows price holding
firmly north of the 50-day SMA (blue – 26676). Both the 50-day SMA and the 200-day
SMA (orange – 26202) face north, with the next upside target set at the weekly
resistance presented above at 27335.
Clearance of 27086 on the H4 scale potentially offers an
early cue to a move towards the said weekly resistance level.
Areas of consideration:
Outlook unchanged.
The area between H4 resistance at
27086 and weekly resistance at 27335 remains of interest this morning. A
decisive close beyond 27086 on a H4 basis likely unlocks the door to 27335,
offering traders potential long opportunities, either on a retest motion at
27086 or simply entering on the breakout candle’s close.
Given the mild pullback seen in recent H4 candles and the range of the breakout candle, entering on any retest seen at 27086 may be the better path to explore today (entry/risk levels can be set according to the rejection candlestick’s structure).
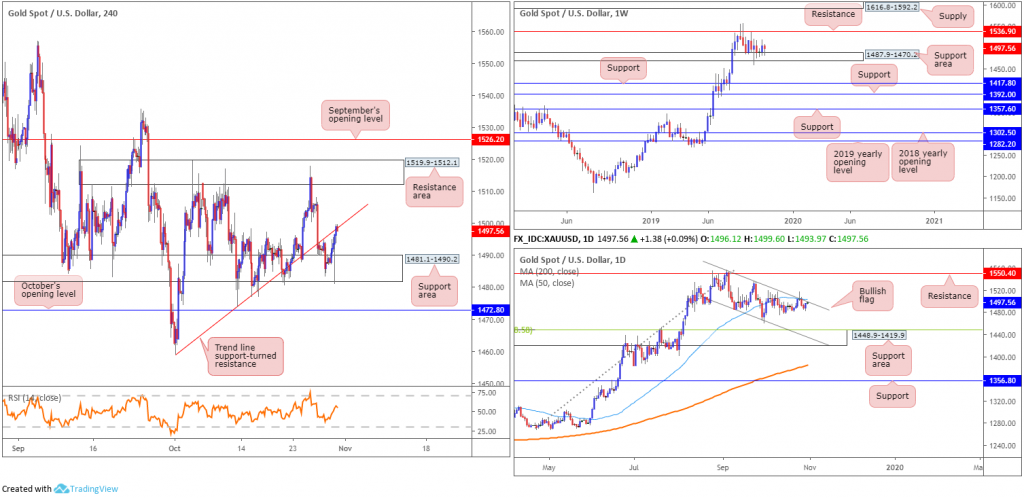
XAU/USD
(Gold):
The
yellow metal erased Tuesday’s losses in reasonably robust fashion Wednesday as
traders ditched the greenback in favour of bullion. The
FOMC cut its benchmark funds rate by 25 basis points to a range of 1.5% to
1.75% on Wednesday, as expected, though specified the moves to ease policy
could be approaching a pause.
Technically, gold remains bolstered by
a weekly support area coming in at 1487.9-1470.2. Weekly resistance is seen
at 1536.9, whereas two layers of weekly support are visible at 1392.0 and 1417.8,
in the event we eventually push for lower ground. With respect to the
longer-term primary trend, gold has been trading northbound since the later
part of 2015 (1046.5).
Contrary
to the weekly timeframe, daily price, after forming a bullish outside day
candlestick formation, is seen testing the upper edge of a bullish flag (taken
from the high 1557.1). Note a few points north of this angle we also have a
50-day SMA (blue – 1504.3). The next downside target from this region falls in
at a support area drawn from 1448.9-1419.9 (also has a 38.2% Fibonacci
retracement ratio aligning with its top edge at 1448.5 – green).
The
support area at 1481.1-1490.2 stationed on the H4 timeframe held ground
yesterday, pressuring the H4 candles to trend line support-turned resistance
(taken from the low 1458.9).
Areas
of consideration:
In essence, we have weekly price portending a move higher, daily price suggesting we may be heading lower and H4 action undecided between a trend line resistance and support area. Until a break of either of the said H4 areas is seen, trading this market is challenging. Even then, though, space to move is limited with a H4 resistance area lurking nearby at 1519.9-1512.1 and October’s opening level offering possible support at 1472.8.
The accuracy, completeness and
timeliness of the information contained on this site cannot be guaranteed. IC
Markets does not warranty, guarantee or make any representations, or assume any
liability regarding financial results based on the use of the information in
the site.
News, views, opinions, recommendations
and other information obtained from sources outside of www.icmarkets.com.au,
used in this site are believed to be reliable, but we cannot guarantee their
accuracy or completeness. All such information is subject to change at any time
without notice. IC Markets assumes no responsibility for the content of any
linked site.
The fact that such links may exist
does not indicate approval or endorsement of any material contained on any
linked site. IC Markets is not liable for any harm caused by the transmission,
through accessing the services or information on this site, of a computer
virus, or other computer code or programming device that might be used to
access, delete, damage, disable, disrupt or otherwise impede in any manner, the
operation of the site or of any user’s software, hardware, data or property.