Articles
EUR/USD Forecast: Bearish feast despite Treasury yields retreated sharply
117208 February 28, 2021 21:05 FXStreet Market News
EUR/USD Current Price: 1.2065
- The US House of Representative passed the coronavirus relief bill on Saturday.
- Growth-related data will take center stage at the beginning of the week.
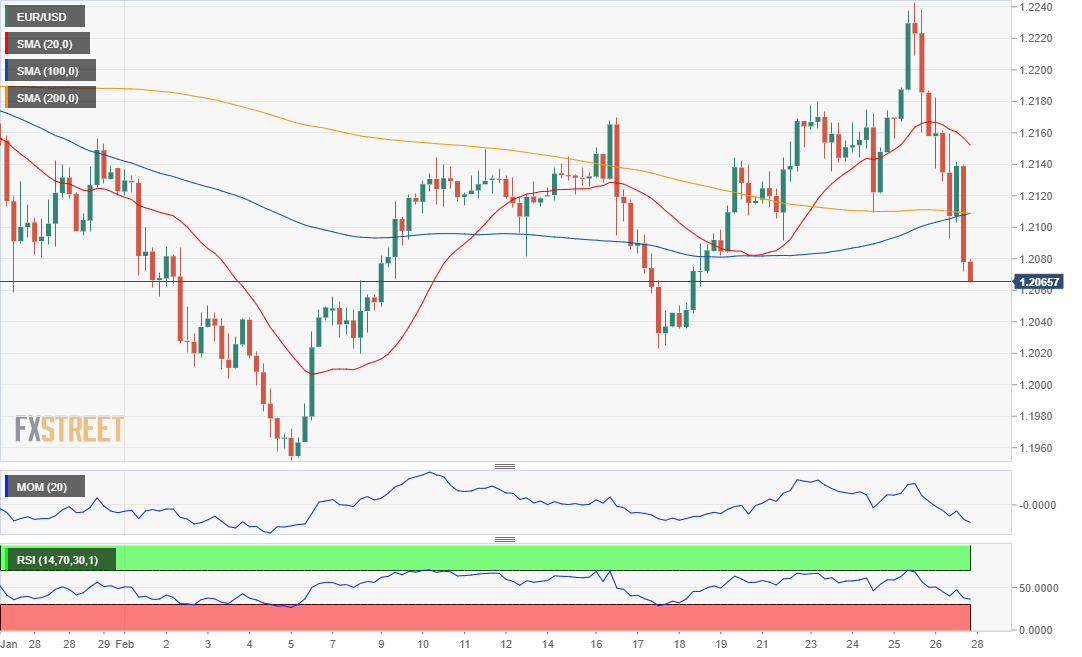
- EUR/USD is technically bearish and poised to retest the February low at 1.1951.
The American dollar finished the week with a firm note against its major rivals, with EUR/USD bottoming at 1.2061 and closing the week in the red a handful of pips above this last. The greenback appreciated despite US Treasury yields retreated sharply. Stocks, on the other hand, persisted in their bearish route, with only the Nasdaq posting an intraday advance. Month-end flows are partially responsible for Friday’s movements.
The US published the preliminary estimate of the January Trade Balance, which posted a deficit of $83.7 billion, slightly better than the December one. Personal Income in the same month was up 10%, while Personal Spending rose just 2.4%. The final version of the February Michigan Consumer Sentiment Index came in at 76.8.
On Saturday, the US House of Representatives passed President Joe Biden’s $1.9 trillion coronavirus relief package by 219-212 votes. Republican support was missing, but the bill moved to the Senate, where it is expected to pass before March 14, when the previous round of stimulus expires.
The macroeconomic calendar will include the final readings of Markit February Manufacturing PMIs for the EU and the US, while the latter will publish the official ISM report, foreseen at 58-9 from 58.7. Germany will publish the preliminary estimate of February inflation.
EUR/USD short-term technical outlook
The EUR/USD pair is trading a few pips above the 38.2% retracement of its November/January rally. A clear break of the support level could see EUR/USD approaching February low at 1.1951. In the daily chart, the pair has settled below a directionless 20 SMA, while a bullish 100 SMA provides dynamic support around 1.2010. Technical indicators head sharply lower, supporting a bearish continuation, as the RSI already crossed into negative territory. The bearish potential is stronger in the near-term, as, in the 4-hour chart, as the pair is now below all of its moving averages, while technical indicators remain near oversold readings.
Support levels: 1.2060 1.2010 1.1970
Resistance levels: 1.2125 1.2170 1.2215
View Live Chart for the EUR/USD
Full ArticleForex Today: Dollar’s momentum could suffer from stimulus news
117207 February 28, 2021 21:02 FXStreet Market News
What you need to know on Monday, March 1:
The greenback appreciated sharply at the end of the week, finishing it with gains against all of its major rivals. Global indexes closed with sharp losses, except for the Nasdaq that managed to post an intraday advance.
US Treasury yields continued to retreat ahead of the weekly close, but that didn’t prevent the dollar from appreciating. The yield on the benchmark 10-year Treasury note settled at 1.40% after peaking at a one-year high of 1.61% mid-week.
The EUR/USD pair settled just above the 1.2060 support, while GBP/USD ended at 1.3930. Commodity-linked currencies were the most hit by the greenback’s strength, and are at risk of extending their slumps.
Gold plunged to a fresh 2021 low of $1,717.14 a troy ounce, while oil prices also retreated, although WTI settled at $61.50 a barrel.
On Saturday, the US House of Representatives passed President Joe Biden’s $1.9 trillion coronavirus relief package by 219-212 votes. Republican support was missing, but the bill moved to the Senate, where is expected to pass before March 14, when the previous round of stimulus expires. Also on Saturday, President Biden called on the Senate to pass the stimulus bill.
Over the weekend, news pointed out that UK finance minister Rishi Sunak would announce this week 5 billion pounds of additional grants to help businesses hit by the pandemic, in his budget statement next Wednesday.
Bitcoin Price Analysis: BTC could try to reclaim $50K as selloff loses momentum at key support
Full ArticleAUD/USD Forecast: Mounting bearish pressure points to a steeper decline
117205 February 28, 2021 21:02 FXStreet Market News
AUD/USD Current Price: 0.7694
- Gold fell to a fresh 2021 low, adding pressure on commodity-linked currencies.
- Chinese business output expanded at a slower pace in February.
- AUD/USD hovers around 0.7700 with increased bearish potential.
The AUD/USD pair plummeted on Friday to a fresh two-week low of 0.7691, closing the week a few pips above this last. Commodity-linked currencies were the worst performers at the end of the week, undermined by falling oil and gold prices, with the latter trading as low as $1,717.14 a troy ounce. Australian published on Friday, January Private Sector Credit, which rose 0.2% MoM and 1.7% YoY.
Over the weekend, China published the February NBS Manufacturing PMI, which fell to 50.3 from 51.3 in the previous month. The Non-Manufacturing PMI contracted from 52.4 to 51.4. Australia will publish early on Monday the February Commonwealth Bank Manufacturing PMI and TD Securities Inflation for the same month.
AUD/USD short-term technical outlook
The AUD/USD pair is at risk of falling further, according to the daily chart, as the pair is below a flat 20 SMA, although well above bullish longer ones. Technical indicators retreated sharply from overbought readings, with the Momentum around its 100 level and the RSI at 45, both indicating further declines ahead. In the 4-hour chart, technical indicators pared their declines in extreme oversold readings, holding nearby and skewing the risk to the downside. Additionally, the pair is below all of its moving averages, with the 20 SMA accelerating south above the larger ones.
Support levels: 0.7865 0.7820 0.7770
Resistance levels: 0.7920 0.7965 0.8005
View Live Chart for the AUD/USD
Full ArticleUSD/JPY Forecast: Bullish continuation depending on yields’ recovery
117203 February 28, 2021 20:56 FXStreet Market News
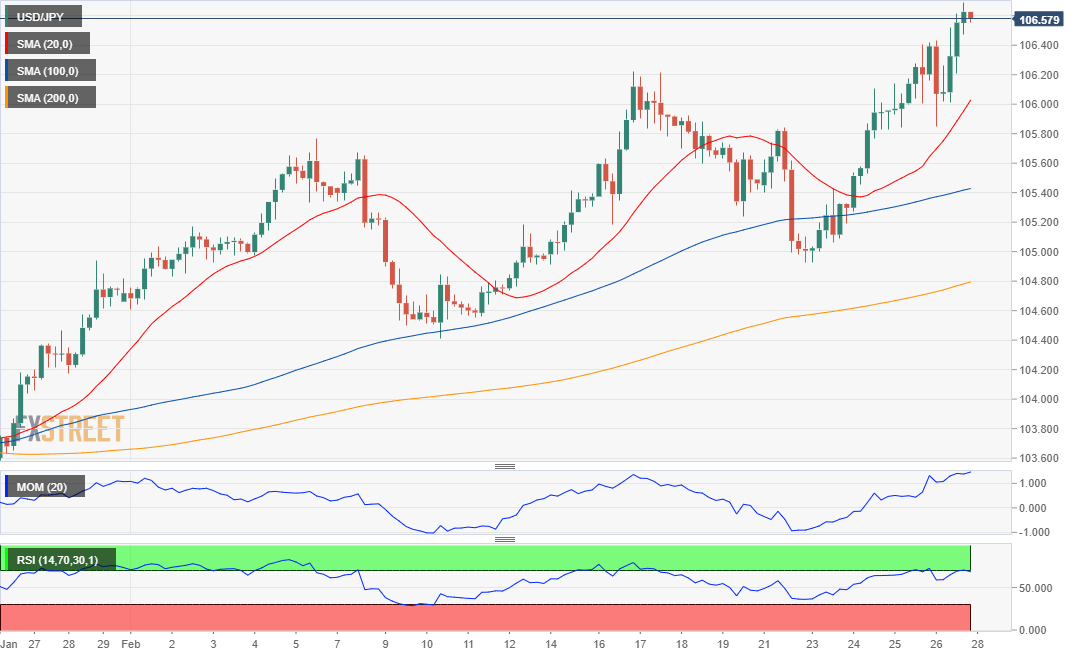
USD/JPY Current price: 106.57
- US Treasury yields retreated sharply ahead of the weekly close.
- The persistent dollar’s demand overshadowed falling equities and yields.
- USD/JPY is technically bullish, the next hurdle around 106.95.
The USD/JPY pair reached 106.68 on Friday, a level that was last seen in August 2020, to close the week with gains in the 106.50 price zone. The dollar’s demand overshadowed a sharp decline in US Treasury yields ahead of the weekly close, as the yield on the benchmark 10-year Treasury note settled at 1.40% after peaking earlier in the week at 1.61%, a one-year high.
Japan published February Tokyo inflation data, with the headline figure printing at -0.3% YoY, as expected. The core reading, which excludes fresh food prices, also printed at -0.3% YoY. Industrial Production was up 4.2% MoM in January but contracted 5.3% compared to a year earlier. Finally, Construction Orders were up by 14.1% in January, although Housing Starts decreased by 3.1%. Japan will publish the February Jibun Bank Manufacturing PMI this Monday, previously at 50.6.
USD/JPY short-term technical outlook
The USD/JPY pair is bullish, according to the daily chart, as technical indicators maintain their momentum upwards near overbought readings, as the pair develops above all of its moving averages. The 20 SMA has largely surpassed the 100 SMA and is about to cross above the 200 SMA. In the 4-hour chart, technical indicators retreat from overbought readings but hold well above their midlines, while the pair stands well above bullish moving averages. Further gains are likely, mainly if US government bond yields resume their advance.
Support levels: 106.20 105.75 105.30
Resistance levels: 106.95 107.20 107.60
View Live Chart for the USD/JPY
Full ArticleGBP/USD Forecast: Bulls temporarily side-lined but retaining control
117201 February 28, 2021 20:56 FXStreet Market News
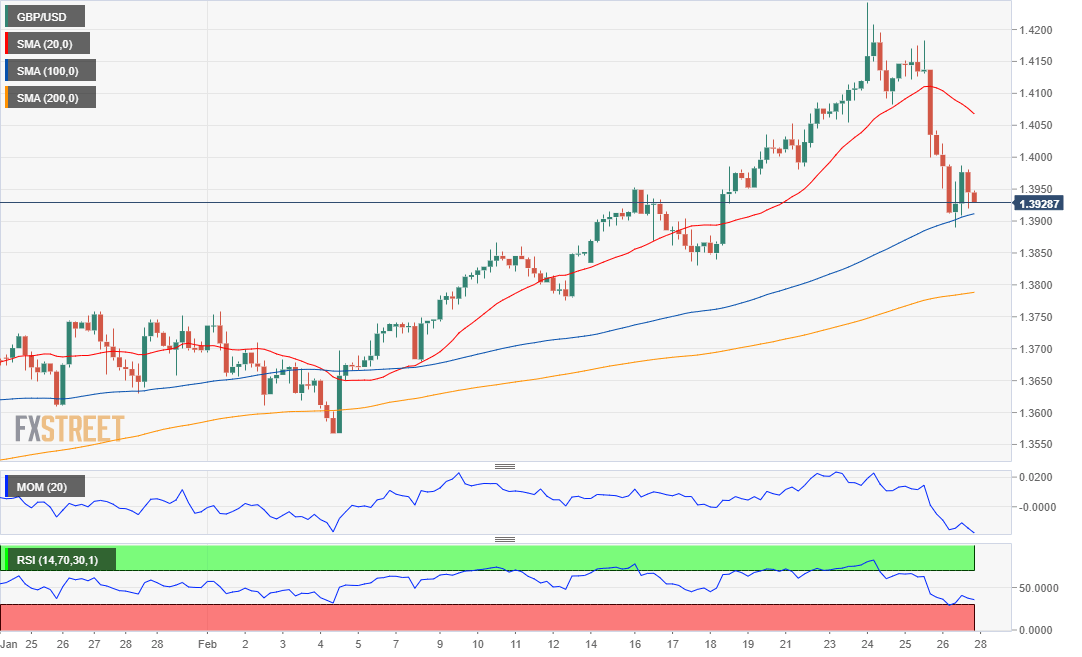
GBP/USD Current price: 1.3928
- UK finance minister Rishi Sunak is likely to announce additional help for business.
- Markit to confirm that manufacturing output in the UK expanded in January at a solid pace.
- GBP/USD corrected extreme overbought conditions, further slides unclear.
The GBP/USD pair fell for a second consecutive day, closing the week in the red at 1.3928. A scarce UK macroeconomic calendar favored the slump, as there were no reasons to buy the pound. The market has already priced in better progress in coronavirus immunization in the UK, which could be translated into a sooner economic comeback. Profit-taking on the last trading day of the month may have also taken its toll after the pair reached an almost three-year high mid-week.
Over the weekend, news pointed out that UK finance minister Rishi Sunak would announce this week 5 billion pounds of additional grants to help businesses hit by the pandemic in his budget statement next Wednesday. Markit will release the final reading of the UK Manufacturing PMI this Monday, foreseen at 54.9. The country will publish January money data, with Mortgage Approvals expected at 96K.
GBP/USD short-term technical outlook
From a technical point of view, the GBP/USD pair is in a corrective decline. In the daily chart, the pair develops above bullish moving averages. The 20 SMA provides dynamic support at 1.3860, with a break below it opening the doors for a steeper decline. Technical indicators retreated sharply from overbought readings, maintaining their bearish slopes but within positive levels. In the 4-hour chart, the pair is developing below a bearish 20 SMA and just above a bullish 100 SMA. Technical indicators remain near oversold levels, the Momentum bouncing modestly, but the RSI maintaining its bearish slope.
Support levels: 1.3880 1.3830 1.3775
Resistance levels: 1.3965 1.4000 1.4040
View Live Chart for the GBP/USD
Full ArticleCardano Price Analysis: ADA looks to correct toward $1.1 after renewing record highs
117198 February 28, 2021 17:12 FXStreet Market News
- Cardano touched a fresh all-time high on Saturday.
- RSI indicator on the daily chart stays in the overbought territory.
- On-chain metrics show strong support aligns around $1.1.
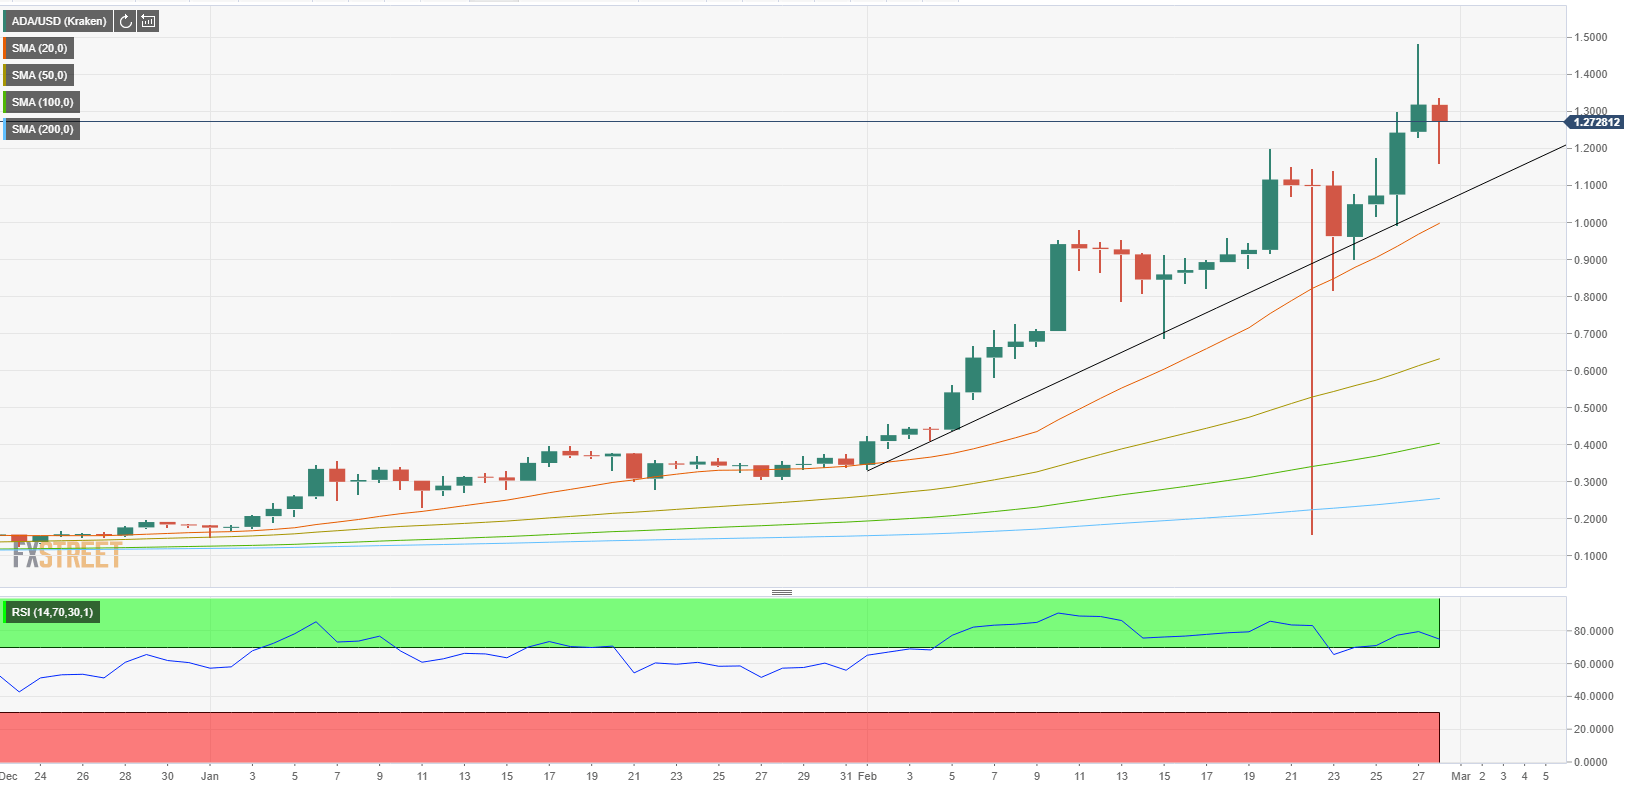
Cardano climbed to a new all-time high of $1.4850 on Saturday but lost its bullish momentum. At the moment, ADA is trading around $1.25, losing around 5% on a daily basis.
Downward correction could extend to $1.1
On the daily chart, the ascending trend line coming from early February is currently forming support around $1.1 ahead of $1 (psychological level/20-day SMA). As long as the price manages to stay above those levels, the next leg down will be seen as a technical correction rather than a shift of trend.
However, a decisive break through that support area could trigger a deep selloff. On the upside, additional gains are likely if ADA makes a daily close above $1.5 (all-time high).
Cardano one-day chart
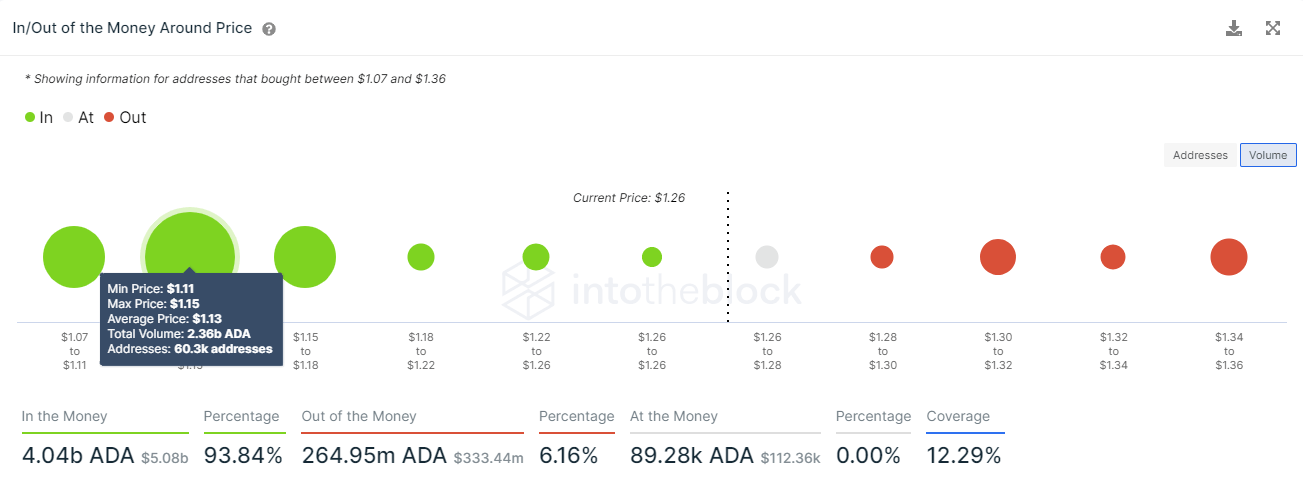
The lack of significant support areas ahead of $1.1 on IntoTheBlock’s In/Out of the Money Around Price (IOMAP) model reinforces the view that ADA could edge lower toward that area in the near-term. However, the chart shows that 2.36 billion ADA at an average price of $1.13 had been acquired by 60,300 addresses, suggesting that ADA will have a difficult time dropping below that level.
Cardano retreated sharply after surging to a fresh record high on Saturday and eyes $1.1-$1 area as the next target. If buyers manage to keep ADA afloat above that region, the bullish momentum could start to gather strength.
Full ArticleEthereum Price Prediction: ETH bears eye $1,200 as price remains below key resistance
117195 February 28, 2021 16:45 FXStreet Market News
- Ethereum continues to push lower on the last day of the week.
- $1,200 could be seen as the next target on the downside ahead of $1,100.
- Bears are likely to continue to dominate ETH unless it manages to reclaim $1,500.
Ethereum traded in a relatively tight range on Saturday and closed the day in the positive territory but came in under strong selling pressure on Sunday. As of writing, ETH was trading at $1,356, losing 7% and 28% on a daily and weekly basis, respectively.
Near-term bearish outlook remains intact
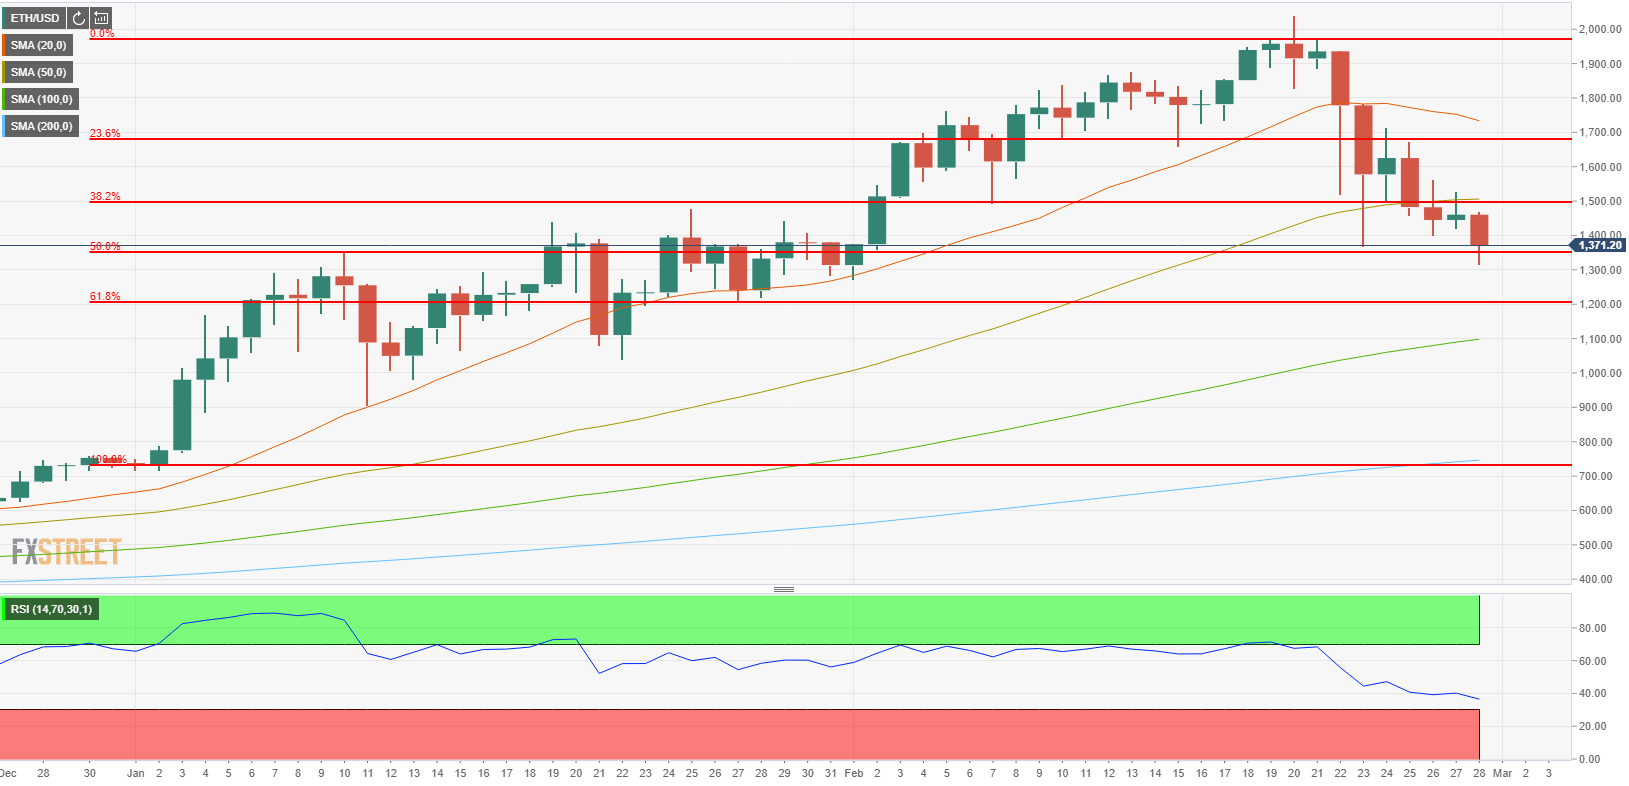
On the daily chart, the Relative Strength Index (RSI) indicator still floats above 30, suggesting that there is more room on the downside before Ethereum becomes technically oversold. Additionally, ETH closed the third straight day below the 50-day SMA on Saturday.
The next target on the downside is located at $1,200 (Fibonacci 61.8% retracement of Jan.2 – Feb. 20 uptrend). Below that level, $1,100 (100-day SMA) and $1,000 (psychological level) align as next key support levels. On the other hand, unless ETH manages to make a daily close above $1,500 (Fibonacci 38.2% retracement, 50-day SMA), bears are likely to remain in control of the price. Beyond that hurdle, $1,680 (Fibonacci 23.6% retracement) aligns as the next resistance.
ETH/USD one-day chart
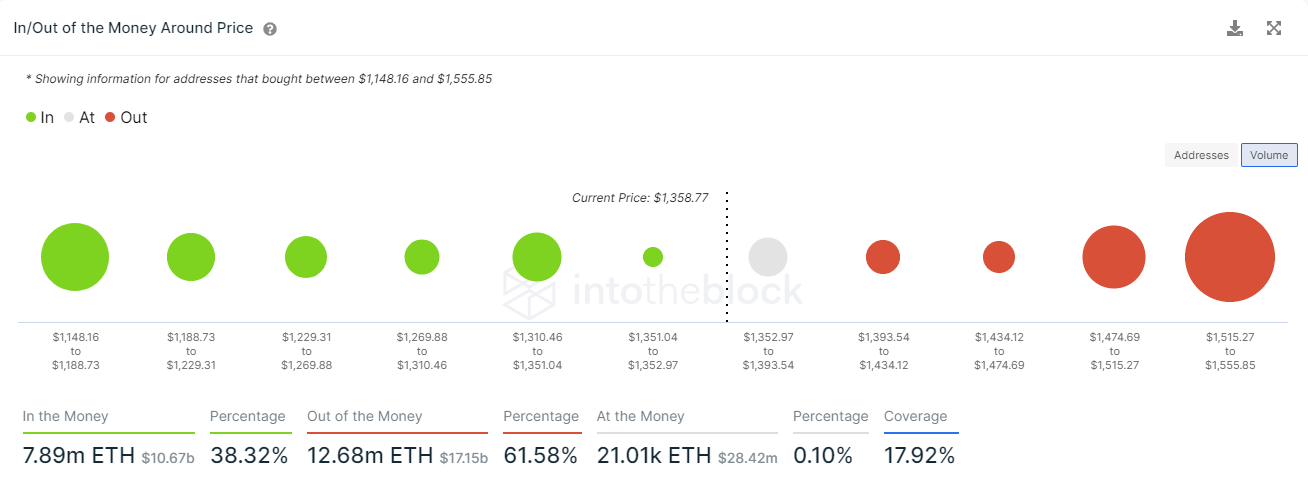
IntoTheBlock’s In/Out of the Money Around Price (IOMAP) model reaffirms the significance of $1,500 as a key resistance with investors having bought more than 8 million ETH around that price. On the flip side, several medium-strength supports could be seen ahead of $1,200.
Ethereum IOMAP chart
Ethereum continues to trade below the key $1,500 area and the near-term technical outlook alongside the on-chain metrics suggests that the selling pressure is likely to remain intact. $1,200 could be seen as the next target on the downside ahead of $1,1100.
Full ArticleUS January PCE core +1.5% y/y vs +1.4% expected
117194 February 28, 2021 04:26 Forexlive Latest News Market News
HIGH RISK WARNING: Foreign exchange trading carries a high level of risk that may not be suitable for all investors. Leverage creates additional risk and loss exposure. Before you decide to trade foreign exchange, carefully consider your investment objectives, experience level, and risk tolerance. You could lose some or all of your initial investment; do not invest money that you cannot afford to lose. Educate yourself on the risks associated with foreign exchange trading, and seek advice from an independent financial or tax advisor if you have any questions.
ADVISORY WARNING: FOREXLIVE™ provides references and links to selected blogs and other sources of economic and market information as an educational service to its clients and prospects and does not endorse the opinions or recommendations of the blogs or other sources of information. Clients and prospects are advised to carefully consider the opinions and analysis offered in the blogs or other information sources in the context of the client or prospect’s individual analysis and decision making. None of the blogs or other sources of information is to be considered as constituting a track record. Past performance is no guarantee of future results and FOREXLIVE™ specifically advises clients and prospects to carefully review all claims and representations made by advisors, bloggers, money managers and system vendors before investing any funds or opening an account with any Forex dealer. Any news, opinions, research, data, or other information contained within this website is provided as general market commentary and does not constitute investment or trading advice. FOREXLIVE™ expressly disclaims any liability for any lost principal or profits without limitation which may arise directly or indirectly from the use of or reliance on such information. As with all such advisory services, past results are never a guarantee of future results.
Full Article
US January advance goods trade balance -$83.7B vs -$83.0B expected
117193 February 28, 2021 04:21 Forexlive Latest News Market News
January 2021 trade data
- Prior month -$82.5 billion
- Exports +1.4% vs +4.6% in December
- Imports +1.1% vs +1.4% in December
The pandemic has caused some large skews in trade with US food and beverage exports up 24.7% y/y and imports of consumer goods up 18.8% y/y. Capital goods exports have recovered the past two months but were down 6.8% y/y.
Overall, trade is a major drag on US growth and not improving.
Full Article
Canada January industrial product prices +2.0% m/m vs +1.9% expected
117192 February 28, 2021 04:17 Forexlive Latest News Market News
Canada PPI report
- Prior was +1.5% m/m
- Raw materials price index +5.7% vs +3.5% prior
Keep in mind, these are one-month increases at a pace that’s nearly matching the BOC’s annual inflation target.
Full Article
Bond market retracement improves the market mood
117190 February 28, 2021 04:12 Forexlive Latest News Market News
The market gets a handle on what happened yesterday
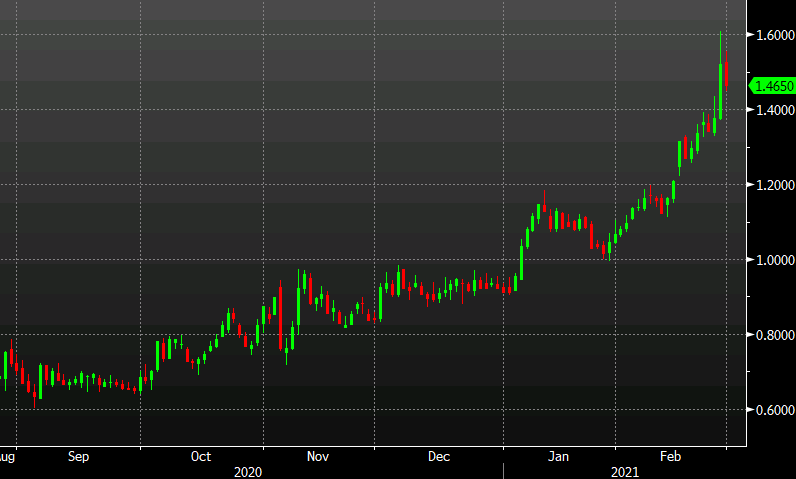
US 10-year yields are down 6 bps today after yesterday’s washout. The curve is flattening again but only modestly and that’s giving broader sentiment a lift. US equity futures are now higher after falling by 1% overnight and commodity currency buyers are dipping their toes in.
I wrote about the role of convexity hedging yesterday and that’s getting a wider airing today and helping the market get comfortable with what happened.
The forced sellers are investors in the $7 trillion mortgage-backed
bond market. Their problem is that when Treasury yields — which
strongly influence home-loan rates — suddenly rise sharply, many
Americans lose interest in refinancing their old mortgages. A reduced
stream of refinancings means mortgage-bond investors are left waiting
for longer to collect payments on their investments. The longer the
wait, the more financial pain they feel as they watch market rates climb higher without being able to take advantage of them.Their
answer: unload the Treasury bonds they hold with long maturities or
adjust derivatives positions — a phenomenon known as convexity hedging
— to compensate for the unexpected jump in duration on their mortgage
portfolios. The extra selling just as the market is already weakening
has a history of exacerbating upward moves in Treasury yields —
including during major “convexity events” in 1994 and 2003.
On top of that, the soft auction and strong (inadvertent) dealer takedown led to some dumping of Treasuries in the belly.
The whole move looks a bit like a washout but it’s a delicate situation. There will be more convexity hedging and the market will have to swallow that, perhaps with foreign flows balancing it. If the bond market starts to tilt again, it will take everything with it.
Full Article
US stocks set to bounce
117188 February 28, 2021 04:09 Forexlive Latest News Market News
Futures higher
S&P 500 futures are up 16 points after yesterday’s 96-point rout.
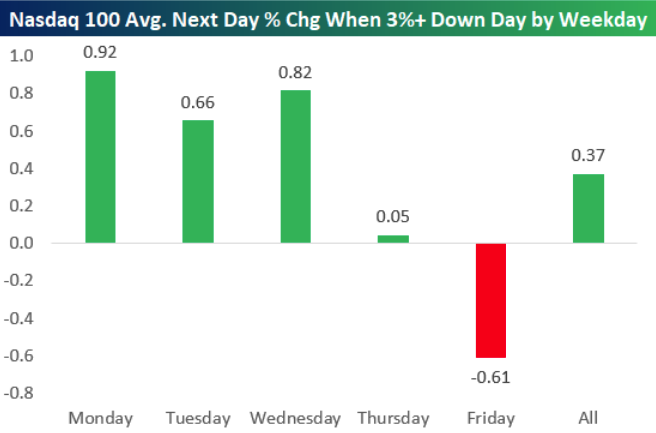
Nasdaq futures are up 126 points after the 478 point decline.
Bespoke has this chart, showing how tough it is for a market to bottom on a Friday:
Full Article

