Articles

WTI crude oil nears $74 as major moving average crossover takes place
157880 July 30, 2021 22:21 Forexlive Latest News Market News
Oil higher for the third straight day

WTI crude oil is 29-cents higher at $73.90 in the third day of gains today. It’s at a two week high and has nicely rebounded from the rout at the start of last week.
But I want to zoom out and highlight the weekly chart. The 50-week moving average is getting set to cross the 200-week MA. It’s the first positive crossover since 2018 and is a classic bullish signal.
The drop last week eases overbought conditions and was also a big test for the market. It’s now safe to say that it passed.
On the fundamental side, inventories continue to tighten as they’re drawn down and we have OPEC certainty through year end. Iran is a risk but the odds of a deal appear to be fading.
On the consumption side, delta is a problem for aviation demand but some of that is balanced by more driving and less public transit usage. Everything in the US highlights gasoline demand at extremely high levels and it’s fair to extrapolate that to the rest of the world as vaccination continues.
Full Article

US: UoM Consumer Sentiment Index declines to 81.2 (final) in July from 85.5
157879 July 30, 2021 22:09 FXStreet Market News
- Consumer confidence in the US weakened in July.
- US Dollar Index clings to modest daily gains near 92.00.
The Consumer Sentiment Index in the US declined to 81.2 (final) in July from 85.5 in June, the University of Michigan’s latest Surveys of Consumers showed on Friday. This reading missed the market expectation and the flash estimate of 80.8.
Further details of the publication revealed that the Current Economic Conditions Index declined to 84.5 from 88.6 and the Consumer Expectations Index edged lower to 79 from 83.5. Finally, the 1-year Inflation Outlook jumped to 4.7% from 4.2%.
Commenting on the data, “the largest monthly declines remained concentrated in the outlook for the national economy and complaints about high prices for homes, vehicles, and household durables, said Richard Curtin, Surveys of Consumers chief economist. “While most consumers still expect inflation to be transitory, there is growing evidence that an inflation storm is likely to develop on the not too distant horizon.”
Market reaction
These comments don’t seem to be having a significant impact on the USD’s performance against its rivals. As of writing, the US Dollar Index was up 0.12% on the day at 91.99.
Full Article
U Mich final US consumer sentiment 81.2 vs 80.8 expected
157878 July 30, 2021 22:02 Forexlive Latest News Market News
Revisions to the survey
- Prelim was 80.8
- Current conditions 84.5 vs 84.5 prelim
- Expectations 79.0 vs 78.4 prelim
- 1-yaer inflation 4.7% vs 4.8% prelim
- 5 year inflation 2.8% vs 2.9% prelim
The final report is rarely a market mover. To be honest, the main report is increasingly ignored by the market because it’s turned into more of a political sentiment survey.
Full Article
United States Michigan Consumer Sentiment Index registered at 81.2 above expectations (80.8) in July
157877 July 30, 2021 22:02 FXStreet Market News
Information on these pages contains forward-looking statements that involve risks and uncertainties. Markets and instruments profiled on this page are for informational purposes only and should not in any way come across as a recommendation to buy or sell in these assets. You should do your own thorough research before making any investment decisions. FXStreet does not in any way guarantee that this information is free from mistakes, errors, or material misstatements. It also does not guarantee that this information is of a timely nature. Investing in Open Markets involves a great deal of risk, including the loss of all or a portion of your investment, as well as emotional distress. All risks, losses and costs associated with investing, including total loss of principal, are your responsibility. The views and opinions expressed in this article are those of the authors and do not necessarily reflect the official policy or position of FXStreet nor its advertisers. The author will not be held responsible for information that is found at the end of links posted on this page.
If not otherwise explicitly mentioned in the body of the article, at the time of writing, the author has no position in any stock mentioned in this article and no business relationship with any company mentioned. The author has not received compensation for writing this article, other than from FXStreet.
FXStreet and the author do not provide personalized recommendations. The author makes no representations as to the accuracy, completeness, or suitability of this information. FXStreet and the author will not be liable for any errors, omissions or any losses, injuries or damages arising from this information and its display or use. Errors and omissions excepted.
The author and FXStreet are not registered investment advisors and nothing in this article is intended to be investment advice.
United States Chicago Purchasing Managers’ Index up to 73.4 in July from previous 66.1
157876 July 30, 2021 21:51 FXStreet Market News
Information on these pages contains forward-looking statements that involve risks and uncertainties. Markets and instruments profiled on this page are for informational purposes only and should not in any way come across as a recommendation to buy or sell in these assets. You should do your own thorough research before making any investment decisions. FXStreet does not in any way guarantee that this information is free from mistakes, errors, or material misstatements. It also does not guarantee that this information is of a timely nature. Investing in Open Markets involves a great deal of risk, including the loss of all or a portion of your investment, as well as emotional distress. All risks, losses and costs associated with investing, including total loss of principal, are your responsibility. The views and opinions expressed in this article are those of the authors and do not necessarily reflect the official policy or position of FXStreet nor its advertisers. The author will not be held responsible for information that is found at the end of links posted on this page.
If not otherwise explicitly mentioned in the body of the article, at the time of writing, the author has no position in any stock mentioned in this article and no business relationship with any company mentioned. The author has not received compensation for writing this article, other than from FXStreet.
FXStreet and the author do not provide personalized recommendations. The author makes no representations as to the accuracy, completeness, or suitability of this information. FXStreet and the author will not be liable for any errors, omissions or any losses, injuries or damages arising from this information and its display or use. Errors and omissions excepted.
The author and FXStreet are not registered investment advisors and nothing in this article is intended to be investment advice.
Gold Price Analysis: XAU/USD slides to $1,820 area, downside seems limited
157875 July 30, 2021 21:51 FXStreet Market News
Gold consolidated the overnight strong gains back closer to monthly tops and oscillated in a narrow trading band, around the $1,825-30 region through the first half of the European session. Worries about the potential economic fallout from the fast-spreading Delta variant of the coronavirus continued weighing on investors’ sentiment. This turned out to be one of the key factors that continued underpinning the safe-haven XAU/USD.
Meanwhile, the risk-off impulse in the markets triggered a fresh leg down in the US Treasury bond yields. This comes on the back of the Fed Chair Jerome Powell’s dovish remarks on Wednesday and further acted as a tailwind for the non-yielding gold. Apart from this, the prevalent selling bias surrounding the US dollar extended some additional support to the dollar-denominated commodity, though the lack of any follow-through buying warrants caution for bulls.
Nevertheless, gold remains on track to record its biggest weekly gains since May 21 and seems poised to appreciate further amid signs that the Fed will stick to its ultra-lose policy stance for a longer period. The US central bank on Wednesday acknowledged that the economy has made progress towards the maximum employment and price stability goals. However, the Fed Chair Jerome Powell took a dovish turn at the post-meeting press conference.
Powell emphasised that they were some ways away from substantial progress on jobs. He was also cautious about tapering and said that policymakers discussed some details but it will take a few more meetings to get into it. The market speculations were further reinforced by Thursday’s disappointing US GDP report, which showed that the world’s largest economy expanded by 6.5% annualized pace in the second quarter as against the 8.5% growth anticipated.
Technical outlook
Looking at the technical picture, acceptance above the very important 200-day SMA favours bullish traders. That said, it will be prudent to wait for some follow-through buying beyond the monthly swing highs, around the $1,834 region, before positioning for any further upside. The next relevant hurdle is pegged near the $1,845-46 area, above which gold is likely to accelerate the momentum towards the $$1,866 area. Some follow-through buying should allow bulls to eventually aim to reclaim the $1,900 round-figure mark.
On the flip side, the 200-day SMA, currently around the $1,821 region, might now protect the immediate downside. This is followed by support near the $1,810 horizontal level, below which gold could slide back to the $1,800 mark. Some follow-through selling below the key $1,790 support might prompt some aggressive technical selling. The next relevant support is pegged near the $1,765-60 region before the XAU/USD eventually drops to challenge monthly swing lows, around the $1,750 region.
Full Article
EUR/USD turns negative around 1.1880, dollar regains the smile
157874 July 30, 2021 21:45 FXStreet Market News
- EUR/USD fades the earlier move to levels past 1.1900.
- EMU flash Q2 GDP rose 2.0% QoQ, 13.7% YoY.
- US Core PCE came in short of estimates in June.
EUR/USD came under some selling pressure soon after hitting fresh monthly peaks in levels north of 1.19 the figure on Friday.
EUR/USD now looks to a test of 1.1975
EUR/USD now sees its upside momentum mitigated on the back of some mild recovery in the greenback.
In fact, the pair corrects lower following the early move beyond 1.19 and after spot hit the overbought territory on the hourly chart (as per the RSI). Furthermore, EUR/USD remains on track to close the week in the positive ground following two consecutive weekly pullbacks.
Positive results in the euro docket are also supportive of the upbeat momentum in the pair after preliminary GDP figures in the euro area now see the region expanding 2.0% QoQ during the April-June period and 13.7% from a year earlier. In Germany, the economy is now expected to expand 1.5% inter-quarter and 9.6% on an annualized basis.
Regarding inflation in Euroland, flash data now see the headline CPI rising 2.2% vs. July 2020 and 0.7% when comes to the Core CPI.
In the US, the inflation tracked by the PCE rose 4% YoY in June and 3.5% excluding food and energy costs. Additional data noted the Personal Spending expanded 1.0% MoM during last month and Personal Income rose 0.1% MoM.
Later in the NA session, the final U-Mich print for the month of July will close the weely docket.
EUR/USD levels to watch
So far, spot is down 0.05% at 1.1879 and a breakdown of 1.1751 (monthly low Jul.21) would target 1.1704 (2021 low Mar.31) en route to 1.1602 (November 2020 low). On the upside, the next hurdle is located at 1.1908 (weekly high Jul.30) followed by 1.1975 (weekly high Jun.25) and finally 1.2004 (200-day SMA).
Full Article
S&P 500 Index opens in the negative territory below 4,400
157872 July 30, 2021 21:40 FXStreet Market News
- Wall Street’s main indexes trade in the red on Friday.
- Defensive sectors trade in the positive territory after the opening bell.
- S&P 500 Consumer Discretionary Index is down nearly 3%.
Major equity indexes in the US opened lower on the last trading day of the week. The S&P 500 Index, which notched a new all-time high of 4,429, is currently down 0.5% at 4,396, the Dow Jones Industrial Average is losing 0.1% at 35,052 and the Nasdaq Composite is falling nearly 1% at 14,636.
Earlier in the day, the US Bureau of Economic Analysis reported that Personal Spending increased by 1% in June while Personal Income rose by only 0.1%. Moreover, the Core PCE inflation edged higher to 3.5% on a yearly basis in June, compared to analysts’ estimate of 3.7%.
Among the 11 major S&P 500 sectors, the defensive Real Estate and Utilities indexes trade in the positive territory after the opening bell. On the other hand, the COnsumer Discretionary Index is down 2.8% as the biggest percentage decline in early trade.
S&P 500 chart (daily)

OPEC July output rose 610K bpd to 26.72 mbpd – poll
157871 July 30, 2021 21:33 Forexlive Latest News Market News
HIGH RISK WARNING: Foreign exchange trading carries a high level of risk that may not be suitable for all investors. Leverage creates additional risk and loss exposure. Before you decide to trade foreign exchange, carefully consider your investment objectives, experience level, and risk tolerance. You could lose some or all of your initial investment; do not invest money that you cannot afford to lose. Educate yourself on the risks associated with foreign exchange trading, and seek advice from an independent financial or tax advisor if you have any questions.
ADVISORY WARNING: FOREXLIVE™ provides references and links to selected blogs and other sources of economic and market information as an educational service to its clients and prospects and does not endorse the opinions or recommendations of the blogs or other sources of information. Clients and prospects are advised to carefully consider the opinions and analysis offered in the blogs or other information sources in the context of the client or prospect’s individual analysis and decision making. None of the blogs or other sources of information is to be considered as constituting a track record. Past performance is no guarantee of future results and FOREXLIVE™ specifically advises clients and prospects to carefully review all claims and representations made by advisors, bloggers, money managers and system vendors before investing any funds or opening an account with any Forex dealer. Any news, opinions, research, data, or other information contained within this website is provided as general market commentary and does not constitute investment or trading advice. FOREXLIVE™ expressly disclaims any liability for any lost principal or profits without limitation which may arise directly or indirectly from the use of or reliance on such information. As with all such advisory services, past results are never a guarantee of future results.
Full Article
Fed’s Bullard: Fed should taper asset purchases this fall
157870 July 30, 2021 21:33 FXStreet Market News
St. Louis Fed President James Bullard said on Friday that he feels the Federal Reserve should taper asset purchases this fall and go fairly rapidly, as reported by Reuters.
Additional takeaways
“Financial markets are well prepared for taper.”
“Fed should finish taper by the end of Q1-2022.”
“Ending taper in early 2022 would open the way for a rate increase that year if needed.”
Market reaction
These remarks help the USD stay resilient against its rivals. As of writing, the US Dollar Index was up 0.13% on the day at 92.00.
Full Article
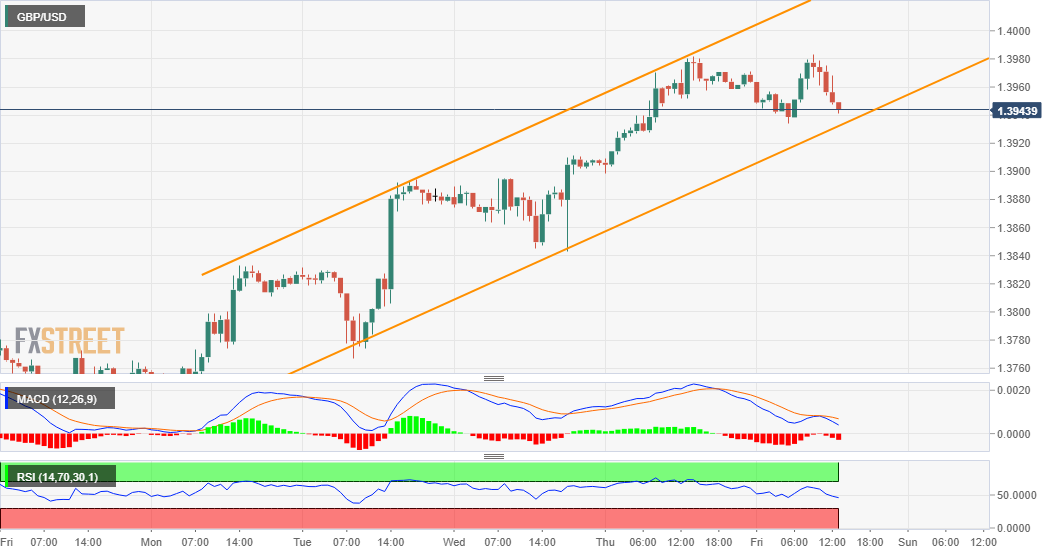
GBP/USD Price Analysis: Tests weekly ascending channel support, just below mid-1.3900s
157869 July 30, 2021 21:33 FXStreet Market News
- GBP/SUD stalled its recent strong move up near the 61.8% Fibo. level resistance.
- The risk-off impulse benefitted the safe-haven USD and capped any further gains.
- A sustained break below the 1.3900 mark is needed to negate the positive outlook.
The GBP/USD pair retreated around 40 pips from daily tops and has now dropped to the lower end of its intraday trading range, around the 1.3940 region.
The risk-off impulse in the markets drove some haven flows towards the US dollar. This, in turn, was seen as a key factor that failed to assist the GBP/USD pair to capitalize on its intraday positive move to the 1.3980-85 region, or over one-month tops.
From a technical perspective, the recent strong rebound from the lowest level since February stalled near the 61.8% Fibonacci level of the 1.4249-1.3572 downfall. That said, the formation of an ascending trend channel on hourly charts favours bullish traders.
The positive outlook is reinforced by the fact that technical indicators on the daily chart have been gaining positive traction and are still far from being in the overbought zone. Hence, any subsequent slide might be limited near the trend-channel support.
However, a sustained break below might prompt some technical selling and accelerate the corrective pullback towards the 1.3900 mark. The latter coincides with the 50% Fibo. level, which if broken decisively will set the stage for further weakness.
The GBP/USD pair might then extend the fall towards the 1.3860 horizontal support en-route the 38.2% Fibo. level, around the 1.3830-25 region. Some follow-through selling below the 1.3800 mark will shift the near-term bias back in favour of bearish traders.
On the flip side, the 1.3980-85 region (61.8% Fibo. level) might continue to act as an immediate hurdle. This is closely followed by the key 1.4000 psychological mark ahead of the top end of the mentioned trend-channel resistance, around the 1.4015 region.
A convincing breakthrough will be seen as a fresh trigger for bullish traders and push the GBP/USD pair further towards the 1.4070-75 intermediate resistance. The momentum could further get extended and allow bulls to aim back to reclaim the 1.4100 round figure.
GBP/USD 1-hour chart
Technical levels to watch
Full Article
NZD/USD trades below 0.7000 after US inflation data
157868 July 30, 2021 21:26 FXStreet Market News
- NZD/USD is edging slightly lower in the early American session.
- Core PCE inflation edged higher in June but came in lower than market expectation.
- US Dollar Index clings to modest gains near 92.00.
The NZD/USD pair is pushing lower in the early American session and was last seen losing 0.2% on the day at 0.6994.
DXY tests 92.00 on Friday
The modest USD strength seems to be weighing on NZD/USD. The US Dollar Index is currently rising 0.12% on the day at 91.99.
The data published by the US Bureau of Economic Analysis showed on Friday that the Core Personal Consumption Expenditures (PCE) Price Index rose to 3.5% on a yearly basis in June from 3.4% in May. This print came in lower than the market expectation of 3.7%. Other data from the US revealed that Personal Income increased by 0.1% in the same period while Personal Spending expanded by 1%.
Meanwhile, St. Louis Fed President James Bullard said the labour market could be fully recovered by next summer and added this would meet the condition for the Fed to start raising rates.
Later in the session, the University of Michigan will release the July Consumer Sentiment Index data. Earlier in the day, the Roy Morgan Consumer Confidence Index in New Zealand declined to 113.1 in July from 114.1 in June but this print was largely ignored by market participants.