Articles

Gold Price Forecast: XAU/EUR renews five-week top above €1,600 with eyes on 2022
193048 December 31, 2021 14:40 FXStreet Market News
- Gold stays on the front foot after rising the most in two weeks the previous day.
- Market sentiment improves, lack of data/events and year-end liquidity crunch to restrict moves.
- Multiple hurdles on the north will test buyers, Fed v/s ECB battle will be crucial.
Gold (XAU/EUR) pokes the highest levels since December 26, taking the bids around €1,608 during early European morning on Friday. In doing so, the yellow metal prices in Euro increase for the second consecutive day, extending a notable jump marked on Thursday.
The firmer US data and hopes of early Fed rate-hike favored the USD and weighed on the Euro, fueling the gold prices the previous day. However, the commodity’s latest run-up could be linked to the cautious optimism in the market amid a sluggish end of 2021.
That said, the Euro Index remains pressured amid worsening covid conditions and the resulted activity restrictions in the bloc. “In Europe, where almost one million people have died of coronavirus over the past 12 months, traditional concerts and firework displays that typically draw thousands of people onto the streets were canceled in most major cities, including London, Paris, Zurich, Brussels, Warsaw and Rome,” said Reuters.
Elsewhere, Reuters’ tally for the US seven-day average of new coronavirus cases refreshes record top for the second consecutive day with 290,000 latest figures.
Adding to the US dollar strength are the market fears, recently backed by geopolitical headlines. Iran’s space launch derails previous optimism concerning the denuclearization deal with the global leaders. On the same line were the dislikes of China and Hong Kong for the US push to release Hong Kong-based journalists. Also portraying the fears of the geopolitical tension were the headlines from Reuters over Ukraine, “US President Joe Biden and his Russian counterpart Vladimir Putin on Thursday warned each other that an escalation of tensions over Ukraine could rupture relations between the two countries, U.S. and Russian officials said.”
It should be noted that the US Dollar Index (DXY) prints mild gains around 96.05 during its second consecutive positive day. The S&P 500 Futures pare Asian session losses and help the gold buyers to stay hopeful amid hopes of fewer odds favoring hospitalization due to the South African covid variant, namely Omicron.
Looking forward, a light calendar and the yearn-end holiday mood can restrict XAU/EUR performance.
Technical analysis
Sustained trading beyond the 100-SMA level of €1,587 enables the XAU/EUR bulls to aim for the seven-week-old horizontal area near €1,610-12. However, an upward sloping trend line from December 07, near €1,616, adds to the upside filters.
In a case where the gold buyers manage to cross the €1,616 resistance, the odds of witnessing a rally towards €1,633 and November’s peak of €1,653 can’t be ruled out.
Alternatively, a downside break of the 100-SMA level surrounding €1,587 isn’t a green card for the XAU/EUR bears as the monthly support line will precede ascending trend line from December 15, respectively around €1,584-83, to challenge the quote’s further weakness.
To sum up, gold prices remain firmer but nearly overbought RSI conditions may trigger the quote’s pullback from nearby resistance.
Gold: Four-hour chart

Trend: Pullback expected
Full Article
USD/JPY Outlook: Acceptance above 115.00 mark might have set the stage for further gains
193047 December 31, 2021 14:40 FXStreet Market News
- A combination of supporting factors pushed USD/JPY beyond the 115.00 mark, or a fresh monthly high on Thursday.
- The risk-on mood undermined the safe-haven JPY and remained supportive amid a pickup in the USD demand.
- Bulls now wait for a sustained strength above the monthly ascending channel resistance before placing fresh bets.
The USD/JPY pair added to its weekly gains and climbed further beyond the key 115.00 psychological mark, hitting a fresh monthly high on Thursday. Despite the continuous surge in new COVID-19 cases, investors remained optimistic amid signs that the Omicron variant is unlikely to derail the global economic recovery. This remained supportive of the underlying bullish sentiment in the financial markets, which continued undermining the safe-haven Japanese yen. Apart from this, a goodish pickup in the US dollar demand provided an additional boot to the major.
The greenback made a solid comeback and reversed the previous day’s losses back closer to the monthly low, though lacked bullish conviction amid retreating US Treasury bond yields. That said, upbeat US macro data acted as a tailwind for the buck and remained supportive of the pair’s move to the highest level since November 26. In fact, the US Initial Jobless Claims dropped more than anticipated, to 198k in the week ended December 24 – marking the lowest level since 1969. Separately, the Chicago PMI also surpassed expectations and rose to 63.1 for the current month from 61.8 in November.
This, along with the Fed’s hawkish outlook, indicating at least three rate hikes next year, extended some support to the buck. That said, the overnight modest pullback in the US equity markets held back traders from placing fresh bullish bets. Nevertheless, the pair settled just a few pips below the daily swing high and entered a bullish consolidation phase during the Asian session on Friday. Traders reacted little to mixed Chinese data, showing that the official Manufacturing PMI edged higher to 50.3 in December and the gauge for the Non-Manufacturing sector fell short of expectations.
In the absence of any major market-moving economic releases, the broader market risk sentiment will play a key role in driving the pair. Traders will further take cues from the US bond yield, which might influence the USD price dynamics and allow traders to grab some short-term opportunities on New Year’s Eve.
Technical outlook
From a technical perspective, the overnight move beyond the 115.00 mark supports prospects for additional gains. Bulls, however, are likely to wait for a sustained strength beyond a resistance marked by the top boundary of an upward sloping channel, extending from the monthly low. The pair might then climb back to mid-115.00s, or the highest level since January 2017 and accelerate the upward trajectory further towards reclaiming the 116.00 mark.
On the flip side, any corrective pullback is likely to find decent support near the 114.70 region. This is followed by the 114.35-30 horizontal zone and the 114.00 mark. The latter coincides with the trend-channel support, which if broken decisively might prompt some long-unwinding trade. The corrective pullback could then drag the pair towards the next relevant support near the 113.10-113.00 area.


AUD/USD Price Analysis: Bull’s return again aims for 0.7275 hurdle
193045 December 31, 2021 14:09 FXStreet Market News
- AUD/USD overcomes early Asian session sluggishness picks up bids of late.
- Bearish candlestick, chart pattern and Fibonacci are all trying to stop the bulls.
- Three-month-old horizontal support becomes a tough nut to crack for bears.
After an inactive start to the final day of 2021, AUD/USD traders seem to flex muscles while taking the bids to 0.7260 during the initial European morning on Friday.
AUD/USD eased from the resistance line of a monthly rising wedge bearish chart pattern the previous day, which in turn formed a bearish candlestick called Gravestone Doji. Adding strength to the 0.7275 hurdle is the 50% Fibonacci retracement (Fibo.) of October-December downside.
Although oscillators favor an upside break of the immediate 0.7275 resistance, the 100-DMA level of 0.7290 will act as a validation point for the further rally towards the mid-November swing high of 0.7371. It’s worth noting that the RSI line is nearly overbought and hence the 0.7290 hurdle could well act as a pullback point.
If not, then the 0.7400 threshold and late October’s swing low near 0.7455 will gain the market’s attention.
Alternatively, pullback moves can retest 38.2% Fibo. level surrounding 0.7200 but a three-month-old horizontal area near 0.7175-70 will restrict any further downside.
Should the AUD/USD prices decline below 0.7170, the support line of the stated wedge around 0.7140 will be crucial to watch.
AUD/USD: Daily chart

Trend: Pullback expected
Full Article
Global equities to remain firmer in 2022 – UBS
193044 December 31, 2021 14:05 FXStreet Market News
The UBS strategists remain bullish on global equities, despite the looming risks of coronavirus and rising price pressures.
Key quotes
“While mindful of risks around COVID-19 variants and inflation, we keep a positive outlook on stocks for the start of 2022.”
“Global economic growth is likely to remain above trend for the first half of 2022, monetary policy is still accommodative, even if emergency support measures are being scaled back, and we expect 10% growth in global corporate earnings in the year ahead.”
Full Article
South Africa M3 Money Supply (YoY) above expectations (4.2%) in November: Actual (6.36%)
193043 December 31, 2021 14:02 FXStreet Market News
Information on these pages contains forward-looking statements that involve risks and uncertainties. Markets and instruments profiled on this page are for informational purposes only and should not in any way come across as a recommendation to buy or sell in these assets. You should do your own thorough research before making any investment decisions. FXStreet does not in any way guarantee that this information is free from mistakes, errors, or material misstatements. It also does not guarantee that this information is of a timely nature. Investing in Open Markets involves a great deal of risk, including the loss of all or a portion of your investment, as well as emotional distress. All risks, losses and costs associated with investing, including total loss of principal, are your responsibility. The views and opinions expressed in this article are those of the authors and do not necessarily reflect the official policy or position of FXStreet nor its advertisers. The author will not be held responsible for information that is found at the end of links posted on this page.
If not otherwise explicitly mentioned in the body of the article, at the time of writing, the author has no position in any stock mentioned in this article and no business relationship with any company mentioned. The author has not received compensation for writing this article, other than from FXStreet.
FXStreet and the author do not provide personalized recommendations. The author makes no representations as to the accuracy, completeness, or suitability of this information. FXStreet and the author will not be liable for any errors, omissions or any losses, injuries or damages arising from this information and its display or use. Errors and omissions excepted.
The author and FXStreet are not registered investment advisors and nothing in this article is intended to be investment advice.
South Africa Private Sector Credit registered at 2.46% above expectations (1.5%) in November
193042 December 31, 2021 14:02 FXStreet Market News
Information on these pages contains forward-looking statements that involve risks and uncertainties. Markets and instruments profiled on this page are for informational purposes only and should not in any way come across as a recommendation to buy or sell in these assets. You should do your own thorough research before making any investment decisions. FXStreet does not in any way guarantee that this information is free from mistakes, errors, or material misstatements. It also does not guarantee that this information is of a timely nature. Investing in Open Markets involves a great deal of risk, including the loss of all or a portion of your investment, as well as emotional distress. All risks, losses and costs associated with investing, including total loss of principal, are your responsibility. The views and opinions expressed in this article are those of the authors and do not necessarily reflect the official policy or position of FXStreet nor its advertisers. The author will not be held responsible for information that is found at the end of links posted on this page.
If not otherwise explicitly mentioned in the body of the article, at the time of writing, the author has no position in any stock mentioned in this article and no business relationship with any company mentioned. The author has not received compensation for writing this article, other than from FXStreet.
FXStreet and the author do not provide personalized recommendations. The author makes no representations as to the accuracy, completeness, or suitability of this information. FXStreet and the author will not be liable for any errors, omissions or any losses, injuries or damages arising from this information and its display or use. Errors and omissions excepted.
The author and FXStreet are not registered investment advisors and nothing in this article is intended to be investment advice.
USD/CAD refreshes three-week low under 1.2750 amid firmer oil, inactive markets
193041 December 31, 2021 13:56 FXStreet Market News
- USD/CAD takes offers to renew multi-day bottom, down for the third consecutive day.
- Oil prices benefit from cautious optimism concerning Omicron, geopolitical fears.
- Quebec set a curfew to slow down the virus increase, US reports record high covid cases.
- Lack of major data/events could offer a sluggish end to 2021 but bears are likely to turn hopeful.
USD/CAD remains on the back foot for the third consecutive day, taking offers around 1.2730 to refresh multi-day low during the early Friday morning in Europe.
The latest weakness in the USD/CAD prices could be linked to the consolidation in the market’s early Asian risk-off mood, as well as mildly bid oil prices. However, thin end-of-year liquidity conditions and an absence of major data/events could restrict the pair’s immediate moves.
WTI crude oil prices, Canada’s main export item, add 0.05% intraday while taking rounds to the five-week top flashed the previous day. Behind the oil’s moves could be the market’s hopes of fewer health emergencies due to the South African covid variant, namely Omicron, as well as fears of geopolitical tension in the Middle East.
Read: WTI justifies Thursday’s bearish Doji, ignores China PMI to ease around $76.00
It’s worth noting that the global policymakers, ex-Canada, seem to take Omicron a bit lightly as the majority of them have refrained from major lockdown majors around the year-end celebrations. However, Quebec is the odd one out to put a 10:00 pm to 5:00 am curfew in place. On the other hand, Reuters’ tally for the US seven-day average of new coronavirus cases refreshes record top for the second consecutive day with 290,000 latest figures.
Talking about the geopolitics, Iran’s space launch derails previous optimism concerning the denuclearization deal with the global leaders. On the same line were the dislikes of China and Hong Kong for the US push to release Hong Kong-based journalists. Also portraying the fears of the geopolitical tension were the headlines from Reuters over Ukraine, “US President Joe Biden and his Russian counterpart Vladimir Putin on Thursday warned each other that an escalation of tensions over Ukraine could rupture relations between the two countries, U.S. and Russian officials said.”
Amid these plays, the Wall Street benchmarks posted mild losses whereas the S&P 500 Futures pare intraday losses, recently down 0.20% on a day.
To sum up, USD/CAD bears are likely to keep reins amid firmer oil and currently improving market sentiment. However, the year-end liquidity crunch may restrict the pair’s moves for the day.
Technical analysis
While refreshing the multi-day low, the USD/CAD pair broke an ascending support line, now resistance, from November 10, which in turn joins descending Momentum line to favor sellers. That said, 38.2% Fibonacci retracement of October-December upside, around 1.2705, can restrict the quote’s immediate declines before directing USD/CAD sellers towards the 50-DMA level of 1.2655.
Alternatively, recovery moves remain elusive below a confluence of the previous support line and 21-DMA, near 1.2800.
Full Article
FX option expiries for December 31 NY cut
193040 December 31, 2021 13:56 FXStreet Market News
FX option expiries for December 31 NY cut at 10:00 Eastern Time, via DTCC, can be found below.
– EUR/USD: EUR amounts
- 1.1200 221m
- 1.1400 335m
- 1.1505 840m
– GBP/USD: GBP amounts
- 1.3275 271m
– USD/CHF: USD amounts
- 0.9400 400m
– USD/CAD: USD amounts
- 1.2900 242m
Netherlands, The Retail Sales (YoY) climbed from previous 4.3% to 15.9% in November
193039 December 31, 2021 13:40 FXStreet Market News
Information on these pages contains forward-looking statements that involve risks and uncertainties. Markets and instruments profiled on this page are for informational purposes only and should not in any way come across as a recommendation to buy or sell in these assets. You should do your own thorough research before making any investment decisions. FXStreet does not in any way guarantee that this information is free from mistakes, errors, or material misstatements. It also does not guarantee that this information is of a timely nature. Investing in Open Markets involves a great deal of risk, including the loss of all or a portion of your investment, as well as emotional distress. All risks, losses and costs associated with investing, including total loss of principal, are your responsibility. The views and opinions expressed in this article are those of the authors and do not necessarily reflect the official policy or position of FXStreet nor its advertisers. The author will not be held responsible for information that is found at the end of links posted on this page.
If not otherwise explicitly mentioned in the body of the article, at the time of writing, the author has no position in any stock mentioned in this article and no business relationship with any company mentioned. The author has not received compensation for writing this article, other than from FXStreet.
FXStreet and the author do not provide personalized recommendations. The author makes no representations as to the accuracy, completeness, or suitability of this information. FXStreet and the author will not be liable for any errors, omissions or any losses, injuries or damages arising from this information and its display or use. Errors and omissions excepted.
The author and FXStreet are not registered investment advisors and nothing in this article is intended to be investment advice.

Friday 31st December 2021 : Technical Outlook and Review
193027 December 31, 2021 13:29 ICMarkets Market News
DXY:
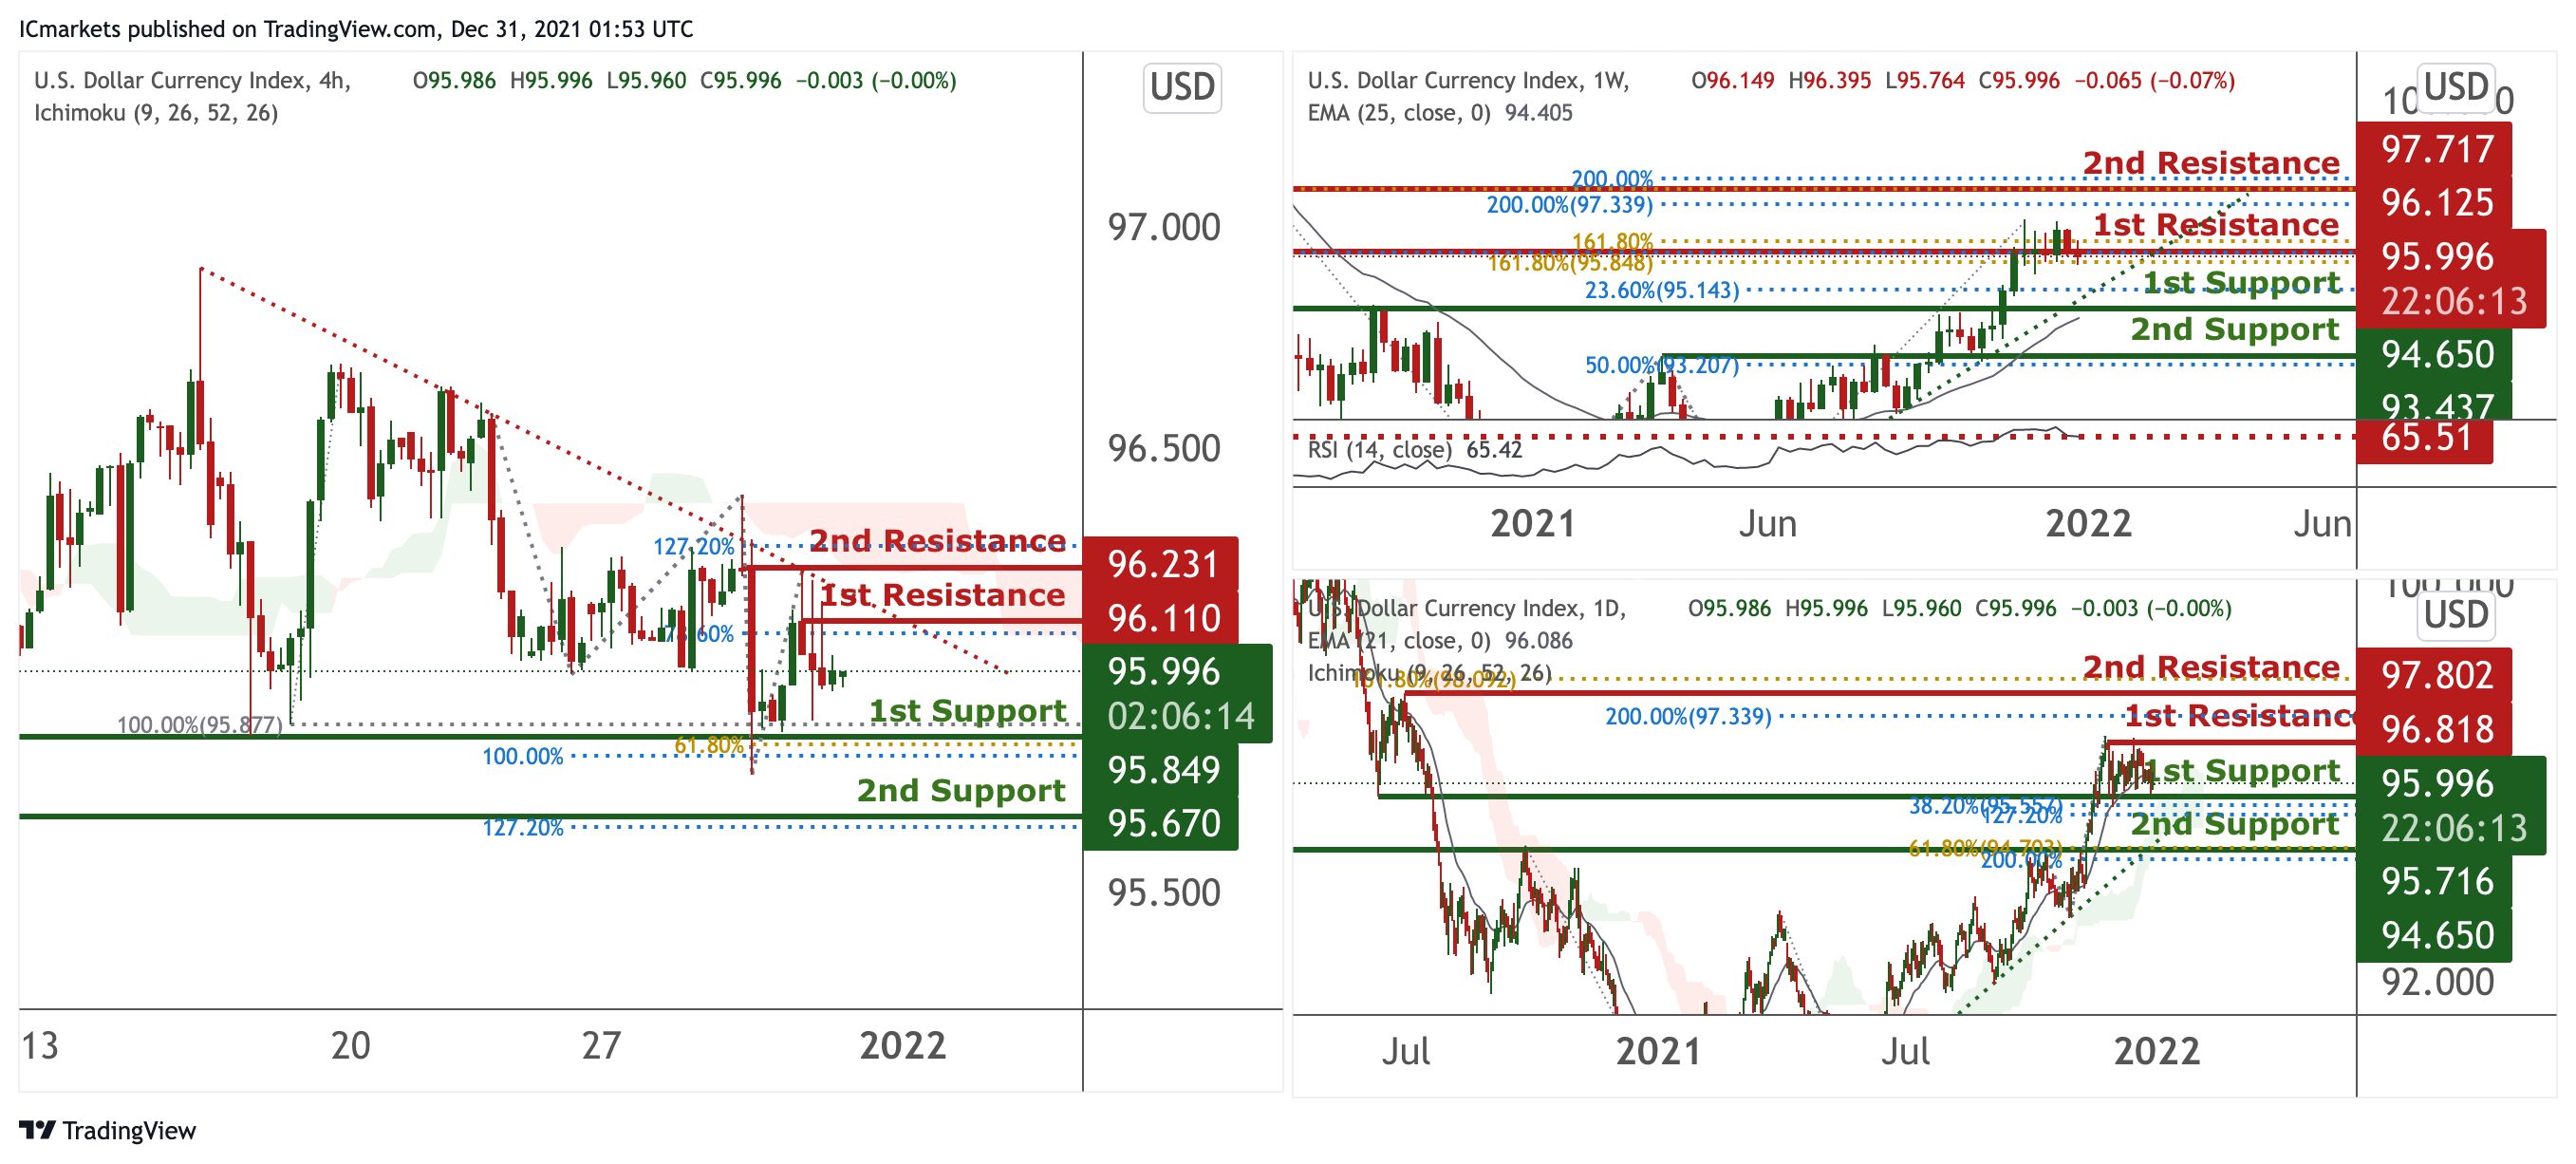
On the weekly, prices are on bullish momentum and abiding to our ascending trendline. We see potential for prices to dip from our 1st resistance at 96.125 in line with 161.8% Fibonacci extension and 161.8% Fibonacci retracement towards our 1st support at 94.650 in line with 23.6% Fibonacci retracement. RSI is at a level where dips previously occurred.
On the daily, prices are on a bullish momentum and abiding to a bullish trendline. We see potential for prices to bounce from our 1st support at 95.716 in line with 38.2% Fibonacci retracement and 127.2% Fibonacci extension towards our 1st resistance at 96.818 in line with 200% Fibonacci projection. Our EMA 21 and ichimoku clouds are showing bullish momentum.
On the H4 timeframe, prices are on bearish momentum and abiding to our bearish trendline. We would expect a dip from our 1st resistance at 96.110 in line with 78.6% Fibonacci retracement towards our 1st support at 95.849 which is an area of Fibonacci confluences. Ichimoku clouds are further supporting our bearish bias.
Areas of consideration:
- H4 time frame, 1st resistance at 96.110
- H4 time frame, 1st support at 95.849
XAU/USD (GOLD):
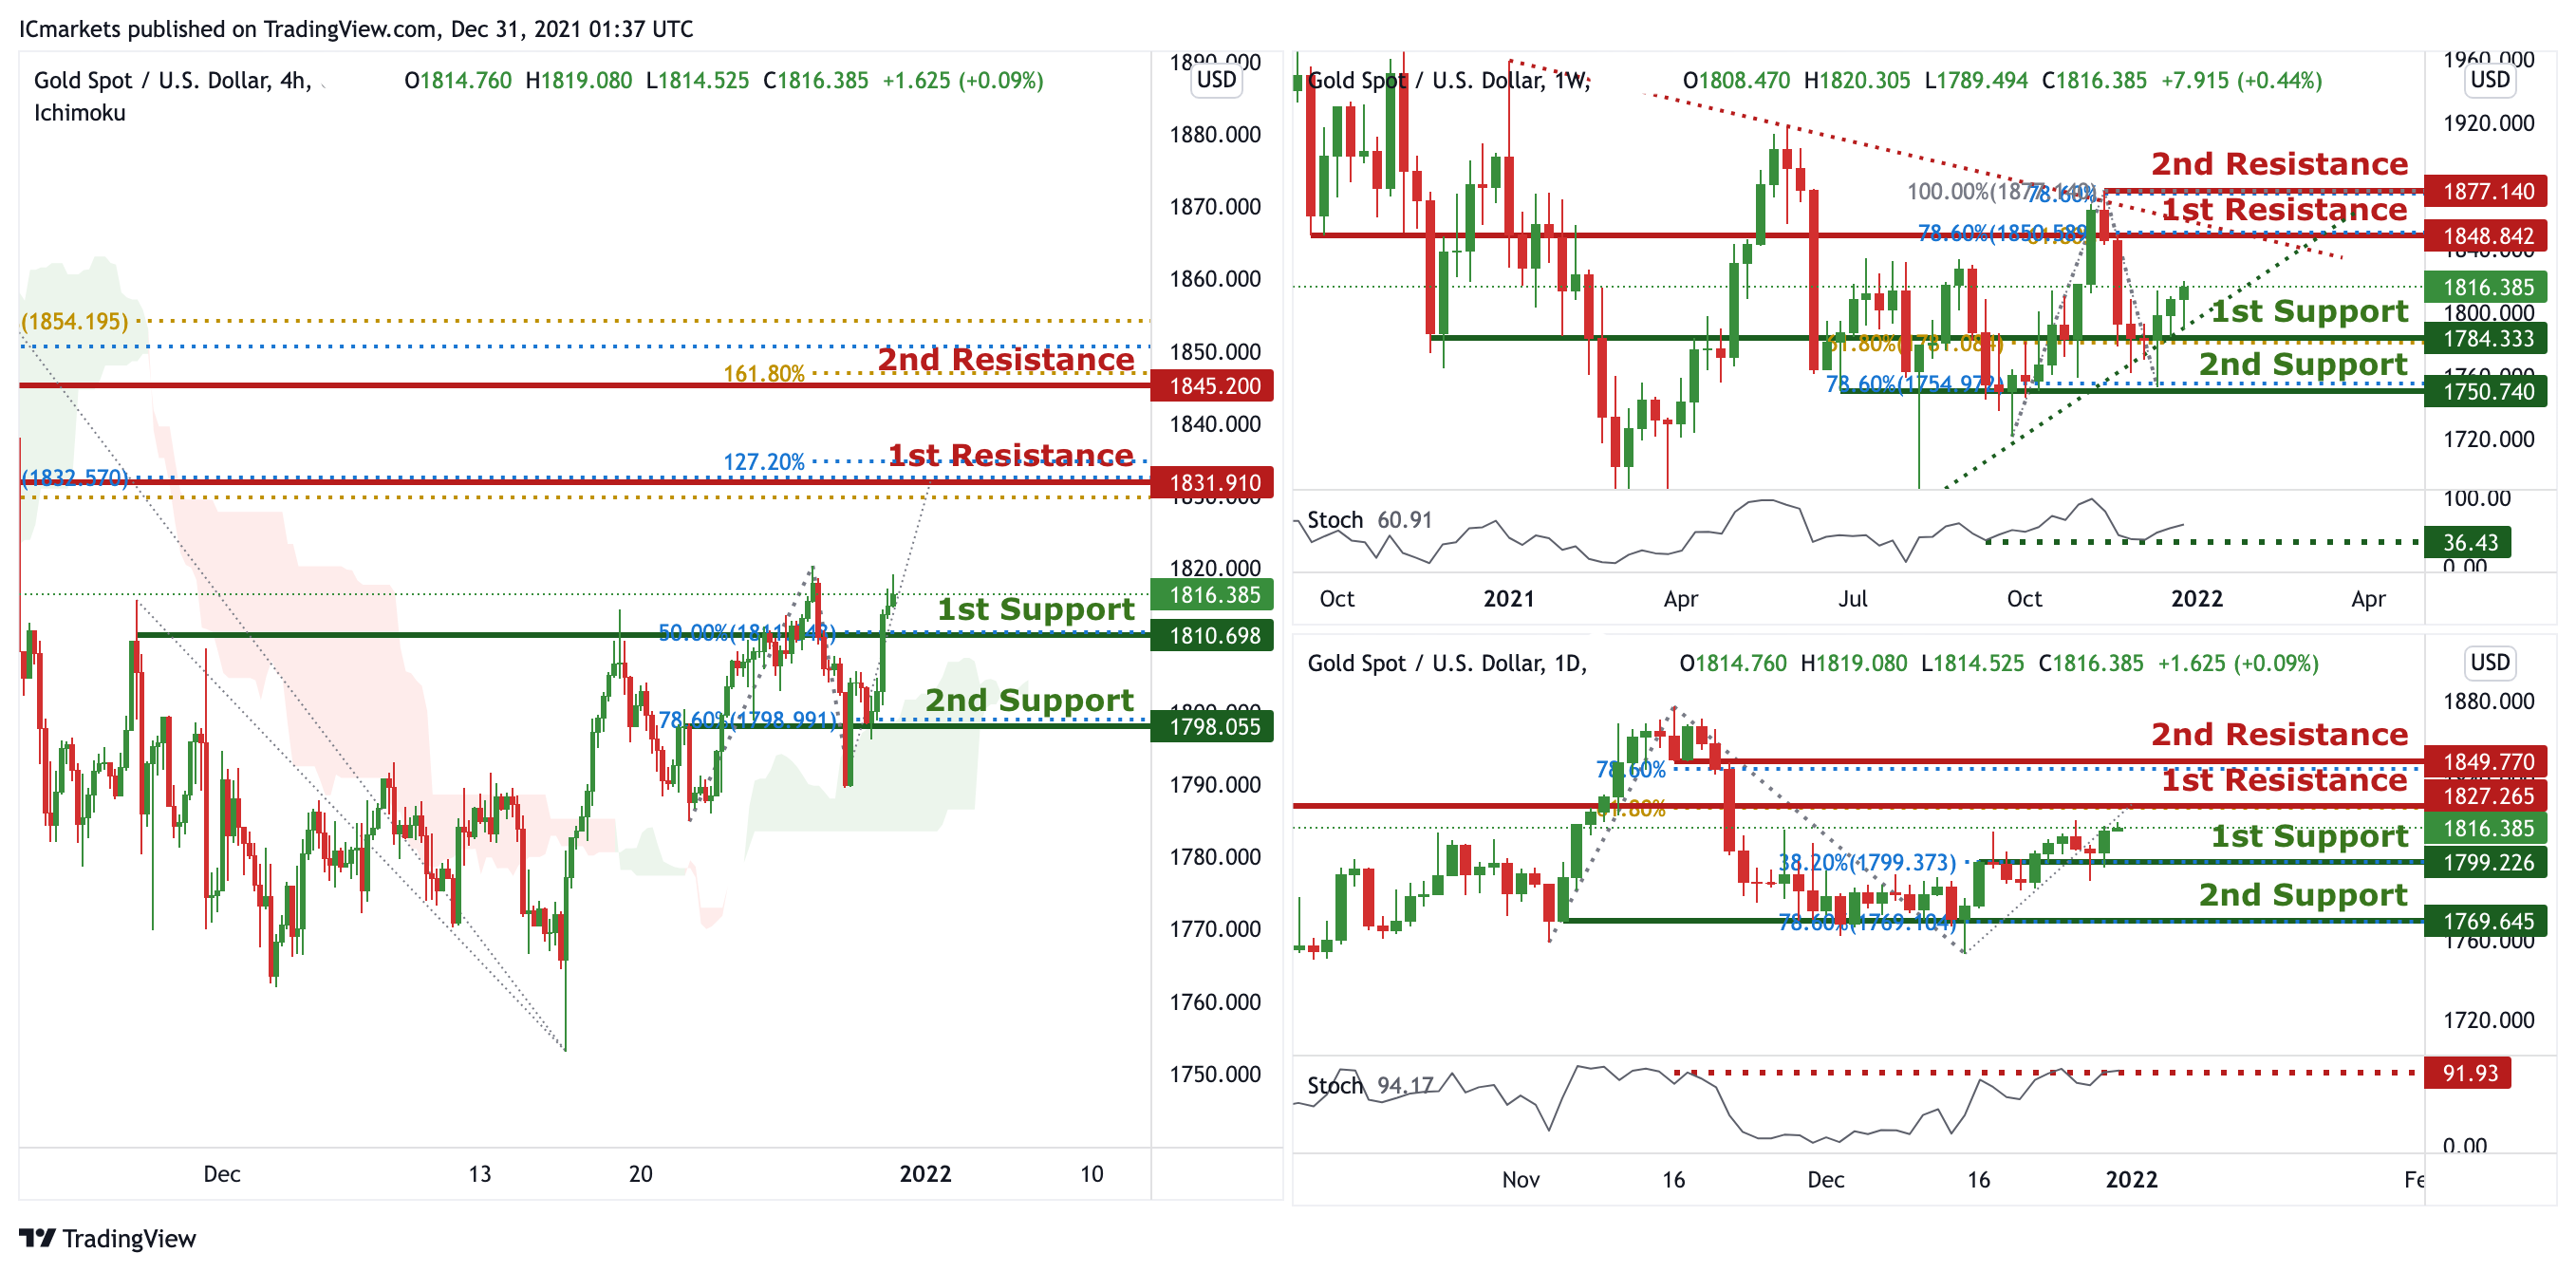
On the weekly, prices are consolidating is a triangle pattern and have the potential to climb further from our 1st support at 1784.333 in line with 61.8% Fibonacci retracement and 61.8% Fibonacci extension towards our 1st resistance at 1848.842 in line with 61.8% Fibonacci extension and 78.6% Fibonacci extension. Stochastics are at levels where bounces previously occurred.
On the daily, prices are on bullish momentum. We see potential for a pullback from our 1st resistance at 1827.265 in line with 61.8% Fibonacci retracement towards our 1st support at 1799.226 in line with 38.2% Fibonacci retracement. Stochastics are at a level were dips previously occurred
On the H4 chart, prices are on bullish momentum.. We see potential for prices to climb further from our 1st support at 1810.698 in line with 50% Fibonacci retracement towards our 1st resistance at 1831.910 which is an area of Fibonacci confluences. Ichimoku clouds are further supporting our bullish bias.
Areas of consideration:
- H4 1st support at 1810.698
- H4 1st resistance at 1831.910
GBP/USD
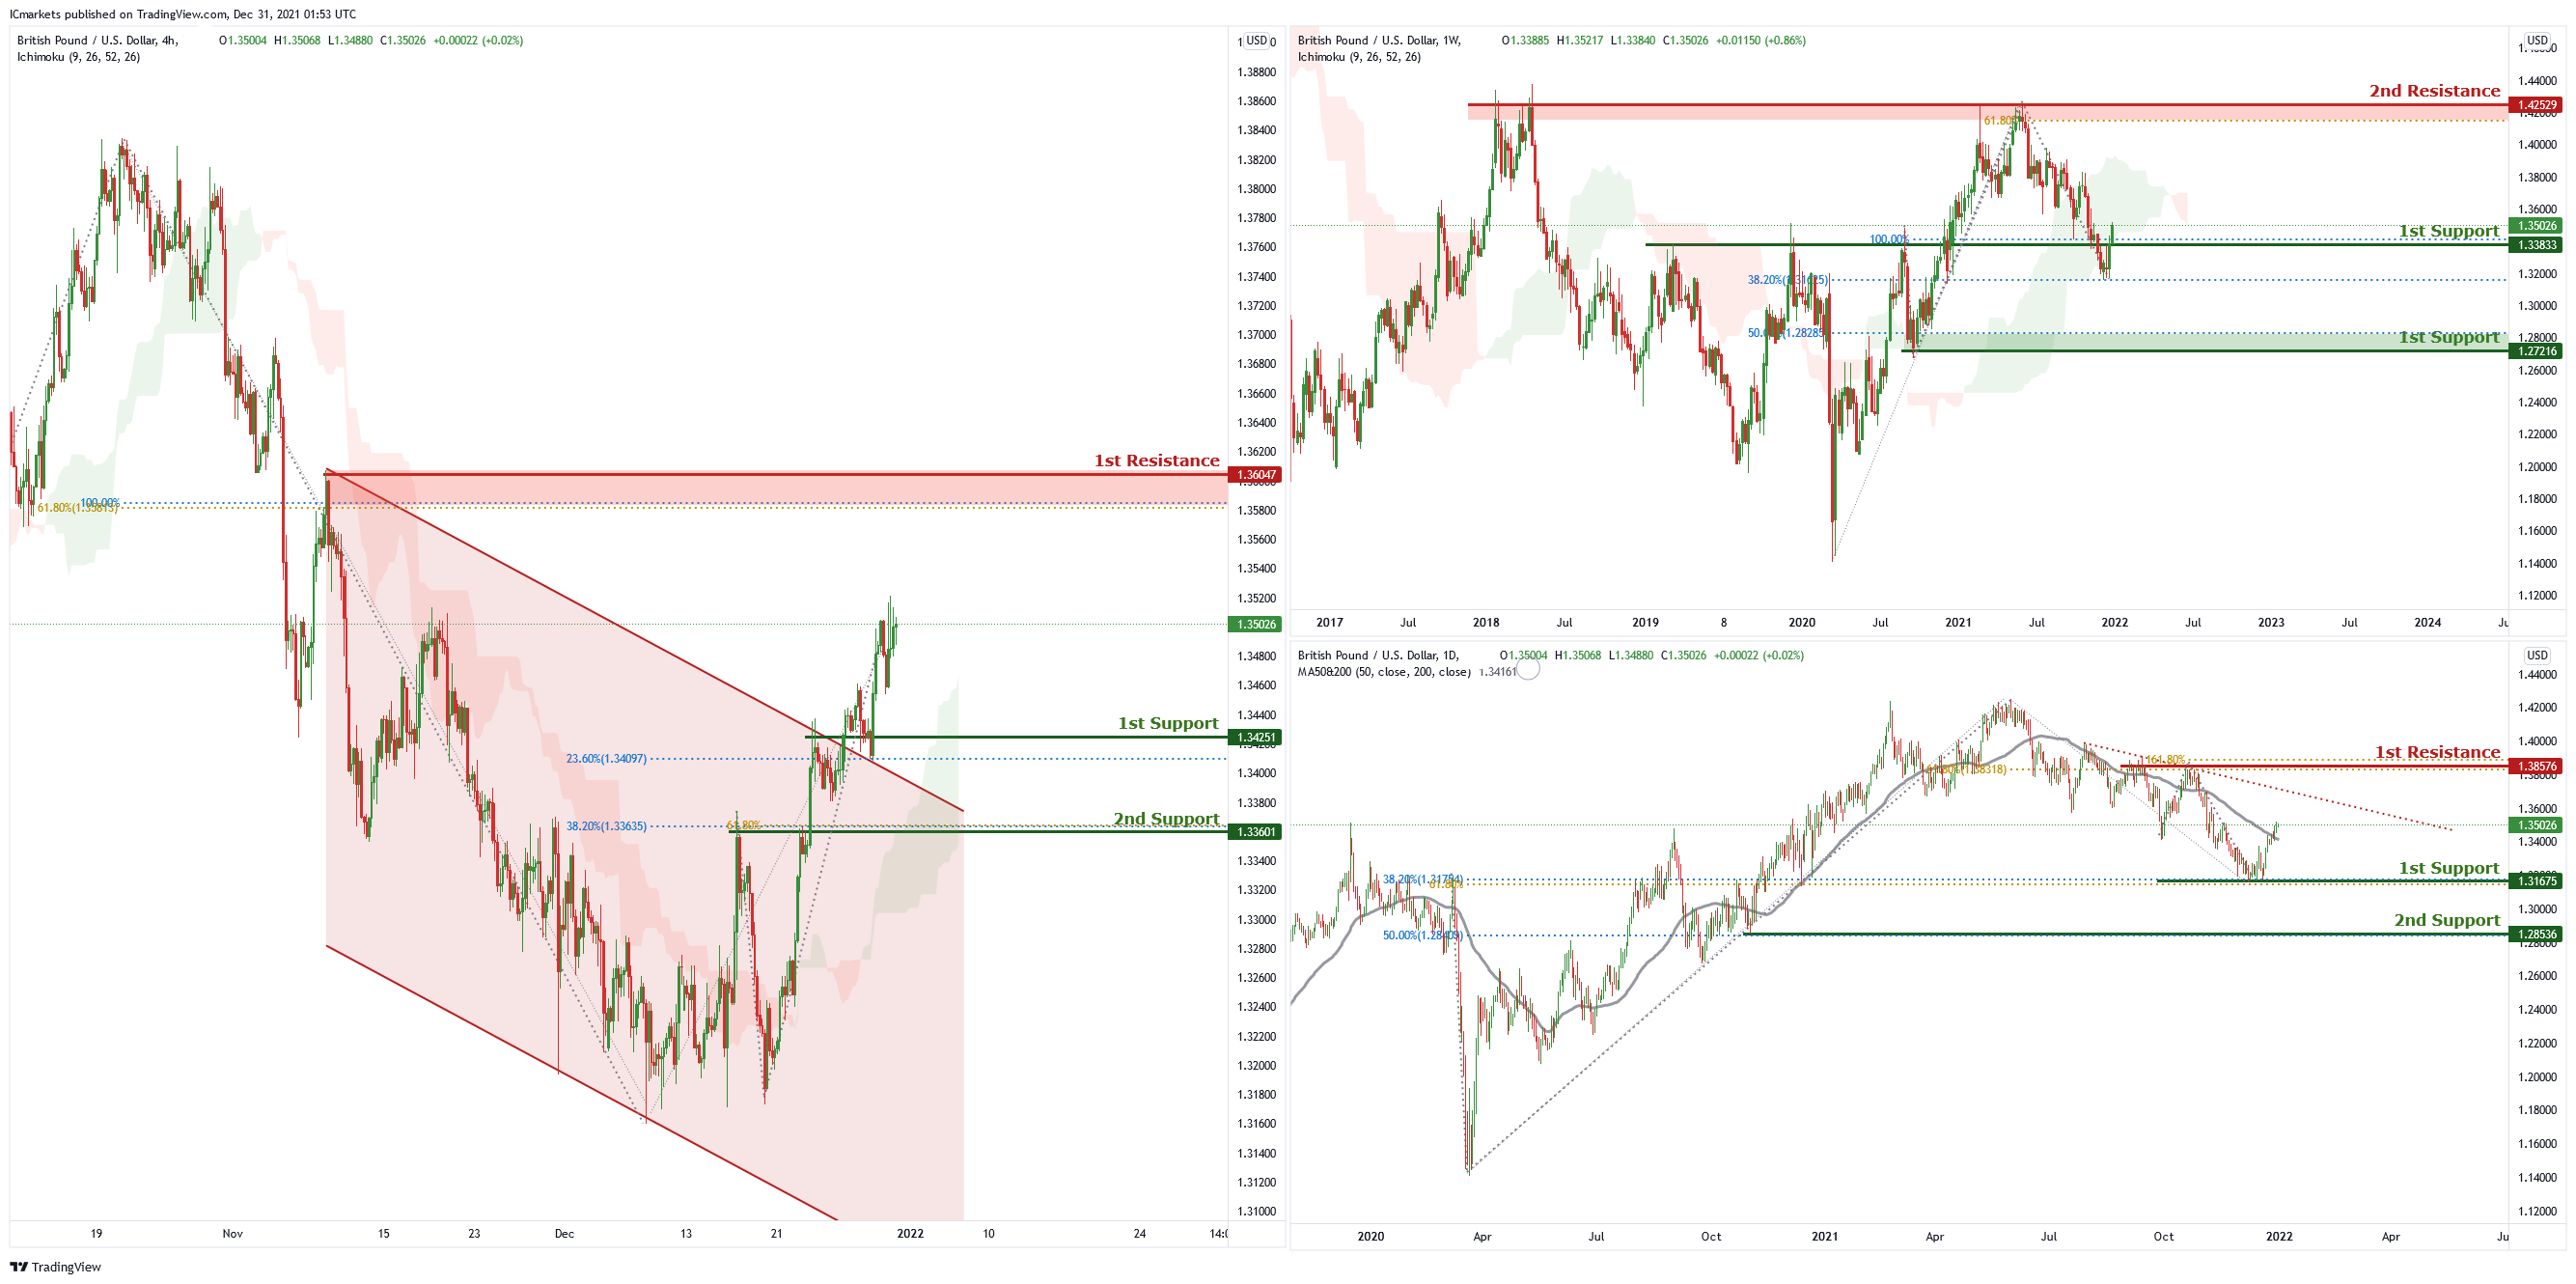
On the weekly chart price is near 1st resistance level of 1.33833 which is also 38.2% Fibonacci retracement and 100% Fibonacci projection. Price can potentially go to the 2nd resistance of 1.42529 which is the graphical swing high resistance and 61.8% Fibonacci projection. Our bullish bias is supported by the ichimoku cloud indicator.
On the daily chart price is abiding by the descending trendline and is near 1st support level of 1.31675 which is also 38.2% Fibonacci retracement and 61.8% Fibonacci projection. Price can potentially go to the 1st resistance level of 1.38756 which is 61.8% Fibonacci retracement. Our bullish bias is supported by the stochastic indicator as it is near support level.
On the H4 chart, price has recently broken out of the descending channel and near 1st support level of 1.34251 which is also 23.6% Fibonacci retracement. Price can potentially go to the 1st resistance of 1.36047 which is 100% Fibonacci projection and 61.8% Fibonacci retracement. Our bullish bias is supported by the ichimoku cloud indicator as price is trading above it.
Areas of consideration :
- H4 1st support 1.34251
- H4 1st resistance 1.36047
USD/CHF
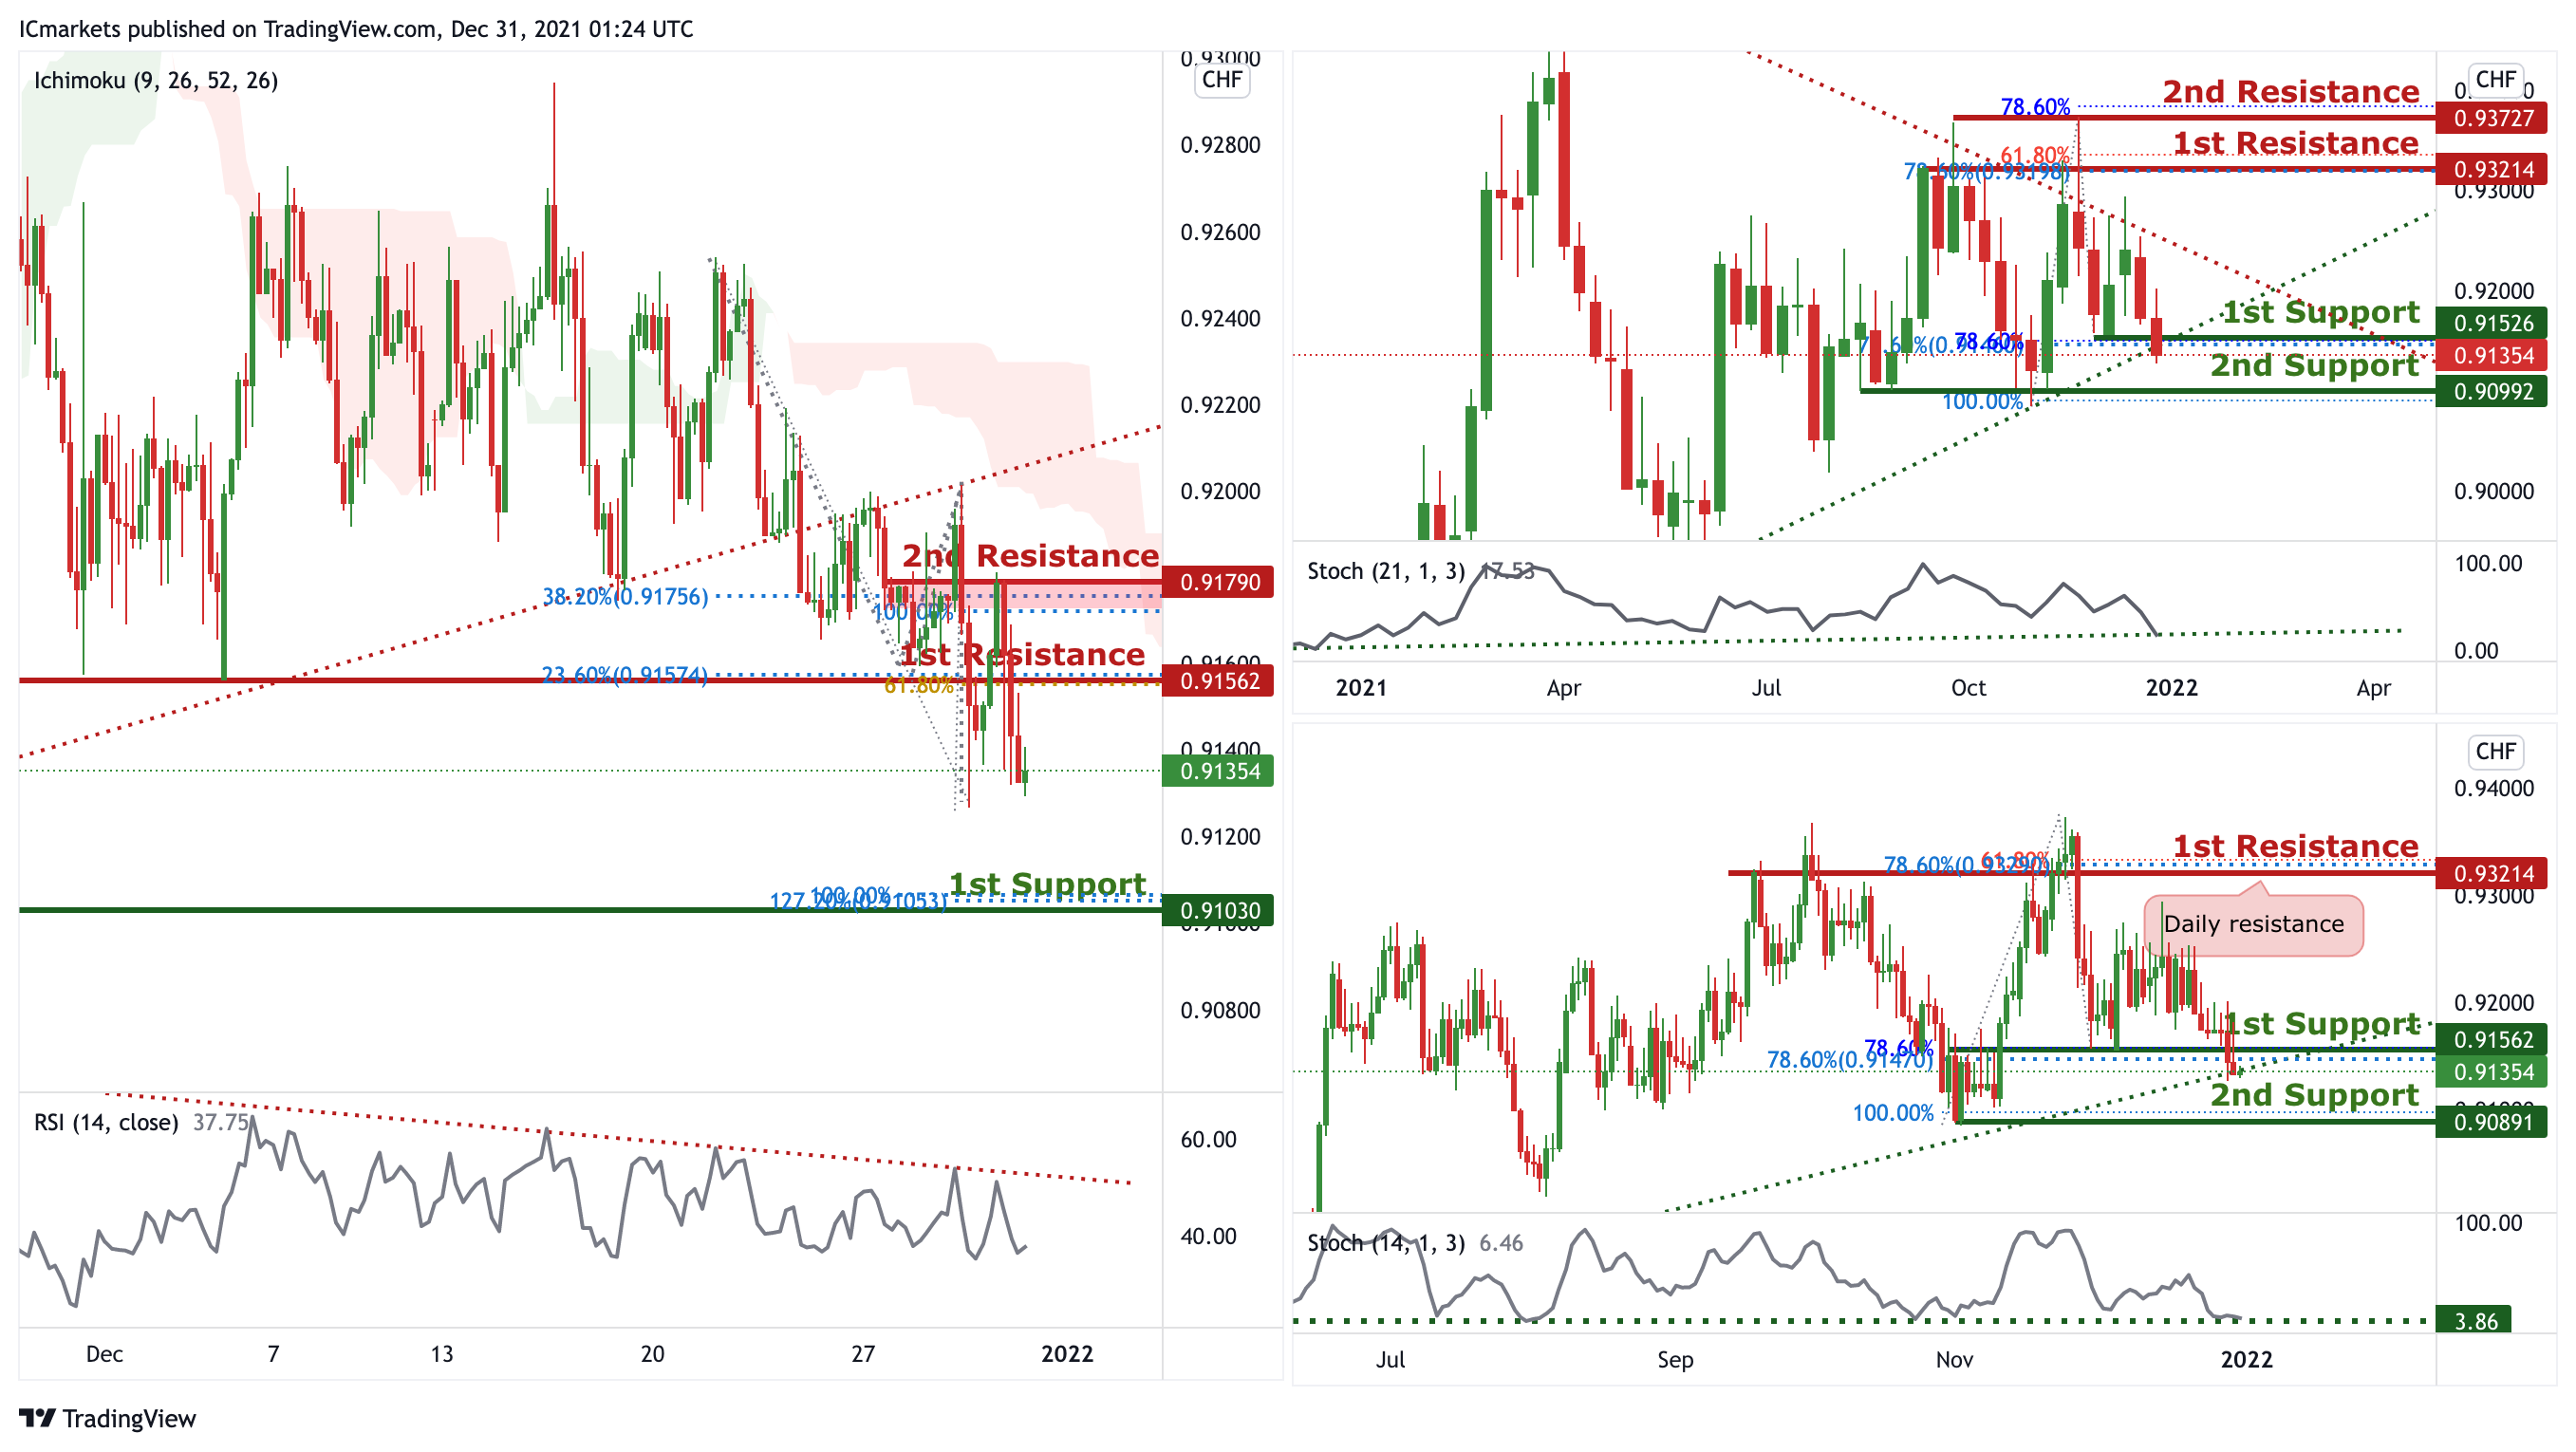
On the Weekly timeframe, price is reacting in a triangle pattern. Traders should wait for the price to swing higher or lower before entering. On the Daily timeframe, we can expect an overall bullish momentum. Price could bounce from 1st Support in line with 78.6% Fibonacci retracement and 78.6% FIbonacci projection towards 1st Resistance in line with 78.6% Fibonacci retracement and 61.8% Fibonacci projection. Our bullish bias is further supported by the stochastics indicator where the %D line is at the support level.
On the H4 timeframe, price broke out of the ascending trendline support, signifying potential bearish momentum. We can expect price to drop from 1st Resistance in line with 23.6% Fibonacci retracement and 61.8% Fibonacci projection towards 1st Support in line with 127.2% Fibonacci extension and 100% Fibonacci projection. Our bearish bias is further supported by price holding below the Ichimoku cloud and RSI is abiding to the descending trendline resistance.
Areas of consideration:
- Watch 1st Support at 0.91030
- Watch 1st Resistance at 0.91562
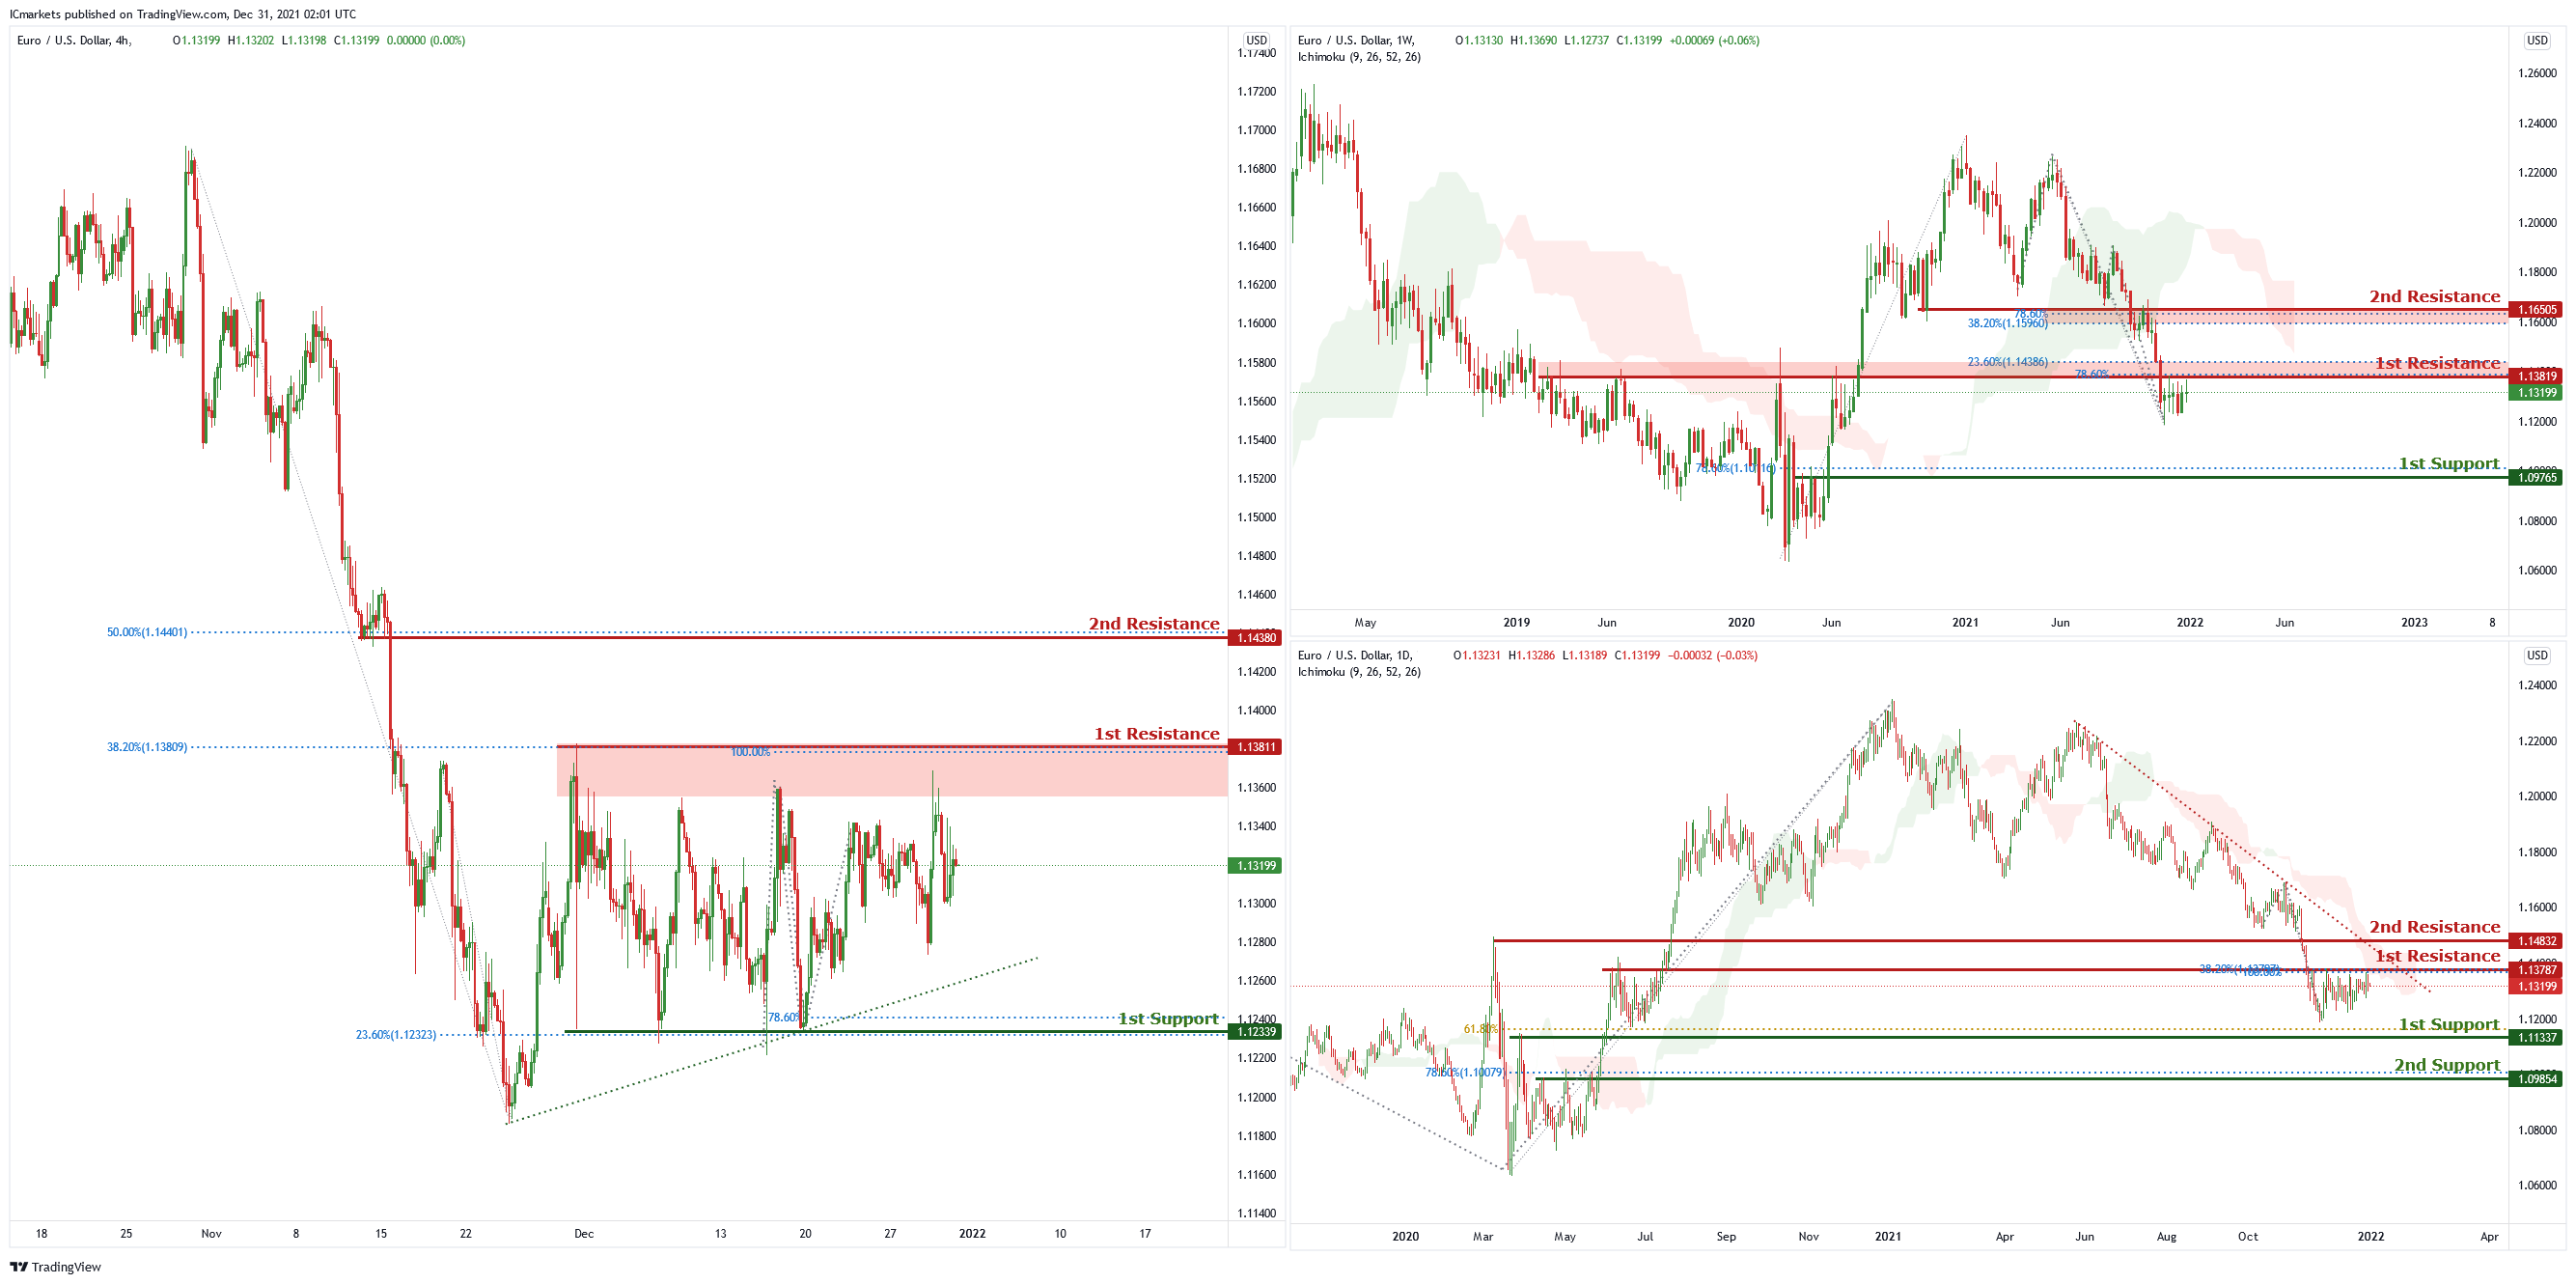
EUR/USD :
On the weekly chart price is near 1st resistance level of 23.6% Fibonacci retracement and 78.6% Fibonacci projection. Price can potentially dip to the 1st support level of 1.09765 which is also 78.6% Fibonacci retracement. Our bearish bias is supported by the ichimoku cloud indicator as price is trading below it.
On the daily chart, price is abiding by the descending trendline and is near the 1st resistance level of 1.13787 which is also 38.2% Fibonacci retracement and 100% Fibonacci projection. Price can potentially dip to the 1st support level of 1.1137 which is also 61.8% Fibonacci retracement. Our bearish bias is supported by the ichimoku cloud indicator as price is trading below it.
On the H4 chart, price is near the first resistance level of 1.13740 which is the 78.6% Fibonacci projection and 38.2% Fibonacci retracement. Price can potentially dip to the 1st support level of 1.12339 which is 100% Fibonacci projection and 78.6% Fibonacci retracement. Our bearish bias is supported by technical indicators
Areas of consideration :
- H4 1st resistance 1.13740
- H4 1st support 1.12339
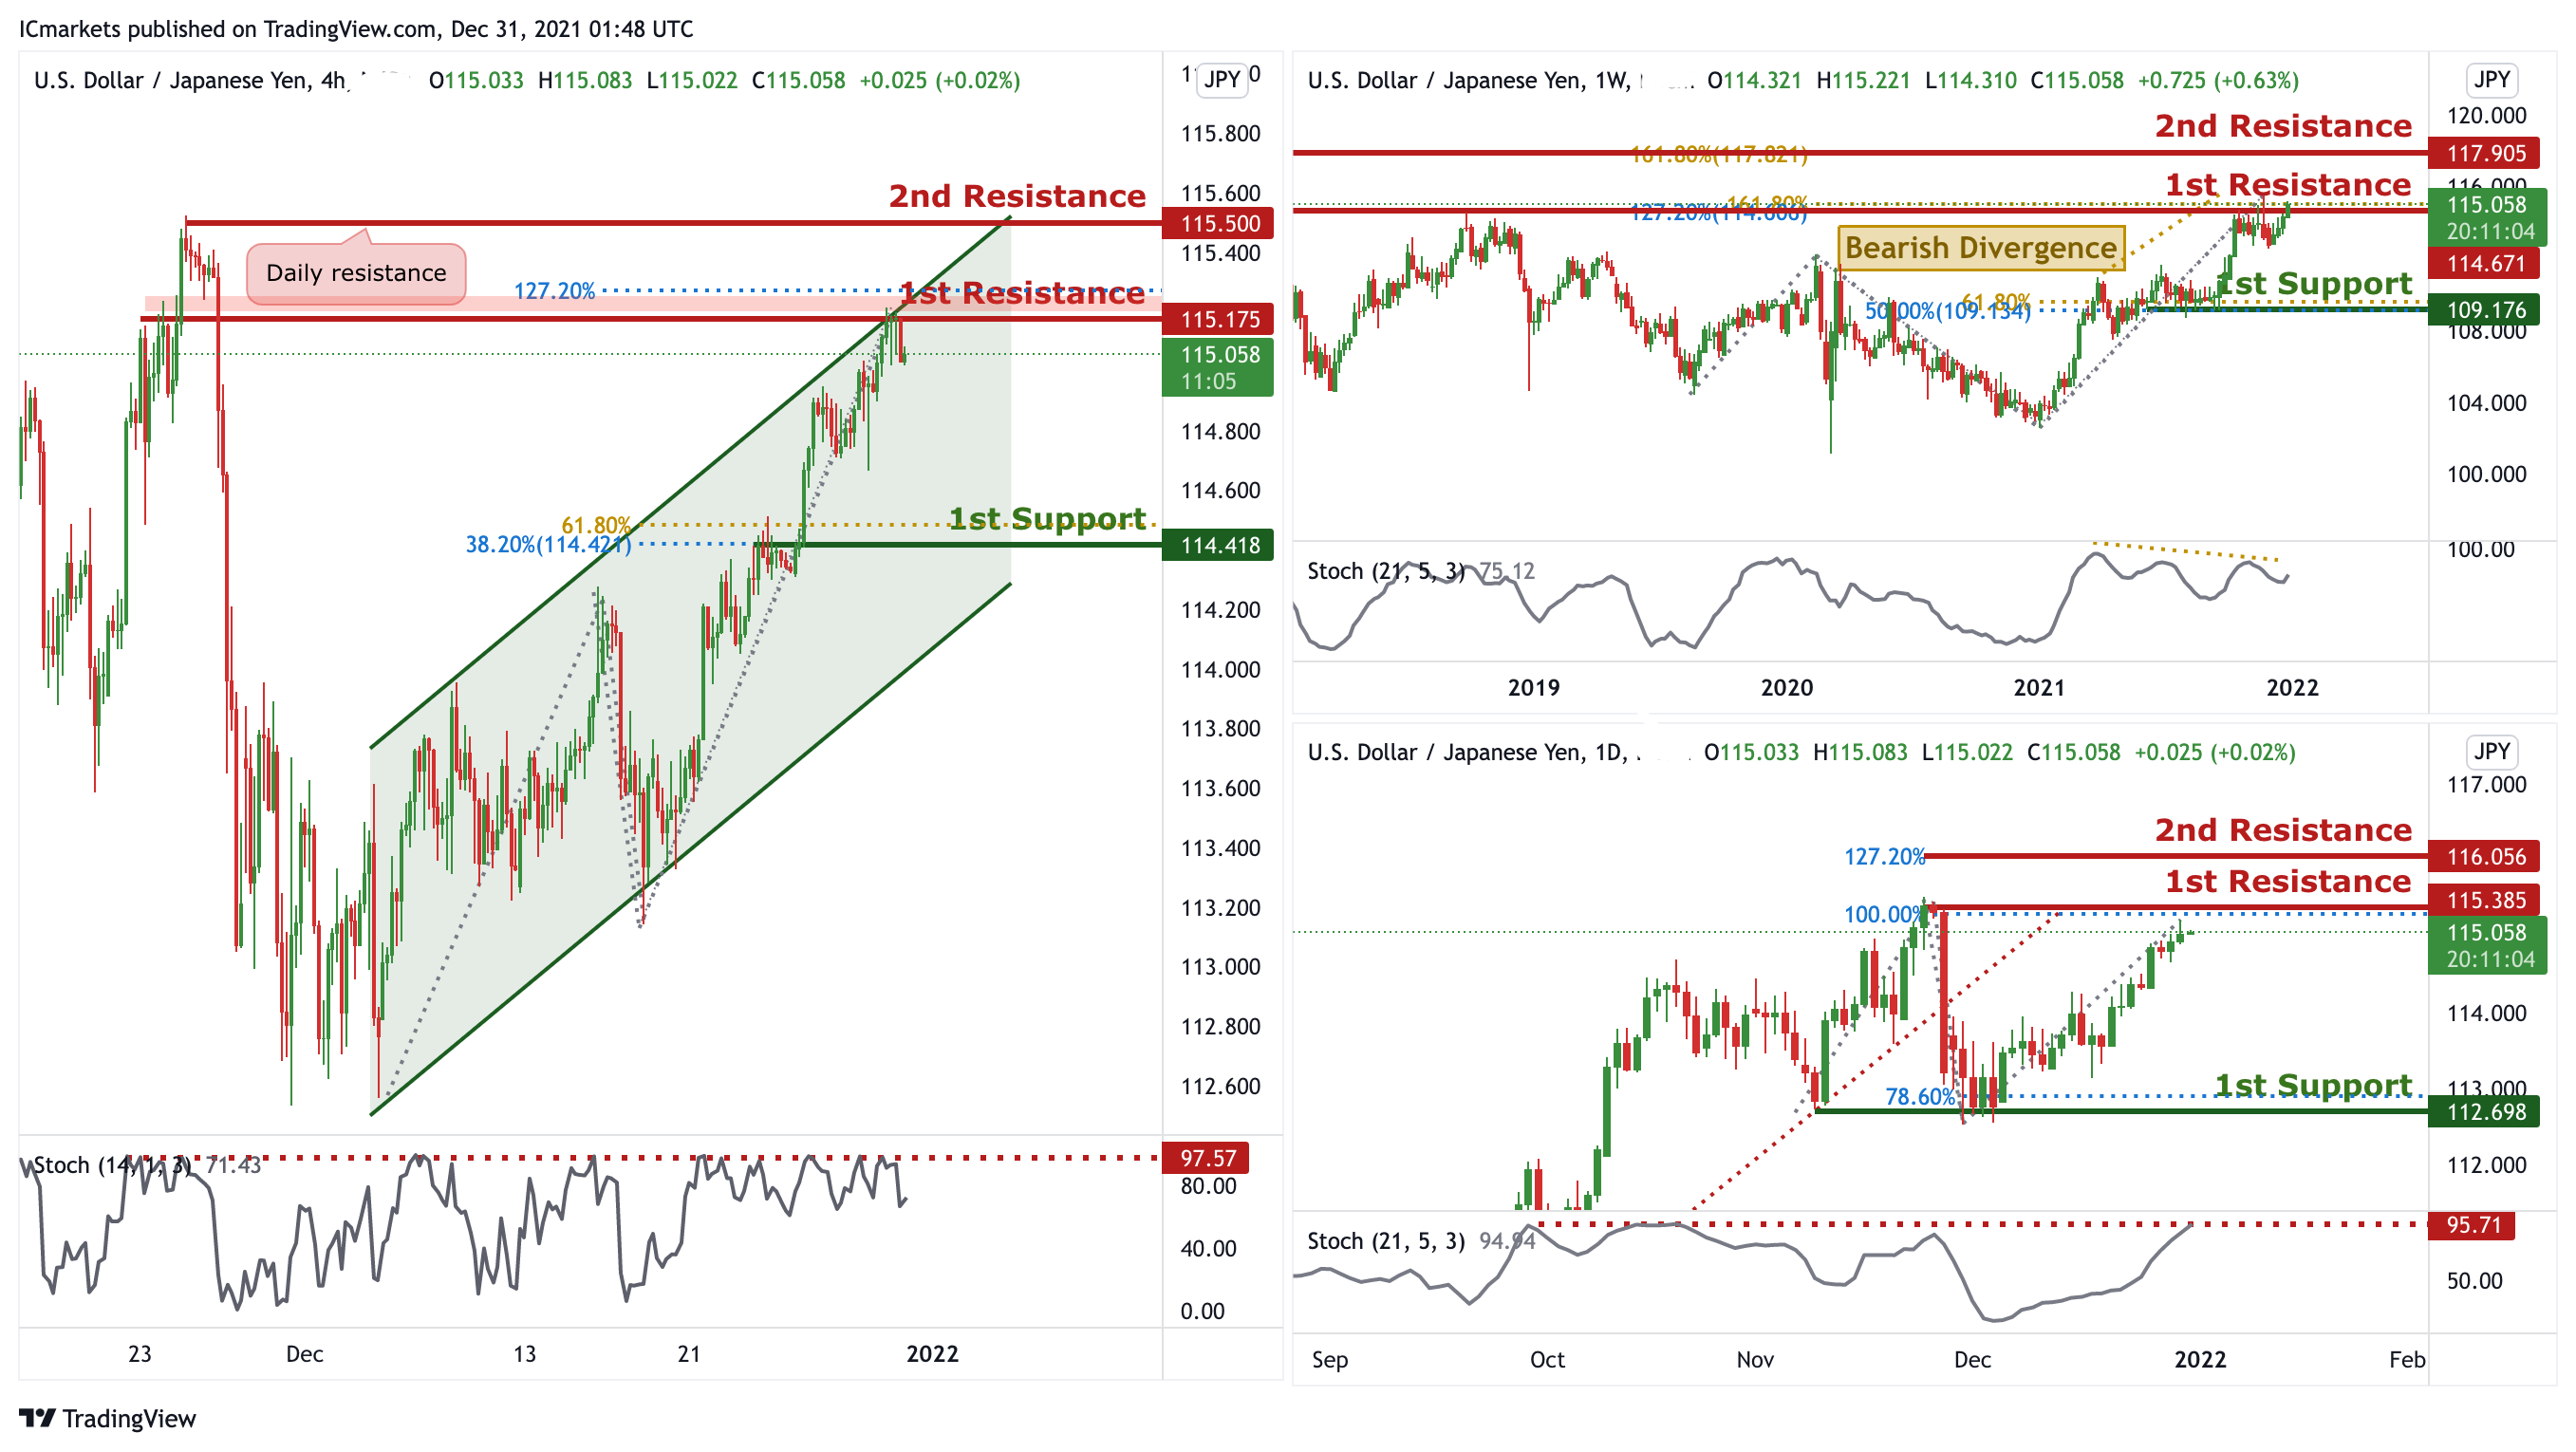
USD/JPY
On the Weekly timeframe, we can see that price touched the 1st resistance in line with horizontal swing highs and 127.2% FIbonacci Retracement and 161.8% Fibonacci Projection. We can expect the price to drop from the 1st Resistance towards the 1st Support in line with 61.8% Fibonacci projection and 50% Fibonacci retracement. Our short-term bearish momentum is further supported by the stochastic %K line holding below the descending trendline resistance and bearish divergence spotted. On the Daily timeframe, we can expect price to drop from 1st Resistance in line with 100% Fibonacci projection and previous swing high towards 1st Support in line with 78.6% Fibonacci projection .Our bearish bias is further supported by the stochastic indicator where %K line is at the resistance level.
On the H4 timeframe, price is abiding to the ascending channel, showing an overall bullish momentum. However, we can expect a short term bearish momentum and drop from 1st resistance in line with graphical overlap resistance and 127.2% Fibonacci projection towards 1st Support in line with graphical overlap support, 61.8% Fibonacci projection and 38.2% Fibonacci retracement. Our bearish bias is further supported by stochastic where the %K line dropped from the resistance.
Areas of consideration:
- H4 1st resistance level 115.175
- H4 1st support level 114.418
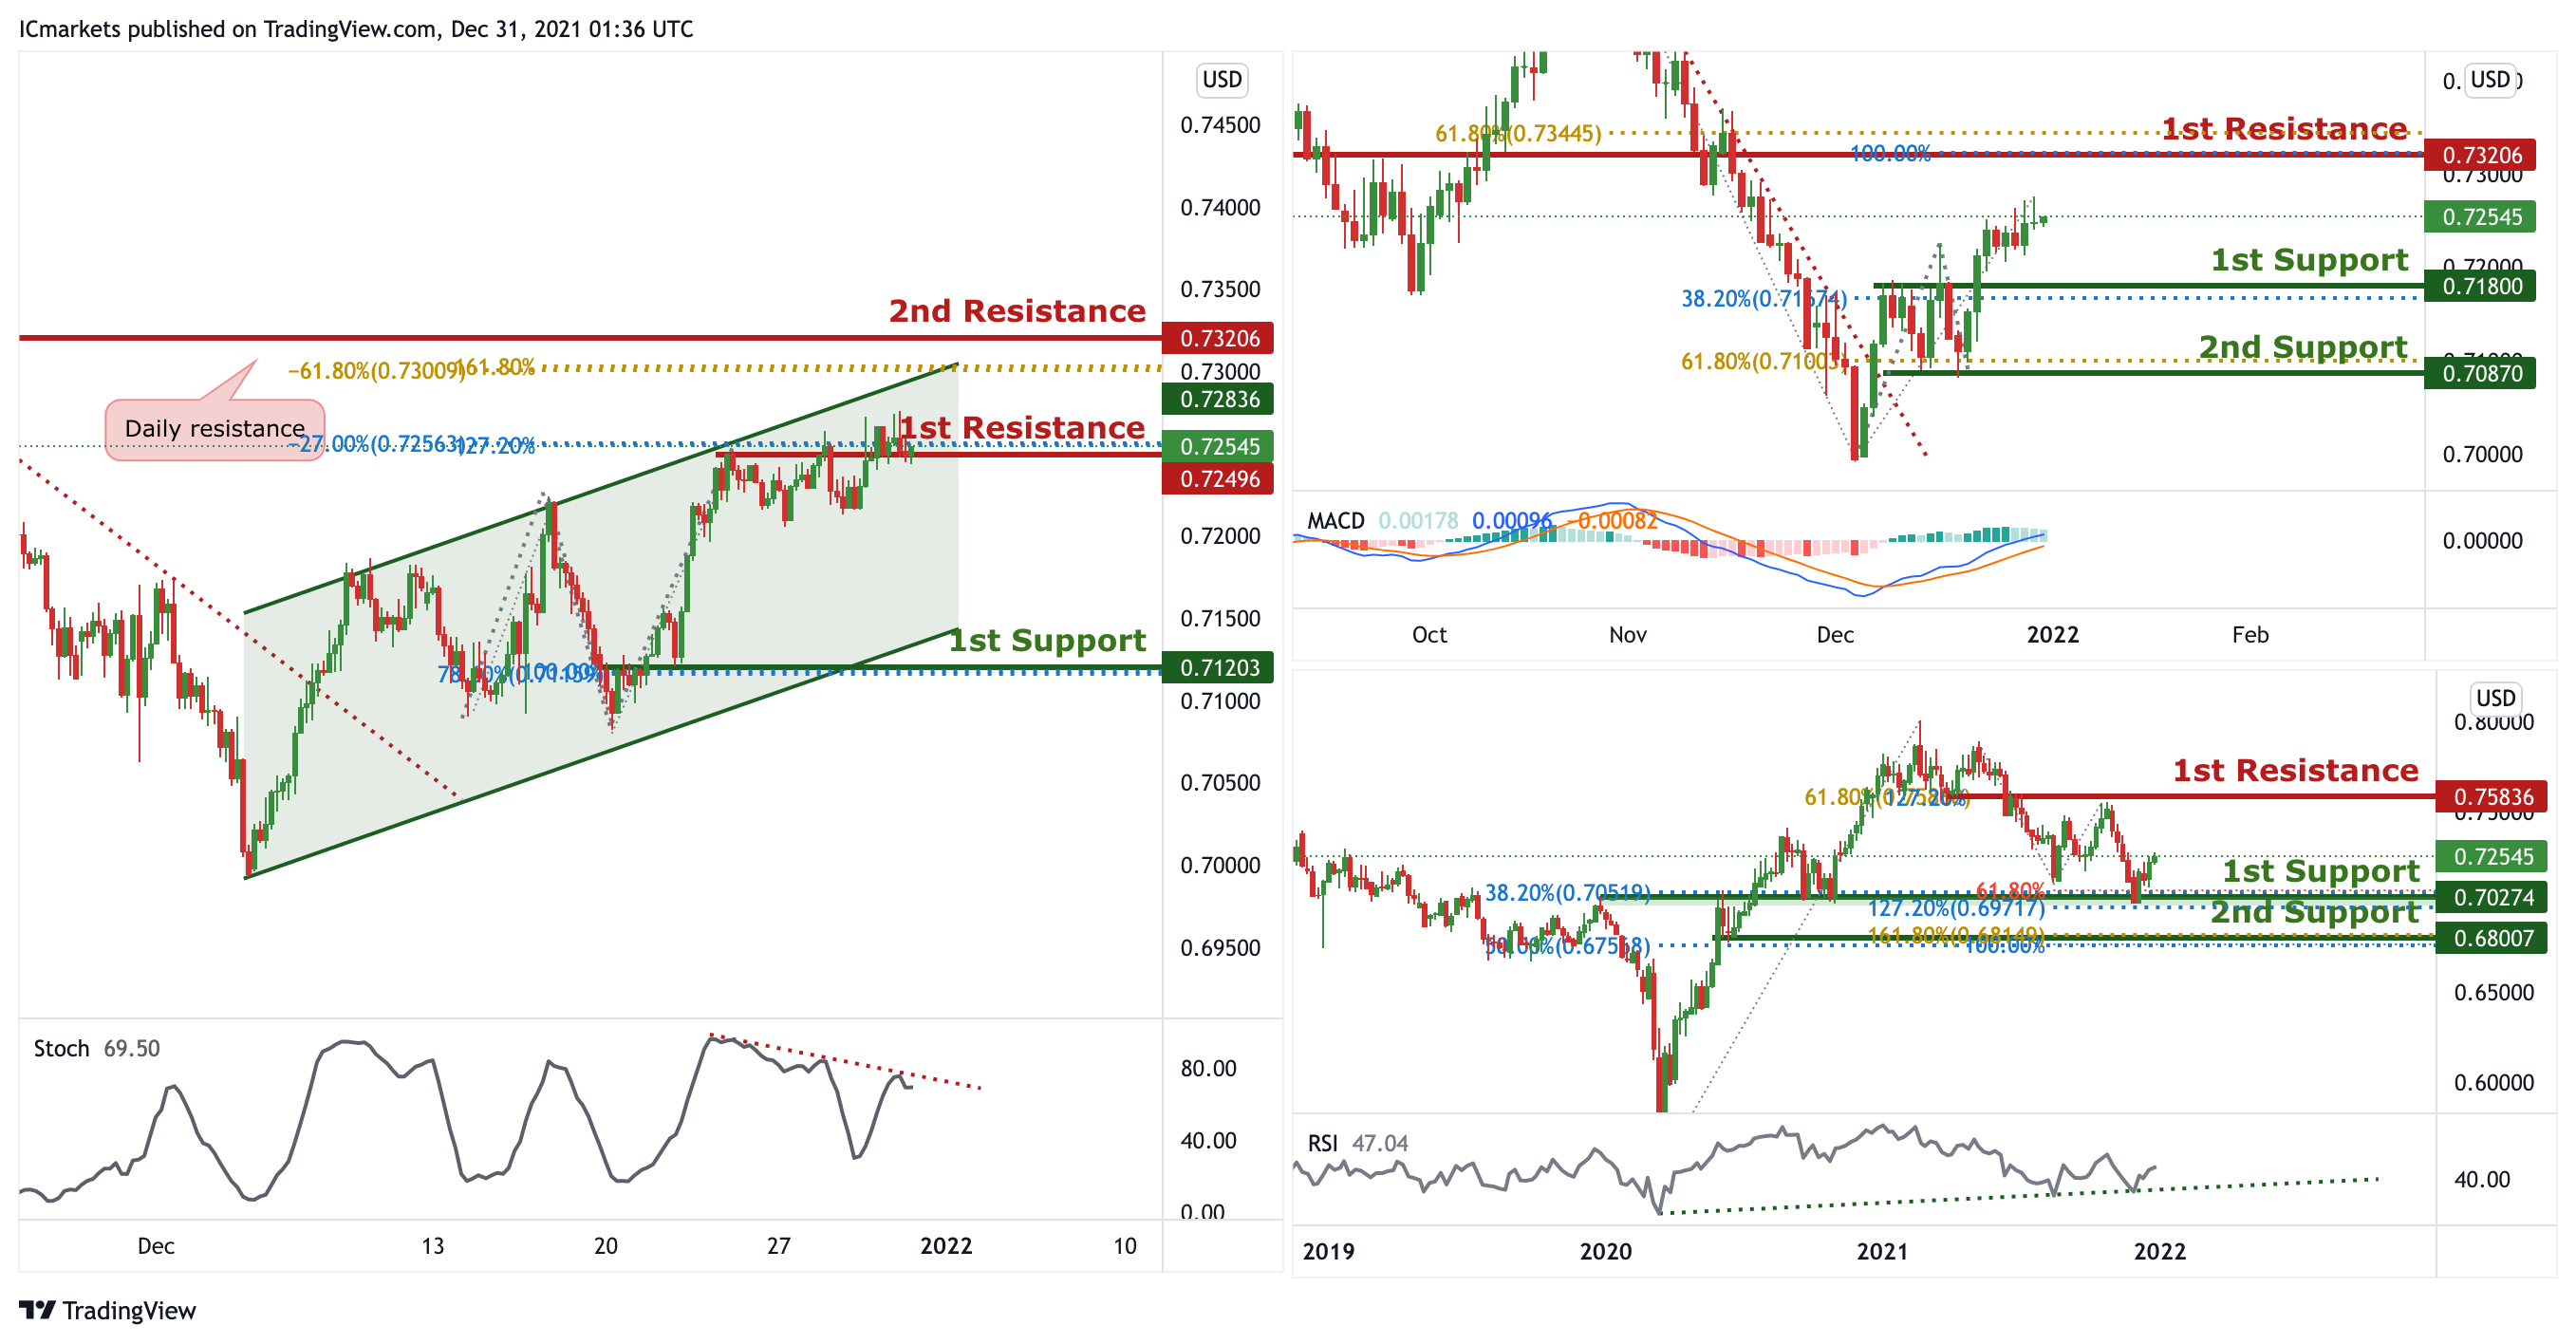
AUD/USD:
In reference to last week’s analysis, price has bounced nicely on the 1st Support. On the weekly, we can now expect the price to continue to push higher from the 1st Support in line with 61.8% Fibonacci projection, 38.2 % FIbonacci retracement and 127.2% Fibonacci extensions. Our bullish bias is further supported by the RSI indicator abiding to an ascending trendline. Traders should wait for price to swing higher or lower before entering again. In reference to last week’s analysis price indeed bounced nicely on the 1st Support on the daily timeframe. On the Daily, the price is at the 1st support, we can expect the price to continue to push higher from 1st Support in line with 38.2% Fibonacci retracement towards 1st Resistance in line with 100% Fibonacci projection and 61.8% Fibonacci retracement. Our bullish bias is further supported by the MACD indicator where the MACD line is above the signal line.
On the H4, price is reacting in an ascending channel, signifying bullish momentum. However, price is currently at a resistance, we can expect price to drop from 1st Resistance in line with 127.2% Fibonacci projection and -27.2% Fibonacci Extension towards 1st Support in line with 100% Fibonacci projection and 78.6% Fibonacci retracement. Our short-term bearish bias is further supported by the stochastic indicator where the %K line is at the resistance level.
Areas of consideration:
- H4 1st Support level 0.71203
- H4 1st resistance level 0.72496
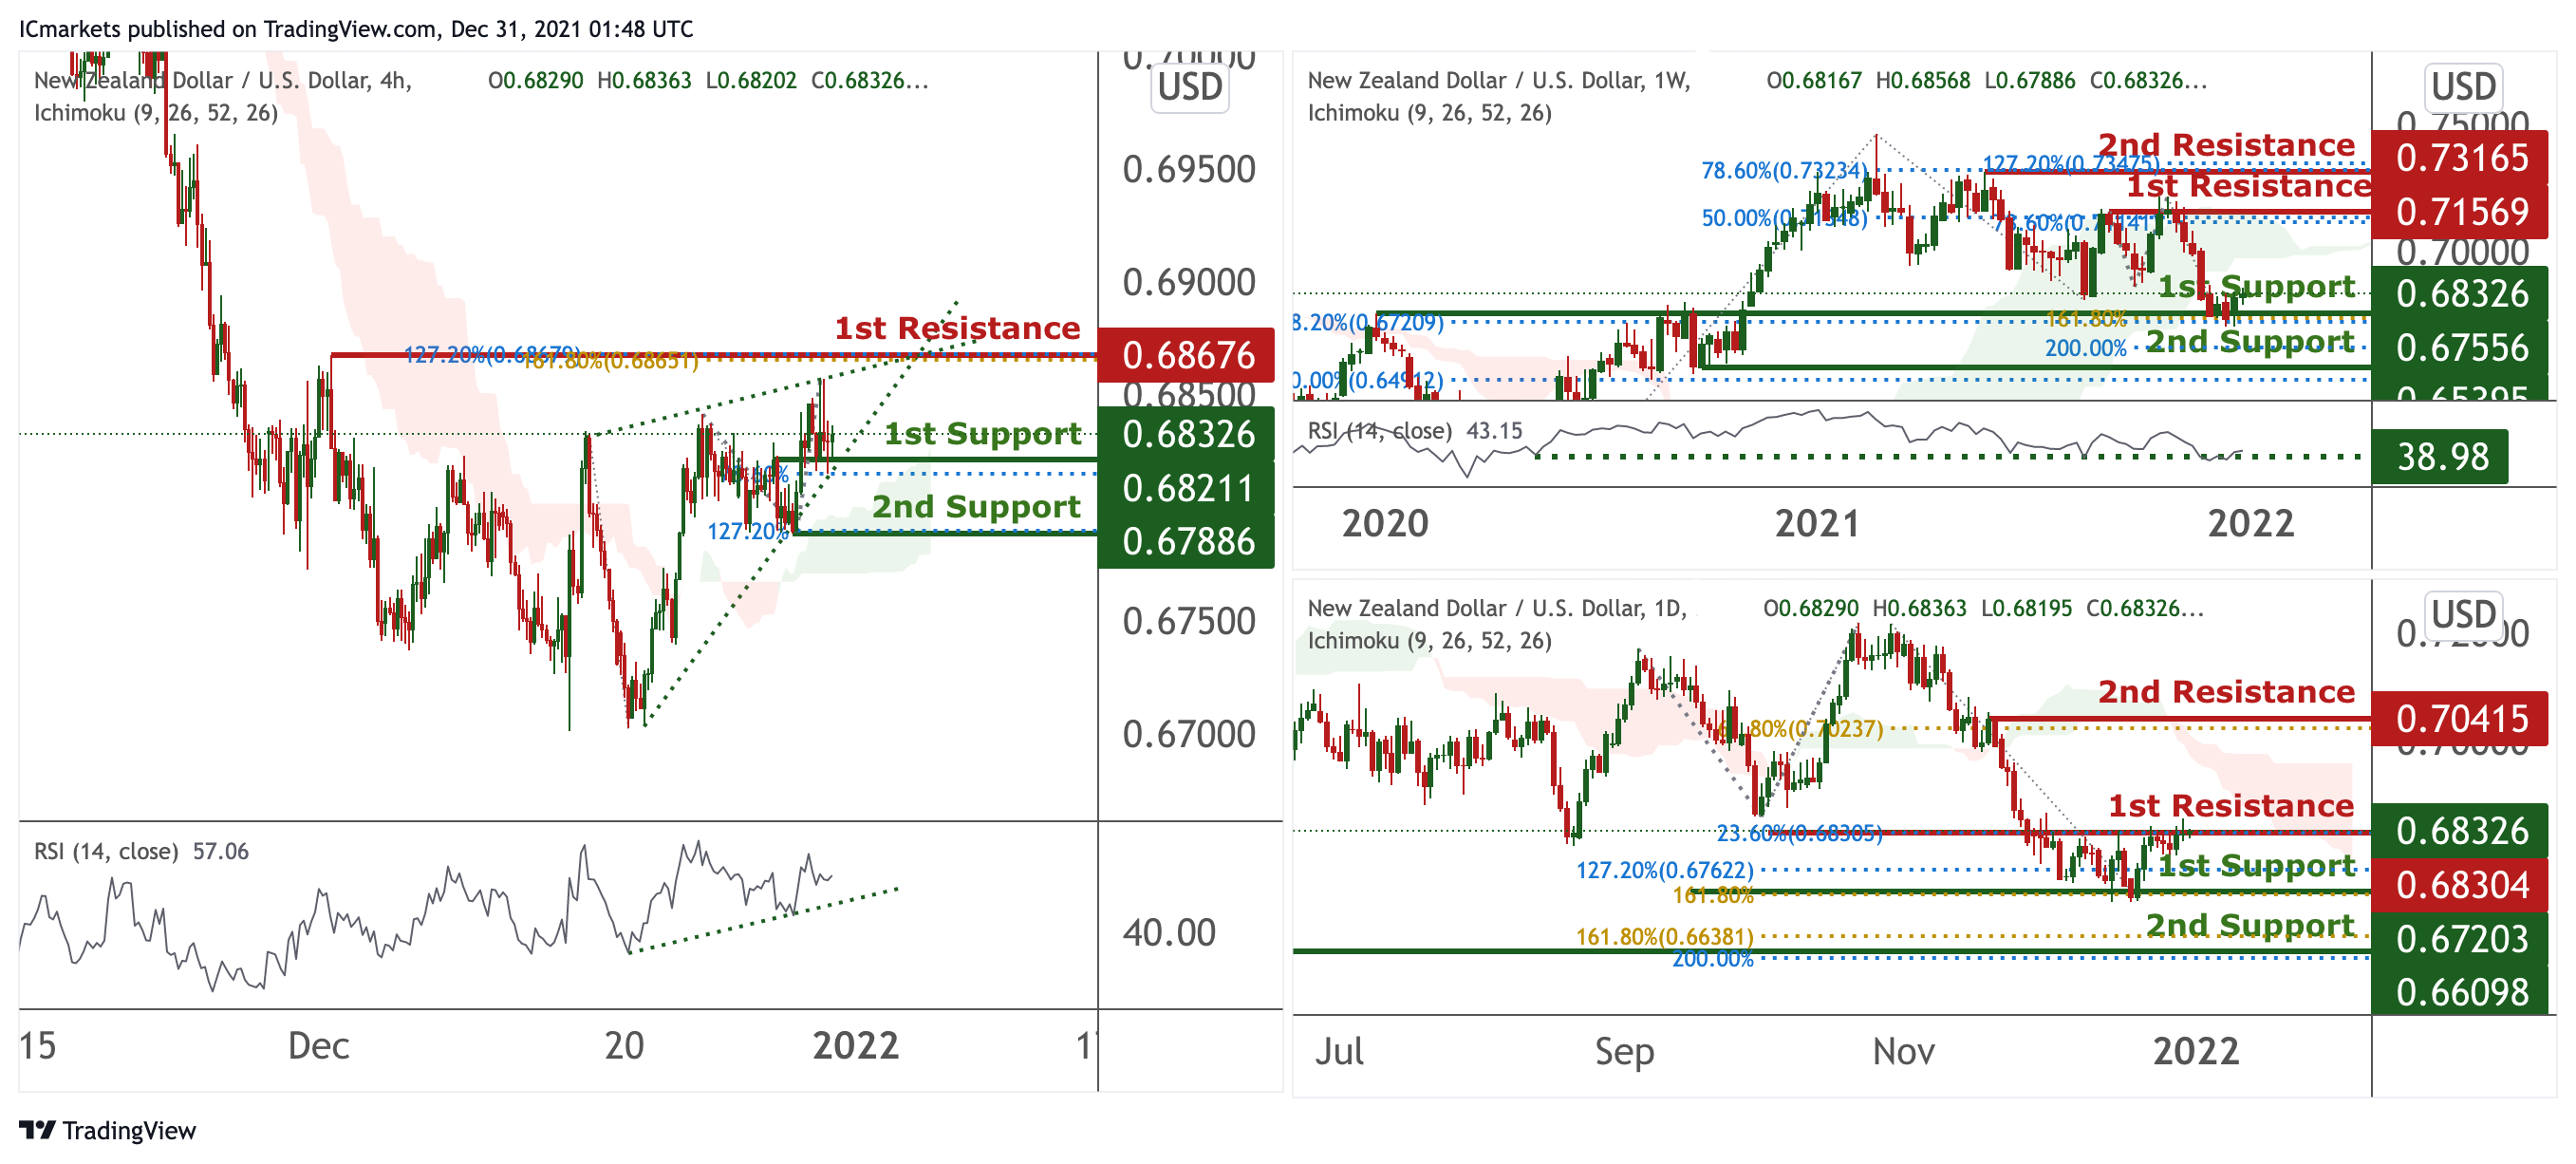
NZD/USD:
On the weekly, prices are on a bullish momentum. We see potential for a bounce at 1st support at 0.69794 in line with 23.6% Fibonacci retracement towards 1st resistance at 61.8% Fibonacci retracement. Technical indicators are showing bullish momentum. Alternatively, if prices break our 1st support, we might find it dipping towards our 2nd support at 0.69794 in line with 61.8% and 78.6% Fibonacci retracement.
On the daily, prices are on bearish momentum. We see potential for prices to dip from our 1st resistance at 0.68166 in line with 23.6% Fibonacci retracement towards our 1st support at 0.67203 in line with 127.2% Fibonacci retracement and 161.8% Fibonacci extension. Ichimoku clouds are forecasting the dips.
On the H4 timeframe, prices are consolidating in an ascending triangle and are experiencing a squeeze. We see potential for prices to bounce from our 1st support at 0.68211 in line with 78.6% Fibonacci extension towards our 1st resistance at 0.68676 in line with 61.8% and 127.2% Fibonacci extension. Our bias is further supported by the Ichimoku Clouds forecasting bullish momentum and also RSI showing bullish momentum. Alternatively, our stop loss will be placed at our 2nd support at 0.67886 in line with 127.2% Fibonacci extension.
Areas of consideration:
- H4 time frame, 1st resistance at 0.68676
- H4 time frame, 1st support at 0.68211
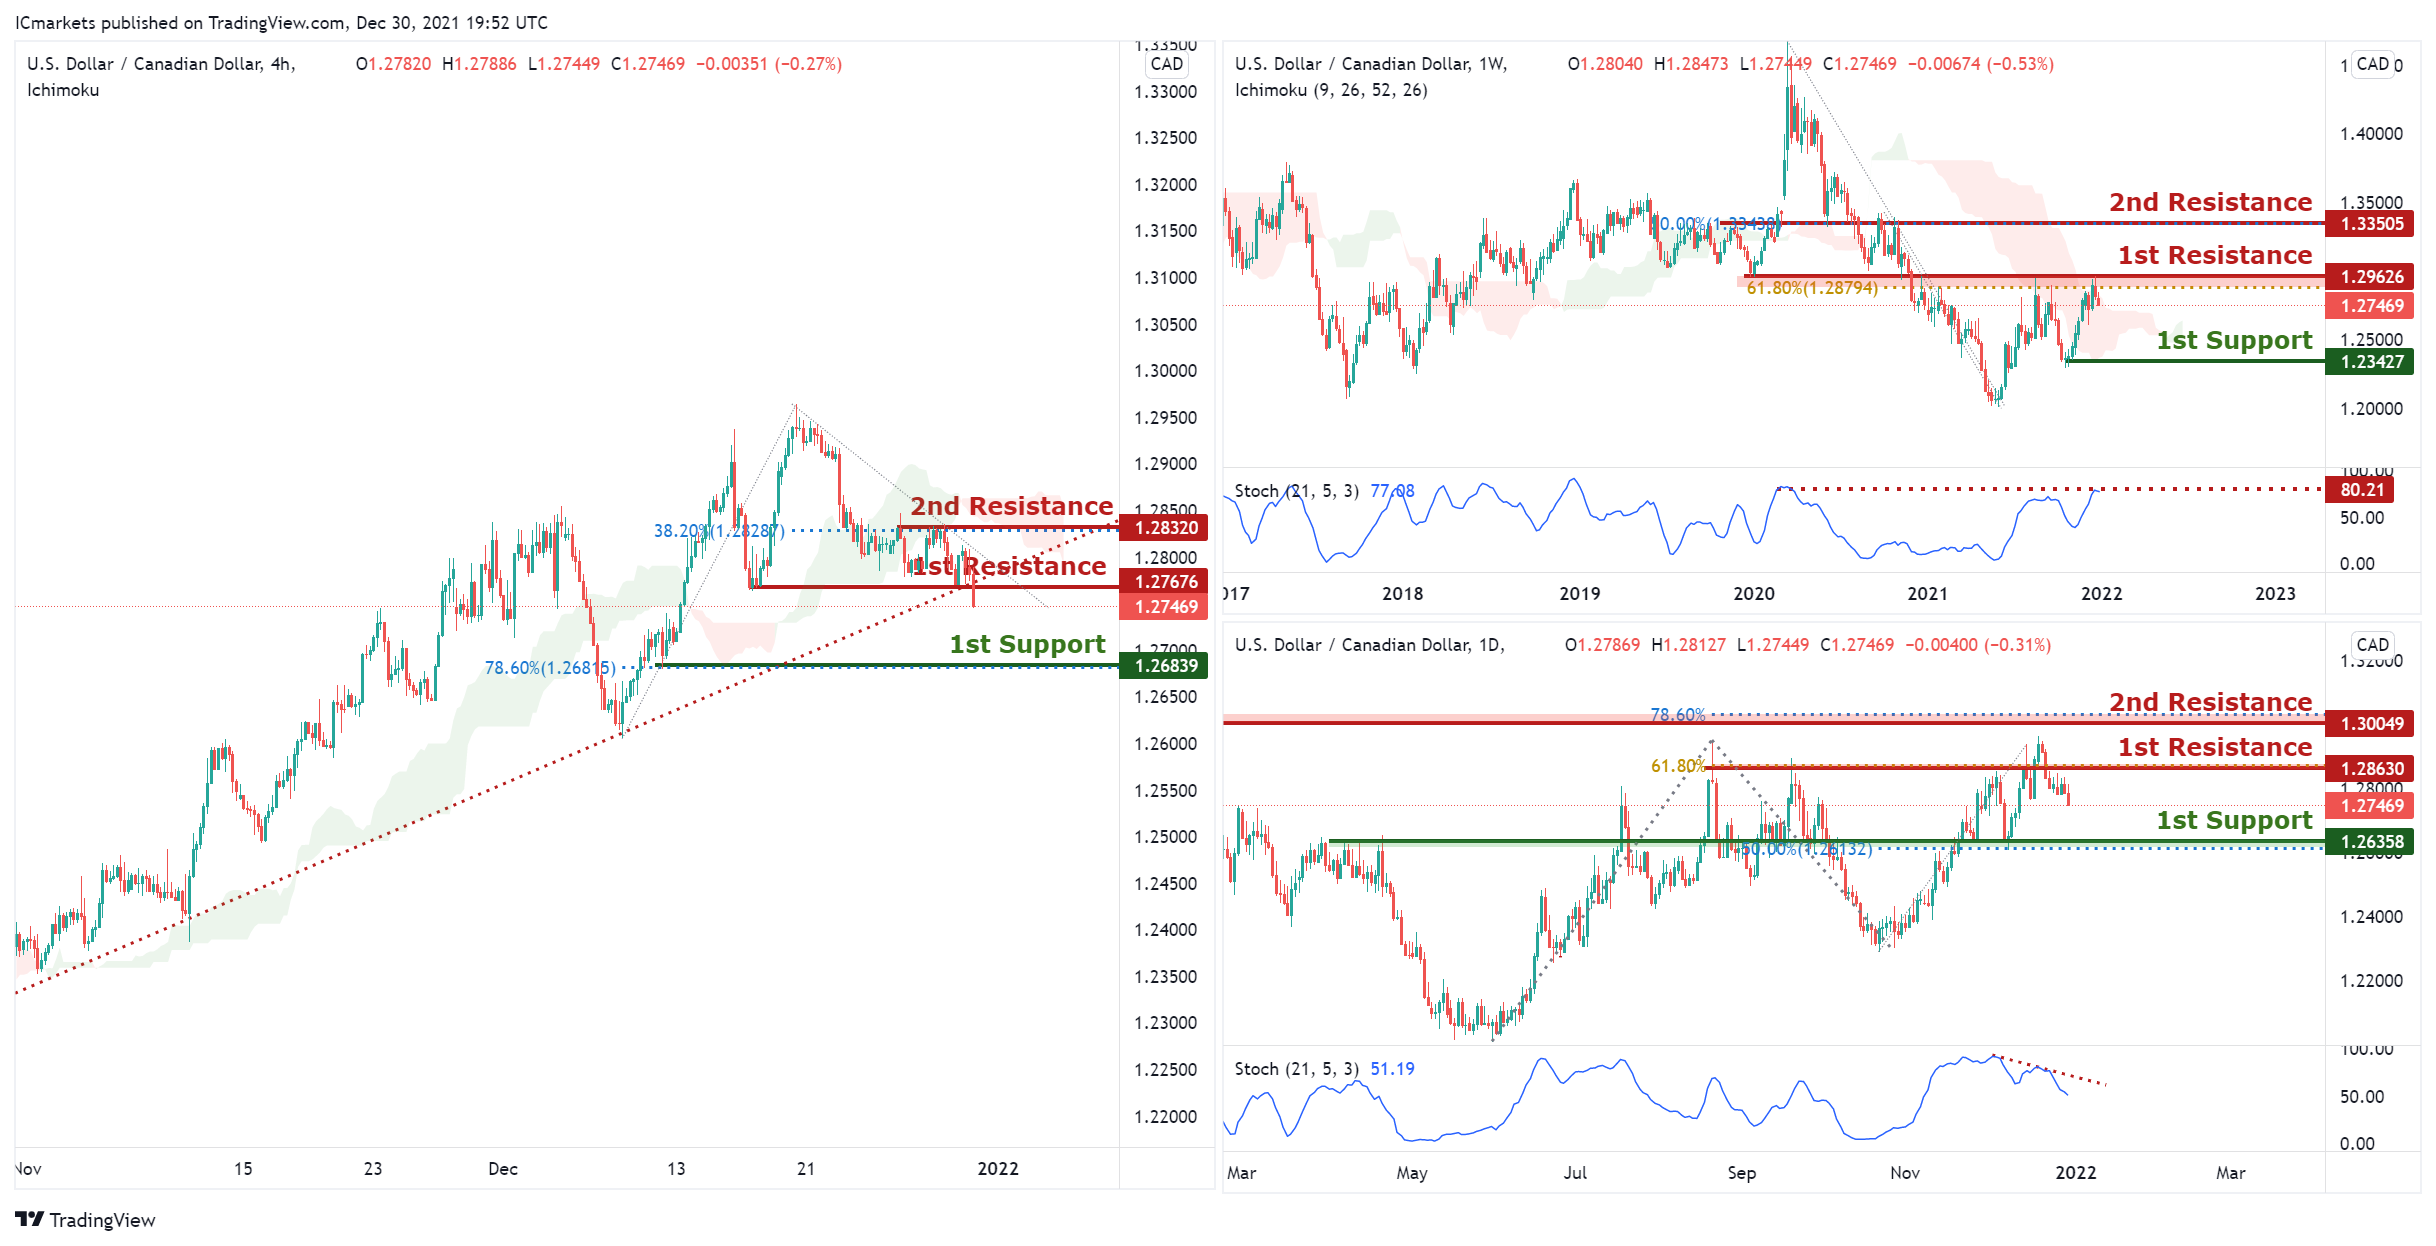
USD/CAD:
On the Weekly, with price at the resistance of the ichimoku indicator and horizontal swing high resistance, we have a bearish bias that price will drop from our 1st resistance at 1.29626 which is in line with horizontal overlap resistance, 61.8% Fibonacci retracement level to 1st support at 1.223427, which is in line with horizontal swing low support. Alternatively, price may rise up to our 2nd resistance at 1.33505, which coincides with horizontal swing high resistance, 50% Fibonacci retracement level . This is further supported by how price just rejected off the Stochastic resistance level .
On the Daily, with price on a downwards trend on the stochastics indicator, we have a bearish bias that price will drop from our 1st resistance at 1.2863 which is in line with horizontal overlap resistance, 61.8% Fibonacci retracement level to 1st support at 1.26358, which is in line with horizontal overlap support, 50.0% Fibonacci retracement level. Alternatively, price may rise up to our 2nd resistance at 1.30049, which coincides with horizontal swing high resistance, 78.6% Fibonacci retracement level . This is further supported by how price just rejected off the Stochastic resistance level .
On the H4, with price breaking the ascending trendline at 1st resistance of 1.27676 which is in line with horizontal overlap resistance, price can potentially drop to 1st support at 1.26839, which is in line with horizontal swing low support, 78.6% Fibonacci retracement level. Alternatively, price may rise up to 2nd resistance at 1.2832, which coincides with horizontal swing high resistance, 38.2% Fibonacci retracement level . This is further supported by how price is now holding below the Ichimoku cloud resistance.
Areas of consideration:
- H4 time frame, 1st support at 1.26839
- H4 time frame, 1st resistance at 1.27676
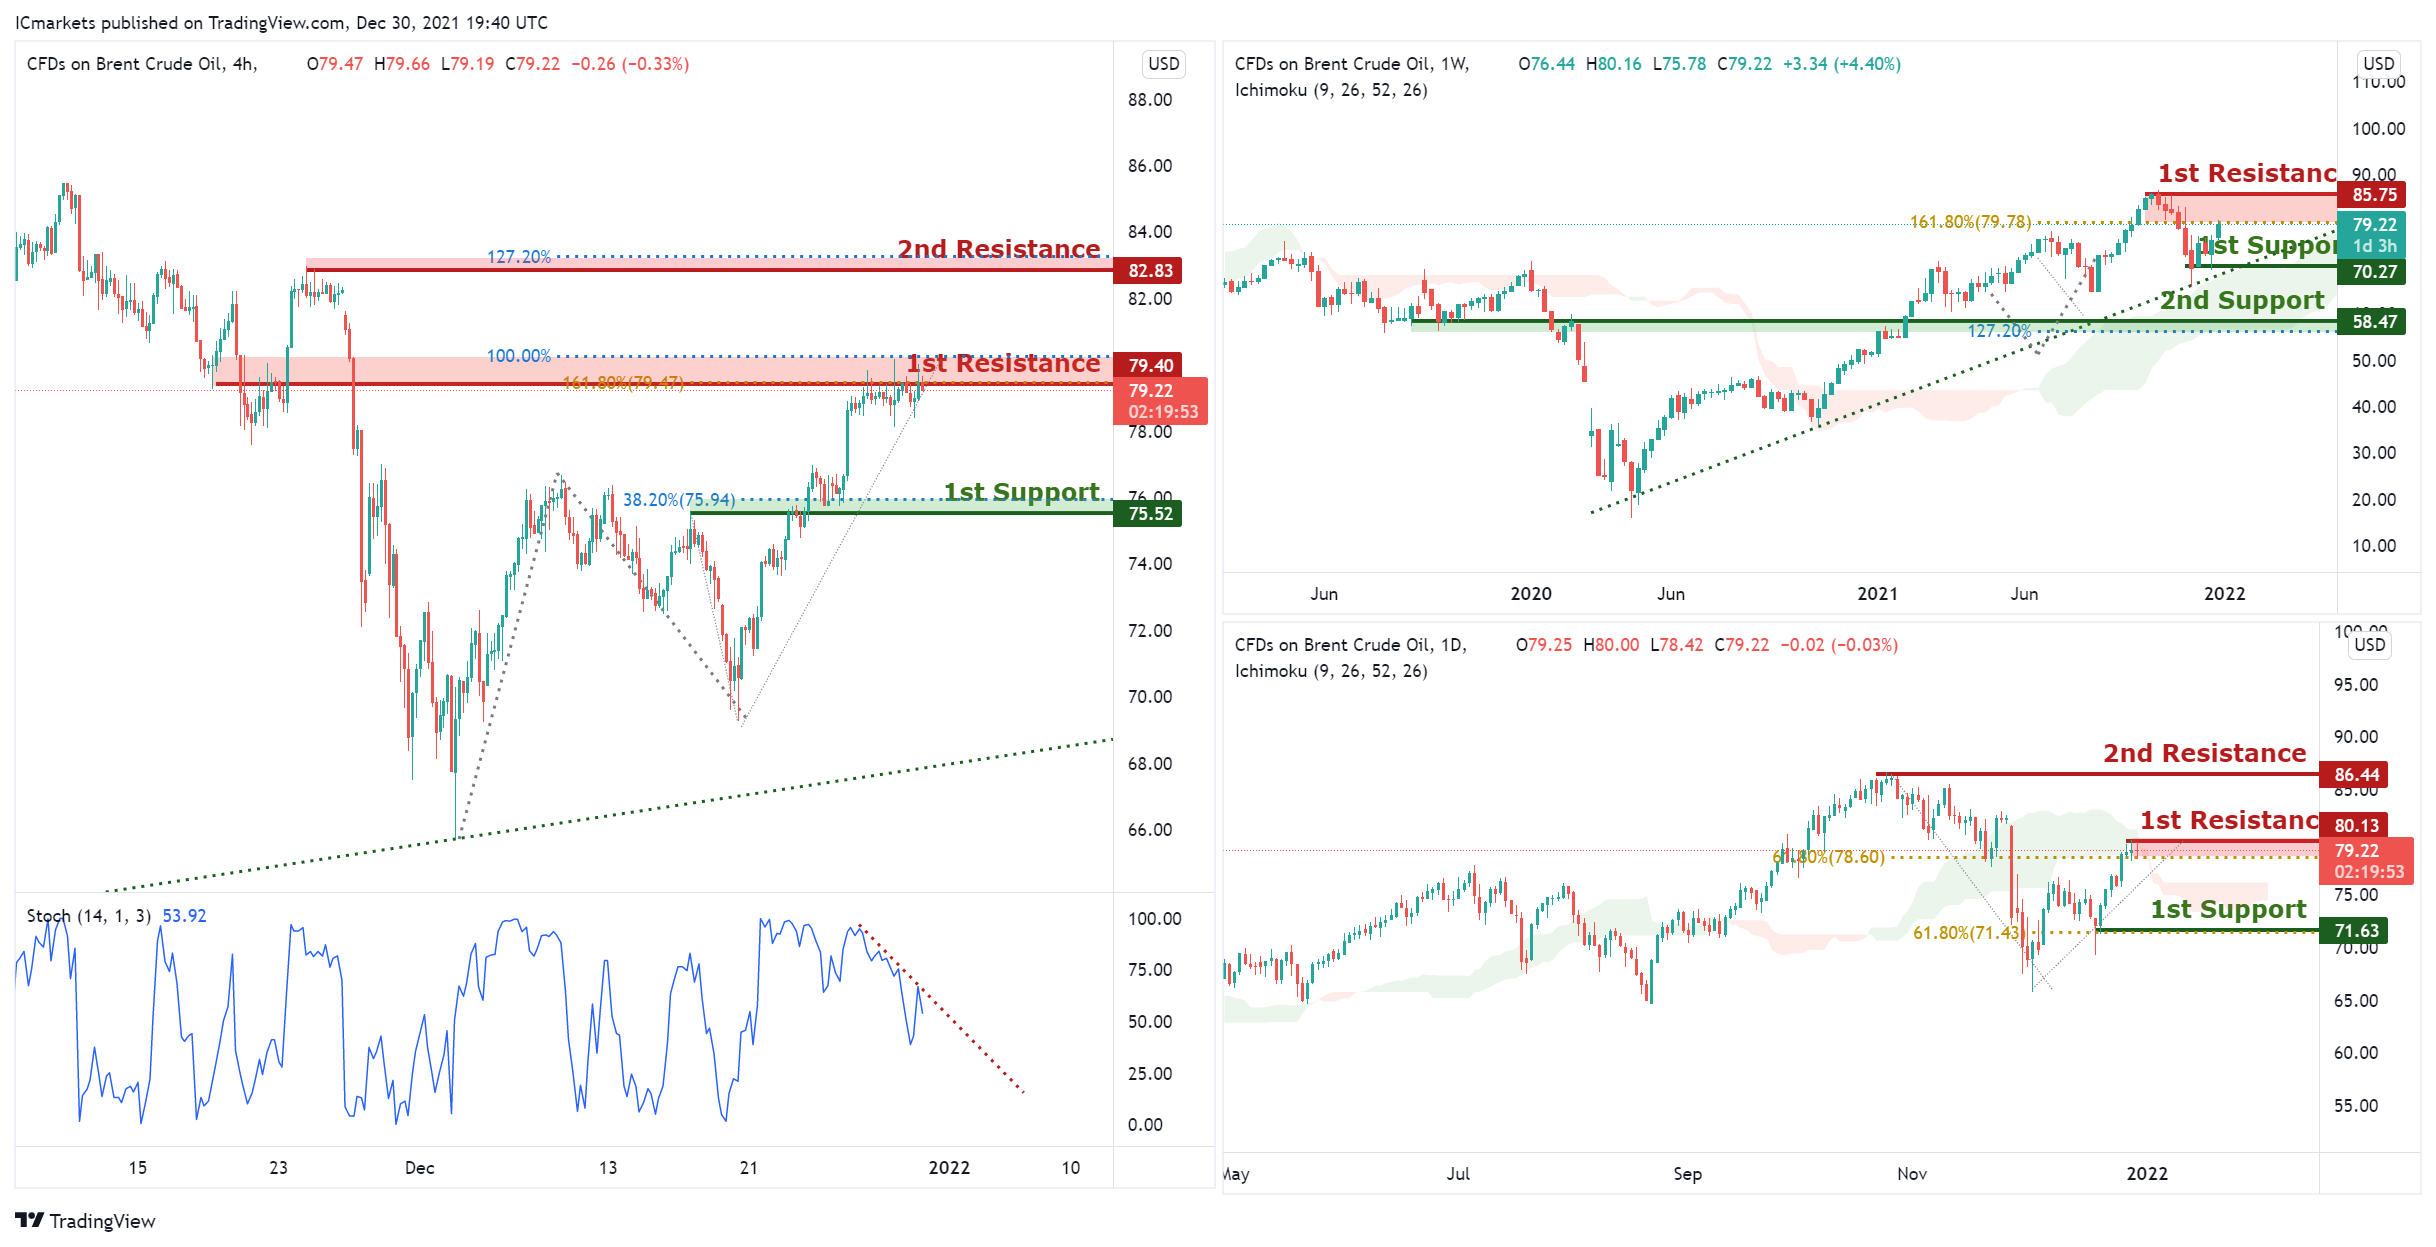
OIL:
On the Weekly, with price moving above the ichimoku indicator, we have a bullish bias that price will rise to our 1st resistance at 85.75 which is in line with horizontal swing high resistance and 161.8% Fibonacci retracement level from our 1st support at 70.27, which is in line with horizontal swing low support. Alternatively, price may break 1st support structure and drop to our 2nd support at 58.47, which coincides with horizontal overlap support and 127.2% Fibonacci extension.
On the Daily, with price at the resistance of the ichimoku indicator and horizontal swing high resistance, we have a bearish bias that price will drop from our 1st resistance at 80.13 which is in line with horizontal swing high resistance and 61.8% Fibonacci retracement level to 1st support at 71,63, which is in line with horizontal swing low support and 61.8% Fibonacci retracement. Alternatively, price may rise up to our 2nd resistance at 86.44, which coincides with horizontal swing high resistance.
On the H4, with price on a downwards trend on the stochastics indicator, we have a bearish bias that price will drop from our 1st resistance at 79.4 which is in line with horizontal overlap resistance, 161.8% Fibonacci extension and 100% Fibonacci projection level to 1st support at 75.52, which is in line with horizontal overlap support, 38.2% Fibonacci retracement level. Alternatively, price may rise up to our 2nd resistance at 82.83, which coincides with horizontal swing high resistance and 127.2% Fibonacci extension level .
Areas of consideration:
- H4 time frame, 1st resistance of 79.40
- H4 time frame, 1st support of 75.52
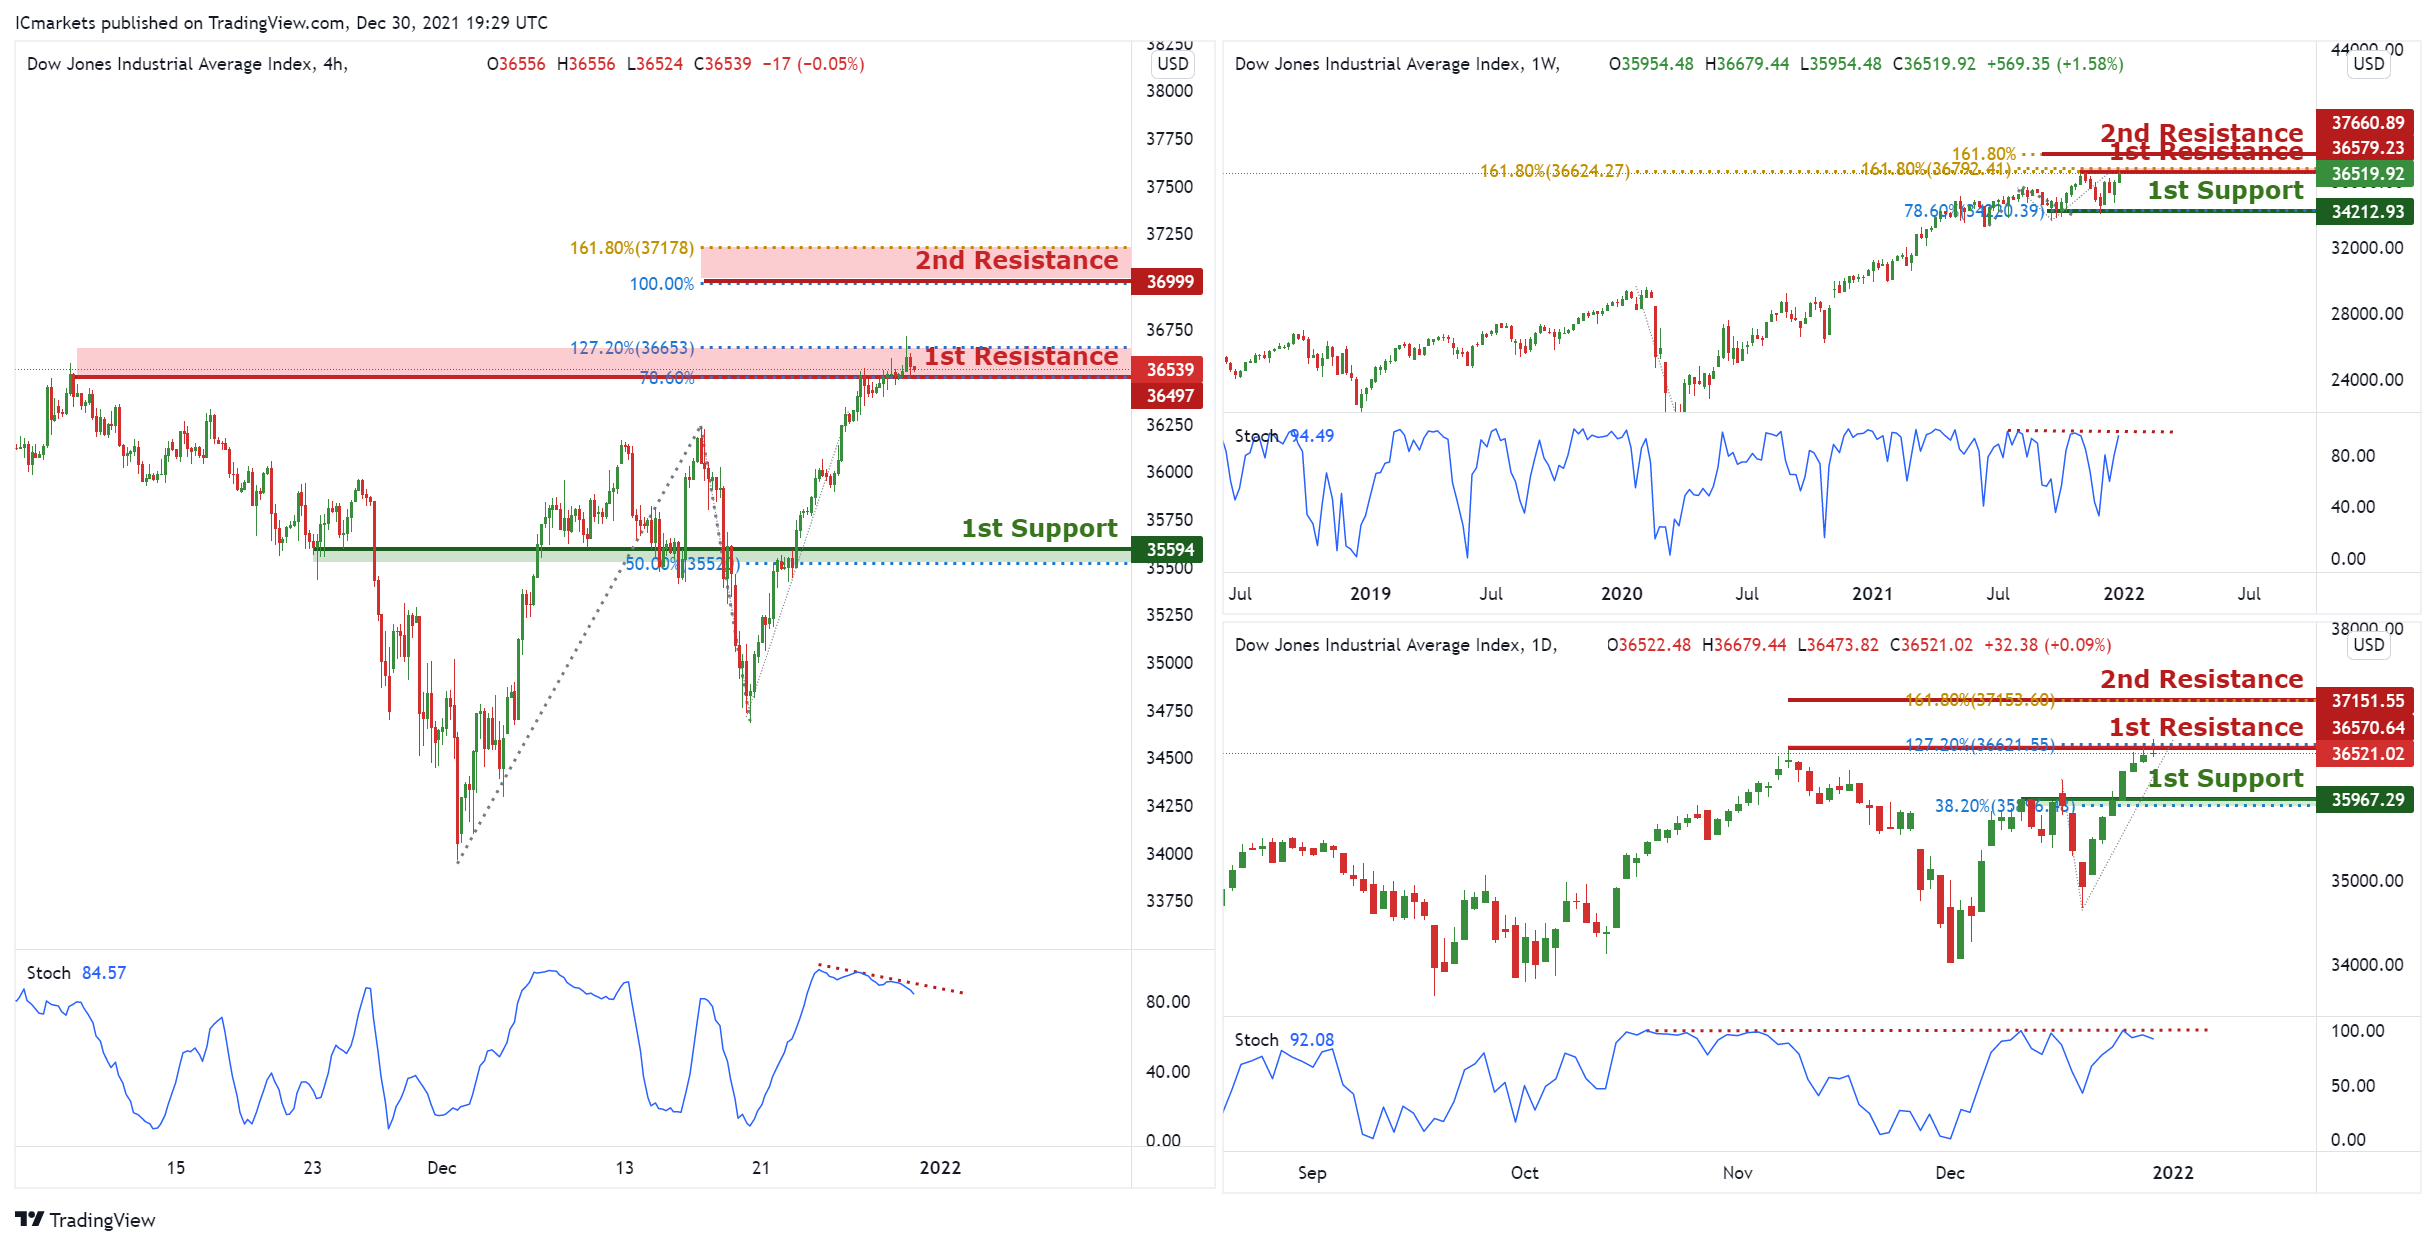
Dow Jones Industrial Average:
On the weekly, with price approaching the resistance of the stochastics indicator, we have a bearish bias that price will drop from our 1st resistance at 36579 which is in line with horizontal swing high resistance and 161.8% Fibonacci extension level to 1st support at 34212, which is in line with horizontal swing low support and 78.6% Fibonacci retracement level. Alternatively, price may rise up to our 2nd resistance at 37660, which coincides with horizontal swing high resistance and 161.8% Fibonacci extension.
On the daily, with price approaching the resistance of the stochastics indicator, we have a bearish bias that price will drop from our 1st resistance at 36570 which is in line with horizontal swing high resistance, 127.2% Fibonacci extension level to 1st support at 35967, which is in line with horizontal overlap support, 38.2% Fibonacci retracement level. Alternatively, price may rise up to our 2nd resistance at 37151, which coincides with horizontal swing high resistance and 161.8% Fibonacci extension.
On the H4, with price on a downwards trend on the stochastics indicator, we have a bearish bias that price will drop from our 1st resistance at 36512 which is in line with horizontal swing high resistance and 127.2% Fibonacci extension level to 1st support at 35594, which is in line with horizontal overlap support, 50.0% Fibonacci retracement level. Alternatively, price may rise up to our 2nd resistance at 36999, which coincides with horizontal swing high resistance and 161.8% Fibonacci extension .
Area of consideration:
- 4H resistance at 36512
- 4H support at 35594
The accuracy, completeness and timeliness of the information contained on this site cannot be guaranteed. IC Markets does not warranty, guarantee or make any representations, or assume any liability regarding financial results based on the use of the information in the site.
News, views, opinions, recommendations and other information obtained from sources outside of www.icmarkets.com.au, used in this site are believed to be reliable, but we cannot guarantee their accuracy or completeness. All such information is subject to change at any time without notice. IC Markets assumes no responsibility for the content of any linked site.
The fact that such links may exist does not indicate approval or endorsement of any material contained on any linked site. IC Markets is not liable for any harm caused by the transmission, through accessing the services or information on this site, of a computer virus, or other computer code or programming device that might be used to access, delete, damage, disable, disrupt or otherwise impede in any manner, the operation of the site or of any user’s software, hardware, data or property.

Gold Price Forecast: XAU/USD set for a strong finish to a bearish year
193025 December 31, 2021 13:26 FXStreet Market News
- Gold rebounded firmly amid thin trades, profit-taking in Treasury yields.
- Year-end flows and Wall Street sentiment will dominate moves.
- Gold’s daily technical setup points to more gains in the offing.
The year-end flows favored gold buyers on Thursday, prompting a sharp comeback in the bright metal to reach fresh two-day tops at $1,817. Investors paid a little heed to the weekly US Jobless Claims, as the end of the year sentiment led the way and injected volatility in gold price. In absence of any market-moving news, profit-taking in the US Treasury yields, following the upsurge to four-week highs, emerged as the key catalyst behind gold’s turnaround. The negative close on Wall Street indices, growing Omicron cases globally and a pullback in the greenback also aided the renewed upside in gold price.
On the final trading day of 2021, gold price is building on the previous rebound, flirting with a fresh monthly high of $1,820. The market mood remains cautious, underpinning the US dollar. However, gold bulls remain undeterred amid the recent weakness in the yields. Note that the benchmark 10-year Treasury yields are on course to end 2021 above the key 1.50% level, which could flash a bearish signal for the non-yielding gold. Meanwhile, the Wall Street sentiment on New Year’s Eve will play a pivotal role in gold’s end to 2021.
Gold Price Chart – Technical outlook

Gold: Daily chart
As observed on gold’s daily chart, the bull cross confirmed on Thursday is helping extend the upswing towards $1,825 once the confluence of the rising trendline resistance and monthly highs near $1,820 is taken out.
The 21-Daily Moving Average (DMA) crossed the 100-DMA for the upside, giving a daily closing above the latter.
The 1,830 round number will be next on the radars of gold bulls. The bright metal could then witness a fresh uptrend towards the November 22 highs of $1,849 on a firm break above the latter.
The 14-day Relative Strength Index (RSI) has turned flat but remains well above the central line, keeping the bullish potential intact.
Any retracement could be limited by the ascending 50-DMA at $1,804, below which bulls may find some solace at the $1,800 threshold.
The 200-DMA support at $1,798 will also come into the picture if the corrective downside picks up pace.
Full Article
GBP/USD Price Analysis: Closing in on make-or-break points near 1.3500
193023 December 31, 2021 13:21 FXStreet Market News
- GBP/USD grinds higher around multi-day top, up for the third consecutive day.
- Two-week-old ascending support line, horizontal line from November 18 limit immediate moves, RSI conditions hint at buyer’s exhaustion.
Alike other major currency pairs, GBP/USD also treads water around 1.3500 heading into Friday’s European session. In doing so, the cable pair seesaws near the highest levels in seven weeks amid a lack of major data/events.
That said, the pair’s immediate moves are confined between an upward sloping trend line from December 20 and a horizontal line comprising double tops marked since November, namely between 1.3480 and 1.3515.
It should be noted, however, that the RSI conditions repeatedly test overbought region while the Momentum line is also descending, which in turn hints at the receding bullish bias for the pair.
However, a clear downside break of 1.3480 becomes necessary for the GBP/USD sellers before they can aim for the 200-SMA support of 1.3330.
It’s worth observing that the pair’s declines past 1.3330 will be challenged by the 1.3170-60 area comprising the monthly, also the yearly, low.
On the contrary, an upside clearance of 1.3515 will aim for the mid-October swing low near 1.3570 before November 09 top of 1.3607 lures the GBP/USD buyers.
In a case where the cable remains directed towards the north past 1.3607, the last month’s high near 1.3700 will be in focus.
GBP/USD: Four-hour chart

Trend: Pullback expected
Full Article