Articles

What will happen to Shiba Inu price after founder Ryoshi steps down
231430 May 31, 2022 21:40 FXStreet Market News
- SHIB price at a crucial point to potentially break the downtrend.
- Shiba Inu founder Ryoshi retreats from the community and steps down after erasing all social media accounts.
- Ryoshi’s move may puzzle markets and could delay the bullish breakout.
Shiba Inu (SHIB) traders must be on edge after the broad media picked up the last tweet and mic drop from Shiba Inu founder Ryoshi just moments before he erased all his social media accounts. With his stepping-down, traders will be questioning whether it is just the founder leaving the cryptocurrency to stand on its own two legs or there are more details to come given how the Luna debacle is still not far away in the back of their minds. SHIB price has retreated onto the back foot as a result and this could dampen hopes for a bullish breakout anytime soon as trust will need to be rebuilt over time.
SHIB price breakout delayed as uncertainty sneaks in
Shiba Inu price sees its price action relatively contained after the last tweet from its fonder Ryoshi: “ I am just some guy of no consequence tapping at a keyboard, and I am replaceable. I am Ryoshi’. Although the pseudonymous founder already warned several times that he had no intentions of staying on indefinitely, the news has put traders on edge, questioning if this is the right time to buy or if something else is going on within the meme coin itself that could trigger future losses. Investors only just now started to shrug off the Terra Luna debacle. The timing is undoubtedly peculiar as the global trust in cryptocurrencies and alt currencies has not yet peaked back to levels from 2021.
SHIB price technically was set to break above the red descending trend line and reclaim the historic pivotal level at $0.00001209. Now, however, the breakout is likely to be delayed and not materialise until a later stage as price action will now first look back for support around $0.00000965 or a higher level, depending on where the new monthly support levels will be appearing as of Wednesday, as a new trading month is just around the corner when they will be recalculated. In a couple of days, expect the bullish breakout to follow with price action reclaiming $0.00001209 and possibly $0.00001708 once traders are fully trusting and the news about the founder stepping down, has faded to the background.

SHIB/USD daily chart
As mentioned in the previous paragraphs, the question remains if something else is cooking underneath the bonnet. Is there a similar risk at hand as with Tera Luna? Admittedly, SHIB price is not a stable coin and thus behaves entirely differently but traders may still suspect something is wrong. In a case where investors’ trust is dented, price action could break below $0.00000965 and sell off further in a sort of vote-of-no-confidence by traders who will bring price action down to $0.00000655.

United States S&P/Case-Shiller Home Price Indices (YoY) came in at 21.2%, above forecasts (20%) in March
231429 May 31, 2022 21:35 FXStreet Market News
Information on these pages contains forward-looking statements that involve risks and uncertainties. Markets and instruments profiled on this page are for informational purposes only and should not in any way come across as a recommendation to buy or sell in these assets. You should do your own thorough research before making any investment decisions. FXStreet does not in any way guarantee that this information is free from mistakes, errors, or material misstatements. It also does not guarantee that this information is of a timely nature. Investing in Open Markets involves a great deal of risk, including the loss of all or a portion of your investment, as well as emotional distress. All risks, losses and costs associated with investing, including total loss of principal, are your responsibility. The views and opinions expressed in this article are those of the authors and do not necessarily reflect the official policy or position of FXStreet nor its advertisers. The author will not be held responsible for information that is found at the end of links posted on this page.
If not otherwise explicitly mentioned in the body of the article, at the time of writing, the author has no position in any stock mentioned in this article and no business relationship with any company mentioned. The author has not received compensation for writing this article, other than from FXStreet.
FXStreet and the author do not provide personalized recommendations. The author makes no representations as to the accuracy, completeness, or suitability of this information. FXStreet and the author will not be liable for any errors, omissions or any losses, injuries or damages arising from this information and its display or use. Errors and omissions excepted.
The author and FXStreet are not registered investment advisors and nothing in this article is intended to be investment advice.
Copper prices to break below support levels from early-2021 – TDS
231428 May 31, 2022 21:33 FXStreet Market News
The relief rally in copper is running out of steam. Economists at TD Securities expect the metal to dip under key support levels.
Copper appears to be in a more precarious position than its peers
“The metals complex is vulnerable to further weakening in the coming months, which fits with our view that the trading regime in base metals has morphed into a sell-rallies regime.”
“Copper appears to be in a more precarious position than its peers given its lower energy intensity, but CTA trend followers could now add to their shorts below $9,505/t.”
“A set-up is forming for copper prices to ultimately break below the support levels which have held since early-2021.”
Full Article
USD/TRY seen at 20 in 12M horizon with risks clearly tilted to the upside – Danske Bank
231427 May 31, 2022 21:33 FXStreet Market News
USD/TRY is set to move higher. Economists at Danske Bank 20.00 in a year.
‘Perfect storm’ looming for Turkey and lira
“The rising stagflation fears combined with tightening financial conditions, negative terms of trade shock, and no signs of a turnaround in domestic economic policies indicate further weakness for the lira.”
“We see USD/TRY at 20 in 12M.”
“Risks are tilted towards even further TRY weakness as the intervention policies, which have supported the currency over the past months, begin to lose steam.”
Full Article
Terra’s LUNA 2.0 price explodes 50% as Binance, Gate.io, KuCoin, Kraken list the token
231426 May 31, 2022 21:29 FXStreet Market News
- Terra’s LUNA 2.0 price jumped 50% overnight in response to listing on cryptocurrency platforms Binance, Gate.io, KuCoin, Kraken and others.
- LUNA 2.0 price surge started hours before listing on world’s largest cryptocurrency exchange, Binance.
- Terra users received lower quantity of LUNA 2.0 airdrop than expected, developers actively working on solution.
Terra’s LUNA 2.0 price recovered from its slump with new listing announcements from cryptocurrency exchanges, wallets and futures platforms. Luna Classic (LUNC) and TerraUSD (UST) holders have raised concerns about receiving less LUNA from the airdrop than expected, and the Terra team is currently investigating the issue.
Also read: Terra’s LUNA 2.0 airdrop: its starting price in exchanges like Binance
LUNA 2.0 price explodes after listing across exchanges
LUNA 2.0 price is nearly 54% away from its debut price of $17.80 on May 28. Following the initial slump, LUNA made a massive comeback after listing announcements across exchange platforms and spot and futures markets. LUNA 2.0 posted 50% gains overnight, as Do Kwon retweeted listing announcements from Bybit, Gate.io, Binance, Kucoin, Huobi, Kraken and OKX. On Binance, LUNA 2.0 is listed in the Innovation Zone, a space for tokens that pose a higher risk than others.
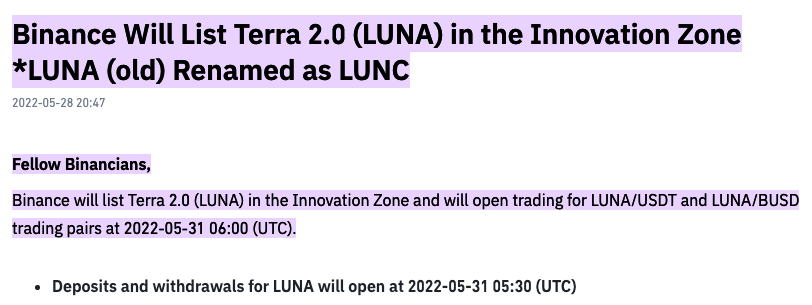
Binance announcement for LUNA listing in Innovation Zone
After the colossal crash of Terraform Labs’ sister tokens LUNA (now Luna Classic, LUNC) and TerraUSD (UST), the CEO and co-founder of Terra unveiled a revival plan to salvage the ecosystem. LUNA 2.0, the revamped version of the LUNA coin, was launched and linked to a new blockchain. LUNA 2.0 price plummeted after its airdrop, with a consistent drop in the token’s price since the hard fork, before it rallied nearly 23% in the last hours.
Binance and leading cryptocurrency exchanges support Terra’s LUNA 2.0
Major cryptocurrency exchanges pledged support for Terra’s LUNA 2.0 airdrop and listing across their platforms. Perpetual futures, spot and derivatives trading in LUNA 2.0 is live on several platforms.
Together with crypto heavyweights like Binance and Kraken putting their weight behind LUNA 2.0, Leap wallet, Guarda wallet and Atomicwallet.io also support the token. Large players in the crypto wallet space, like MetaMask and Trust wallet, are yet to announce support for LUNA 2.0.
Trust wallet, which supports 66 blockchains, recently called its community to vote on a governance proposal, choosing between the Ronin chain and Terra. Since both blockchains have suffered from an attack of different magnitudes that have negatively influenced their token prices, Trust wallet asked the community to identify the chain where the positives outweigh the cost of prioritizing integration.
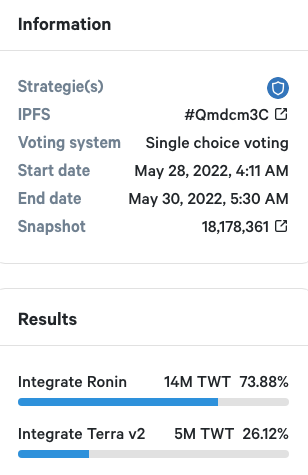
Governance proposal on Trust wallet
The result of the proposal was a higher (73.88%) demand for Ronin integration, over Terra’s LUNA 2.0 token.
Terra’s LUNA 2.0 airdrop lower than expected
Eligible Terra’s LUNA (now LUNA Classic, LUNC) and UST holders have raised concerns regarding a lower airdrop of LUNA 2.0 than expected. The team behind LUNA 2.0 is gathering more information from the relevant snapshots and the blockchain, and revealed that the issue is currently being investigated.
Attention $LUNA airdrop recipients
We are aware that some have received less $LUNA from the airdrop than expected & are actively working on a solution.
More information will be provided when we have gathered all of the data, so stay tuned.
— Terra Powered by LUNA (@terra_money) May 30, 2022
The Terraform Labs team is aware that some users are awaiting an actively working solution for receiving lower LUNA 2.0 tokens that they are eligible for. Terra’s team has asked users to stay tuned for more information on the issue.
Is it good to buy Terra’s LUNA 2.0?
Analysts at FXStreet have evaluated the Terra LUNA 2.0 price chart and the token’s potential after its relaunch. In the following video, Akash Girimath, a leading cryptocurrency analyst at FXStreet reveals whether it is profitable to buy Terra’s LUNA 2.0 tokens.
USD/TRY: Bulls now target the 2022 high near 16.50
231425 May 31, 2022 21:29 FXStreet Market News
- USD/TRY resumes the upside beyond 16.40.
- Turkey GDP expanded more than expected in Q1.
- Investors remain cautious ahead of upcoming CPI figures.
The Turkish lira loses ground for the second session in a row and sponsors the move higher in USD/TRY to the area past 16.40 on Tuesday.
USD/TRY up on dollar’s recovery
USD/TRY saw its upside accelerated so far on Tuesday in response to the rebound in the demand for the greenback, which managed to trim part of the recent losses vs. its main peers.
The move higher in the pair is so far accompanied by the recovery in US yields in the belly and the long end of the curve, while the Turkey 10y bond yields keep the range around 23.00%.
Further out, the lira is expected to keep the cautious note ahead of the publication of key inflation figures tracked by the CPI later in the week.
In the domestic calendar, better-than-expected GDP figures showed the economy expanded at an annualized 7.3% in Q1, while Trade Balance results saw the deficit shrink to $6.11B in April.
What to look for around TRY
USD/TRY keeps the underlying upside bias well and sound and looks to consolidate the recent surpass of the 16.00 yardstick for the first time since late December 2021.
So far, price action in the Turkish currency is expected to gyrate around the performance of energy prices, the broad risk appetite trends, the Fed’s rate path and the developments from the war in Ukraine.
Extra risks facing TRY also come from the domestic backyard, as inflation gives no signs of abating, real interest rates remain entrenched in negative figures and the political pressure to keep the CBRT biased towards low interest rates remain omnipresent.
Key events in Turkey this week: Q1 GDP, Trade Balance (Tuesday) – Manufacturing PMI (Wednesday) – Inflation Rate, Producer Prices (Friday).
Eminent issues on the back boiler: FX intervention by the CBRT. Progress (or lack of it) of the government’s new scheme oriented to support the lira via protected time deposits. Constant government pressure on the CBRT vs. bank’s credibility/independence. Bouts of geopolitical concerns. Structural reforms. Upcoming Presidential/Parliamentary elections.
USD/TRY key levels
So far, the pair is gaining 0.03% at 16.3812 and faces the next up barrier at 16.4554 (2022 high May 26) seconded by 18.2582 (all-time high December 20) and then 19.00 (round level). On the flip side, a breach of 14.6836 (monthly low May 4) would expose 14.5458 (monthly low April 12) and finally 14.5136 (weekly low March 29).
Full Article
Rising yields and risk aversion boost the US dollar
231423 May 31, 2022 21:17 Forexlive Latest News Market News
The US is back from holiday today and inflation fears are resurfacing.
Eurozone inflation jumped above 8% and global bonds are selling off. US 10-year yields are up 11 bps to 2.86%.
The gain in European yields in the past two days has easily exceeded that but it’s coupled with fears that the ECB will need to hike into a recession. In turn, there’s a resurgence of the ‘risk off’ mood that’s been dominant for most of the year.


Terra’s LUNA 2.0 price jumps above $10 after Binance completes airdrop distribution
231421 May 31, 2022 21:12 FXStreet Market News
Terra’s LUNA 2.0 price appears to be gaining traction despite the legal investigation launched against Terraform Labs and CEO Do Kwon in South Korea. The token has risen by nearly 23% over the past few hours, overcoming the psychological $10 resistance level.
The sudden upswing appears to be fueled by news that the world’s largest cryptocurrency exchange by trading volume, Binance, completed the Terra (LUNA) airdrop distribution to Terra Classic (LUNC) and TerraClassicUSD (USTC) holders.
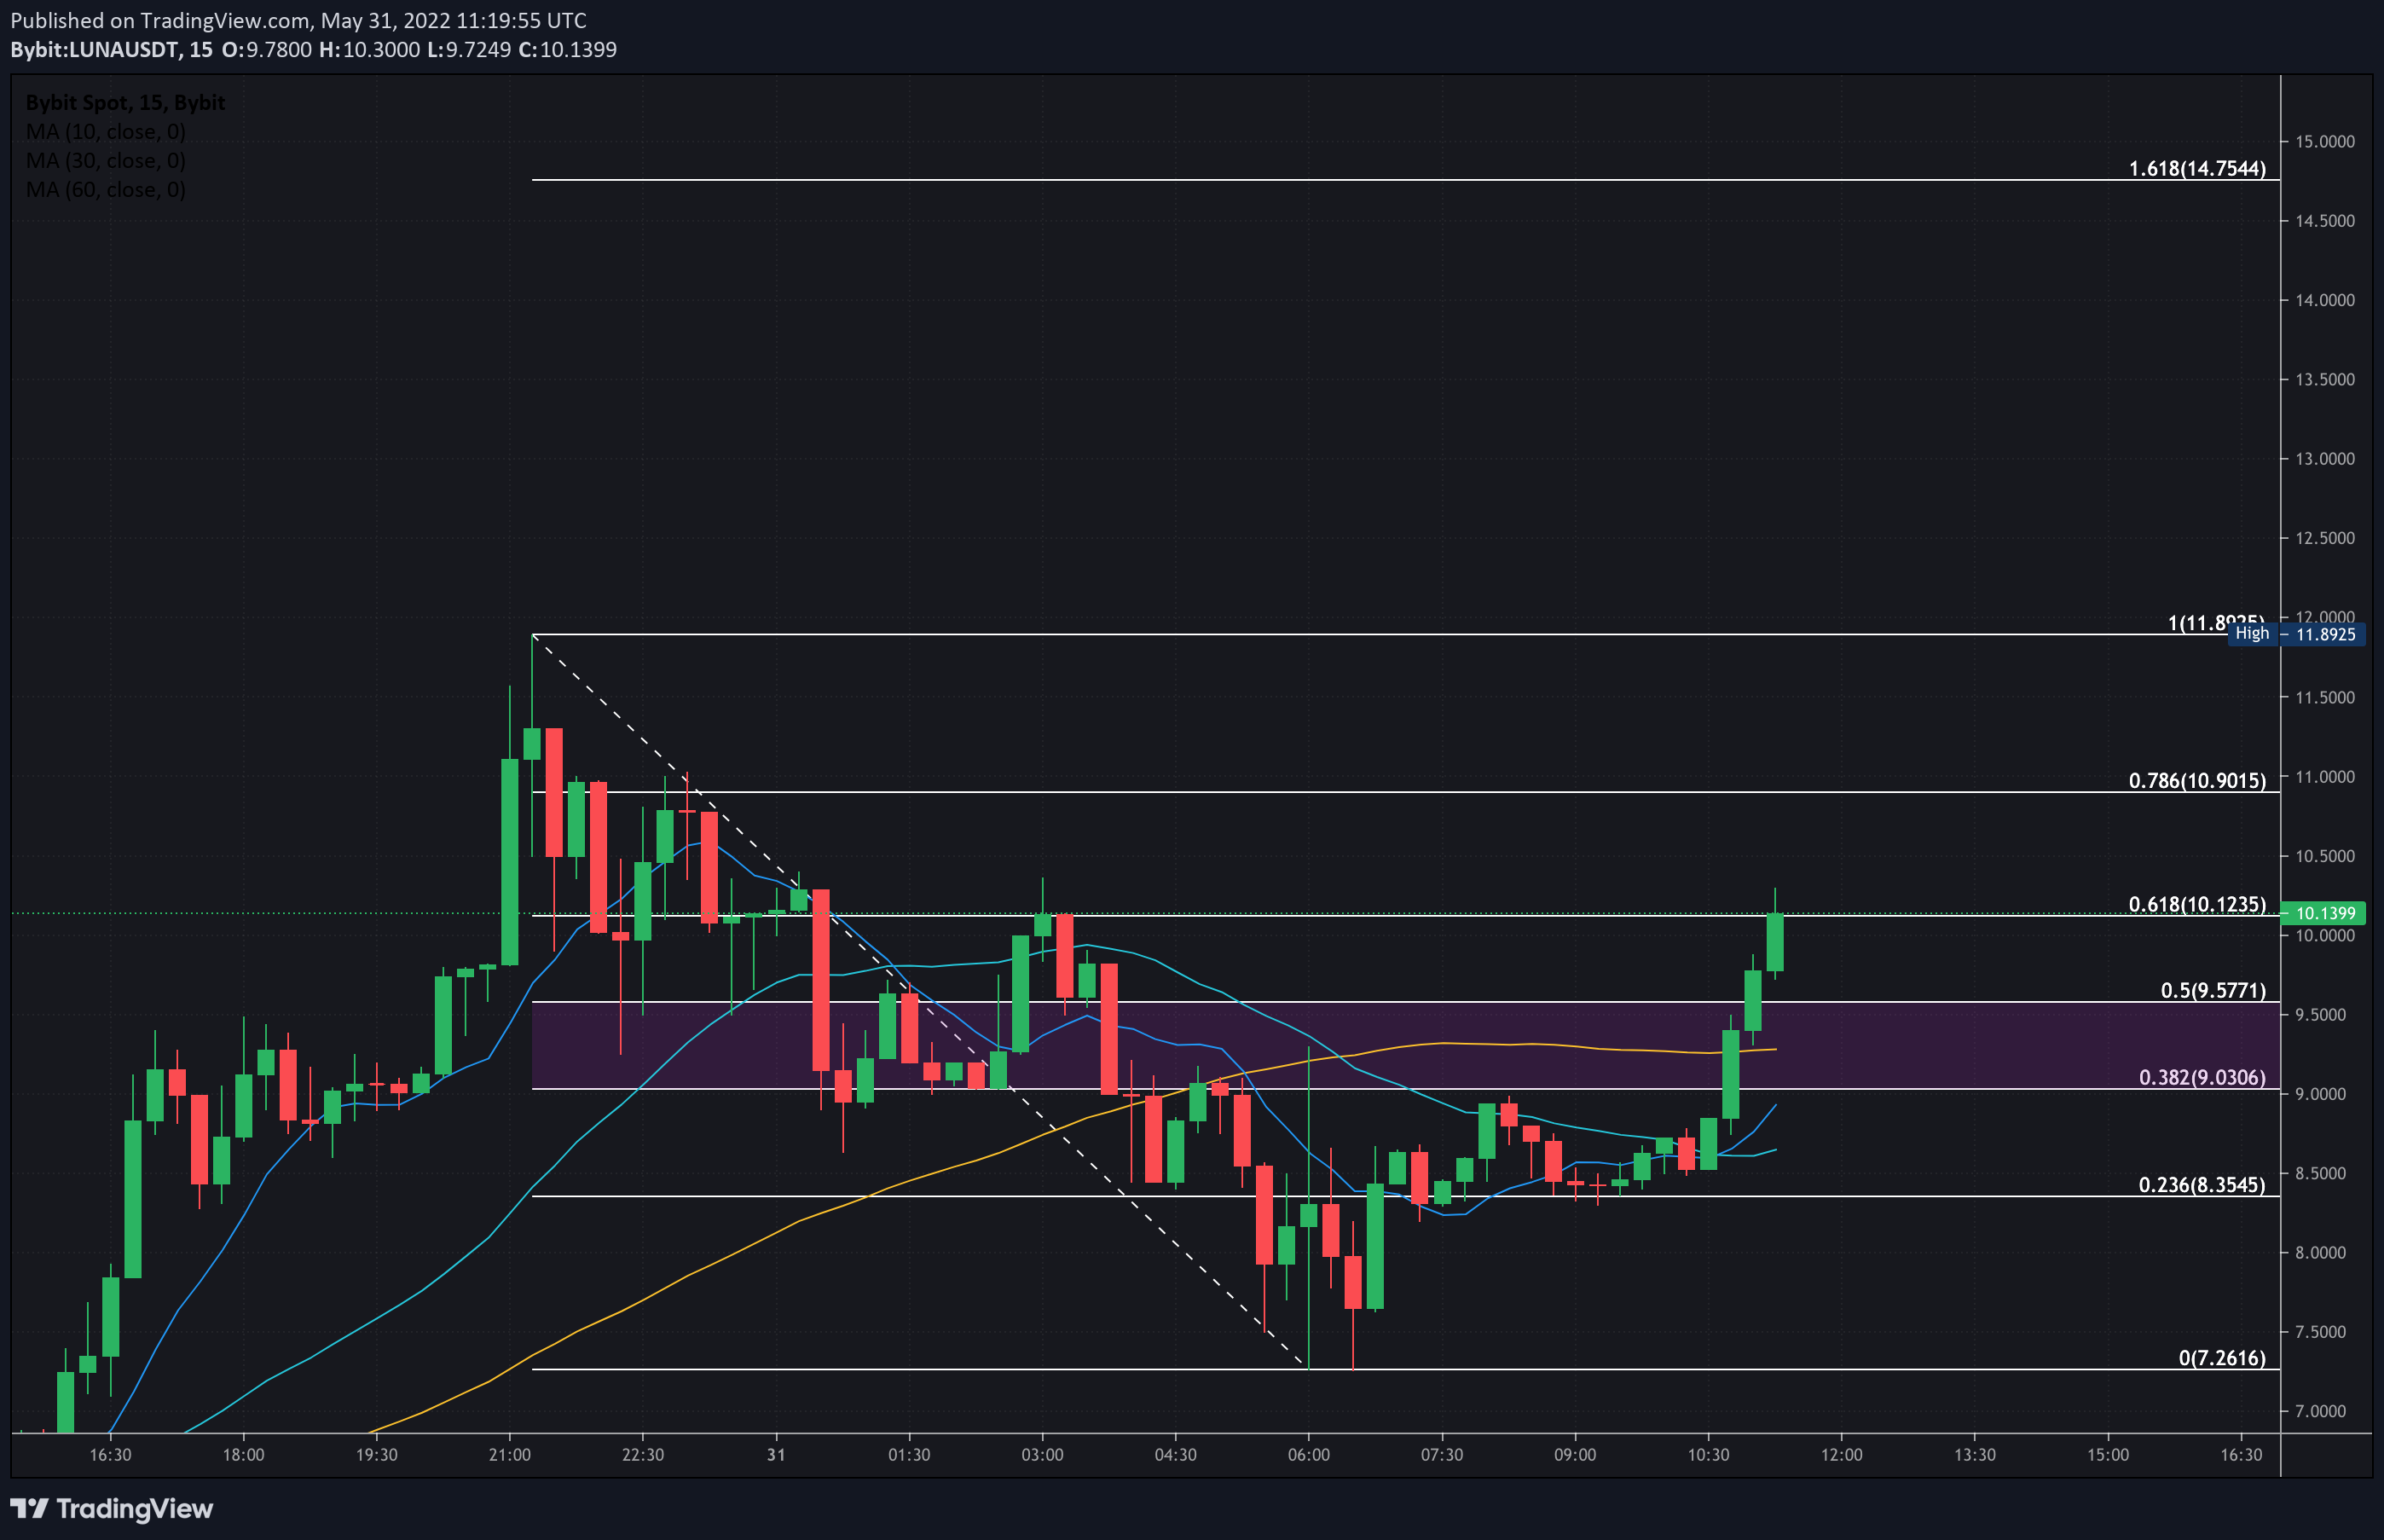
LUNA 15-min chart
Further buying pressure could help Terra’s LUNA 2.0 price make a higher high and advance toward $15.
These three altcoins have bullish potential
Analysts at FXStreet have evaluated altcoins after the recent rebound in prices, and identified three cryptocurrencies that could double traders’ portfolios.
Chile Industrial Production (YoY) dipped from previous 0.8% to -3.6% in April
231420 May 31, 2022 21:09 FXStreet Market News
Information on these pages contains forward-looking statements that involve risks and uncertainties. Markets and instruments profiled on this page are for informational purposes only and should not in any way come across as a recommendation to buy or sell in these assets. You should do your own thorough research before making any investment decisions. FXStreet does not in any way guarantee that this information is free from mistakes, errors, or material misstatements. It also does not guarantee that this information is of a timely nature. Investing in Open Markets involves a great deal of risk, including the loss of all or a portion of your investment, as well as emotional distress. All risks, losses and costs associated with investing, including total loss of principal, are your responsibility. The views and opinions expressed in this article are those of the authors and do not necessarily reflect the official policy or position of FXStreet nor its advertisers. The author will not be held responsible for information that is found at the end of links posted on this page.
If not otherwise explicitly mentioned in the body of the article, at the time of writing, the author has no position in any stock mentioned in this article and no business relationship with any company mentioned. The author has not received compensation for writing this article, other than from FXStreet.
FXStreet and the author do not provide personalized recommendations. The author makes no representations as to the accuracy, completeness, or suitability of this information. FXStreet and the author will not be liable for any errors, omissions or any losses, injuries or damages arising from this information and its display or use. Errors and omissions excepted.
The author and FXStreet are not registered investment advisors and nothing in this article is intended to be investment advice.
United States Housing Price Index (MoM) came in at 1.5% below forecasts (1.8%) in March
231419 May 31, 2022 21:09 FXStreet Market News
Information on these pages contains forward-looking statements that involve risks and uncertainties. Markets and instruments profiled on this page are for informational purposes only and should not in any way come across as a recommendation to buy or sell in these assets. You should do your own thorough research before making any investment decisions. FXStreet does not in any way guarantee that this information is free from mistakes, errors, or material misstatements. It also does not guarantee that this information is of a timely nature. Investing in Open Markets involves a great deal of risk, including the loss of all or a portion of your investment, as well as emotional distress. All risks, losses and costs associated with investing, including total loss of principal, are your responsibility. The views and opinions expressed in this article are those of the authors and do not necessarily reflect the official policy or position of FXStreet nor its advertisers. The author will not be held responsible for information that is found at the end of links posted on this page.
If not otherwise explicitly mentioned in the body of the article, at the time of writing, the author has no position in any stock mentioned in this article and no business relationship with any company mentioned. The author has not received compensation for writing this article, other than from FXStreet.
FXStreet and the author do not provide personalized recommendations. The author makes no representations as to the accuracy, completeness, or suitability of this information. FXStreet and the author will not be liable for any errors, omissions or any losses, injuries or damages arising from this information and its display or use. Errors and omissions excepted.
The author and FXStreet are not registered investment advisors and nothing in this article is intended to be investment advice.

US March Case-Shiller 20-city house price index +21.2% y/y vs +20.0% expected
231417 May 31, 2022 21:02 Forexlive Latest News Market News

- Prior was +20.2%
- Prices up % in the month +2.4% vs +2.0% expected
- Prior m/m rise +2.4%
FHFA data:
- National index 19.0% y/y vs 19.3% prior
- m/m +1.5% vs +1.9% prior
This is March data so it’s stale. There’s been a slowdown in April/May and housing-related stocks have been crushed on speculation about 2008-redux but I believe it’s far more likely we see a period of flat prices than a broad decline, though that seems to be a minority view.
Full Article
AUD/USD Price Analysis: Drops to fresh daily low around mid-0.7100s, 38.2% Fibo. level
231416 May 31, 2022 20:51 FXStreet Market News
- AUD/USD pulled back from a three-and-half-week high touched earlier this Tuesday.
- The risk-off impulse weighed on the risk-sensitive aussie amid resurgent USD demand.
- A sustained break below 0.7100 is needed to support prospects for additional losses.
The AUD/USD pair witnessed a modest pullback from a three-and-half-week high, levels just above the 0.7200 mark touched earlier this Tuesday and eroded a major part of the overnight gains. The pair maintained its offered tone through the early North American session and dropped to a fresh daily low, closer to mid-0.7100s in the last hour.
The overnight hawkish comments by Fed Governor Christopher Waller, along with a sharp spike in the US Treasury bond yields, assisted the US dollar to stage a solid rebound from over a one-month low. Apart from this, the worsening global economic outlook and the risk-on impulse further boost the safe-haven greenback and exerted some downward pressure on the risk-sensitive aussie.
Despite the negative factors, the AUD/USD pair, so far, has managed to hold its neck above the 38.2% Fibonacci retracement level of the 0.7662-0.6829 downfall. This is followed by the 0.7130 confluence support, comprising the 200-period SMA on the 4-hour chart and the lower boundary of an ascending channel extending from the YTD low touched earlier this month.
Given that technical indicators on daily/4-hour charts are still holding in the positive territory, the set-up favours bullish traders and supports prospects for the emergence of some dip-buying. That said, a convincing breakthrough the aforementioned confluence support will negate the positive outlook and shift the bias in favour of bearish traders, prompting some technical selling.
Some follow-through selling below the 0.7100 mark will reaffirm the bearish bias and drag spot prices to the 23.6% Fibo. level support, near the 0.7025-0.7020 region. The next relevant support is pegged near the 0.7000 psychological mark, below which the AUD/USD pair could slide to the 0.6940 area en-route the 0.6900 mark and the 0.6830-0.6825 region, or the YTD low.
On the flip side, a sustained move beyond the 0.7200 round figure is likely to confront resistance near the 100-day SMA, around the 0.7235-0.7245 region. The said barrier coincides with the 50% Fibo. level and is closely followed by the 200-day SMA, near the 0.7260 zone, which if cleared would be seen as a fresh trigger for bullish traders and pave the way for further gains.
AUD/USD 4-hour chart
-637895979162651610.png)