Articles
Terra price prediction: Is a dislocation between LUNA and the dollar about to happen?
253367 August 31, 2022 21:12 FXStreet Market News
- Terra price action is increasing intraday as market dynamics are shifting this Wednesday.
- LUNA price is set to pop higher as its price action starts to look decoupled from the US dollar.
- Expect to see a possible jump back to $0.0000115 in case $0.0000110 gets broken.
Terra (LUNA) price is set to jump massively on a technical breakdown in the correlation between LUNA price and the dollar. Usually the Terra price is inversely correlated with the dollar but at the moment the dollar index is up for the day and LUNA price action is gaining as well. With several central banks intervening and trying to break the strongness of the dollar, cryptocurrencies could see some more tailwinds emerge that should see LUNA price action push higher.
LUNA price set to jump 15%
Terra price action is a picture that could point to a big game changer in cryptocurrencies. During the European trading session, although the dollar index is stronger, the dollar itself is not up in all of its major pairs. Next to the yen and the yuan, for example, the dollar is weakening as several central banks are starting intervention to break the back of the greenback’s strength. This coordinated attack is triggering a decoupling in cryptocurrencies against the dollar, as LUNA price action jumps while the DXY gains points.
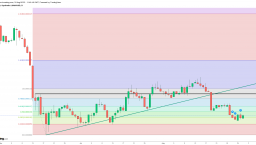
LUNA price could be set to move up quite rapidly as traders plot the Fibonacci levels and target them as possible profit taking and entry points. It would probably be best to go long either now or on a break above $0.000103, at the 50% Fibonacci level. From there, traders will want to strap in for the rally up towards $0.000115, which looks to be a given to be hit on the back of this big dislocation from the dollar.
LUNA/USD Daily chart
Risk to the downside, of course, comes with that same dollar strength as the dislocation from its usual correlation might be short-lived. In case the dollar reaffirms its grip on all major pairs, as well as cryptocurrencies, expect to see those pairs catch up on the counter move during the dislocated portion, which means more room to go to the downside. That would mean for Terra price, for example, a quick push back below $0.000100 towards $0.000095 or even $0.000088.
Full Article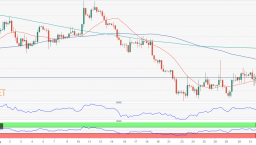
EUR/USD Forecast: Bears hesitate, but bulls nowhere to be found
253365 August 31, 2022 21:09 FXStreet Market News
EUR/USD Current Price: 1.0008
- The EU Harmonised Index of Consumer Prices rose by 9.1% YoY in August.
- The revamped ADP report showed that the US private sector added 132K positions in August.
- EUR/USD seesaws around parity without technical signs of a potential recovery.
The EUR/USD pair fell through parity during London trading hours, bottoming at 0.9970 and now battling to regain the 1.0000 mark. The American dollar gathered momentum on the back of risk aversion as stock markets turned back south following Tuesday’s gains. Government bond yields are rising, providing additional support to the greenback.
The EU reported that the Harmonised Index of Consumer Prices (HICP) rose by 9.1% YoY in August, up from 8.9% in July, while the core reading for the same period jumped to 4.3% from 4% in the previous month. Record readings had a limited impact on the EUR, as European Central Bank officials have moved ahead of the release and began jawboning about a more aggressive tightening over the weekend.
Across the pond, the US published the ADP report on private job creation, which showed the country created 132,000 new positions in August, well below the 288,000 expected. Additionally, MBA Mortgage Applications declined 3.7% in the week ended on August 26. The US will later release the August Chicago PMI, foreseen at 52 from 52.1 in the previous month.
EUR/USD short-term technical outlook
The EUR/USD pair maintains its bearish stance in the daily chart, developing below bearish moving averages. Technical indicators, in the meantime, remain well below their midlines, maintaining their downward slopes. Daily candles continue to have small bodies but hint at some selling hesitation below parity. An interim bottom could be close but is not yet confirmed.
In the near term, and according to the 4-hour chart, the pair is neutral. It is currently seesawing around a mildly bullish 20 SMA, while the longer moving averages keep heading south far above the current level. Technical indicators aim north, although the RSI remains stuck around its midline. The pair would need to extend its current recovery beyond 1.0050 to shrug off the negative stance, while below the daily low, an approach to the recent multi-year low is on the cards.
Support levels: 0.9970 0.9940 0.9895
Resistance levels: 1.0050 1.0090 1.0140
View Live Chart for the EUR/USD
Full Article
Chile Industrial Production (YoY) down to -5.1% in July from previous -1.5%
253364 August 31, 2022 21:09 FXStreet Market News
Information on these pages contains forward-looking statements that involve risks and uncertainties. Markets and instruments profiled on this page are for informational purposes only and should not in any way come across as a recommendation to buy or sell in these assets. You should do your own thorough research before making any investment decisions. FXStreet does not in any way guarantee that this information is free from mistakes, errors, or material misstatements. It also does not guarantee that this information is of a timely nature. Investing in Open Markets involves a great deal of risk, including the loss of all or a portion of your investment, as well as emotional distress. All risks, losses and costs associated with investing, including total loss of principal, are your responsibility. The views and opinions expressed in this article are those of the authors and do not necessarily reflect the official policy or position of FXStreet nor its advertisers. The author will not be held responsible for information that is found at the end of links posted on this page.
If not otherwise explicitly mentioned in the body of the article, at the time of writing, the author has no position in any stock mentioned in this article and no business relationship with any company mentioned. The author has not received compensation for writing this article, other than from FXStreet.
FXStreet and the author do not provide personalized recommendations. The author makes no representations as to the accuracy, completeness, or suitability of this information. FXStreet and the author will not be liable for any errors, omissions or any losses, injuries or damages arising from this information and its display or use. Errors and omissions excepted.
The author and FXStreet are not registered investment advisors and nothing in this article is intended to be investment advice.
OPEC continued to undershoot quotas in August but the shortfall narrowed
253363 August 31, 2022 21:05 Forexlive Latest News Market News
OPEC members in the current quota system undershot output targets by 1.4 million barrels per day in August compared to 1.3 mbpd in July but generally kept pace with the monthly quota increase.
Those in the quota system boosted output by 300k bpd in August (compared to +413K in the quota) with only the UAE hitting its full target. However Iraq production rose by 70k bpd in the month to narrow its quota miss to 131k bpd. At 10.85 mbpd, Saudi Arabia increased production by 100k bpd but is still producing 154k bpd shy of quota.
The biggest miss continues to be Nigeria, which is struggling with internal issues. It pumped 646k bpd less than quota though did increase output by 50kbpd in the month.
The main improvment in the month was from Libya, which is not subject to quotas. Its production rose 400k bpd to 1.1 mbpd as unrest cooled.
Overall, the 29.58 mbpd is the most since the start of the pandemic.
The data is based on shippers tracked by Reuters and is the survey tracked most by the market and OPEC itself. With OPEC’s quota rising by just 100k bpd in September, this is basically the end of the line for scheduled production increases and now it will be a question of ongoing execution.
WTI crude oil is up a bit since the data but is down badly over the past two days.
Canada: Annualized real GDP grows by 3.3% in Q2 vs. 4.5% expected
253362 August 31, 2022 21:05 FXStreet Market News
- Canadian economy expanded at a softer pace than expected in the second quarter.
- USD/CAD trades in positive territory above 1.3100 after the data.
Real Gross Domestic Product (GDP) in Canada expanded at an annualized rate of 3.3% in the second quarter, the data published by Statistics Canada showed on Wednesday. This print followed the 3.1% growth recorded in the first quarter and missed the market expectation of 4.5%.
On a quarterly basis, real GDP was up 0.8%. “Growth in the second quarter was moderated by declines in housing investment and household spending on durable goods and by a rise in imports that exceeded exports,” Statistics Canada noted in its publication. “Final domestic demand rose by 0.7%, following a 0.9% increase in the first quarter.”
Market reaction
The USD/CAD pair edged higher after this data and was last seen gaining 0.25% on the day at 1.3123.
Full Article
Canada Gross Domestic Product Annualized (QoQ) below forecasts (4.4%) in 2Q: Actual (3.3%)
253361 August 31, 2022 20:35 FXStreet Market News
Information on these pages contains forward-looking statements that involve risks and uncertainties. Markets and instruments profiled on this page are for informational purposes only and should not in any way come across as a recommendation to buy or sell in these assets. You should do your own thorough research before making any investment decisions. FXStreet does not in any way guarantee that this information is free from mistakes, errors, or material misstatements. It also does not guarantee that this information is of a timely nature. Investing in Open Markets involves a great deal of risk, including the loss of all or a portion of your investment, as well as emotional distress. All risks, losses and costs associated with investing, including total loss of principal, are your responsibility. The views and opinions expressed in this article are those of the authors and do not necessarily reflect the official policy or position of FXStreet nor its advertisers. The author will not be held responsible for information that is found at the end of links posted on this page.
If not otherwise explicitly mentioned in the body of the article, at the time of writing, the author has no position in any stock mentioned in this article and no business relationship with any company mentioned. The author has not received compensation for writing this article, other than from FXStreet.
FXStreet and the author do not provide personalized recommendations. The author makes no representations as to the accuracy, completeness, or suitability of this information. FXStreet and the author will not be liable for any errors, omissions or any losses, injuries or damages arising from this information and its display or use. Errors and omissions excepted.
The author and FXStreet are not registered investment advisors and nothing in this article is intended to be investment advice.
Canada Gross Domestic Product (MoM) in line with forecasts (0.1%) in June
253360 August 31, 2022 20:35 FXStreet Market News
Information on these pages contains forward-looking statements that involve risks and uncertainties. Markets and instruments profiled on this page are for informational purposes only and should not in any way come across as a recommendation to buy or sell in these assets. You should do your own thorough research before making any investment decisions. FXStreet does not in any way guarantee that this information is free from mistakes, errors, or material misstatements. It also does not guarantee that this information is of a timely nature. Investing in Open Markets involves a great deal of risk, including the loss of all or a portion of your investment, as well as emotional distress. All risks, losses and costs associated with investing, including total loss of principal, are your responsibility. The views and opinions expressed in this article are those of the authors and do not necessarily reflect the official policy or position of FXStreet nor its advertisers. The author will not be held responsible for information that is found at the end of links posted on this page.
If not otherwise explicitly mentioned in the body of the article, at the time of writing, the author has no position in any stock mentioned in this article and no business relationship with any company mentioned. The author has not received compensation for writing this article, other than from FXStreet.
FXStreet and the author do not provide personalized recommendations. The author makes no representations as to the accuracy, completeness, or suitability of this information. FXStreet and the author will not be liable for any errors, omissions or any losses, injuries or damages arising from this information and its display or use. Errors and omissions excepted.
The author and FXStreet are not registered investment advisors and nothing in this article is intended to be investment advice.
Canada Q2 GDP +3.3% vs +4.4% expected
253359 August 31, 2022 20:33 Forexlive Latest News Market News
- Prior was +3.1%
- GDP +0.8% q/q vs +0.8% prior
- Implicit price rise +3.3% q/q vs +2.9% prior (revised to +3.0%)
- GDP m/m +0.1% vs +0.1% expected
- Prior m/m reading 0.0%
USD/CAD is up 36 pips today to 1.3130 and this isn’t helping. But the main driver is the two-day plunge in oil prices. That’s continued today with crude down $2.56 to $89.08 or rumors of an Iran deal.
Full Article
Brazil Nominal Budget Balance registered at -22.498B above expectations (-36B) in June
253358 August 31, 2022 20:33 FXStreet Market News
Information on these pages contains forward-looking statements that involve risks and uncertainties. Markets and instruments profiled on this page are for informational purposes only and should not in any way come across as a recommendation to buy or sell in these assets. You should do your own thorough research before making any investment decisions. FXStreet does not in any way guarantee that this information is free from mistakes, errors, or material misstatements. It also does not guarantee that this information is of a timely nature. Investing in Open Markets involves a great deal of risk, including the loss of all or a portion of your investment, as well as emotional distress. All risks, losses and costs associated with investing, including total loss of principal, are your responsibility. The views and opinions expressed in this article are those of the authors and do not necessarily reflect the official policy or position of FXStreet nor its advertisers. The author will not be held responsible for information that is found at the end of links posted on this page.
If not otherwise explicitly mentioned in the body of the article, at the time of writing, the author has no position in any stock mentioned in this article and no business relationship with any company mentioned. The author has not received compensation for writing this article, other than from FXStreet.
FXStreet and the author do not provide personalized recommendations. The author makes no representations as to the accuracy, completeness, or suitability of this information. FXStreet and the author will not be liable for any errors, omissions or any losses, injuries or damages arising from this information and its display or use. Errors and omissions excepted.
The author and FXStreet are not registered investment advisors and nothing in this article is intended to be investment advice.
Brazil Primary Budget Surplus came in at 20.44B below forecasts (21.4B) in June
253357 August 31, 2022 20:33 FXStreet Market News
Information on these pages contains forward-looking statements that involve risks and uncertainties. Markets and instruments profiled on this page are for informational purposes only and should not in any way come across as a recommendation to buy or sell in these assets. You should do your own thorough research before making any investment decisions. FXStreet does not in any way guarantee that this information is free from mistakes, errors, or material misstatements. It also does not guarantee that this information is of a timely nature. Investing in Open Markets involves a great deal of risk, including the loss of all or a portion of your investment, as well as emotional distress. All risks, losses and costs associated with investing, including total loss of principal, are your responsibility. The views and opinions expressed in this article are those of the authors and do not necessarily reflect the official policy or position of FXStreet nor its advertisers. The author will not be held responsible for information that is found at the end of links posted on this page.
If not otherwise explicitly mentioned in the body of the article, at the time of writing, the author has no position in any stock mentioned in this article and no business relationship with any company mentioned. The author has not received compensation for writing this article, other than from FXStreet.
FXStreet and the author do not provide personalized recommendations. The author makes no representations as to the accuracy, completeness, or suitability of this information. FXStreet and the author will not be liable for any errors, omissions or any losses, injuries or damages arising from this information and its display or use. Errors and omissions excepted.
The author and FXStreet are not registered investment advisors and nothing in this article is intended to be investment advice.
United States ADP Employment Change below expectations (288K) in August: Actual (132K)
253356 August 31, 2022 20:29 FXStreet Market News
Information on these pages contains forward-looking statements that involve risks and uncertainties. Markets and instruments profiled on this page are for informational purposes only and should not in any way come across as a recommendation to buy or sell in these assets. You should do your own thorough research before making any investment decisions. FXStreet does not in any way guarantee that this information is free from mistakes, errors, or material misstatements. It also does not guarantee that this information is of a timely nature. Investing in Open Markets involves a great deal of risk, including the loss of all or a portion of your investment, as well as emotional distress. All risks, losses and costs associated with investing, including total loss of principal, are your responsibility. The views and opinions expressed in this article are those of the authors and do not necessarily reflect the official policy or position of FXStreet nor its advertisers. The author will not be held responsible for information that is found at the end of links posted on this page.
If not otherwise explicitly mentioned in the body of the article, at the time of writing, the author has no position in any stock mentioned in this article and no business relationship with any company mentioned. The author has not received compensation for writing this article, other than from FXStreet.
FXStreet and the author do not provide personalized recommendations. The author makes no representations as to the accuracy, completeness, or suitability of this information. FXStreet and the author will not be liable for any errors, omissions or any losses, injuries or damages arising from this information and its display or use. Errors and omissions excepted.
The author and FXStreet are not registered investment advisors and nothing in this article is intended to be investment advice.
USD/TRY inches higher and approaches 18.20
253355 August 31, 2022 20:26 FXStreet Market News
- USD/TRY extends the gradual march north to the 18.20 region.
- The better tone in the dollar lifts the pair to fresh YTD highs.
- Türkiye GDP expanded 7.6% YoY during the second quarter.
Further upside in the US dollar keeps USD/TRY near the 2022 tops in levels just shy of 18.20 on Wednesday.
USD/TRY still targets the all-time top around 18.25
In the meantime, the bullish bias is unlikely to abandon USD/TRY for the time being, with the immediate target at the all-time high around 18.25 (December 20 2021).
Furthermore, the pair posted gains in every month since the start of the year and the lira advanced in only one out of the last nine weeks vs. the dollar.
Positive news from the domestic docket also failed to lend some wings to the Turkish currency after GDP figures showed the economy expanded at an annualized 7.6% during the April-June period, surpassing expectations at the same time.
What to look for around TRY
The upside bias in USD/TRY remains unchanged and trades closer to the all-time high around 18.25. The uptrend in spot has been underpinned following the unexpected interest rate cut by the CBRT on August 18.
In the meantime, price action around the Turkish lira is expected to keep gyrating around the performance of energy and commodity prices – which are directly correlated to developments from the war in Ukraine – the broad risk appetite trends and the Fed’s rate path in the next months.
Extra risks facing the Turkish currency also come from the domestic backyard, as inflation gives no signs of abating (despite rising less than forecast in July), real interest rates remain entrenched well in negative territory and the political pressure to keep the CBRT biased towards low interest rates remains omnipresent.
In addition, there seems to be no other immediate alternative to attract foreign currency other than via tourism revenue, in a context where official figures for the country’s FX reserves remain surrounded by increasing skepticism among investors.
Key events in Türkiye this week: Economic Confidence Index, Trade Balance (Monday) – Q2 GDP (Wednesday) – Manufacturing PMI (Thursday).
Eminent issues on the back boiler: FX intervention by the CBRT. Progress of the government’s new scheme oriented to support the lira via protected time deposits. Constant government pressure on the CBRT vs. bank’s credibility/independence. Bouts of geopolitical concerns. Structural reforms. Presidential/Parliamentary elections in June 23.
USD/TRY key levels
So far, the pair is gaining 0.07% at 18.1741 and faces the immediate target at 18.1973 (2022 high August 29) seconded by 18.2582 (all-time high December 20) and then 19.00 (round level). On the other hand, a breach of 17.7586 (monthly low August 9) would pave the way for 17.5781 (55-day SMA) and finally 17.1903 (weekly low July 15).
Full Article