Articles

Why US inflation numbers need to start falling soon
381354 March 30, 2024 01:17 Forexlive Latest News Market News
Here is a great chart today from Jim Bianco who illustrates what will happen to year-over-year core PCE if it runs at 0.33% m/m, which is the two-year average.
It also highlights that a series of lower numbers will roll off, particularly in June, July and August.
The good news is that today’s PCE core number was +0.261%, which is already putting downward pressure on this projection.
It also shouldn’t be too big of a surprise that inflation will be high with 0.33% monthly inflation. That’s a pace that would imply 4% annual inflation.
Digging through the details of today’s inflation report, much of it is focused in health care. Could those be one-off increases? Or will they be persistent as they work their way through different providers?
Meanwhile, there has been some helpful disinflation in autos and food. But will that run out before the inflation in healthcare and auto repair does?
Full Article
Dallas Fed February trimmed mean PCE price index +3.4% vs +5.7% prior
381353 March 30, 2024 00:45 Forexlive Latest News Market News
The question here is: Do you take comfort in the step down from January or do you worry that core inflation is still above 3%?
- One month annualized trimmed mean 3.4% vs 5.7% prior
- Six month 3.1% vs 3.0% prior
- 12 month 3.1% vs 3.2% prior
One of the drivers of inflation (and a 5.15% weigh in the index) was a 1.4% m/m rise in ‘other purchased meals’, which highlights how tough it is to eat out.
Other notable components included:
- Physician services +1.8%
- Financial service charges, fees, and commissions +3.5%
- Nonprofit hospitals’ services to households +3.8%
- Government hospitals+3.8%
- Electricity +4.0%
- Motor vehicle maintenance and repair+4.8%
- Other purchased meals +4.1%
- Dental services +5.3%
Note the preponderance of rising health care costs.
Some sources of inflation trimmed out:
- Computer software and accessories +52.6%
- Shoes and other footwear +21.6%
- Net health insurance +15.5%
- Tenant-occupied stationary homes and landlord durables+5.7%
US oil output fell 6% in January — EIA
381352 March 30, 2024 00:33 Forexlive Latest News Market News
I don’t think this will come as a surprise to the oil market — which is closed today — but the EIA says the US crude production fell to 12.533 mbpd in January, a drop of 6% from December.
A good portion of that was due to cold weather freezeoffs but it also highlights producer discipline. Texas production fell 5% while in North Dakota it fell 13%.
That will likely bounce back in February but there is tentative evidence that the breakneck pace of 2022-23 production growth is done. If so, that should allow OPEC to slowly bring back barrels starting in H2.
Here’s a good chart to illustrate the shale treadmill.

EUR/JPY Price Analysis: Bears show signs of presence, long-term bullish stronghold remains unchallenged
381349 March 30, 2024 00:29 FXStreet Market News
- The daily chart reveals slightly bullish momentum, with RSI at 52, signifying resilient buying traction.
- Indicators in the hourly chart denote a mild downward trend, which could hint at a potential shift.
- Buyers must successfully maintain the main SMAs to mitigate bearish threats and ensure bullish continuation.
The EUR/JPY pair is currently trading at 163.13, exhibiting minimal losses. Despite the declines, the broader momentum remains bullish, but this sentiment remains finely balanced and open to fluctuations.
On the daily chart, the EUR/JPY pair indicates signs of a relatively positive to neutral momentum. The Relative Strength Index (RSI) has maneuvered within the positive territory over the most recent sessions, with the latest reading positioned at 52. This reading suggests a slightly bullish momentum, yet potentially susceptible to changes in market sentiment. Meanwhile, the red bar on the Moving Average Convergence Divergence (MACD) histogram suggests negative momentum, signaling that the sellers might be gearing up.
EUR/JPY daily chart

Shifting focus onto the hourly chart, fluctuations are more noticeable. The RSI values display a slight downward trend throughout the latest hours, reaching as low as 46. Alongside this, the consistently shrinking green bars of the MACD confirms the overall bearish momentum.
EUR/JPY hourly chart

In conclusion, while short-term indicators might show an inclination toward a sellers’ market, it’s important to note this is within a broader bullish context as seen on the daily chart. Buyers must step in and defend the 20-day SMA at 162.85 to leave the overall bullish trend intact.
Full Article
GBP/JPY Price Analysis: Holds steady around 191.00 amid thin liquidity conditions
381347 March 30, 2024 00:17 FXStreet Market News
- GBP/JPY hovers around 191.00, with trading subdued due to the Easter holiday.
- Technical indicators show potential for movement, with key levels at 191.57 and 190.74, marking immediate targets.
- Future direction hinges on breaking 192.00 resistance or 190.00 support.
On Friday, the GBP/JPY remained steady at around 191.00, almost flat, as the financial markets remained closed in observance of the Easter holiday. In the meantime, Fed Chair Jerome Powell crossed the newswires, saying that monetary policy is well placed to react to a range of different data paths.
GBP/JPY Price Analysis: Technical outlook
The daily chart suggests the GBP/JPY is trading sideways, capped on the upside by the Tenkan-Sen at 191.57. Since the pair fell below the latter, the exchange rate has remained beneath the 191.40 area, which has opened the door for further downside.
A push below 191.00 could pave the way for a deeper pullback. The next support would be the Kijun Sen at 190.74, followed by the March 25 wing low of 190.33. A breach of the latter would expose the next support level at 190.00.
On the other hand, if GBP/JPY stays afloat and rallies above the Tenkan-Sen, that would open the door to challenge 192.00. Further gains are seen above that level, with the 193.00 mark, followed by the current year-to-date (YTD) high of 193.53.
GBP/JPY Price Action – Daily Chart

Powell speech: Economy strong without question
381346 March 29, 2024 23:51 FXStreet Market News
Federal Reserve Chair Jerome Powell participates in a discussion at the Macroeconomics and Monetary Policy Conference, in San Francisco.
Key quotes:
Latest core inflation numbers real progress.
We expect inflation to move to 2% on sometimes bumpy path.
If our base case doesn’t happen, we would hold rates where they are for longer.
We don’t know where rates are going to go back to when this whole thing is over.
The economy is not suffering from this level of rates.
Economy strong without question. Possibility of a recession is not elevated now.
If we see unexpected weakness in labor market, that could draw a policy response.
We won’t make decisions based on political calendars or anything like that.
Market reaction
The US Dollar gains modest upward traction with Powell’s hawkish words. Thinned market conditions do to the widespread Easter Holiday limit price action.
Full Article
Powell speech: PCE inflation in line with expectations, no hurry to cut rates
381345 March 29, 2024 23:35 FXStreet Market News
Federal Reserve Chair Jerome Powell participates in a discussion at the Macroeconomics and Monetary Policy Conference, in San Francisco.
Key quotes:
My first thought on PCE was it came in line with expectations.
February reading is definitely more along lines of what we want to see.
Reducing rates too soon would be very disruptive.
Waiting too long could mean unneeded damage to economy and the labour market.
The economy is strong, no hurry to cut rates.
Make the right decisions is more important, we can handle whatever case.
Market reaction
The US Dollar ticked higher as an immediate reaction to his words, although the action is being limited by the Easter Holiday.
Full Article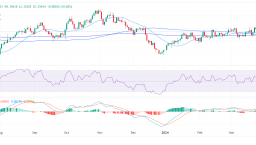
USD/CAD challenges the 20-day SMA following PCE data from the US
381343 March 29, 2024 23:26 FXStreet Market News
- US February’s PCE figures largely met expectations.
- Next week, the focus will be on Nonfarm payrolls for markets to continue placing their bets on the next Fed decisions.
- Hot data may justify a delay in policy rate cuts beyond June.
The USD/CAD pair is currently trading around the 1.3543 level on Friday, reflecting minor losses after hitting a high of 1.3560 earlier in the session. While investors digest Personal Consumption Expenditures (PCE) figures, the market will turn its attention toward forthcoming employment-related figures that may add further nuance to the Federal Reserve’s (Fed) posture on a probable policy rate delay.
The PCE Price Index, preferred by the Federal Reserve for gauging inflation in the US, saw a slight uptick to 2.5% annually in February, up from January’s 2.4%, meeting expectations. The monthly increase of 0.3% was slightly below the forecasted 0.4%. Core PCE, which excludes food and energy, also rose by 2.8% annually, aligning with predictions, with a 0.3% monthly increase. The upward revision of January’s core PCE figures suggests a continued trend of inflation, potentially prompting the Federal Reserve to maintain higher interest rates.
Future policy decisions will be influenced by incoming data, and the health of the labor market may potentially lead to adjustments in the timing and scale of rate cuts. Strong employment figures could prompt Fed policymakers to delay rate cuts beyond June and possibly reduce the number of cuts projected for 2024 from three to two, potentially bolstering the US Dollar. As for now, the strongest case scenario continues to be three rate cuts in 2024, starting in June.
USD/CAD technical analysis
On the daily chart, USD/CAD shows a somewhat stable trend. The Relative Strength Index (RSI) primarily maintains itself in positive territory, indicating that buying pressure slightly dominates the market. However, the Moving Average Convergence Divergence (MACD) histogram printed a new red bar which may imply a weak bullish momentum.
Analyzing the Simple Moving Average (SMA), it is seen that on a broader scale, despite showing a neutral outlook in the short term, the pair is above the 20,100,200-day SMAs. This suggests that the bulls command the overall trend, as long as the bulls defend the challenged 20-day average around the 1.3530 area.
USD/CAD daily chart
US Dollar locks in weekly gains ahead of Powell closing off this week
381342 March 29, 2024 23:26 FXStreet Market News
- The US Dollar still trades near the fresh high of March.
- Traders are enjoying a bank holiday despite the release of US economic data.
- The US Dollar Index has 105.00 still in reach despite small decline.
The US Dollar (USD) never sleeps and that proverb certainly applies to this Friday. The Greenback holds onto recent gains on Good Friday, a bank holiday during which European and US trading desks will be running at minimum capacity. Fireworks did not took place, with the US Dollar Index (DXY) rather flat.
That pivotal piece of data is the US Federal Reserve’s preferred inflation gauge: The Personal Consumption Expenditure Price Index (PCE). The numbers came in as much as expected withing range, with a small retreat in the monthly headline PCE number by 0.01% under estimate. Although he will not be bringing any Easter eggs, US Fed Chairman Jerome Powell is set to speak later this Friday and he may be bearing a surprise.
Daily digest market movers: Headline risk on Powell
- At 12:30 GMT the main data release to look out for:
- Personal Consumption Expenditures for February:
- Headline monthly PCE headed from 0.4% to 0.3%
- Headline yearly PCE went from 2.4% to 2.5%.
- Core monthly PCE went from 0.5% to 0.3%.
- The core yearly PCE Index ticked down from 2.9% to 2.8%.
- The US Goods trade balance for February came in at -$91.8 billion against -$ 90.5 billion in January.
- Personal Income slowed from 1% to only 0.3%.
- Personal Spending rose from 0.2% to 0.8%.
- Wholesale Inventories data for January inventories fell by 0.3%. and rose in February by 0.5%.
- Personal Consumption Expenditures for February:
- At 15:15 GMT, Federal Reserve Bank of San Francisco President Mary Daly will kick off the Federal Reserve Bank of San Francisco Macroeconomics and Monetary Policy Conference. She will be followed by a statement from Fed Chairman Jerome Powell at around 15:30 GMT.
- Equities will not be moving this Friday with both Europe and US markets closed.
- According to the CME Group’s FedWatch Tool, expectations for the Fed’s May 1 meeting are at 95.8% for keeping the fed funds rate unchanged, while chances of a rate cut are at 4.2%.
- The benchmark 10-year US Treasury Note trades around 4.20%, up from 4.18% earlier this week.
US Dollar Index Technical Analysis: Fed remains focused on June
The US Dollar Index (DXY) is making its way to a possible fresh high for March seeing its current positioning just below it at 104.72. The US Dollar bulls are clearly back in the game with a four-day winning streak for the Greenback. Although expectations around the PCE numbers are already in favor of an uptick, the magnitude of that uptick could fuel a substantial US Dollar rally amid exceptionally thin liquidity in markets.
That first pivotal level for the DXY at 104.60, where last week’s rally peaked, has been broken. Further up, 104.96 remains the level to beat in order to tackle 105.00. Once above there, 105.12 is the last resistance point for now before the Relative Strength Index (RSI) will trade in overbought levels.
Support from the 200-day Simple Moving Average (SMA) at 103.75, the 100-day SMA at 103.48, and the 55-day SMA at 103.72 are unable to show their importance as support because traders didn’t wait for a drop to those levels for a turnaround. The 103.00 big figure looks to remain unchallenged for longer, after the decline in the wake of the Fed meeting last week got turned around way before reaching it.
Fed FAQs
Monetary policy in the US is shaped by the Federal Reserve (Fed). The Fed has two mandates: to achieve price stability and foster full employment. Its primary tool to achieve these goals is by adjusting interest rates. When prices are rising too quickly and inflation is above the Fed’s 2% target, it raises interest rates, increasing borrowing costs throughout the economy. This results in a stronger US Dollar (USD) as it makes the US a more attractive place for international investors to park their money. When inflation falls below 2% or the Unemployment Rate is too high, the Fed may lower interest rates to encourage borrowing, which weighs on the Greenback.
The Federal Reserve (Fed) holds eight policy meetings a year, where the Federal Open Market Committee (FOMC) assesses economic conditions and makes monetary policy decisions. The FOMC is attended by twelve Fed officials – the seven members of the Board of Governors, the president of the Federal Reserve Bank of New York, and four of the remaining eleven regional Reserve Bank presidents, who serve one-year terms on a rotating basis.
In extreme situations, the Federal Reserve may resort to a policy named Quantitative Easing (QE). QE is the process by which the Fed substantially increases the flow of credit in a stuck financial system. It is a non-standard policy measure used during crises or when inflation is extremely low. It was the Fed’s weapon of choice during the Great Financial Crisis in 2008. It involves the Fed printing more Dollars and using them to buy high grade bonds from financial institutions. QE usually weakens the US Dollar.
Quantitative tightening (QT) is the reverse process of QE, whereby the Federal Reserve stops buying bonds from financial institutions and does not reinvest the principal from the bonds it holds maturing, to purchase new bonds. It is usually positive for the value of the US Dollar.

USD/MXN tumbles post US Core PCE figures, eyes on Fed’s Powell
381340 March 29, 2024 23:17 FXStreet Market News
- USD/MXN falls to 16.57, as the latest US inflation report met forecasts, offering no new impetus for market shifts.
- Fed officials, including Governor Waller, signal a cautious approach to rate cuts, underlining vigilance over inflation trends.
- Investors await further guidance from upcoming Fed speeches..
The Mexican Peso (MXN) posted modest gains against the US Dollar (USD) on Friday after the release of inflation data in the United States (US). The Federal Reserve’s (Fed) preferred gauge for inflation, the Core Personal Consumption Expenditure (PCE) price index, met estimates, though it failed to trigger any reaction in the financial markets. The USD/MXN trades at 16.57, down 0.31%.
USD/MXN dips as US inflation aligns with expectations
The US Bureau of Economic Analysis (BEA) reported that February’s Core PCE increased by 0.3% month-over-month, coming in lower than the prior month’s figures. On an annual basis, the core PCE cooled slightly from 2.9% to 2.8%, aligning with consensus estimates. The headline inflation rate for February also stood at 0.3%, below January’s projections, while the year-over-year figure edged up to 2.5% from 2.4%.
Despite somewhat easing inflation, Federal Reserve policymakers remain vigilant. Other inflation metrics, such as the Consumer Price Index (CPI) and the Producer Price Index (PPI), indicate that price pressures could be anchoring above 3%.
Aside from this, traders took some cues from Fed Governor Christopher Waller. He was hawkish, emphasizing that the Fed is not in a hurry to reduce interest rates. The US economic docket will feature San Francisco Fed President Mary Daly and Fed Chair Jerome Powell at 15:20 and 15:30 GMT.
On the Mexican front, the docket will feature the Mexican Ministry of Finance’s release of the fiscal balance. Traders are eyeing next week’s S&P Global Manufacturing PMI for March.
USD/MXN Price Analysis: Technical outlook
The USD/MXN trimmed some of its gains today as buyers failed to conquer last year’s low of 16.62. That has opened the door for a pullback, as sellers eye October’s 2015 low of 16.32 ahead of challenging 16.00. On the flip side, if buyers lift the exchange rate above 16.62, that will expose January’s monthly low of 16.78, followed by the March 19 high at 16.94. Next would be the 50-day Simple Moving Average (SMA) at 16.97.

Mexican Peso FAQs
The Mexican Peso (MXN) is the most traded currency among its Latin American peers. Its value is broadly determined by the performance of the Mexican economy, the country’s central bank’s policy, the amount of foreign investment in the country and even the levels of remittances sent by Mexicans who live abroad, particularly in the United States. Geopolitical trends can also move MXN: for example, the process of nearshoring – or the decision by some firms to relocate manufacturing capacity and supply chains closer to their home countries – is also seen as a catalyst for the Mexican currency as the country is considered a key manufacturing hub in the American continent. Another catalyst for MXN is Oil prices as Mexico is a key exporter of the commodity.
The main objective of Mexico’s central bank, also known as Banxico, is to maintain inflation at low and stable levels (at or close to its target of 3%, the midpoint in a tolerance band of between 2% and 4%). To this end, the bank sets an appropriate level of interest rates. When inflation is too high, Banxico will attempt to tame it by raising interest rates, making it more expensive for households and businesses to borrow money, thus cooling demand and the overall economy. Higher interest rates are generally positive for the Mexican Peso (MXN) as they lead to higher yields, making the country a more attractive place for investors. On the contrary, lower interest rates tend to weaken MXN.
Macroeconomic data releases are key to assess the state of the economy and can have an impact on the Mexican Peso (MXN) valuation. A strong Mexican economy, based on high economic growth, low unemployment and high confidence is good for MXN. Not only does it attract more foreign investment but it may encourage the Bank of Mexico (Banxico) to increase interest rates, particularly if this strength comes together with elevated inflation. However, if economic data is weak, MXN is likely to depreciate.
As an emerging-market currency, the Mexican Peso (MXN) tends to strive during risk-on periods, or when investors perceive that broader market risks are low and thus are eager to engage with investments that carry a higher risk. Conversely, MXN tends to weaken at times of market turbulence or economic uncertainty as investors tend to sell higher-risk assets and flee to the more-stable safe havens.
US Core PCE inflation at 2.8% YoY backs the Fed’s case of higher-for-longer
381339 March 29, 2024 23:05 FXStreet Market News
Inflation in the US, as measured by the change in Personal Consumption Expenditures (PCE) Price Index, ticked higher to 2.5% on a yearly basis in February, the US Bureau of Economic Analysis reported on Friday. This reading followed the 2.4% increase recorded in January and came in line with the market expectation. On a monthly basis, the PCE Price Index rose 0.3% slightly below the 0.4% expected.
The core PCE Price Index, which excludes volatile food and energy prices, rose 2.8% on a yearly basis, matching analysts’ estimate, while the monthly figure posted 0.3% as anticipated. January core PCE Price Index was upwardly revised to 2.9% YoY and 0.5% MoM.
Market reaction to PCE inflation data
A widespread Easter Holiday limited the market’s reaction to US inflation figures. The US Dollar came under mild selling pressure with the news, although is set to close March with substantial gains. Despite the limited intraday reaction, the news paints a gloomy picture for those being on upcoming rate cuts in the US. The January upward revision and the February gauges suggest the Federal Reserve has a good case in keeping rates higher for longer. Investors will be looking for employment-related figures next week and will assess it alongside these inflation numbers. In the end, macro data may result in policymakers delaying a cut beyond June or proceeding with just two timid 25 basis points (bps) cuts through 2024. Stock futures ticked lower with the news, reflecting fresh concerns.
(This story was corrected on March 29 at 12:35 GMT to say that the annual PCE Price Index ticked higher to 2.5% in February, not 25%.)
US Dollar price this month
The table below shows the percentage change of US Dollar (USD) against listed major currencies this month. US Dollar was the weakest against the Australian Dollar.
| USD | EUR | GBP | CAD | AUD | JPY | NZD | CHF | |
| USD | 0.04% | -0.08% | -0.23% | -0.54% | 0.76% | 1.62% | 1.86% | |
| EUR | -0.05% | -0.13% | -0.30% | -0.59% | 0.73% | 1.57% | 1.82% | |
| GBP | 0.08% | 0.12% | -0.17% | -0.46% | 0.85% | 1.70% | 1.94% | |
| CAD | 0.24% | 0.30% | 0.18% | -0.23% | 0.97% | 1.88% | 2.11% | |
| AUD | 0.54% | 0.58% | 0.45% | 0.28% | 1.30% | 2.14% | 2.38% | |
| JPY | -0.74% | -0.74% | -0.82% | -1.02% | -1.14% | 0.89% | 1.14% | |
| NZD | -1.62% | -1.61% | -1.71% | -1.89% | -2.04% | -0.90% | 0.24% | |
| CHF | -1.87% | -1.86% | -1.96% | -2.14% | -2.37% | -1.16% | -0.22% |
The heat map shows percentage changes of major currencies against each other. The base currency is picked from the left column, while the quote currency is picked from the top row. For example, if you pick the Euro from the left column and move along the horizontal line to the Japanese Yen, the percentage change displayed in the box will represent EUR (base)/JPY (quote).
This section below was published as a preview of the US core PCE Price Index data at 06:00 GMT.
- The core Personal Consumption Expenditures Price Index is set to rise 0.3% MoM and 2.8% YoY in February.
- Markets see a strong chance of the Federal Reserve lowering the policy rate by 25 basis points in June.
- The revised Summary of Projections showed that policymakers upwardly revised end-2024 core PCE forecast to 2.6% from 2.4%.
The core Personal Consumption Expenditures (PCE) Price Index, the US Federal Reserve’s (Fed) preferred inflation measure, will be published on Friday by the US Bureau of Economic Analysis (BEA) at 12:30 GMT.
What to expect in the Federal Reserve’s preferred PCE inflation report?
The core PCE Price Index, which excludes volatile food and energy prices, is seen as the more influential measure of inflation in terms of Fed positioning. The index is forecast to rise 0.3% on a monthly basis in February, at a slightly softer pace than the 0.4% increase recorded in January. February core PCE is also projected to grow at an annual pace of 2.8%, matching the previous reading. The headline PCE inflation is forecast to tick up to 2.5% (YoY).
The Federal Reserve’s revised Summary of Economic Projections (SEP), also known as the dot plot– published alongside the policy statement after the March meeting – showed that policymakers expect the annual core PCE inflation to be at 2.6% at the end of 2024, up from the 2.4% forecast seen in the December SEP.
When commenting on the policy outlook in the post-meeting press conference, Fed Chairman Jerome Powell reiterated that they need greater confidence of inflation moving sustainably down toward the 2% target before they start lowering the policy rate. Powell, however, argued that strong inflation numbers in January were impacted by seasonal effects.
Previewing the PCE inflation report, “Given still robust increases in the Feb CPI/PPI data, we look for another firm gain for the core PCE — though notably down from January’s 0.42% increase and from the core CPI’s 0.36% m/m February gain,” said Oscar Munoz, Chief US Macro Strategist at TD Securities, in a weekly report.
When will the PCE inflation report be released, and how could it affect EUR/USD?
The PCE inflation data is slated for release at 12:30 GMT. The monthly core PCE Price Index gauge is the most-preferred inflation reading by the Fed, as it’s not distorted by base effects and provides a clear view of underlying inflation by excluding volatile items. Investors, therefore, pay close attention to the monthly core PCE figure.
Stronger-than-forecast Consumer Price Index (CPI) and Producer Price Index (PPI) readings in January and February, combined with data that pointed to tight labor market conditions, caused markets to lean toward a delay in the Fed policy pivot from May to June. Nevertheless, the dot plot showed that policymakers still project the US central bank to cut the policy rate by a total of 75 basis points (bps) in 2024. Hence, markets are pricing in a more than 60% chance that the Fed will lower the policy rate by 25 bps to 5%-5.25% in June, according to the CME FedWatch Tool.
It will be tricky to assess the immediate impact of the PCE data on the US Dollar’s (USD) valuation because trading conditions will be thin on Easter Friday.
Even if the monthly core PCE Price Index rises at a stronger pace than expected, it might not be enough to cause investors to reassess the possibility of another policy hold in June. Nevertheless, it could still provide a boost to the USD, with markets doubting the size of the total reduction in the policy rate.
On the other hand, an increase of 0.2% or less in the monthly Core PCE Price Index could weigh on the USD. In this scenario, a bearish opening in the 10-year US yield could be seen when the bond market returns to action at the weekly opening next Monday.
FXStreet Analyst Eren Sengezer offers a brief technical outlook for EUR/USD and explains:
“The 200-day Simple Moving Average (SMA) and the 100-day SMA form a strong resistance for EUR/USD at 1.0830. As long as this level stays intact as resistance, technical sellers could look to retain control. On the downside, 1.0760 (Fibonacci 78.6% retracement of the October-December uptrend) aligns as next support before 1.0700 (Fibonacci 61.8% retracement). In case EUR/USD manages to reclaim 1.0830, buyers could take action and open the door for an extended rebound toward 1.0900 (psychological level, static level) and 1.0950 (Fibonacci 23.6% retracement).
Fed FAQs
Monetary policy in the US is shaped by the Federal Reserve (Fed). The Fed has two mandates: to achieve price stability and foster full employment. Its primary tool to achieve these goals is by adjusting interest rates. When prices are rising too quickly and inflation is above the Fed’s 2% target, it raises interest rates, increasing borrowing costs throughout the economy. This results in a stronger US Dollar (USD) as it makes the US a more attractive place for international investors to park their money. When inflation falls below 2% or the Unemployment Rate is too high, the Fed may lower interest rates to encourage borrowing, which weighs on the Greenback.
The Federal Reserve (Fed) holds eight policy meetings a year, where the Federal Open Market Committee (FOMC) assesses economic conditions and makes monetary policy decisions. The FOMC is attended by twelve Fed officials – the seven members of the Board of Governors, the president of the Federal Reserve Bank of New York, and four of the remaining eleven regional Reserve Bank presidents, who serve one-year terms on a rotating basis.
In extreme situations, the Federal Reserve may resort to a policy named Quantitative Easing (QE). QE is the process by which the Fed substantially increases the flow of credit in a stuck financial system. It is a non-standard policy measure used during crises or when inflation is extremely low. It was the Fed’s weapon of choice during the Great Financial Crisis in 2008. It involves the Fed printing more Dollars and using them to buy high grade bonds from financial institutions. QE usually weakens the US Dollar.
Quantitative tightening (QT) is the reverse process of QE, whereby the Federal Reserve stops buying bonds from financial institutions and does not reinvest the principal from the bonds it holds maturing, to purchase new bonds. It is usually positive for the value of the US Dollar.
GBP/USD Weekly Forecast: Pound Sterling consolidates before the next leg lower
381337 March 29, 2024 23:02 FXStreet Market News
- The Pound Sterling consolidated its correction from seven-month highs against the US Dollar.
- GBP/USD looks vulnerable heading into another holiday-shortened week.
- The Pound Sterling could keep an eye on 1.2400, with a bearish channel in play and RSI below 50.00.
The Pound Sterling (GBP) remained defensive against the US Dollar (USD) for the third consecutive week, as the GBP/USD entered a downside consolidation phase below 1.2700.
Pound Sterling suffers from renewed USD demand
The US Dollar extended its late last week’s recovery momentum against its major counterparts, although a holiday-shortened week and an end to the first quarter of 2024 left GBP/USD restricted in a 100-pips range during the week.
The rekindling of geopolitical tensions between Russia and Ukraine combined with fairly hawkish commentaries from US Federal Reserve (Fed) policymakers continued to support the US Dollar.
Of the Fedspeak, Fed Governor Christopher Waller’s comments stood out, as Waller said early Thursday that “there is no rush to cut the policy rate,” adding that the “Fed may need to maintain current rate target for longer than expected.” Chicago Fed President Austan Goolsbee said on Monday that they are “in a bit of a murky period,” as “the main puzzle with inflation is housing.”
Markets are now pricing about a 64% probability that the Fed will begin cutting rates in June, according to CMEGroup’s FedWatch Tool, down from a 70% chance seen at the start of the week.
On the other hand, the Pound Sterling failed to capitalize on hawkish remarks from the Bank of England (BoE) officials. BoE policymaker Catherine Mann noted on Tuesday that “markets are pricing in too many cuts to rates.” Meanwhile, the BoE rate-setter Jonathan Haskel warned against rushing to cut interest rates on Thursday.
On the data front, US Durable Goods Orders released on Tuesday show a 1.4% rise in February, against the 6.9% slump reported in January. The annualized US Gross Domestic Product (GDP) was revised upward on Thursday from 3.2% to 3.4% in the fourth quarter. On Friday, the US Personal Consumption Expenditures (PCE) Price Index rose at an annual rate of 2.5% in February, as expected, while the Fed’s preferred inflation measure, the core PCE Price Index, grew at a slightly slower pace of 2.8% YoY in the same period after January’s upward revision to 2.9%.
Besides economic statistics, the main fundamental driver behind the Greenback’s resilience was the price action around the USD/JPY pair. Heightened risks of Japan’s forex market intervention smashed the Japanese Yen to a 34-year low against the US Dollar. In turn, it put a lid on the GBP/USD upside attempts.
Easter Monday makes up for a light week ahead
Pound Sterling traders head into another holiday-shortened week, as most major economies celebrate Easter Monday. Also, clocks move backward in the United Kingdom to summer time.
However, the United States will report the S&P Global final Manufacturing PMI, followed by the ISM Manufacturing PMI on Monday. Tuesday will feature the final Manufacturing PMI from the UK and the closely watched US JOLTS Job Openings survey findings.
Wednesday’s ADP Employment Change data and the ISM Services PMI report are also likely to hog the limelight ahead of the high-impact Nonfarm Payrolls data on Friday.
In the meantime, GBP/USD will take some cues from the US weekly Jobless Claims data, as the UK economic calendar remains data-dry that day.
Apart from these statistics on both sides of the Atlantic, speeches from several Fed policymakers will continue to influence the Fed interest rate expectations, eventually impacting the value of the US Dollar and the currency pair.
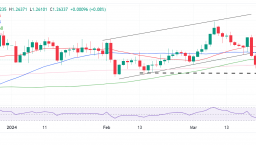
GBP/USD: Technical Outlook
From a short-term technical perspective, GBP/USD is likely to extend the downside break from the rising channel into another week, as the 14-day Relative Strength Index (RSI) continues to hold below the midline near 40.00, pointing to more weakness ahead.
However, Pound Sterling sellers need to crack the horizontal 200-day Simple Moving Average (SMA) at 1.2589 on a decisive basis to resume the correction from seven-month highs in GBP/USD.
Acceptance below the latter will expose the mid-February low near 1.2540, followed by the 1.2500 round figure. If the selling pressure intensifies on a break below the latter, a test of the 1.2400 mark cannot be ruled out.
Should the 1.2540 support area hold the fort, GBP/USD could attempt a decent comeback toward the confluence zone of the 100-day and 50-day SMA around 1.2660.
The next topside target is seen at the channel-support-turned resistance at 1.2700. Further up, the pair could run into offers at the 21-day SMA at 1.2720. A sustained move above it will challenge the weekly top at 1.2803.
Pound Sterling FAQs
The Pound Sterling (GBP) is the oldest currency in the world (886 AD) and the official currency of the United Kingdom. It is the fourth most traded unit for foreign exchange (FX) in the world, accounting for 12% of all transactions, averaging $630 billion a day, according to 2022 data. Its key trading pairs are GBP/USD, aka ‘Cable’, which accounts for 11% of FX, GBP/JPY, or the ‘Dragon’ as it is known by traders (3%), and EUR/GBP (2%). The Pound Sterling is issued by the Bank of England (BoE).
The single most important factor influencing the value of the Pound Sterling is monetary policy decided by the Bank of England. The BoE bases its decisions on whether it has achieved its primary goal of “price stability” – a steady inflation rate of around 2%. Its primary tool for achieving this is the adjustment of interest rates. When inflation is too high, the BoE will try to rein it in by raising interest rates, making it more expensive for people and businesses to access credit. This is generally positive for GBP, as higher interest rates make the UK a more attractive place for global investors to park their money. When inflation falls too low it is a sign economic growth is slowing. In this scenario, the BoE will consider lowering interest rates to cheapen credit so businesses will borrow more to invest in growth-generating projects.
Data releases gauge the health of the economy and can impact the value of the Pound Sterling. Indicators such as GDP, Manufacturing and Services PMIs, and employment can all influence the direction of the GBP. A strong economy is good for Sterling. Not only does it attract more foreign investment but it may encourage the BoE to put up interest rates, which will directly strengthen GBP. Otherwise, if economic data is weak, the Pound Sterling is likely to fall.
Another significant data release for the Pound Sterling is the Trade Balance. This indicator measures the difference between what a country earns from its exports and what it spends on imports over a given period. If a country produces highly sought-after exports, its currency will benefit purely from the extra demand created from foreign buyers seeking to purchase these goods. Therefore, a positive net Trade Balance strengthens a currency and vice versa for a negative balance.