Articles

ForexLive Asia-Pacific FX news wrap NVDA $5.5bn bombshell, China data solid, BOJ May hold?
415166 April 16, 2025 11:00 Forexlive Latest News Market News
- Federal Reserve Chair Powell speaks on the economic outlook today, Wednesday, April 16
- Morgan Stanley cuts outlook for China and Asia stock indexes
- China’s fighting words on Trump’s tariffs – world economic order has been severely damaged
- China Industrial Output March 2025 surges to +7.7% y/y (expected 5.8%, prior +5.9%)
- China Q1 GDP +1.2% q/q (expected +1.4%)
- Tesla’s plans to ship Cybercab & Semi electric truck parts from China to US suspended
- China March new home prices -0.08% m/m (prior -0.1%) and -4.6% y/y (prior -4.8%)
- PBOC sets USD/ CNY reference rate for today at 7.2133 (vs. estimate at 7.3272)
- Gold continues to surge, record high hit above US$3271
- Hong Kong suspends postal service for good bound for US – refuses to collect tariffs
- Australia March Westpac Leading Index – “softens as tariff chaos starts to weigh”
- US Treas Sec Bessent to meet South Korea’s fin min Choi next week to discuss trade issues
- ANZ raised its year-end forecast for gold price to $3,600 per ounce
- ANZ forecasts the RBNZ will cut its cash rate to 2.5% by October 2025
- Japan data: February Core Machinery Orders +1.5% y/y (expected -0.9%, prior +4.4%)
- Outlook for (US ) Empire State Manufacturing Survey to second lowest reading in 20 years
- U.S. plans to use tariff negotiations to isolate China (Wall Street Journal piece)
- Japan Reuters Tankan – Manufacturing index +9 in April from -1 in March
- JP Morgan says it turns bearish on base metals prices in the near-term
- Bank of Japan Governor Ueda says may need policy response to Trump tariffs
- Trump has launched a probe into the need for tariffs on critical minerals
- US government has indefinitely banned Nvidia from selling H20 chips to China
- US chip equipment makers calculate Trump tariffs could cost them more than US$1bn a year
- Moreon this: Fed independence fears continue to simmer amid Supreme Court labor board case
- ICYMI – BoA CFO says doesn’t believe we’ll see a recession
- Oil – private survey of inventory shows a headline crude oil build vs, draw expected
- Forexlive Americas FX news wrap 15 Apr: Another quiet day ahead of Chair Powell tomorrow.
- Trump says tariff pause because it’s a transition
- Trade ideas thread – Wednesday, 16 April, insightful charts, technical analysis, ideas
A bombshell Nvidia developments, better-than-expected Chinese economic data and a cautious Bank of Japan Governor were the highlights of the session. Those and the surging gold price.
An early most jarring development came from Nvidia, which said it will take a US$5.5 billion charge this quarter after the U.S. government imposed an indefinite ban on exports of its H20 chips to China. Part of new licensing requirements for sales to China and other nations. The news sent Nvidia shares sharply lower in after-hours trade, dragging down S&P 500 and Nasdaq futures.
Compounding the tech pressure, a Reuters report suggested that major three U.S. chip equipment makers each stand to lose around $350 million annually due to the Trump administration’s tariffs, while smaller players could also face millions in extra costs.
In monetary policy, Bank of Japan Governor Kazuo Ueda told Sankei that Trump’s tariffs have pushed the economy close to a BoJ ‘bad scenario’, warning that the central bank may need to respond if the impact worsens. While reiterating the BOJ’s data-dependence, he signaled a rate hike in May is now less likely (that’s my take on his remarks, you may find different), adding that both upside and downside risks to inflation are under close watch.
China’s Q1 GDP grew 5.4% year-on-year, matching the previous quarter and exceeding expectations. The surprise beat was accompanied by March data showing strong, much stronger than expected, retail sales and industrial output, though economists caution the full weight of U.S. tariffs has yet to be felt. Chinese officials are widely expected to unveil further stimulus measures in coming months to soften the blow and safeguard jobs.
On the Chinese currency front, the PBOC set the yuan reference rate at 7.2133, the weakest fix since September 2023. The damping today was once again greater than 1000 pips, the PBoC is still guiding CNY lower at a gradual pace.
- In the background, the Wall Street Journal reported the U.S. is pressing over 70 nations to limit transshipment of Chinese goods as part of its broader tariff strategy, underlining the widening scope of trade friction.
- Hongkong Post announced it will suspend acceptance of parcels containing goods bound for the U.S., after Washington scrapped duty-free treatment and raised tariffs on such items, effective May 2. The Hong Kong SAR government denounced the move as “bullying” and “abusive.”
Regional equity markets mostly remained under pressure, Japanese, mainland China, and Hong Kong indexes lower.
Major FX was characterised by a weaker US dollar on the session. EUR, JPY, GBP all rising. AUD, NZD and CAD lagged.
As I update USD/JPY has dropped back towards 142.50, down from above 143.25 earlier in the session. Governor Ueda’s hints aat a May pause not holding back the yen today at all today it seems.
Gold soared higher, another record high price his today:
This article was written by Eamonn Sheridan at www.forexlive.com.
Wednesday 16th April 2025: Technical Outlook and Review
415165 April 16, 2025 11:00 ICMarkets Market News
DXY (US Dollar Index):
Potential Direction: Bearish
Overall momentum of the chart: Bearish
Price could make a bearish continuation toward the 1st support. Additionally, the price is below the bearish Ichimoku cloud, which suggests a bearish trend
Pivot: 100.25
Supporting reasons: Identified as a pullback resistance that aligns close to the 23.6% Fibonacci retracement, indicating a potential area where selling pressures could intensify.
1st support: 99.00
Supporting reasons: Identified as a swing low support, indicating a potential area where the price could stabilize once again.
1st resistance: 101.37
Supporting reasons: Identified as a pullback resistance that aligns with the 50% Fibonacci retracement, indicating a potential level that could cap further upward movement.
EUR/USD:
Potential Direction: Bullish
Overall momentum of the chart: Bullish
Price could fall toward the pivot and potentially make a bullish bounce off this level to rise toward the 1st resistance. Additionally, the price is above the bullish Ichimoku cloud, which suggests a bullish trend
Pivot: 1.1200
Supporting reasons: Identified as a pullback support that aligns with the 50% Fibonacci retracement, indicating a potential area where buying interests could pick up to stage a rebound.
1st support: 1.0949
Supporting reasons: Identified as an overlap support, indicating a potential area where the price could stabilize once more.
1st resistance: 1.1526
Supporting reasons: Identified as a pullback resistance that aligns with the 100% Fibonacci projection, indicating a potential area that could halt any further upward movement.
EUR/JPY:
Potential Direction: Bullish
Overall momentum of the chart: Bearish
Price could potentially make a bullish bounce off the pivot and rise toward the 1st resistance.
Pivot: 160.44
Supporting reasons: Identified as a pullback support, indicating a potential area where buying interests could pick up to stage a rebound.
1st support: 158.36
Supporting reasons: Identified as an overlap support that aligns with the 61.8% Fibonacci retracement, indicating a potential area where the price could stabilize once again.
1st resistance: q68.26
Supporting reasons: Identified as a multi swing high resistance, indicating a potential area that could halt any further upward movement.
EUR/GBP:
Potential Direction: Bullish
Overall momentum of the chart: Bullish
Price could fall toward the pivot and potentially make a bullish bounce off this level to rise toward the 1st resistance.
Pivot: 0.8529
Supporting reasons: Identified as an overlap support that aligns with the 50% Fibonacci retracement, indicating a potential area where buying interests could pick up to stage a rebound.
1st support: 0.8448
Supporting reasons: Identified as a pullback support, indicating a potential area where the price could stabilize once more.
1st resistance: 0.8717
Supporting reasons: Identified as a multi-swing high resistance, indicating a potential level that could cap further upward movement.
GBP/USD:
Potential Direction: Bullish
Overall momentum of the chart: Bullish
Price could make a bullish breakout of the pivot and rise toward the 1st resistance. Additionally, the price is above the bullish Ichimoku cloud, which suggests a bullish trend
Pivot: 1.3203
Supporting reasons: Identified as a pullback support, indicating a potential area where buying interests could pick up to stage a rebound.
1st support: 1.3040
Supporting reasons: Identified as a pullback support, acting as a potential level where the price could stabilize once again.
1st resistance: 1.3342
Supporting reasons: Identified as a resistance that aligns with the 127.2% Fibonacci extension, indicating a potential level that could cap further upward movement.
GBP/JPY:
Potential Direction: Bearish
Overall momentum of the chart: Bearish
Price could rise toward the pivot and potentially make a bearish reversal off this level to fall toward the 1st support.
Pivot: 189.97
Supporting reasons: Identified as an overlap resistance that aligns with the 50% Fibonacci retracement, indicating a potential area where selling pressures could intensify.
1st support: 184.95
Supporting reasons: Identified as a swing low support, indicating a potential level where the price could stabilize once more.
1st resistance: 194.70
Supporting reasons: Identified as an overlap resistance, indicating a potential level that could cap further upward movement.
USD/CHF:
Potential Direction: Bearish
Overall momentum of the chart: Bearish
Price could rise towards the pivot in the short term before reversing off and falling towards 1st support
Pivot: 0.8370
Supporting reasons: Identified as a pullback resistance that aligns with the 50% Fibonacci retracement, indicating a potential area where selling pressures could intensify.
1st support: 0.8105
Supporting reasons: Identified as a multi-swing low support, indicating a potential level where the price could stabilize once again.
1st resistance: 0.8597
Supporting reasons: Identified as a swing high resistance, indicating a potential level that could cap further upward movement.
USD/JPY:
Potential Direction: Bullish
Overall momentum of the chart: Bearish
Price could make a bullish continuation toward the 1st resistance.
Pivot: 142.01
Supporting reasons: Identified as a swing low support that aligns with the 78.6% Fibonacci projection and the 100% Fibonacci projection, indicating a potential area where buying interests could pick up to stage a rebound.
1st support: 139.85
Supporting reasons: Identified as an overlap support, suggesting a potential area where the price could stabilize once more.
1st resistance: 144.39
Supporting reasons: Identified as a pullback resistance, indicating a potential level that could cap further upward movement.
USD/CAD:
Potential Direction: Bearish
Overall momentum of the chart: Bearish
Price could rise toward the pivot and potentially make a bearish reversal off this level to fall toward the 1st support.
Pivot: 1.4063
Supporting reasons: Identified as a pullback resistance that aligns with a 50% Fibonacci retracement, indicating a potential area where selling pressures could intensify. The presence of the red Ichimoku Cloud adds further significance to the strength of the bearish momentum.
1st support: 1.3839
Supporting reasons: Identified as a swing-low support, indicating a key level where the price could stabilize once more.
1st resistance: 1.4165
Supporting reasons: Identified as a pullback resistance that aligns close to a 50% Fibonacci retracement, indicating a potential area that could halt any further upward movement.
AUD/USD:
Potential Direction: Bullish
Overall momentum of the chart: Bullish
Price has made a bullish bounce off the pivot and could potentially rise toward the 1st resistance.
Pivot: 0.6340
Supporting reasons: Identified as a pullback support, indicating a potential area where buying interests could pick up to resume the uptrend.
1st support: 0.6267
Supporting reasons: Identified as a pullback support, suggesting a potential area where the price could stabilize once again.
1st resistance: 0.6416
Supporting reasons: Identified as a swing-high resistance, indicating a potential area that could halt any further upward movement.
NZD/USD
Potential Direction: Bullish
Overall momentum of the chart: Bullish
Price has made a bullish bounce off the pivot and could potentially rise toward the 1st resistance.
Pivot: 0.5887
Supporting reasons: Identified as a pullback support, indicating a potential area where buying interests could pick up to resume the uptrend.
1st support: 0.5828
Supporting reasons: Identified as an overlap support, suggesting a potential area where the price could stabilize once more.
1st resistance: 0.6024
Supporting reasons: Identified as a swing-high resistance, indicating a potential area that could halt any further upward movement.
US30 (DJIA):
Potential Direction: Bullish
Overall momentum of the chart: Neutral
Price could fall toward the pivot and potentially make a bullish bounce off this level to rise toward the 1st resistance.
Pivot: 39,318.40
Supporting reasons: Identified as an overlap support that aligns close to a 38.2% Fibonacci retracement, indicating a potential area where buying interests could pick up to stage a minor rebound.
1st support: 36,918.19
Supporting reasons: Identified as a multi-swing-low support, indicating a potential level where the price could stabilize once again.
1st resistance: 41,268.90
Supporting reasons: Identified as a pullback resistance that aligns close to a 78.6% Fibonacci retracement, indicating a potential area that could halt any further upward movement.
DE40 (DAX):
Potential Direction: Bullish
Overall momentum of the chart: Neutral
Price could fall toward the pivot and potentially make a bullish bounce off this level to rise toward the 1st resistance.
Pivot: 20,301.00
Supporting reasons: Identified as an overlap support that aligns close to a 50% Fibonacci retracement, indicating a potential area where buying interests could pick up to stage a minor rebound.
1st support: 19,507.15
Supporting reasons: Identified as a multi-swing-low support that aligns close to a 78.6% Fibonacci retracement, indicating a key level where the price could stabilize once more.
1st resistance: 21,505.00
Supporting reasons: Identified as a swing-high resistance that aligns with a 61.8% Fibonacci retracement, indicating a potential area that could halt any further upward movement.
US500 (S&P 500):
Potential Direction: Bullish
Overall momentum of the chart: Neutral
Price could fall toward the pivot and potentially make a bullish bounce off this level to rise toward the 1st resistance.
Pivot: 5,242.95
Supporting reasons: Identified as an overlap support that aligns close to a 38.2% Fibonacci retracement, indicating a potential area where buying interests could pick up to stage a minor rebound.
1st support: 4,878.15
Supporting reasons: Identified as a multi-swing-low support, indicating a potential level where the price could stabilize once again.
1st resistance: 5,508.00
Supporting reasons: Identified as a pullback resistance that aligns close to a 50% Fibonacci retracement, indicating a potential area that could halt any further upward movement.
BTC/USD (Bitcoin):
Potential Direction: Bullish
Overall momentum of the chart: Bullish
Price could fall toward the pivot and potentially make a bullish bounce off this level to rise toward the 1st resistance.
Pivot: 83,233.82
Supporting reasons: Identified as an overlap support, indicating a potential area where buying interests could pick up to stage a rebound.
1st support: 79,497.37
Supporting reasons: Identified as a swing-low support that aligns close to a 61.8% Fibonacci retracement, indicating a potential level where the price could stabilize once more.
1st resistance: 88,428.80
Supporting reasons: Identified as a multi-swing-high resistance that aligns close to a 78.6% Fibonacci projection, indicating a potential area that could halt any further upward movement.
ETH/USD (Ethereum):
Potential Direction: Bearish
Overall momentum of the chart: Bearish
Price could rise toward the pivot and potentially make a bearish reversal off this level to fall toward the 1st support.
Pivot: 1,765.71
Supporting reasons: Identified as a pullback resistance that aligns close to a 23.6% Fibonacci retracement, indicating a potential area where selling pressures could intensify.
1st support: 1,438.35
Supporting reasons: Identified as a swing-low support, indicating a potential level where the price could stabilize once again.
1st resistance: 1,940.48
Supporting reasons: Identified as an overlap resistance that aligns with a 38.2% Fibonacci retracement, indicating a potential area that could halt any further upward movement.
WTI/USD (Oil):
Potential Direction: Bearish
Overall momentum of the chart: Bearish
Price has reversed close to the pivot and could potentially fall toward the 1st support.
Pivot: 62.70
Supporting reasons: Identified as a swing-high resistance, indicating a potential area where selling pressures could intensify. The presence of the red Ichimoku Cloud adds further significance to the strength of the bearish momentum.
1st support: 58.85
Supporting reasons: Identified as a swing-low support that aligns with a 50% Fibonacci retracement, indicating a key level where the price could stabilize once more.
1st resistance: 65.96
Supporting reasons: Identified as a pullback resistance that aligns close to a 61.8% Fibonacci retracement, indicating a potential area that could halt any further upward movement.
XAU/USD (GOLD):
Potential Direction: Bullish
Overall momentum of the chart: Bullish
Price could fall toward the pivot and potentially make a bullish bounce off this level to rise toward the 1st resistance.
Pivot: 3167.82
Supporting reasons: Identified as a pullback support, indicating a potential area where buying interests could pick up to stage a rebound.
1st support: 3057.82
Supporting reasons: Identified as a pullback support, acting as a potential level where price could stabilize once again.
1st resistance: 3295.43
Supporting reasons: Identified as a resistance that aligns with the 100% Fibonacci projection and the 161.8% Fibonacci extension, indicating a potential area that could halt any further upward movement.
The accuracy, completeness and timeliness of the information contained on this site cannot be guaranteed. IC Markets does not warranty, guarantee or make any representations, or assume any liability regarding financial results based on the use of the information in the site.
News, views, opinions, recommendations and other information obtained from sources outside of www.icmarkets.com, used in this site are believed to be reliable, but we cannot guarantee their accuracy or completeness. All such information is subject to change at any time without notice. IC Markets assumes no responsibility for the content of any linked site.
The fact that such links may exist does not indicate approval or endorsement of any material contained on any linked site. IC Markets is not liable for any harm caused by the transmission, through accessing the services or information on this site, of a computer virus, or other computer code or programming device that might be used to access, delete, damage, disable, disrupt or otherwise impede in any manner, the operation of the site or of any user’s software, hardware, data or property.
The post Wednesday 16th April 2025: Technical Outlook and Review first appeared on IC Markets | Official Blog.
IC Markets Asia Fundamental Forecast | 16 April 2025
415164 April 16, 2025 11:00 ICMarkets Market News
IC Markets Asia Fundamental Forecast | 16 April 2025
What happened in the U.S. session?
After registering a large decline of -20 in the previous month, the New York Empire State Manufacturing Index contracted for the second successive month with a reading of -8.1 in April, better than the forecast of -14.5. Manufacturing activity declined modestly as categories such as new orders and shipments edged lower while input and selling prices both surged at the fastest pace in over two years. Due to the current backdrop of trade policy uncertainties, firms turned pessimistic about the outlook, with the future general business conditions index falling to -7.4, its second-lowest reading on record. The dollar index (DXY) failed to rise above 100.30 during this session, highlighting the lacklustre demand for the greenback.
What does it mean for the Asia Session?
China releases its key macroeconomic data on its latest GDP figures as well as industrial production and retail sales activity. Given the growing uncertainty surrounding global trade policies, we could see China’s economic output slow noticeably while consumer spending falters. A huge miss in these figures would no doubt heap intense downward pressures on crude oil prices, which have already shed well over 20% at their lowest point over the last couple of weeks.
The Dollar Index (DXY)
Key news events today
Retail Sales (12:30 pm GMT)
Fed Chairman Powell’s Speech (5:30 pm GMT)
What can we expect from DXY today?
After experiencing a sharp decline of 1.2% in the prior month, consumer spending in the U.S. rebounded in February with a small gain of 0.2% MoM, well below forecasts of a 0.6% rise – seven of the report’s 13 categories saw declines. Retail sales are now anticipated to jump strongly in March, rising 1.4% MoM – a result that could provide some much-needed relief for the greenback.
Later on, Federal Reserve Chairman Jerome Powell will be speaking about the economic outlook at the Economic Club of Chicago. Following the recent developments on tariff announcements and suspensions between the U.S. and its key trading partners, markets will be looking to see if Powell can shed some light on how the ongoing trade uncertainties would impact the Fed’s decision-making process going into the FOMC meeting in early May.
Central Bank Notes:
- The Board of Governors of the Federal Reserve System voted unanimously to maintain the Federal Funds Rate in a target range of 4.25 to 4.50% on 19 March 2025
- The Committee seeks to achieve maximum employment and inflation at the rate of 2% over the longer run but uncertainty around the economic outlook has increased; the Committee is attentive to the risks to both sides of its dual mandate.
- Recent indicators suggest that economic activity has continued to expand at a solid pace while the unemployment rate has stabilized at a low level in recent months, and labour market conditions remain solid. However, inflation remains somewhat elevated.
- GDP growth forecasts were revised downward for 2025 (1.7% vs. 2.1% in the December projection) while PCE inflation projections have been adjusted slightly higher for 2025, with core inflation expected to reach 2.5%, partly due to tariff-related pressures.
- In assessing the appropriate stance of monetary policy, the Committee will continue to monitor the implications of incoming information for the economic outlook and is prepared to adjust the stance of monetary policy as appropriate if risks emerge that could impede the attainment of its goals.
- Beginning in April, the Committee will slow the pace of decline of its securities holdings by reducing the monthly redemption cap on Treasury securities from $25B to $5B while maintaining the monthly redemption cap on agency debt and agency mortgage-backed securities at $35B.
- The next meeting is scheduled for 6 to 7 May 2025.
Next 24 Hours Bias
Weak Bearish
Gold (XAU)
Key news events today
Retail Sales (12:30 pm GMT)
Fed Chairman Powell’s Speech (5:30 pm GMT)
What can we expect from Gold today?
After experiencing a sharp decline of 1.2% in the prior month, consumer spending in the U.S. rebounded in February with a small gain of 0.2% MoM, well below forecasts of a 0.6% rise – seven of the report’s 13 categories saw declines. Retail sales are now anticipated to jump strongly in March, rising 1.4% MoM – a result that could provide some much-needed relief for the greenback.
Later on, Federal Reserve Chairman Jerome Powell will be speaking about the economic outlook at the Economic Club of Chicago. Following the recent developments on tariff announcements and suspensions between the U.S. and its key trading partners, markets will be looking to see if Powell can shed some light on how the ongoing trade uncertainties would impact the Fed’s decision-making process going into the FOMC meeting in early May.
Next 24 Hours Bias
Strong Bullish
The Australian Dollar (AUD)
Key news events today
No major news events.
What can we expect from AUD today?
The Aussie rallied on Tuesday as it reached a high of 0.6383, fuelled by pronounced weakness in the greenback. This currency pair pulled back quite sharply as it tumbled toward 0.6320 in early trading on Wednesday. However, the upward momentum for the Aussie remains intact and it looks set to climb above 0.6350 once again.
Central Bank Notes:
- The RBA maintained the cash rate at 4.10% on 1 April, following a 25-basis point reduction on 18 February.
- Inflation has fallen substantially since the peak in 2022, as higher interest rates have been working to bring aggregate demand and supply closer towards balance.
- Recent information suggests that underlying inflation continues to ease in line with the most recent forecasts published in the February Statement on Monetary Policy.
- Private domestic demand appears to be recovering, real household incomes have picked up and there has been an easing in some measures of financial stress. However, businesses in some sectors continue to report that weakness in demand makes it difficult to pass on cost increases to final prices.
- At the same time, a range of indicators suggest that labour market conditions remain tight. Despite a decline in employment in February, measures of labour underutilisation are at relatively low rates and business surveys and liaison suggest that availability of labour is still a constraint for a range of employers. Wage pressures have eased a little more than expected but productivity growth has not picked up and growth in unit labour costs remains high.
- There are notable uncertainties about the outlook for domestic economic activity and inflation. The central projection is for growth in household consumption to continue to increase as income growth rises. But there is a risk that any pick-up in consumption is slower than expected, resulting in continued subdued output growth and a sharper deterioration in the labour market than currently expected.
- Uncertainty about the outlook abroad also remains significant. On the macroeconomic policy front, recent announcements from the U.S. on tariffs are having an impact on confidence globally and this would likely be amplified if the scope of tariffs widens, or other countries take retaliatory measures. Geopolitical uncertainties are also pronounced.
- The Board’s assessment is that monetary policy remains restrictive and the continued decline in underlying inflation is welcome, but there are nevertheless risks on both sides and the Board is cautious about the outlook.
- The Board will rely upon the data and the evolving assessment of risks to guide its decisions and is resolute in its determination to sustainably return inflation to target and will do what is necessary to achieve that outcome.
- The next meeting is on 20 May 2025.
Next 24 Hours Bias
Weak Bullish
The Kiwi Dollar (NZD)
Key news events today
No major news events.
What can we expect from NZD today?
Significant weakness in the greenback propelled the Kiwi beyond the threshold of 0.5900 to hit a high of 0.5943 on Tuesday. However, this currency pair ran out of steam overnight as it dipped under this threshold. Strong tailwinds continue to keep the Kiwi elevated as it rose above 0.5900 once more as Asian markets came online on Wednesday.
Central Bank Notes:
- The Monetary Policy Committee (MPC) agreed to reduce the Official Cash Rate (OCR) by 25 basis points bringing it down to 3.50% on 9 April, marking the fifth consecutive rate cut.
- The Committee assessed that annual consumer price inflation remains near the midpoint of the MPC’s 1 to 3% target band while firms’ inflation expectations and core inflation are consistent with inflation remaining at target over the medium term.
- Economic activity has evolved largely as expected since the February Monetary Policy Statement; higher-than-expected export prices and a lower exchange rate have supported primary sector incomes and overall economic growth.
- Although monetary restraint had been removed at pace, household spending and residential investment have remained weak.
- The recently announced increases in global trade barriers weaken the outlook for global economic activity. On balance, these developments create downside risks to the outlook for economic activity and inflation.
- The Committee noted that the increase in tariffs will take time to work through the global economy, but the direct price increases for economies imposing tariffs and the dampening impact of increased economic uncertainty on global demand will occur relatively quickly.
- With CPI inflation close to the mid-point of the target range, significant spare capacity in the economy, and a weaker activity outlook stemming from global trade policy, the Committee agreed that a further reduction in the OCR was appropriate.
- Meanwhile, future policy decisions will be determined by the outlook for inflationary pressure over the medium term.
- The next meeting is on 28 May 2025.
Next 24 Hours Bias
Weak Bullish
The Japanese Yen (JPY)
Key news events today
No major news events.
What can we expect from JPY today?
Following U.S. President Donald Trump’s announcement that certain consumer electronics will be exempt from steep tariffs on Chinese imports, concerns regarding escalating trade tensions between the U.S. and China have somewhat alleviated, providing some much-needed relief to financial markets. Demand for safe-haven assets such as the yen tapered off noticeably over the past couple of days as USD/JPY found its footing around 142.50. However, overhead pressures have not completely vanished for this currency pair.
Central Bank Notes:
- The Policy Board of the Bank of Japan decided on 19 March, by a unanimous vote, to maintain the following guidelines for money market operations for the inter-meeting period:
- The Bank will encourage the uncollateralized overnight call rate to remain at around 0.5%.
- The Bank will continue its plan to reduce the amount of its monthly outright purchases of JGBs, aiming to reach about 3 trillion yen by January-March 2026.
- Japan’s economy has continued to recover moderately, with some sectors showing improvement. Exports and industrial production have remained relatively stable, while corporate profits continue on an improving trend and business sentiment maintains a favourable level.
- The employment and income situation has shown moderate improvement, with private consumption on a moderately increasing trend despite ongoing impacts from price rises.
- On the price front, the year-on-year rate of increase in the consumer price index (CPI, all items less fresh food) has been in the range of 3.0-3.5% recently. Services prices continue to rise moderately, reflecting factors such as wage increases, while the effects of cost pass-through from past import price rises have diminished.
- Inflation expectations have continued to rise moderately, with underlying CPI inflation gradually increasing toward the price stability target of 2%. The virtuous cycle between wages and prices continues to strengthen, with businesses increasingly reflecting higher costs in selling prices.
- Japan’s economy is expected to maintain growth above its potential rate, supported by moderately growing overseas economies and the intensifying virtuous cycle from income to spending, underpinned by accommodative financial conditions.
- The next meeting is scheduled for 19 June 2025.
Next 24 Hours Bias
Weak Bearish
The Euro (EUR)
Key news events today
CPI (9:00 am GMT)
What can we expect from EUR today?
The final CPI report for March is expected to show inflationary pressures easing for the second consecutive month in the Euro Area. Services inflation slowed to a 33-month low while energy costs declined, based on the preliminary estimates. Despite consumer inflation moderating lower, demand for the Euro is likely to remain robust, keeping it above 1.1300.
Central Bank Notes:
- The Governing Council reduced the three key ECB interest rates by 25 basis points on 6 March to mark the fifth successive rate cut.
- Accordingly, the interest rate on the main refinancing operations and the interest rates on the marginal lending facility and the deposit facility will be decreased to 2.65%, 2.90% and 2.50% respectively.
- The Council acknowledged that monetary policy was becoming meaningfully less restrictive, easing borrowing costs for businesses and households with inflation projected to average 2.3% in 2025, 1.9% in 2026, and 2.0% in 2027, while core inflation also neared the 2% target.
- Although domestic inflation remains elevated due to delayed wage and price adjustments, wage growth is moderating.
- Economic growth forecasts were revised downward to 0.9% for 2025 and 1.2% for 2026, reflecting weak exports and investment.
- The asset purchase programme (APP) and pandemic emergency purchase programme (PEPP) portfolios are declining at a measured and predictable pace, as the Eurosystem no longer reinvests the principal payments from maturing securities.
- The ECB remains data-dependent and will adjust its policy as needed to ensure inflation stabilizes around its 2% medium-term target without committing to a specific rate path.
- The next meeting is on 17 April 2025.
Next 24 Hours Bias
Medium Bullish
The Swiss Franc (CHF)
Key news events today
No major news events.
What can we expect from CHF today?
Demand for safe-haven assets such as the Swiss franc tapered off noticeably over the past couple of days following U.S. President Donald Trump’s announcement that certain consumer electronics will be exempt from steep tariffs on Chinese imports. This recent development alleviated some concerns regarding escalating trade tensions between the U.S. and China and provided some much-needed relief to financial markets. USD/CHF has found a temporary floor above 0.8100 for now but overhead pressures remain in place.
Central Bank Notes:
- The SNB eased monetary policy by lowering its key policy rate by 25 basis points, from 0.50% to 0.25% on 20 March 2025, marking the fifth consecutive reduction.
- Underlying inflationary pressure has decreased further this quarter.
- Inflation in the period since the last monetary policy assessment has again been lower than expected, decreasing from 0.7% in November to 0.3% in February, primarily due to lower electricity prices.
- In the shorter term, the new conditional inflation forecast is slightly higher than December: 0.3% for Q2 2025, 0.4% for 2025 overall, and 0.8% for 2026 and 2027, based on the assumption that the SNB policy rate remains at 0.25% over the entire forecast horizon.
- GDP growth in Switzerland remains moderate, with the services sector continuing to show slightly stronger growth, while manufacturing faces challenges.
- The SNB anticipates GDP growth of around 1.0% to 1.5% for 2025.
- The SNB will continue to monitor the situation closely and will adjust its monetary policy if necessary to ensure inflation remains within the range consistent with price stability over the medium term.
- The next meeting is on 19 June 2025.
Next 24 Hours Bias
Weak Bearish
The Pound (GBP)
Key news events today
CPI (6:00 am GMT)
What can we expect from GBP today?
After accelerating in the prior month, consumer inflation in the U.K. eased slightly in February as both headline and core CPI rose at a slower pace. The forecasts for March point to a second consecutive month of abating price pressures, suggesting a continued moderation of consumer inflation, which could function as a near-term headwind for the pound. Cable surged past 1.3200 on Tuesday, fueled by the ongoing weakness in the greenback, and the upward momentum continued as Asian markets came online on Wednesday.
Central Bank Notes:
- The Bank of England’s Monetary Policy Committee (MPC) voted by a majority of 8 to 1 to maintain the Bank Rate at 4.50% on 19 March 2025, while one member preferred to reduce it by 25 basis points (bps).
- The MPC also voted unanimously to reduce the stock of UK government bond purchases held for monetary policy purposes and financed by the issuance of central bank reserves, by £100B over the next 12 months to a total of £558B, starting in October 2024. On 18 December 2024, the stock of UK government bonds held for monetary policy purposes was £655B.
- Twelve-month CPI inflation increased to 3.0% in January from 2.5% in December, slightly higher than expected in the February Report; domestic price and wage pressures are moderating, but remain somewhat elevated.
- Although global energy prices have fallen back recently, they remain higher than last year and CPI inflation is still projected to rise to around 3.75% in 2025 Q3. While CPI inflation is expected to fall back thereafter, the Committee will pay close attention to any consequent signs of more lasting inflationary pressures.
- While UK GDP growth estimates have been slightly stronger than expected at the time of the February Monetary Policy Report, business survey indicators generally continue to suggest weakness in growth and particularly in employment intentions. In recent quarters, subdued activity has been judged to reflect both demand and supply factors.
- The labour market had continued to ease, although it was still judged to be broadly in balance – some indicators of employment intentions had deteriorated markedly, to levels consistent with shrinking employment while other indicators, such as the number of vacancies, had not weakened to the same extent.
- Domestic price and wage pressures were moderating, but remained somewhat elevated. A range of indicators suggested that underlying pay growth had eased further in recent months, although annual growth in private sector regular average weekly earnings had picked up to 6.1% in the three months to January.
- Based on the Committee’s evolving view of the medium-term outlook for inflation, a gradual and careful approach to the further withdrawal of monetary policy restraint is appropriate and it will continue to monitor closely the risks of inflation persistence and what the evolving evidence may reveal about the balance between aggregate supply and demand in the economy.
- Monetary policy will need to continue to remain restrictive for sufficiently long until the risks to inflation returning sustainably to the 2% target in the medium term have dissipated further and the Committee will decide the appropriate degree of monetary policy restrictiveness at each meeting.
- The next meeting is on 8 May 2025.
Next 24 Hours Bias
Medium Bullish
The Canadian Dollar (CAD)
Key news events today
BoC Interest Rate Decision (1:45 pm GMT)
BoC Press Conference (2:30 pm GMT)
What can we expect from CAD today?
After reducing its overnight rate by 25 basis points (bps) bringing it down to 2.75% in March, the Bank of Canada (BoC) is now widely expected to hold rates at current levels. This would mark the first pause in eight meetings, where a total of 225 bps had been cut since last June. This pause is likely influenced by the ongoing trade policy uncertainties between the U.S. and its major trading partners such as Canada, nudging the BoC to embark on a ‘wait-and-see’ approach as developments unfold. Governor Tiff Macklem commences his press conference 45 minutes after the rate announcement where he could provide further insights on the decision-making process taken by the Governing Council that led them to today’s outcome.
Central Bank Notes:
- The Bank of Canada reduced its target for the overnight rate by 25 basis points bringing it down to 2.75% on 12 March; this marked the seventh consecutive meeting where rates were reduced.
- The bank announced its plan to complete the normalization of its balance sheet, ending quantitative tightening, and will restart asset purchases in early March, beginning gradually so that its balance sheet stabilizes and then grows modestly, in line with growth in the economy.
- The Governing Council noted that the economy grew more than expected in the fourth quarter of last year, spurred by past rate cuts but growth is now expected to slow at the turn of the year due to increasing trade conflict with the United States.
- Employment growth strengthened in November through January and the unemployment rate declined to 6.6%. In February, job growth stalled. While past interest rate cuts have boosted demand for labour in recent months, there are warning signs that heightened trade tensions could disrupt the recovery in the jobs market. Meanwhile, wage growth has shown signs of moderation.
- Inflation remains close to the 2% target. The temporary suspension of the GST/HST lowered some consumer prices, but January’s CPI was slightly firmer than expected at 1.9%. Inflation is expected to increase to about 2½% in March with the end of the tax break. The Bank’s preferred measures of core inflation remain above 2%, mainly because of the persistence of shelter price inflation. Short-term inflation expectations have risen in light of fears about the impact of tariffs on prices.
- While economic growth has come in stronger than expected, the pervasive uncertainty created by continuously changing U.S. tariff threats is restraining consumers’ spending intentions and businesses’ plans to hire and invest.
- While monetary policy cannot offset the impacts of a trade war, the Governing Council will carefully assess the timing and strength of both the downward pressures on inflation from a weaker economy and the upward pressures on inflation from higher costs.
- The Council will also be closely monitoring inflation expectations and is committed to maintaining price stability for Canadians by keeping inflation close to the 2% target.
- The next meeting is on 16 April 2025.
Next 24 Hours Bias
Weak Bullish
Oil
Key news events today
EIA Crude Oil Inventories (2:30 pm GMT)
What can we expect from Oil today?
After declining by 1.1M in the prior week, the API stockpiles added 2.4M barrels of crude to storage, missing market forecasts of a decline of 1.7M barrels. The latest report highlighted the ongoing weakness in U.S. crude oil demand as inventories rose in eight out of the past 12 weeks to weigh on oil prices. WTI oil hovered around $61.50 per barrel for most parts of Tuesday. Although prices have somewhat stabilized this week, overhead pressures for this commodity remain in place.
Next 24 Hours Bias
Weak Bearish
The post IC Markets Asia Fundamental Forecast | 16 April 2025 first appeared on IC Markets | Official Blog.
General Market Analysis – 16/04/25
415163 April 16, 2025 10:00 ICMarkets Market News
Markets Pull Back on Tariff Confusion – Dow Down 0.4%
Financial markets took a bit of a breath in trading yesterday after a couple of hard weeks of volatility to assess exactly where we stand with tariffs and what the possible impact is. The major U.S. stock indices all drifted lower — the Dow dropped 0.38%, the S&P 0.17%, and the Nasdaq finished marginally off, losing just 0.05%. Treasury yields also experienced a relatively quiet day, the 2-year closing flat at 3.845%, while the 10-year lost 4.1 basis points to move down to 4.333%. The dollar edged higher against most of the majors, with the DXY up 0.36% to 100.17. Oil contracts also traded in their tightest ranges for a while, Brent gaining just 0.01% to $64.89 and WTI dropping 0.32% to $61.33 a barrel, whilst gold pushed back towards all-time highs again, gaining 0.6% on the day to close at $3,229.24.
Gold Pushing for More Records
Gold prices moved back higher again overnight and look like they could challenge the $3,245.28 high that was set a few days ago in the coming sessions. Global uncertainty over the last few months has enabled the world’s favourite safe-haven product to climb over 24% this year, and that has increased since “Liberation Day.” However, some in the market are preparing for a sharp turnaround if conditions change. One question for gold traders is just how much downside has been priced into this gold move — and then they are looking at how far it can fall back if we see global growth concerns retract. Overnight, President Trump called on China to come to the negotiation table, and if that were to happen — and lower tariffs, or even the removal of tariffs, were to occur — then we could see gold prices drop, and drop hard. As always in these markets, traders will continue to monitor newswires for updates and will have to react quickly to fresh developments.
Busy Calendar Day Ahead for Traders
Market volatility dropped considerably over the last few sessions, and investors will now get the chance to have a look at the underlying fundamentals with a full calendar day ahead. The Asian session will have a strong focus on Chinese markets, with the usual big monthly data drop due midway through the session: GDP (exp +5.2%), Industrial Production (exp +5.9%), and Retail Sales (exp +4.2%) will be the main focus, and anything significantly off expectations should see further moves in Chinese markets. The U.K. is again in focus at the European open, with the key CPI data (exp +2.7%) due out, and traders are expecting more moves for the pound on the release. However, the New York session looks set to be the busiest, with U.S. Retail Sales (exp +1.3%, Core +0.4%) due for release early in the day, followed by the key interest rate update from the Bank of Canada, where rates are expected to be held at 2.75%. To add more fuel to the fire, we are also set to hear from Fed Chair Jerome Powell later in the session when he speaks in Chicago.
The post General Market Analysis – 16/04/25 first appeared on IC Markets | Official Blog.

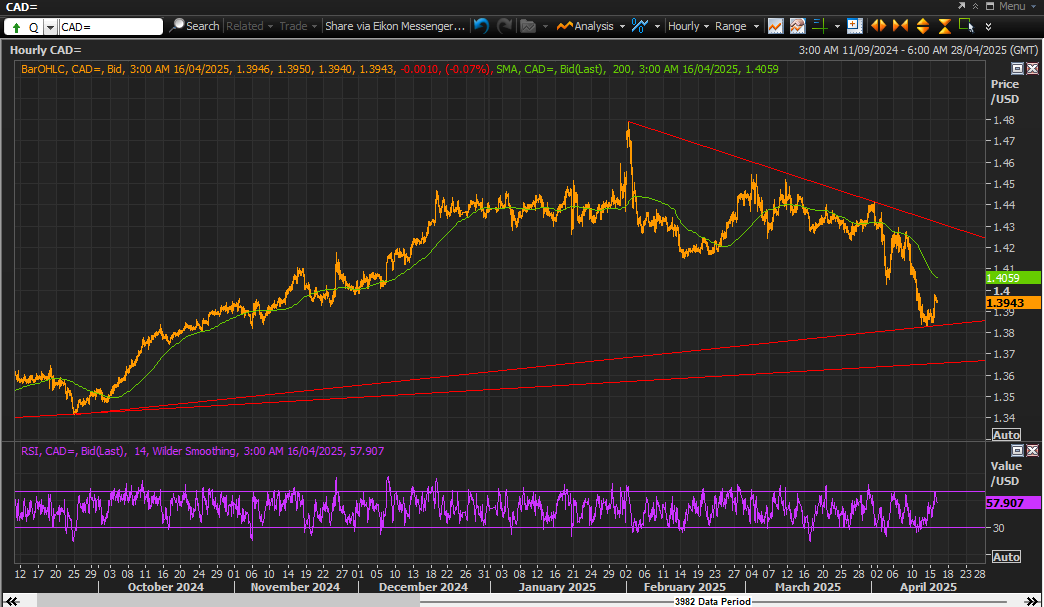
Trade USDCAD on the Bank of Canada Interest Rate Decision
415161 April 16, 2025 10:00 ICMarkets Market News
The Bank of Canada is set to deliver its latest interest rate decision later today, and Canadian dollar traders are bracing for potential volatility following the announcement. The central bank is expected to keep rates on hold, despite lower-than-anticipated inflation data released yesterday—CPI rose only 2.3% compared to the forecast of 2.7%. This subdued inflation is largely attributed to concerns that upcoming U.S. tariffs may add inflationary pressure in the coming months. Nevertheless, the market is still pricing in a 35% chance of another rate cut, which could trigger significant market moves if it materializes.
USDCAD has experienced a volatile month, driven by tariff developments from the U.S. and substantial moves in the oil market. The pair has depreciated over 4%, falling from a high of 1.4415 to a yearly low of 1.3833 just a few days ago. It is now trading just over 100 pips above that low and appears primed for movement following the central bank’s announcement. A rate cut would likely push the pair higher within its recent range, and given recent volatility, that push could be substantial. However, a rate hold with a more hawkish tone—due to anticipated tariff-driven inflation—could extend the recent downside and test new lows.
Resistance 2: 1.4317 – Trendline Resistance
Resistance 1: 1.4059 – 200-Day Moving Average
Support 1: 1.3833 – Trendline Support and 2025 Low
Support 2: 1.3657 – Long-Term Trendline Support
The post Trade USDCAD on the Bank of Canada Interest Rate Decision first appeared on IC Markets | Official Blog.
China’s fighting words on Trump’s tariffs – world economic order has been severely damaged
415160 April 16, 2025 09:40 Forexlive Latest News Market News
China stats bureau deputy head:
- Protectionism is rapidly rising globally, world economic order has been severely damaged
- Resolutely opposes US tariffs which are against economic rules, WTO rules
- High US tariffs will bring about some pressures on China’s trade and economy
- US tariffs will not change the long-term improving trend in China’s economy
- China has ‘rich’ policy toolkit to support the economy
- China is able, has confidence in dealing with external challenges and achieving economic growth target
- China stats bureau deputy head: macro economic policies will become more proactive this year
Earlier:
- China Industrial Output March 2025 surges to +7.7% y/y (expected 5.8%, prior +5.9%)
- China Q1 GDP +1.2% q/q (expected +1.4%)
- Tesla’s plans to ship Cybercab & Semi electric truck parts from China to US suspended
- Hong Kong suspends postal service for good bound for US – refuses to collect tariffs
- U.S. plans to use tariff negotiations to isolate China (Wall Street Journal piece)
This article was written by Eamonn Sheridan at www.forexlive.com.
China Industrial Output March 2025 surges to +7.7% y/y (expected 5.8%, prior +5.9%)
415159 April 16, 2025 09:15 Forexlive Latest News Market News
Solid data this.
Both retail sales and industrial output have surprised to the topside.
The obvious caveat is that the Q1 GDP data (see below) and the economic activity data for March both pre-date the huge increase in tariffs from Trump that will weigh on the Chinese economy going forward. China is expcected to boost stimulus to improve domestic consumption but the loss of a major expoirt marekt like the US will leave a hole in th external sector that will be difficult to fill.
We also had the GDP data:
This article was written by Eamonn Sheridan at www.forexlive.com.
China Q1 GDP +1.2% q/q (expected +1.4%)
415158 April 16, 2025 09:15 Forexlive Latest News Market News
China economic growth data is mixed:
+1.2% q/q is disappointing
- expected +1.4%, prior +1.6%
+5.4% y/y is a beat
- expected +5.1%, prior +5.4%
Out at the same were ‘activity data’ for March 2025, with some very strong results indeed.
This article was written by Eamonn Sheridan at www.forexlive.com.
Tesla’s plans to ship Cybercab & Semi electric truck parts from China to US suspended
415157 April 16, 2025 09:00 Forexlive Latest News Market News
Tesla’s plans to ship components for its Cybercab and Semi electric trucks from China to the U.S. have been suspended due to escalating tariffs imposed by Trump.
This disruption could delay Tesla’s ambitious production timeline for these new models, which were critical to the company’s growth strategy.
In summary:
- Trump’s tariffs on Chinese goods have escalated to 145%, disrupting Tesla’s shipping plans
- The suspension affects Tesla’s Cybercab and Semi production, both targeted for mass production by 2026
- Tesla was initially prepared to absorb a 34% tariff but could not handle the increased rate
- The suspension of shipments impacts Tesla’s robotaxi and Semi truck production goals
- Tesla has also paused accepting new orders for the Model S and Model X due to retaliatory tariffs from China.
***
Info via Reuters
This article was written by Eamonn Sheridan at www.forexlive.com.
China March new home prices -0.08% m/m (prior -0.1%) and -4.6% y/y (prior -4.8%)
415156 April 16, 2025 08:41 Forexlive Latest News Market News
China March 2025 new home prices.
No one will be turning cartwheels at these results, the property sector in China remains in dire straits with huge debt overhangs. And falling prices are a vicious circle, why buy now if prices are falling? … Rinse, repeat.
Still, slightly less bad in March than in February.
First tier cities saw some price rises, lower tier cities tended towards slower declines
This article was written by Eamonn Sheridan at www.forexlive.com.
Gold continues to surge, record high hit above US$3271
415155 April 16, 2025 08:15 Forexlive Latest News Market News
Gold continues to surge, record high hit above US$3271
- Geopolitical tensions
- Trade war
- Central banks remain buyers
- ETF demand
The usual suspects!
This article was written by Eamonn Sheridan at www.forexlive.com.
Hong Kong suspends postal service for good bound for US – refuses to collect tariffs
415154 April 16, 2025 08:00 Forexlive Latest News Market News
Hong Kong SAR government statement said that Hongkong Post suspends the postal service for items containing goods to the US:
“The Government of the United States (US) announced earlier that it would eliminate the duty-free de minimis treatment for postal items despatched from Hong Kong to the US and increase the tariffs for postal items containing goods to the US starting from May 2.
The US is unreasonable, bullying and imposing tariffs abusively.
Hongkong Post will definitely not collect any so-called tariffs on behalf of the US and will suspend the acceptance of postal items containing goods destined to the US”
This article was written by Eamonn Sheridan at www.forexlive.com.