Articles

investingLive Americas market news wrap: Gold down 10%, silver falls 30%
426061 January 31, 2026 04:25 Forexlive Latest News Market News
- Trump nominates Kevin Warsh to be the next chairman of the Federal Reserve
- Fed’s Musalem: Further interest rate cuts not advisable
- Eyes on Iran this weekend as Trump talks about ships heading there once again
- Fed’s Waller: Dissented in favour of rate cut because policy remains too much restrictive
- Fed’s Bostic: I want clear evidence of a return to 2% inflation
- Canada GDP for November +0.0% vs +0.1% expected
- US December PPI final demand Y/Y +3.0% vs +2.7% expected
- Germany January preliminary CPI +2.1% vs +2.0% y/y expected
Markets:
- Gold down $530 to $4860
- Silver down $33 to $82.70
- WTI crude oil up 47-cents to $65.90
- S&P 500 down 0.4%
- Nasdaq down 0.9%
- US 10-year yields up 1.8 bps to 4.24%
- USD leads, AUD lags
It was a day for the ages in the precious metals market as gold fell 10% and silver fell 30% in its worst-ever percentage drop. It’s been a parabolic run higher — particularly in silver — and the air came out of it today in a crushing decline. The selling started in Asia but silver was still at $104 early in US trade; it eventually fell as low as $77.80. Similarly, gold had steadied around $5170 before tanking to $4697 at the lows. Both had modest bounces late.
The nomination of Warsh got some of the credit for both moves but I think that’s dubious, or fitting the narrative to the price action. Volatility picked up yesterday and it was an old-fashioned stampede to the exits. If anything, I’d say that yesterday’s fall in MSFT shares showed that nothing is safe and that reverberated.
The take from the market so far is that Warsh is secretly hawkish, despite his public comments otherwise. Time will tell but no one really knows how we will react once in the role and the data starts rolling in. Moreover, he’s part of a committee, not a dictator so rates will go where the data leads us.
On that front, the PPI numbers were hot and oil prices rose again today. Eyes are on Iran this weekend with persistent talk about potential US strikes. Trump brought down the temperature briefly (leading to a quick $1 drop in oil) when he said Iran wants to negotiate. Later though, crude recouped those losses.
Overall it was a crazy week that ended with some intense drama. Next week features another flush earnings calendar that starts with Disney and Palantir on Monday. The week will end with non-farm payrolls.
Until then, have a great weekend.
This article was written by Adam Button at investinglive.com.
Eyes on Iran this weekend as Trump talks about ships heading there once again
426060 January 31, 2026 00:25 Forexlive Latest News Market News
Oil prices are marginally higher today as we watch and wait on Iran.
Trump is out once again reminding everyone that an ‘armada’ is heading towards Iran and it’s even bigger than the one that went to Venezuela. That’s obviously a threat and will hang over any negotiation.
This is the kind of thing that can get ugly fast and that’s why oil has rallied steadily from $59 on Jan 22 to $65.73 last. We’re at the point where there are two-way risks because this could also de-escalate or US attacks could avoid hitting oil infrastructure. Iran could also refrain from closing the Strait of Hormuz.
It’s all a bit of a mess but I get the sense that it’s too early to be betting on conflict. Negotiations tend to drag for a little while and a US attack on the weekend would be seen negatively internationally without at least a token effort at negotiations. There’s room to disagree on that because the US looked like it might launch strikes two weeks ago.
Again though, it’s going to matter what the US hits and how hard. Trump hates higher oil prices and for that reason, I just don’t think that oil is that big of a card to be played in this conflict.
The old adage is to never chase a geopolitical move in oil and I think that’s where we are. Earlier in the week, I wrote that risks were underpriced but after a $3 move higher, I don’t think that’s the case anymore. The precious metals market is also a reminder that corrections can happen in a hurry (as if energy traders needed that reminder).
Another spot to watch on the weekend is OPEC, which has a meeting scheduled on Feb 1. No big moves are expected but keep an eye on signaling around supplies and pricing. They’ve been a tough group to predict.
Update:
- Trump says Iran does want to make a deal
This article was written by Adam Button at investinglive.com.
Canada GDP for November +0.0% vs +0.1% expected
426059 January 30, 2026 20:40 Forexlive Latest News Market News
- Prior -0.3%
- December preliminary GDP +0.1%
StatCan notes that Real GDP was essentially unchanged in November following a 0.3% decline in October, as contractions in goods-producing industries offset expansions in services-producing industries.
Goods-producing industries declined 0.3% in November, down for the third time in four months, driven by contractions in the manufacturing and agriculture, forestry, fishing and hunting sectors in the month. Services-producing industries edged up 0.1%, with expansions in the retail trade, educational services and transportation and warehousing sectors. Overall, 10 of the 20 industrial sectors grew in November.
What does the monthly GDP measure?
In Canada, the Monthly GDP is a measure of the country’s economic output by industry (Real GDP by Industry). Unlike many other countries that only report GDP quarterly, Statistics Canada releases this data every month to provide a more frequent “pulse check” on the economy.
Statistics Canada breaks the report down into two main sectors:
-
Goods-Producing Industries: Includes manufacturing, construction, and mining/oil & gas. This sector has been volatile lately due to shifting trade policies and energy prices.
-
Services-Producing Industries: Includes retail, healthcare, and professional services. This usually provides the “floor” for the economy, though it has slowed as consumers pull back on spending.
This article was written by Giuseppe Dellamotta at investinglive.com.
US December PPI final demand Y/Y +3.0% vs +2.7% expected
426058 January 30, 2026 20:40 Forexlive Latest News Market News
- Prior was +3.0%
- PPI M/M +0.5% vs 0.2% expected
- Prior +0.2%
- Core PPI Y/Y +3.3% vs +2.9% expected
- Prior +3.0% (revised to 3.1%)
- Core PPI M/M +0.7% vs +0.2% expected
- Prior +0.0%
These are much higher than expected figures and we’re seeing a hawkish reaction in the markets with upside in the dollar and Treasury yields, and downside in stocks and precious metals.
The agency notes that the December increase in prices for final demand can be traced to a 0.7-percent advance in the index for
final demand services. Prices for final demand goods were unchanged.
Fed Chair Powell mentioned that they expect the Core PCE Y/Y to be around 3.0% in December. This PPI report is unlikely to trigger big market moves as we await next week’s data, with the US NFP report being the main highlight.
The market is pricing 52 bps of easing by year and that’s unlikely to change much with this report. The Fed upgraded the current economic outlook in their last policy statement to reflect the improvement in the data. In December, the Fed projected just one cut in 2026, so we will need more labour market deterioration or bigger than expected fall in inflation to see them going faster on rate cuts.
WHAT THE US PPI MEASURES?
The Producer Price Index (PPI) is an economic indicator that measures the average change over time in the selling prices received by domestic producers for their output. In simpler terms, it tracks inflation from the perspective of the seller/business rather than the consumer like the Consumer Price Index (CPI).
This article was written by Giuseppe Dellamotta at investinglive.com.
Germany January preliminary CPI +2.1% vs +2.0% y/y expected
426057 January 30, 2026 20:00 Forexlive Latest News Market News
- Prior +1.8%
- HICP +xx% vs +2.0% y/y expected
- Prior +2.0%
- Core CPI Y/Y +xx% vs +2.4% prior
This article was written by Giuseppe Dellamotta at investinglive.com.
investingLive European markets wrap: Precious metals dive, Trump picks Warsh as Fed chair
426056 January 30, 2026 19:50 Forexlive Latest News Market News
Headlines:
- Silver sinks below $100, gold tumbles below $5,000
- Precious metals continue to tumble as the heavy selling continues
- Silver dropped by more than 20% in just two days amid massive profit-taking. What’s next?
- Have we reached a short-term top in gold after the sharp swing lower?
- US futures push lower as the risk mood holds more mixed today
- Trump nominates Kevin Warsh to be the next chairman of the Federal Reserve
- How have interest rate expectations changed after this week’s events?
- Bavaria January CPI +2.1% vs +1.7% y/y prior
- Spain January preliminary CPI +2.4% vs +2.3% y/y expected
- Germany Q4 preliminary GDP +0.3% vs +0.2% q/q expected
- France Q4 preliminary GDP +0.2% vs +0.2% q/q expected
- Spain Q4 preliminary GDP +0.8% vs +0.6% q/q expected
- Italy Q4 preliminary GDP +0.3% vs +0.2% q/q expected
- Eurozone consumer inflation expectations rise to the highest level since the survey began
Markets:
- Precious metals in the spotlight as gold and silver tumble hard, correcting lower
- Gold down 4.4% to $5,132 with the low breaking under $5,000 earlier
- Silver down 10.5% to $103.46 with the low breaking below $100 earlier
- USD leads, JPY lags on the day
- Dollar steadier amid selling in precious metals and traders digesting Kevin Warsh being Trump’s Fed chair pick
- European equities higher across the board; S&P 500 futures down 0.3% but well off earlier lows of a decline of 0.9%
- WTI crude oil down 0.5% to $65.10
- Bitcoin down 2.0% to $82,724
What a wild end to the week it’s all setting up to be. The showstoppers today are once again the same as it has been all through this month, that being precious metals. Gold and silver both tumbled hard today amid a further run of profit-taking after the warning from yesterday already.
Gold dropped by over 7% at one point, poised for its worst day since April 2013 with the fall breaking under $5,000. That before a slight recovery now to be down 4.4% to $5,132 with volatile swings still persisting. Meanwhile, silver crashed hard by over 16% at the lows in a break below $100 before some light recovery again to around $103 levels now – still down over 10% on the day.
The moves are coming at neck-breaking speeds, with extreme volatility kicking into gear for precious metals as January comes to an end.
That’s having some reverberations elsewhere too with the dollar holding firmer across the board. However, the greenback is seeing gains trimmed during the session and also right as Trump announced Kevin Warsh as his pick for the next Fed chair.
EUR/USD dipped down to around 1.1900 earlier before recovering to 1.1940 now, down 0.2% on the day. USD/JPY is seen up 0.5% to 153.85 but off earlier highs above 154.00 with yen-tervention risks still in play.
Meanwhile, USD/CAD is seen up 0.1% to 1.3505 and AUD/USD down 0.3% to 0.7020 with the dollar seeing gains ease a little from earlier.
In the equities space, things were also quite nervy amid all the chaos that is going on. European indices held calmer in rebounding from yesterday’s losses. But US futures were struggling earlier amid the unsettling mood in precious metals, with S&P 500 futures dropping by as low as 0.9% at one point. That before a slight recovery now to be down just 0.3% on the day.
In terms of data releases, there were quite a handful in Europe but all overshadowed by other market happenings. Euro area Q4 GDP reaffirmed more resilience in the economy towards the end of last year while early indications from Germany and Spain suggest that inflation pressures are still keeping more stubborn to start the new year.
It’s now back to gold and silver watch again in US trading later before the weekend.
This article was written by Justin Low at investinglive.com.
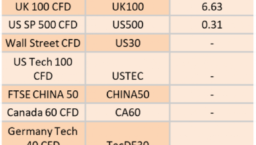
Ex-Dividend 02/02/2026
426054 January 30, 2026 18:40 ICMarkets Market News
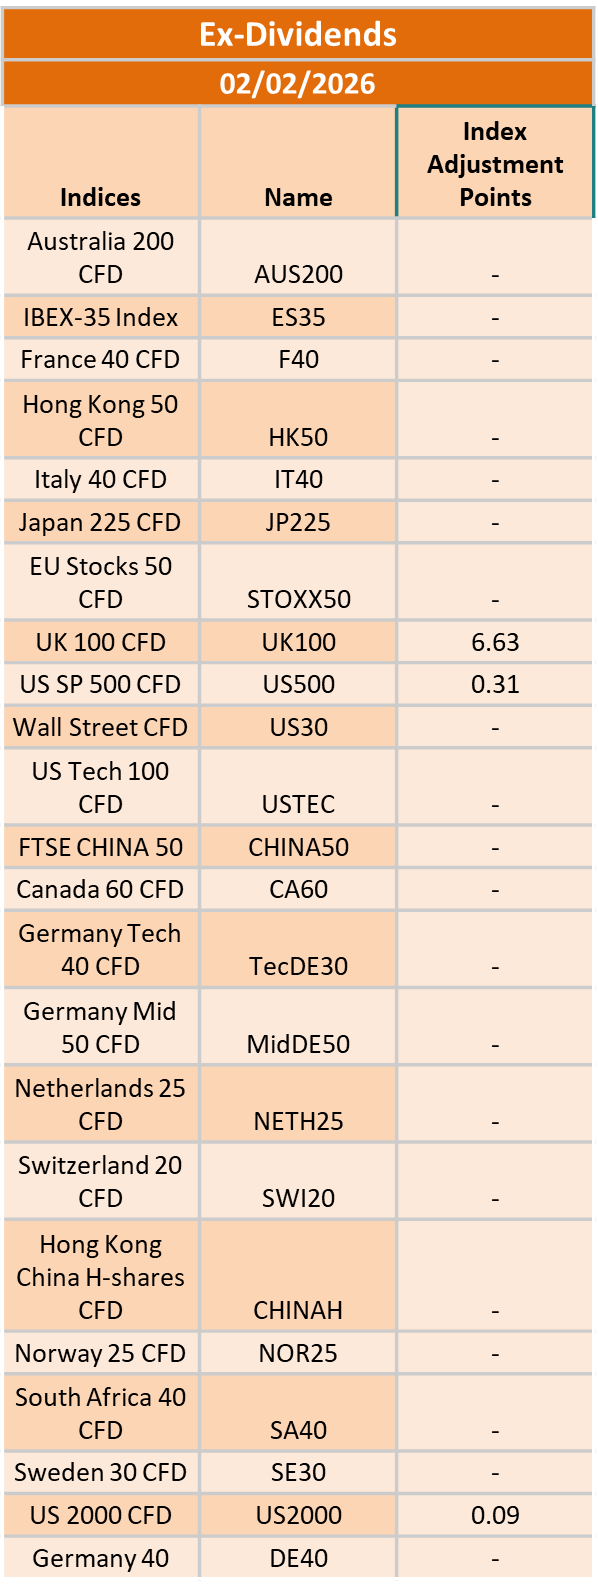
The post Ex-Dividend 02/02/2026 first appeared on IC Markets | Official Blog.
Friday 30th January 2026: Asian Markets Mixed as Tech Stocks Slide and Geopolitical Tensions Weigh
426053 January 30, 2026 17:40 ICMarkets Market News
Global Markets:
- Asian Stock Markets : Nikkei down 0.30%, Shanghai Composite down 1.19%, Hang Seng down 1.86% ASX down 0.68%
- Commodities : Gold at $5191.76 (-2.95%) Silver at $109.005 (-4.72%), Brent Oil at $68.49 (-1.57%), WTI Oil at $64.32 (-1.68%)
- Rates : US 10-year yield at 4.269, UK 10-year yield at 4.5140, Germany 10-year yield at 2.8308
News & Data:
- (USD) Unemployment Claims 209K to 206K expected
Markets Update:
Asian stock markets were mixed on Friday, tracking uneven cues from Wall Street overnight. Sentiment was pressured by sharp declines in technology stocks after Microsoft fell on weaker cloud growth and cautious guidance, while Apple warned of margin pressures. However, rising crude oil prices supported energy stocks and helped limit broader losses. Asian markets had ended mixed in the previous session.
Investor confidence was further dampened by escalating tensions between the U.S. and Iran. U.S. President Donald Trump warned that American forces were ready to take severe action if Iran refused nuclear negotiations, while Iran signaled it would retaliate, heightening geopolitical uncertainty.
In Australia, the stock market traded modestly lower after early gains. The S&P/ASX 200 slipped below the 8,900 mark, weighed down by losses in gold miners and technology stocks, though financial and energy shares provided some support. Major miners declined, while oil stocks advanced amid higher crude prices. Banking stocks edged higher, while tech stocks mostly weakened, except Appen, which surged sharply on upbeat quarterly revenue.
Japan’s stock market fell significantly in choppy trading, with the Nikkei 225 dropping below 52,950. Technology stocks dragged the index lower, partially offset by gains in automakers and financials. Elsewhere in Asia, China, Hong Kong and Taiwan recorded notable losses, while several Southeast Asian markets posted modest gains.
On Wall Street, U.S. stocks pared early losses on Thursday, with the Dow ending slightly higher, while the Nasdaq closed lower due to continued tech-sector weakness. European markets finished mixed. Crude oil prices jumped sharply amid concerns over potential supply disruptions stemming from Middle East tensions.
Upcoming Events:
- 01:30 PM GMT – CAD GDP m/m
The post Friday 30th January 2026: Asian Markets Mixed as Tech Stocks Slide and Geopolitical Tensions Weigh first appeared on IC Markets | Official Blog.
Eurozone Q4 preliminary GDP +0.3% vs +0.2% q/q expected
426052 January 30, 2026 17:27 Forexlive Latest News Market News
- Prior +0.3%
It’s a story of resilience in the euro area and that is reaffirmed by the headline estimate above. The economy has proved the naysayers wrong in 2025, holding firmer as a whole with Germany not succumbing to the manufacturing recession and France able to steer clear of troubled waters from political instability.
According to an estimation of annual growth for 2025, based on quarterly seasonally and calendar adjusted data, GDP increased by 1.5% in the euro area.
That will keep the ECB happy at least in staving off stagflation fears, that as they continue to keep on the sidelines in terms of policy setting. Inflation pressures will continue to be their number one priority for the time being.
This article was written by Justin Low at investinglive.com.
Friday 30th January 2026: Technical Outlook and Review
426018 January 30, 2026 17:00 ICMarkets Market News
DXY (U.S. Dollar Index):
Potential Direction: Bearish
Overall momentum of the chart: Bearish
The price has already reacted off the pivot and may continue its bearish move toward the 1st support.
Pivot: 96,57
Supporting reasons: Identified as an overlap resistance, where selling pressures could intensify and potentially cap any upward retracement.
1st support: 94.82
Supporting reasons: Identified as a support that aligns with the 361.8% Fibonacci extension, indicating a potential area where the price could again stabilize.
1st resistance: 97.74
Supporting reasons: Identified as a pullback resistance, indicating a potential area that could halt any further upward movement
EUR/USD:
Potential Direction: Bullish
Overall momentum of the chart: Bullish
The price could see a short-term pullback toward the pivot before continuing its bullish move toward the 1st resistance
Pivot: 1.1875
Supporting reasons: Identified as a pullback support that aligns with the 38.2% Fibonacci retracement, where renewed buying pressure could emerge to push the price higher.
1st support: 1.1805
Supporting reasons: Identified as a pullback support, indicating a potential level where the price could stabilize once again.
1st resistance: 1.2092
Supporting reasons: Identified as a resistance, indicating a potential level that could cap further upward movement.
EUR/JPY:
Potential Direction: Bearish
Overall momentum of the chart: Bullish
The price could see a short-term pullback toward the pivot before continuing its bearish move down toward the 1st support.
Pivot: 183.52
Supporting reasons: Identified as a pullback resistance that aligns with the 38.2% Fibonacci retracement, where selling pressures could intensify and potentially cap any upward retracement.
1st support: 181.72
Supporting reasons: Identified as an overlap support, indicating a potential area where the price could again stabilize.
1st resistance: 184.82
Supporting reasons: Identified as a pullback resistance that aligned with the 61.8% Fibonacci retracement, indicating a potential level that could cap further upward movement.
EUR/GBP:
Potential Direction: Bearish
Overall momentum of the chart: Bullish
The price could see a short-term pullback toward the pivot before continuing its bearish move down toward the 1st support.
Pivot: 0.8695
Supporting reasons: Identified as an overlap resistance, where selling pressures could intensify and potentially cap any upward retracement.
1st support: 0.8643
Supporting reasons: Identified as a multi-swing low support, indicating a potential area where the price could stabilize once more.
1st resistance: 0.8745
Supporting reasons: Identified as an overlap resistance, indicating a potential level that could cap further upward movement.
GBP/USD:
Potential Direction: Bullish
Overall momentum of the chart: Bullish
The price could see a short-term pullback toward the pivot before rising again toward the 1st resistance.
Pivot: 1.3666
Supporting reasons: Identified as a pullback support that aligns with the 38.2% Fibonacci retracement, where renewed buying pressure could emerge to push the price higher.
1st support: 1.3552
Supporting reasons: Identified as a pullback support that aligns with the 61.8% Fibonacci retracement, indicating a potential area where the price could stabilize once more.
1st resistance: 1.3869
Supporting reasons: Identified as a swing resistance, indicating a potential level that could halt further upward movement.
GBP/JPY:
Potential Direction: Bearish
Overall momentum of the chart: Bullish
The price could see a short-term pullback toward the pivot before continuing its bearish move down toward the 1st support.
Pivot: 211.96
Supporting reasons: Identified as a multi-swing low resistance, where selling pressures could intensify and potentially cap any upward retracement.
1st support: 210.04
Supporting reasons: Identified as a pullback support, indicating a potential level where the price could stabilize once more.
1st resistance: 211.96
Supporting reasons: Identified as an overlap resistance that aligns with the 50% Fibonacci retracement, indicating a potential level that could halt further upward movement.
USD/CHF:
Potential Direction: Bearish
Overall momentum of the chart: Bearish
The price could see a short-term pullback toward the pivot before continuing its bearish move down toward the 1st support.
Pivot: 0.7736
Supporting reasons: Identified as a pullback resistance, where selling pressures could intensify and potentially cap any upward retracement.
1st support: 0.7605
Supporting reasons: Identified as a swing low support, indicating a potential level where the price could stabilize once again.
1st resistance: 0.7858
Supporting reasons: Identified as a pullback resistance, indicating a potential level that could cap further upward movement.
USD/JPY:
Potential Direction: Bearish
Overall momentum of the chart: Bullish
The price could see a short-term pullback toward the pivot before continuing its bearish move down toward the 1st support.
Pivot: 154.67
Supporting reasons: Identified as an overlap resistance that aligns with the 38.2% Fibonacci retracement, where selling pressures could intensify and potentially cap any upward retracement.
1st support: 152.16
Supporting reasons: Identified as a swing low support, indicating a strong area where buyers might return, and the price could stabilize once again.
1st resistance: 156.21
Supporting reasons: Identified as a pullback resistance that aligns with the 61.8%% Fibonacci retracement. This level represents the next key area where upward movement could be capped amid increased selling pressure
USD/CAD:
Potential Direction: Bearish
Overall momentum of the chart: Bearish
The price could see a short-term pullback toward the pivot before continuing its bearish move down toward the 1st support.
Pivot: 1.3651
Supporting reasons: Identified as a pullback resistance, where selling pressures could intensify and potentially cap any upward retracement.
1st support: 1.3464
Supporting reasons: Identified as a swing low support that aligns with the 161.8% Fibonacci extension, indicating a key level where the price could stabilize once more.
1st resistance: 1.3792
Supporting reasons: Identified as an overlap resistance, making it a possible target for bullish advances and a level where some sellers could return to cap gains
AUD/USD:
Potential Direction: Bullish
Overall momentum of the chart: Bullish
The price could see a short-term pullback toward the pivot before rising again toward the 1st resistance.
Pivot: 0.6934
Supporting reasons: Identified as a pullback support that aligns with the 38.2%% Fibonacci retracement, where renewed buying pressure could emerge to push the price higher.
1st support: 0.6760
Supporting reasons: Identified as a pullback support that aligns with the 78.6%% Fibonacci retracement, this area has provided strong support historically and may attract buying interest for a potential short-term bounce
1st resistance: 0.7091
Supporting reasons: Identified as a swing high resistance, indicating a potential area that could halt any further upward movement.
NZD/USD
Potential Direction: Bullish
Overall momentum of the chart: Bullish
The price could see a short-term pullback toward the pivot before rising again toward the 1st resistance.
Pivot: 0.5991
Supporting reasons: Identified as a pullback support, where renewed buying pressure could emerge to push the price higher.
1st support: 0.5913
Supporting reasons: Identified as a pullback support, this area has provided strong support historically and may attract buying interest for a potential short-term bounce
1st resistance: 0.6121
Supporting reasons: Identified as a swing high resistance, indicating a potential area that could halt any further upward movement.
US30 (DJIA):
Potential Direction: Bullish
Overall momentum of the chart: Bullish
The price could see a short-term pullback toward the pivot before rising again toward the 1st resistance.
Pivot: 48,844.50
Supporting reasons: Identified as a pullback support that aligns with the 61.8% Fibonacci retracement, where renewed buying pressure could emerge to push the price higher.
1st support: 48,330.52
Supporting reasons: Identified as an overlap support, suggesting a potential area where the price could stabilize once again.
1st resistance: 49,617.45
Supporting reasons: Identified as a multi-swing high resistance, indicating a potential area that could halt any further upward movement.
DE40 (DAX):
Potential Direction: Bullish
Overall momentum of the chart: Bullish
The price has already bounced off the pivot and may continue its bullish move toward the 1st resistance
Pivot: 24,402.71
Supporting reasons: Identified as an overlap support, where renewed buying pressure could emerge to push the price higher.
1st support: 23,870.49
Supporting reasons: Identified as an overlap support, indicating a key level where the price could stabilize once more.
1st resistance: 25,038.90
Supporting reasons: Identified as a pullback resistance, indicating a potential area that could halt any further upward movement.
US500 (S&P 500):
Potential Direction: Bullish
Overall momentum of the chart: Bullish
The price has already bounced off the pivot and may continue its bullish move toward the 1st resistance
Pivot: 6,878.05
Supporting reasons: Identified as an overlap support, where renewed buying pressure could emerge to push the price higher.
1st support: 6,807.47
Supporting reasons: Identified as a swing low support, indicating a potential level where the price could stabilize once again.
1st resistance: 7,007.13
Supporting reasons: Identified as a swing high resistance, indicating a potential area that could halt any further upward movement.
BTC/USD (Bitcoin):
Potential Direction: Bearish
Overall momentum of the chart: Bearish
The price could see a short-term pullback toward the pivot before continuing its bearish move down toward the 1st support.
Pivot: 86,241.33
Supporting reasons: Identified as a pullback resistance, where selling pressures could intensify and potentially cap any upward retracement.
1st support: 83,241.19
Supporting reasons: Identified as a swing low support that aligns with the 161.8% Fibonacci extension, indicating a potential level where the price could stabilize once more.
1st resistance: 87,446.34
Supporting reasons: Identified as a pullback resistance, indicating a potential area that could halt any further upward movement.
ETH/USD (Ethereum):
Potential Direction: Bearish
Overall momentum of the chart: Bullish
The price could see a short-term pullback toward the pivot before continuing its bearish move down toward the 1st support.
Pivot: 2,886.29
Supporting reasons: Identified as a pullback resistance, where selling pressures could intensify and potentially cap any upward retracement.
1st support: 2,738.52
Supporting reasons: Identified as a swing low support, indicating a potential level where the price could stabilize once more.
1st resistance: 3,028.91
Supporting reasons: Identified as an overlap resistance, indicating a potential area that could halt any further upward movement.
WTI/USD (Oil):
Potential Direction: Bullish
Overall momentum of the chart: Bullish
The price could see a short-term pullback toward the pivot before continuing its bullish move toward the 1st resistance
Pivot: 62.49
Supporting reasons: Identified as a pullback support, where renewed buying pressure could emerge to push the price higher.
1st support: 60.76
Supporting reasons: Identified as an overlap support, indicating a key level where the price could stabilize once more.
1st resistance: 66.48
Supporting reasons: Identified as a swing high resistance, indicating a potential area that could halt any further upward movement.
XAU/USD (GOLD):
Potential Direction: Bullish
Overall momentum of the chart: Bullish
The price could see a short-term pullback toward the pivot before continuing its bullish move toward the 1st resistance
Pivot: 5,308.88
Supporting reasons: Identified as a pullback support, where renewed buying pressure could emerge to push the price higher.
1st support: 5,093.49
Supporting reasons: Identified as a pullback support, indicating a key level where the price could stabilize once more.
1st resistance: 5,597.00
Supporting reasons: Identified as a swing high resistance, indicating a potential area that could halt any further upward movement.
The accuracy, completeness and timeliness of the information contained on this site cannot be guaranteed. IC Markets Global does not warranty, guarantee or make any representations, or assume any liability regarding financial results based on the use of the information in the site.
News, views, opinions, recommendations and other information obtained from sources outside of www.icmarkets.com, used in this site are believed to be reliable, but we cannot guarantee their accuracy or completeness. All such information is subject to change at any time without notice. IC Markets Global assumes no responsibility for the content of any linked site.
The fact that such links may exist does not indicate approval or endorsement of any material contained on any linked site. IC Markets Global is not liable for any harm caused by the transmission, through accessing the services or information on this site, of a computer virus, or other computer code or programming device that might be used to access, delete, damage, disable, disrupt or otherwise impede in any manner, the operation of the site or of any user’s software, hardware, data or property.
The post Friday 30th January 2026: Technical Outlook and Review first appeared on IC Markets | Official Blog.
Friday 30th January 2026: Technical Outlook and Review
426016 January 30, 2026 17:00 ICMarkets Market News
DXY (U.S. Dollar Index):
Potential Direction: Bearish
Overall momentum of the chart: Bearish
The price has already reacted off the pivot and may continue its bearish move toward the 1st support.
Pivot: 96,57
Supporting reasons: Identified as an overlap resistance, where selling pressures could intensify and potentially cap any upward retracement.
1st support: 94.82
Supporting reasons: Identified as a support that aligns with the 361.8% Fibonacci extension, indicating a potential area where the price could again stabilize.
1st resistance: 97.74
Supporting reasons: Identified as a pullback resistance, indicating a potential area that could halt any further upward movement
EUR/USD:
Potential Direction: Bullish
Overall momentum of the chart: Bullish
The price could see a short-term pullback toward the pivot before continuing its bullish move toward the 1st resistance
Pivot: 1.1875
Supporting reasons: Identified as a pullback support that aligns with the 38.2% Fibonacci retracement, where renewed buying pressure could emerge to push the price higher.
1st support: 1.1805
Supporting reasons: Identified as a pullback support, indicating a potential level where the price could stabilize once again.
1st resistance: 1.2092
Supporting reasons: Identified as a resistance, indicating a potential level that could cap further upward movement.
EUR/JPY:
Potential Direction: Bearish
Overall momentum of the chart: Bullish
The price could see a short-term pullback toward the pivot before continuing its bearish move down toward the 1st support.
Pivot: 183.52
Supporting reasons: Identified as a pullback resistance that aligns with the 38.2% Fibonacci retracement, where selling pressures could intensify and potentially cap any upward retracement.
1st support: 181.72
Supporting reasons: Identified as an overlap support, indicating a potential area where the price could again stabilize.
1st resistance: 184.82
Supporting reasons: Identified as a pullback resistance that aligned with the 61.8% Fibonacci retracement, indicating a potential level that could cap further upward movement.
EUR/GBP:
Potential Direction: Bearish
Overall momentum of the chart: Bullish
The price could see a short-term pullback toward the pivot before continuing its bearish move down toward the 1st support.
Pivot: 0.8695
Supporting reasons: Identified as an overlap resistance, where selling pressures could intensify and potentially cap any upward retracement.
1st support: 0.8643
Supporting reasons: Identified as a multi-swing low support, indicating a potential area where the price could stabilize once more.
1st resistance: 0.8745
Supporting reasons: Identified as an overlap resistance, indicating a potential level that could cap further upward movement.
GBP/USD:
Potential Direction: Bullish
Overall momentum of the chart: Bullish
The price could see a short-term pullback toward the pivot before rising again toward the 1st resistance.
Pivot: 1.3666
Supporting reasons: Identified as a pullback support that aligns with the 38.2% Fibonacci retracement, where renewed buying pressure could emerge to push the price higher.
1st support: 1.3552
Supporting reasons: Identified as a pullback support that aligns with the 61.8% Fibonacci retracement, indicating a potential area where the price could stabilize once more.
1st resistance: 1.3869
Supporting reasons: Identified as a swing resistance, indicating a potential level that could halt further upward movement.
GBP/JPY:
Potential Direction: Bearish
Overall momentum of the chart: Bullish
The price could see a short-term pullback toward the pivot before continuing its bearish move down toward the 1st support.
Pivot: 211.96
Supporting reasons: Identified as a multi-swing low resistance, where selling pressures could intensify and potentially cap any upward retracement.
1st support: 210.04
Supporting reasons: Identified as a pullback support, indicating a potential level where the price could stabilize once more.
1st resistance: 211.96
Supporting reasons: Identified as an overlap resistance that aligns with the 50% Fibonacci retracement, indicating a potential level that could halt further upward movement.
USD/CHF:
Potential Direction: Bearish
Overall momentum of the chart: Bearish
The price could see a short-term pullback toward the pivot before continuing its bearish move down toward the 1st support.
Pivot: 0.7736
Supporting reasons: Identified as a pullback resistance, where selling pressures could intensify and potentially cap any upward retracement.
1st support: 0.7605
Supporting reasons: Identified as a swing low support, indicating a potential level where the price could stabilize once again.
1st resistance: 0.7858
Supporting reasons: Identified as a pullback resistance, indicating a potential level that could cap further upward movement.
USD/JPY:
Potential Direction: Bearish
Overall momentum of the chart: Bullish
The price could see a short-term pullback toward the pivot before continuing its bearish move down toward the 1st support.
Pivot: 154.67
Supporting reasons: Identified as an overlap resistance that aligns with the 38.2% Fibonacci retracement, where selling pressures could intensify and potentially cap any upward retracement.
1st support: 152.16
Supporting reasons: Identified as a swing low support, indicating a strong area where buyers might return, and the price could stabilize once again.
1st resistance: 156.21
Supporting reasons: Identified as a pullback resistance that aligns with the 61.8%% Fibonacci retracement. This level represents the next key area where upward movement could be capped amid increased selling pressure
USD/CAD:
Potential Direction: Bearish
Overall momentum of the chart: Bearish
The price could see a short-term pullback toward the pivot before continuing its bearish move down toward the 1st support.
Pivot: 1.3651
Supporting reasons: Identified as a pullback resistance, where selling pressures could intensify and potentially cap any upward retracement.
1st support: 1.3464
Supporting reasons: Identified as a swing low support that aligns with the 161.8% Fibonacci extension, indicating a key level where the price could stabilize once more.
1st resistance: 1.3792
Supporting reasons: Identified as an overlap resistance, making it a possible target for bullish advances and a level where some sellers could return to cap gains
AUD/USD:
Potential Direction: Bullish
Overall momentum of the chart: Bullish
The price could see a short-term pullback toward the pivot before rising again toward the 1st resistance.
Pivot: 0.6934
Supporting reasons: Identified as a pullback support that aligns with the 38.2%% Fibonacci retracement, where renewed buying pressure could emerge to push the price higher.
1st support: 0.6760
Supporting reasons: Identified as a pullback support that aligns with the 78.6%% Fibonacci retracement, this area has provided strong support historically and may attract buying interest for a potential short-term bounce
1st resistance: 0.7091
Supporting reasons: Identified as a swing high resistance, indicating a potential area that could halt any further upward movement.
NZD/USD
Potential Direction: Bullish
Overall momentum of the chart: Bullish
The price could see a short-term pullback toward the pivot before rising again toward the 1st resistance.
Pivot: 0.5991
Supporting reasons: Identified as a pullback support, where renewed buying pressure could emerge to push the price higher.
1st support: 0.5913
Supporting reasons: Identified as a pullback support, this area has provided strong support historically and may attract buying interest for a potential short-term bounce
1st resistance: 0.6121
Supporting reasons: Identified as a swing high resistance, indicating a potential area that could halt any further upward movement.
US30 (DJIA):
Potential Direction: Bullish
Overall momentum of the chart: Bullish
The price could see a short-term pullback toward the pivot before rising again toward the 1st resistance.
Pivot: 48,844.50
Supporting reasons: Identified as a pullback support that aligns with the 61.8% Fibonacci retracement, where renewed buying pressure could emerge to push the price higher.
1st support: 48,330.52
Supporting reasons: Identified as an overlap support, suggesting a potential area where the price could stabilize once again.
1st resistance: 49,617.45
Supporting reasons: Identified as a multi-swing high resistance, indicating a potential area that could halt any further upward movement.
DE40 (DAX):
Potential Direction: Bullish
Overall momentum of the chart: Bullish
The price has already bounced off the pivot and may continue its bullish move toward the 1st resistance
Pivot: 24,402.71
Supporting reasons: Identified as an overlap support, where renewed buying pressure could emerge to push the price higher.
1st support: 23,870.49
Supporting reasons: Identified as an overlap support, indicating a key level where the price could stabilize once more.
1st resistance: 25,038.90
Supporting reasons: Identified as a pullback resistance, indicating a potential area that could halt any further upward movement.
US500 (S&P 500):
Potential Direction: Bullish
Overall momentum of the chart: Bullish
The price has already bounced off the pivot and may continue its bullish move toward the 1st resistance
Pivot: 6,878.05
Supporting reasons: Identified as an overlap support, where renewed buying pressure could emerge to push the price higher.
1st support: 6,807.47
Supporting reasons: Identified as a swing low support, indicating a potential level where the price could stabilize once again.
1st resistance: 7,007.13
Supporting reasons: Identified as a swing high resistance, indicating a potential area that could halt any further upward movement.
BTC/USD (Bitcoin):
Potential Direction: Bearish
Overall momentum of the chart: Bearish
The price could see a short-term pullback toward the pivot before continuing its bearish move down toward the 1st support.
Pivot: 86,241.33
Supporting reasons: Identified as a pullback resistance, where selling pressures could intensify and potentially cap any upward retracement.
1st support: 83,241.19
Supporting reasons: Identified as a swing low support that aligns with the 161.8% Fibonacci extension, indicating a potential level where the price could stabilize once more.
1st resistance: 87,446.34
Supporting reasons: Identified as a pullback resistance, indicating a potential area that could halt any further upward movement.
ETH/USD (Ethereum):
Potential Direction: Bearish
Overall momentum of the chart: Bullish
The price could see a short-term pullback toward the pivot before continuing its bearish move down toward the 1st support.
Pivot: 2,886.29
Supporting reasons: Identified as a pullback resistance, where selling pressures could intensify and potentially cap any upward retracement.
1st support: 2,738.52
Supporting reasons: Identified as a swing low support, indicating a potential level where the price could stabilize once more.
1st resistance: 3,028.91
Supporting reasons: Identified as an overlap resistance, indicating a potential area that could halt any further upward movement.
WTI/USD (Oil):
Potential Direction: Bullish
Overall momentum of the chart: Bullish
The price could see a short-term pullback toward the pivot before continuing its bullish move toward the 1st resistance
Pivot: 62.49
Supporting reasons: Identified as a pullback support, where renewed buying pressure could emerge to push the price higher.
1st support: 60.76
Supporting reasons: Identified as an overlap support, indicating a key level where the price could stabilize once more.
1st resistance: 66.48
Supporting reasons: Identified as a swing high resistance, indicating a potential area that could halt any further upward movement.
XAU/USD (GOLD):
Potential Direction: Bullish
Overall momentum of the chart: Bullish
The price could see a short-term pullback toward the pivot before continuing its bullish move toward the 1st resistance
Pivot: 5,308.88
Supporting reasons: Identified as a pullback support, where renewed buying pressure could emerge to push the price higher.
1st support: 5,093.49
Supporting reasons: Identified as a pullback support, indicating a key level where the price could stabilize once more.
1st resistance: 5,597.00
Supporting reasons: Identified as a swing high resistance, indicating a potential area that could halt any further upward movement.
The accuracy, completeness and timeliness of the information contained on this site cannot be guaranteed. IC Markets Global does not warranty, guarantee or make any representations, or assume any liability regarding financial results based on the use of the information in the site.
News, views, opinions, recommendations and other information obtained from sources outside of www.icmarkets.com, used in this site are believed to be reliable, but we cannot guarantee their accuracy or completeness. All such information is subject to change at any time without notice. IC Markets Global assumes no responsibility for the content of any linked site.
The fact that such links may exist does not indicate approval or endorsement of any material contained on any linked site. IC Markets Global is not liable for any harm caused by the transmission, through accessing the services or information on this site, of a computer virus, or other computer code or programming device that might be used to access, delete, damage, disable, disrupt or otherwise impede in any manner, the operation of the site or of any user’s software, hardware, data or property.
The post Friday 30th January 2026: Technical Outlook and Review first appeared on IC Markets | Official Blog.
IC Markets Global – Europe Fundamental Forecast | 30 January 2026
426015 January 30, 2026 17:00 ICMarkets Market News
IC Markets Global – Europe Fundamental Forecast | 30 January 2026
What happened in the Asia session?
Asia session, markets digested the Fed’s rate hold and US policy signals, with Hang Seng rallying sharply on gold support while PSEi fell on GDP woes; FX pairs like USDJPY and EURUSD saw sharp dollar-driven swings, alongside Australia’s sticky inflation data, impacting currencies most directly amid choppy regional equities and commodity retreats.
What does it mean for the Europe & US sessions?
The Producer Price Index (PPI) for December will be released at 8 a.m. ET and the Chicago PMI for January at 9 a.m. ET, as these could signal inflation trends and manufacturing health amid Fed policy scrutiny. Earnings from major firms like Exxon Mobil, Chevron, American Express, and Verizon are also due, potentially driving energy and financial sector volatility. In Europe, watch Germany’s flash inflation and early GDP estimates for the Eurozone direction, alongside ongoing ECB patience on rates.
The Dollar Index (DXY)
Key news events today
Core PPI m/m (1:30 pm GMT)
PPI m/m (1:30 pm GMT)
What can we expect from DXY today?
The dollar stabilized modestly after a volatile week, buoyed by Bessent’s hawkish stance and steady Fed policy, but faces downside risks from Trump’s weaker-dollar leanings, tariff threats against Canada and others, and rising global tensions, with forecasts eyeing 97.19 by quarter-end before potentially dipping to 95.39 in 12 months.
Central Bank Notes:
- The Federal Open Market Committee (FOMC) is widely expected to hold the federal funds rate target range steady at 3.50%–3.75% at its January 27–28, 2026, meeting, marking the second consecutive pause after three 25-basis-point cuts in late 2025.
- The Committee continues to pursue maximum employment and 2% inflation goals, with the labour market remaining soft as the unemployment rate stood at 4.4% in December 2025 amid modest job gains of 50,000.
- Officials note balanced risks to growth and employment alongside sticky inflation, with CPI at 2.7% year-over-year in December 2025 and core PCE at 2.8% due to tariffs and housing pressures; headline PCE at 2.6%.
- Economic activity expanded robustly at 4.4% annualized in Q3 2025, with Q4 estimates around 5% per Atlanta Fed GDPNow, supported by consumer spending despite prior trade tensions and shutdown effects.
- December 2025’s Summary of Economic Projections forecasts 2025 unemployment at a median of 4.5%, 2026 GDP growth at 2.3%, and core PCE at 2.5% (down from prior 2.6%), with the dot plot signalling one more cut in 2026; January updates may reflect resilient Q4 growth.
- The Committee maintained its data-dependent approach, noting a stable but soft labour market and inflation above target, while holding rates steady at 3.50%-3.75%; dissents likely persist amid divisions on the pace of easing.
- The FOMC continues its adjusted quantitative tightening post-December 1, 2025, conclusion of the prior program, with Treasury rolloff caps at $5 billion per month and agency MBS at $35 billion per month to maintain ample reserves.
- The next meeting is scheduled for 17 to 18 March 2026.
Next 24 Hours Bias
Medium Bearish
Gold (XAU)
Key news events today
Core PPI m/m (1:30 pm GMT)
PPI m/m (1:30 pm GMT)
What can we expect from Gold today?
Gold prices experienced volatility, dipping to around $5,332 per ounce after hitting fresh records above $5,400 the previous day, amid profit-taking and a stronger US dollar. Despite the pullback, gold remained on track for massive monthly gains of over 23%, fueled by safe-haven demand tied to policy uncertainty, Federal Reserve steadiness, and a weaker dollar earlier in the week.
Next 24 Hours Bias
Strong Bullish
The Euro (EUR)
Key news events today
German Prelim CPI m/m (9:00 am GMT)
German Prelim GDP q/q (9:00 am GMT)
What can we expect from EUR today?
The euro remains in focus amid its recent surge past $1.20 against a weakening dollar, fueled by broad USD selling pressure and up 2.1% for January so far, marking its strongest run since 2017. ECB officials are growing wary, noting the strong euro risks undershooting inflation goals and prompting potential monetary easing hints at the upcoming February meeting.
Central Bank Notes:
- The Governing Council of the ECB kept the three key interest rates unchanged at its 4–5 January 2026 meeting, maintaining the main refinancing rate at 2.15%, the marginal lending facility at 2.40% and the deposit facility at 2.00%. This decision aligns with the assessment that the current stance supports medium-term price stability, as inflation edges below the 2% target while growth shows resilience amid balanced risks. Markets and commentary indicate value in holding steady, with no fixed path ahead given uncertainties in data.
- Price dynamics remain stable near target levels. Headline HICP inflation stood at 2.1% in November 2025, with projections for 1.9% in 2026 driven by base effects from energy and easing non-energy components. Services inflation persists somewhat elevated but trends toward moderation, alongside contained food pressures.
- December 2025 Eurosystem staff projections confirm headline inflation at 2.1% for 2025, declining to 1.9% in 2026 and 1.8% in 2027 before nearing 2% in 2028. Downside risks from soft producer prices and anchored expectations offset potential upsides from geopolitics or fiscal measures.
- Euro area GDP growth remains resilient at subdued levels, with Q3 2025 at 0.3% qoq and forecasts around 1.2-1.4% for 2025-2027. Surveys signal stabilization, bolstered by public investment and external demand against softer private spending.
- The labour market stays tight overall, with unemployment steady at 6.4% through October 2025, near historic lows and solid participation. Real incomes support consumption as inflation eases, with credit conditions aiding gradual household and firm expansion.
- Business sentiment reflects caution over US policy, trade tensions, and tariffs, tempered by easing supply chains and a competitive euro. Export sectors gain a modest lift, while domestic drivers like investment build momentum.
- The Governing Council will continue to make data-dependent decisions meeting by meeting, assessing inflation outlook, underlying trends, and transmission. Both hikes and cuts remain possible based on data, avoiding preset paths amid uncertainties.
- Balance sheet normalisation proceeds steadily, with APP and PEPP portfolios shrinking post-reinvestment halts, at a pace deemed suitable without market strain.
The next meeting is on 4 to 5 February 2026
Next 24 Hours Bias
Medium Bearish
The Swiss Franc (CHF)
Key news events today
No major news event
What can we expect from CHF today?
The Swiss Franc remains near decade-highs versus the USD (around 0.767-0.768), bolstered by its safe-haven status amid US trade unpredictability, Trump-era fiscal signals weakening the dollar, and global caution ahead of Fed decisions—prompting SNB vigilance but no immediate action, with the currency up sharply over the past month and year.
Central Bank Notes:
- At its 11 December 2025 monetary policy assessment, the Swiss National Bank (SNB) is widely expected to leave the policy rate unchanged at 0%, extending the pause that began in September as the Governing Board judges that current settings are sufficient to keep inflation near, but still below, its target while avoiding an unnecessary move into negative rates.
- Recent data show that the tentative rebound in Swiss inflation has stalled, with headline CPI easing from 0.1% year‑on‑year in October to 0.0% in November and core inflation slipping to about 0.4%, reinforcing the view that underlying price pressures remain very weak and that deflation risks, while contained, have not fully disappeared.
- The SNB’s conditional inflation forecast is likely to remain close to the September projections, with inflation still seen averaging roughly 0.2% in 2025, 0.5% in 2026, and 0.7% in 2027 under an unchanged policy rate path, though the latest CPI prints argue for a slightly lower near‑term profile and keep open the option of renewed easing if activity or prices weaken further.
- The global backdrop has deteriorated further, as continuing U.S. tariff actions and softer external demand weigh on world trade, while uncertainty in key European and U.S. markets for Swiss exports persists, leaving the SNB cautious about the growth outlook despite Switzerland’s relatively resilient domestic demand.
- Business and labour-market sentiment in export‑oriented manufacturing remains subdued, with firms reporting pressure on margins from the still‑strong franc and softer foreign orders, although the broader economy is still expected to grow at around 1–1.5% in 2025 and unemployment only drifting up gradually from low levels.
- The SNB continues to stress its willingness to act if deflation risks re‑emerge, reiterating that it can ease policy through renewed rate cuts or targeted foreign‑exchange intervention if necessary, while also highlighting its commitment to transparent communication, including the publication of detailed minutes from recent assessments and ongoing dialogue with international partners on FX policy
The next meeting is on 19 March 2026.
Next 24 Hours Bias
Strong Bullish
The Pound (GBP)
Key news events today
No major news event
What can we expect from GBP today?
The British pound softened slightly against the US dollar to around 1.3761, retreating from multi-month peaks near $1.38 amid dollar volatility and trader reassessments of UK economic strength following robust retail sales and PMI beats last week. While resilient UK data has curbed Bank of England rate cut bets and supported GBP’s outperformance among G-10 currencies, caution prevails with potential pullbacks toward 1.35 if supports fail.
Central Bank Notes:
- The Bank of England’s Monetary Policy Committee (MPC) will meet on 18 December 2025, with the current Bank Rate standing at 4.00 per cent after being held in a close 5–4 vote at the 5 November meeting. Market pricing and analyst commentary point to a high risk of a 25‑basis‑point cut to 3.75 per cent, but this remains conditional on incoming inflation and labour‑market data, so the December note should be treated as pre‑decision guidance rather than an ex‑post summary.
- The BoE is expected to leave its quantitative tightening (QT) framework broadly unchanged through year‑end, maintaining the lower reduction pace in gilt holdings that was set earlier in 2025. Official communications still characterise the existing QT path as consistent with a restrictive stance, with policymakers stressing that balance‑sheet reduction will remain gradual and sensitive to market‑liquidity conditions.
- Headline CPI inflation eased to 3.6 per cent year‑on‑year in October 2025, down from 3.8 per cent in September, helped by softer energy and goods prices, though it remains almost twice the 2 per cent target. Underlying inflation pressures, particularly in services, have continued to moderate only slowly, so the MPC’s central projection still envisages inflation moving closer to, but not yet reaching, 3 per cent over the course of 2026, contingent on further normalisation in energy and wage dynamics.
- UK economic activity remains weak heading into the December meeting, with the labour market showing further signs of slackening. The unemployment rate has risen toward just above 5 per cent on the latest three‑month figures to October, while overall regular pay growth has slowed to around the mid‑4 per cent range, reinforcing the view that domestic cost pressures are gradually easing.
- External conditions continue to cloud the outlook, with fragile global growth and fluctuating commodity prices contributing to bouts of financial‑market volatility. The MPC has highlighted that renewed global energy or food price shocks could temporarily slow the pace of disinflation, but such risks are currently judged unlikely to derail the medium‑term downward trajectory for inflation if domestic demand stays subdued.
- The balance of risks around the inflation outlook remains finely poised. Downside risks are linked to persistently weak domestic demand and rising unemployment, while upside risks come from still‑elevated inflation expectations, sticky services inflation, and the possibility that structural changes in the labour market leave less slack than conventional indicators suggest.
- Overall, the MPC’s stance going into December is restrictive but increasingly open to a gradual easing cycle, with any rate cuts expected to be measured and data‑dependent. Policymakers have reiterated that the Bank Rate will need to stay in restrictive territory until they are confident inflation is on a sustainable path back to the 2 per cent target, and they have signalled that the profile of cuts, once started, is likely to be shallow rather than rapid.
- The next meeting is on 5 February 2026.
Next 24 Hours Bias
Medium Bullish
The Canadian Dollar (CAD)
Key news events today
GDP m/m (1:30 pm GMT)
What can we expect from CAD today?
The Canadian dollar steadied near its recent highs around 1.35 per USD, driven by BoC’s stable policy and energy market resilience, but faced headwinds from renewed US trade threats and geopolitical risks; analysts eye 1.37 by quarter-end amid modest growth forecasts.
Central Bank Notes:
- The Governing Council left the target for the overnight rate unchanged at 2.25% at its 28 January 2026 meeting, consistent with market expectations and reinforcing the pause in easing after the December hold. The Bank highlighted ongoing global trade uncertainties, including U.S. policy risks, but noted a steadier external environment with no immediate need for policy shifts amid fragile world demand.
- Uncertainty from U.S. tariffs continues to cloud business confidence, yet Canadian manufacturing PMI and export orders have stabilised further, with backlogs modestly increasing despite restrained investment. Recent data indicate goods exports, particularly energy, provided ongoing support, though firms remain selective in expansion plans.
- Canada’s economy maintained momentum into late 2025 and early 2026, with Q4 GDP estimates around 2.0-2.5% annualised after Q3’s 2.6% rebound, driven by crude oil exports, public spending, and partial service sector recovery. January flash indicators suggest a balanced start to Q1, though weather disruptions slightly tempered output gains.
- Services activity strengthened, with PMI holding above 50 and gains spreading to tech, tourism, and professional sectors; however, consumer services stayed uneven due to persistent high prices curbing non-essential spending despite wage growth. The Bank views this broadening as a sign of structural adjustment progressing.
- Housing markets edged firmer nationally, with resales and prices up modestly in December-January on lower rates and steady demand, though major cities face renewed pressures tempered by strict lending rules and affordability hurdles. The Bank expects this stabilisation to persist without overheating.
- CPI inflation held near 2.2% year-over-year in December 2025 and into January 2026 estimates, within the 1-3% band, while core metrics like CPI-median and trim eased toward 2.8%, signaling waning underlying pressures despite shelter and energy volatility. This supports the Bank’s confidence in target convergence.
- Officials reaffirmed the 2.25% rate as appropriate for sustaining 2% inflation and economic adjustment, with no near-term cuts anticipated absent growth or inflation shocks. Focus shifts to Q1 data durability, core trend sustainability, and trade policy clarity.
- The next meeting is on 25 March 2026.
Next 24 Hours Bias
Medium Bullish
Oil
Key news events today
No major news event
What can we expect from Oil today?
Oil prices showed volatility, dipping slightly after a strong rally driven by geopolitical tensions. Brent hovered above $70 per barrel earlier in the week before retreating, while WTI traded around $65, reflecting a monthly gain poised to be the largest in years amid US threats against Iran.
Next 24 Hours Bias
Medium Bearish
The post IC Markets Global – Europe Fundamental Forecast | 30 January 2026 first appeared on IC Markets | Official Blog.