Articles

Trump: The Strait of Hormuz will automatically reopen after US exit
429122 March 31, 2026 22:40 Forexlive Latest News Market News
- Other nations can reopen the Strait
- Asked about reopening the Strait said “I do not think about it, to be honest” and that his sole goal was nuclear weapon
- More work to do in Iran war
- US doesn’t have to be in Iran much longer
Here is the article in the New York Post.
- “We’re not going to be there too much longer. We’re obliterating the s–t out of them right now, it’s a total obliteration”
- “But we won’t have to be there much longer — but we have more work to do
in terms of killing their offensive, whatever offensive capability they
have left.” - “Well, I think it’ll automatically open, but my attitude is, I’ve
obliterated the country. They have no strength left, and let the
countries that are using the strait, let them go and open it… because I
would imagine whoever’s controlling the oil will be very happy to open
the strait, he said. - On reopening: “I don’t think about it, to be honest. My sole function was to make
sure that they don’t have a nuclear weapon. They’re not going to have a
nuclear weapon. When we leave the strait will automatically open.” - “we’re dealing right now with a totally different group of people, and
they’re much more reasonable than previous, much more reasonable.”
This is the same stuff he’s been saying for awhile.
A clear gameplan is unfolding where the US will walk away, declare victory and leave Hormuz for someone else to clean up. Does that mean Iran actually opens it up? I doubt that’s the case unless they get something in return but time willtell.
This article was written by Adam Button at investinglive.com.
Iran’s Revolutionary Guard names 18 American tech companies for retaliation
429121 March 31, 2026 22:00 Forexlive Latest News Market News
Iran’s Revolutionary Guard named 18 companies for retaliation after strikes against its companies:
- Cisco
- HP
- Intel
- Oracle
- Microsoft
- Apple
- Meta
- IBM
- DEL
- Palantir
- Nvidia
- JP Morgan
- Tesla
- GE
- Spire Solution
- G42
- Boeing
It’s not clear if this is a warning about striking its companies or something else but Iran warned employees and civilians within 1Km to leave and vowed to strike these corporate facilities in retaliation for any assassinations in Iran.
We are seeing a selloff in these names but it coincides with a broader pullback in today’s market rally. The S&P 500 had been up 110 points but that’s down to 62 points with everything under pressure.
For Palantir, Microsoft, and Google, Iran specifically cited their involvement in defense contracts (like Project Maven or cloud services for the IDF) and AI-driven intelligence gathering used to coordinate strikes.
This article was written by Adam Button at investinglive.com.
JOLTs Job openings for February 6.882 million versus 6.918 million estimate
429120 March 31, 2026 21:40 Forexlive Latest News Market News
- Prior month 6.946 million revised up to 7.240 million
- JOLTs job openings for February 6.882M vs 6.918M estimate
- Hires 4.849M vs 5.347M last month
- Separations 4.971M versus 5.144M last month
- Quits 2.974M vs 3.137M last month
- Layoffs and discharges 1.721M vs 1.660M last month.
The JOLTs job openings fell sharply from 7.240M last month to 6.882M this month. Prior month was revised higher from 6.946M previously reported. Lower job openings is indicative of a weakening labor picture.
Here are the February 2026 (p) changes for the major categories:
- Total: -358
- Total private: -307
Industry Breakdown (thousands) showed that all industries show declines with the exception of professional business services:
- Mining and logging: -12K
- Construction: -28K
- Manufacturing: -71K
- Trade, transportation, and utilities: -8K
- Information: -9K
- Financial activities: -28K
- Professional and business services: +64
- Private education and health services: -78K
- Leisure and hospitality: -213K
- Government: -51K
Key takeaway:
- Broad-based weakness, led by leisure & hospitality (-213) and education/health (-78)
- Only notable gain: professional & business services (+64)
The quits rate can serve as a measure of workers willingness to or ability to leave jobs. A number of quits fell indicative of less confidence in getting another job.
Layoffs and discharges are involuntary separations initiated by the employer. The number of layoffs and discharges increased in the current month also indicative of a weaker jobs report.
Overall is a weaker report from the revised higher numbers from January. The jolts data is still above the low level from 2025 but the trend is to the downside.
The dollar is moving lower with the dollar falling to new lows vs the EUR, GBP, and JPY. The greenback still remains above the lows for the day versus the CHF, CAD, AUD. The dollar tested the low vs the NZD.
Oil prices are lower by about $0.41 but still above the $100 level at $102.75. Gold is higher by $94 or 2.08% of $4607. Silver is higher by $3.73 or 5.3% at $73.77. Both gold and silver are reacting to the lower dollar today.
US stocks are higher in getting a reprieve from the recent weakness. The NASDAQ is leading the way with a gain of 2.14%. The S&P is up 1.58% and the Dow industrial average is up 1.15%. The small-cap Russell 2000 is up 1.93%.
What is the JOLT Job Openings Report?
For background, the Job Openings and Labor Turnover Survey, published monthly by the U.S. Bureau of Labor Statistics, provides comprehensive data on labor market dynamics by tracking job openings, hires, and separations across approximately 16,400 nonfarm establishments nationwide. Released typically on the first Tuesday of each month at 10:00 a.m. ET, the report measures unmet labor demand and became a closely watched indicator after former Federal Reserve Chair Janet Yellen highlighted its importance in 2014. A job opening is defined as a position that is vacant on the last business day of the month, has work available, could start within 30 days, and involves active external recruiting. The survey also breaks down separations into quits, layoffs and discharges, and other separations, offering insights into worker confidence and employer demand.
This article was written by Greg Michalowski at investinglive.com.
US March consumer confidence 91.8 vs 88.0 expected
429119 March 31, 2026 21:00 Forexlive Latest News Market News
- Prior was 91.2 prior
Details:
- Present situation
- Expectations
- Jobs plentiful
- Jobs hard to get
US consumer confidence opened 2026 on shaky ground. The Conference Board’s Consumer Confidence Index plunged 9.7 points in January to 84.5, its lowest reading since May 2014 and well below the 91.1 level economists had forecast. The decline reflected growing anxiety over geopolitical tensions, persistent affordability pressures, and ongoing trade policy uncertainty. All five components of the index deteriorated, with the Present Situation Index dropping to 113.7 and the Expectations Index falling to 65.1 — well below the 80 threshold that has historically signaled recession risk.
February brought a modest rebound, with the headline index rising 2.2 points to 91.2. The improvement was driven primarily by the Expectations Index, which climbed 4.8 points to 72.0, while the Present Situation Index slipped further to 120.0. Despite the uptick, the Expectations Index remained below 80 for the thirteenth consecutive month — the longest sustained stretch below that level since the 2008 financial crisis.
The University of Michigan’s Consumer Sentiment Index told a similar story. Michigan’s gauge came in at 56.6 in February, barely changed from January’s 56.4, with households across income groups, age brackets, and political affiliations reporting weaker expectations for personal finances. Year-ahead inflation expectations held steady at 3.4%, halting six months of declines, while longer-term expectations edged down slightly to 3.2%.
Spending intentions in early 2026 have gravitated toward affordable necessities and lower-cost services, with restaurants, streaming, and personal care topping the list of planned outlays. Vacation plans softened in February, and while big-ticket purchase intentions improved slightly, consumers remained cautious about expensive discretionary spending.
Taken together, the early-2026 data paint a picture of a consumer base that views current conditions as tolerable but is increasingly wary about what lies ahead — a dynamic with significant implications for the roughly two-thirds of US GDP driven by household spending.
This article was written by Adam Button at investinglive.com.
US January CaseShiller 20-city house price index +1.2% vs +1.3% y/y expected
429118 March 31, 2026 20:40 Forexlive Latest News Market News
- Prior 1.4%
- House price M/M +0.2% vs +0.3% expected
- Prior +0.5%
House price data from the FHFA:
- Prices +1.6% y/y vs +1.8% prior (revised to +1.9%)
- Prices +0.1% m/m vs +0.1% prior
The US housing market remains weak and on continuing deceleration. This is January data, so things might have deteriorated much further after the US-Iran war broke out. Mortgage rates have risen substantially due to inflation fears and a much less dovish Fed.
What is the Case-Shiller Index:
The Case-Shiller Home Price Index is the leading measure of U.S. residential real estate prices. It tracks the changes in the value of residential real estate by monitoring the purchase price of the same single-family homes over time.
Developed in the 1980s by economists Karl Case and Robert Shiller, it is widely considered the “gold standard” for understanding housing market trends because it avoids the distortions found in “average” or “median” price reports.
This article was written by Giuseppe Dellamotta at investinglive.com.
Canada January GDP +0.1% vs 0.0% expected
429117 March 31, 2026 19:41 Forexlive Latest News Market News
- Prior was +0.2%
- Q4 GDP was -0.6%
- Goods-producing industries expanded by 0.2% for the second month in a row
- Services-producing industries were essentially unchanged in January
- 9 of the 20 industrial sectors recorded growth in January.
Canada’s economy closed out 2025 on shaky ground, and today’s January monthly GDP release arrives at a moment of heightened uncertainty. Real GDP grew just 1.7% for the full year of 2025, the slowest annual pace since the pandemic-driven contraction of 2020, with lower exports to the United States acting as the primary drag. The fourth quarter proved particularly disappointing: output contracted 0.6% on an annualized basis, missing both the Bank of Canada’s projection for a flat reading and the consensus call for a modest 0.2% decline. A massive inventory drawdown by manufacturers drove the headline miss, though underlying domestic demand held up better, expanding at a 2.4% quarterly pace.
The monthly data offered a slightly more encouraging signal heading into year-end. GDP by industry rose 0.2% in December, edging past expectations, but an advance estimate pointed to flat growth in January — suggesting the economy entered 2026 with limited momentum. Early readings indicated that a brief pickup in manufacturing activity proved short-lived, with the sector contracting again to start the year.
The broader backdrop remains complicated. Trade-related uncertainty weighed heavily on business investment throughout 2025, extending a decade of underinvestment that has contributed to Canada’s lagging productivity growth. The Bank of Canada, having cut rates by a full percentage point through 2025, held its policy rate at 2.25% in January 2026 and appears firmly set at neutral, leaving limited room for stimulus absent a clear deterioration. Consumer spending has been a relative bright spot, supported by real wage gains and earlier rate relief, but slowing population growth and a softening housing market pose headwinds. Today’s print will be closely watched for confirmation that the economy has stabilized — or for signs that the sluggish momentum carried into the new year is deepening.
This article was written by Adam Button at investinglive.com.
investingLive European FX news wrap: Eurozone inflation picks up; renewed deal optimism
429116 March 31, 2026 18:40 Forexlive Latest News Market News
- FX market still has not grasped full impact of energy shock – Goldman Sachs
- EURUSD keeps the bearish bias intact amid the US-Iran war; Focus stays on negotiations
- European stocks keep the calm today but set to cap one of the worst months in recent years
- Eurozone headline inflation picks up in March as energy prices surge on Middle East war
- ECB’s Muller: Current baseline projection could be already too optimistic
- The Nasdaq bounces as Trump is reportedly open to end the war without Hormuz condition
- Germany March unemployment change 0k vs 2k expected
- Three Chinese ships confirmed to have passed through Strait of Hormuz
- Gold consolidates awaiting potential US-Iran deal; Trump’s next move crucial
- France March preliminary CPI +1.7% vs +1.6% y/y expected
- What are the main events for today?
- German import prices move up slightly in February, just before the US-Iran war impact
- UK March Nationwide house prices +0.9% vs -0.1% m/m expected
- Germany February retail sales -0.6% vs +0.2% m/m expected
- UK Q4 final GDP +0.1% vs +0.1% q/q prelim
- FX option expiries for 31 March 10am New York cut
- Risk sentiment on the up but is it another false dawn?
The highlight of the session was the Eurozone inflation data for March. The data missed estimates but still showed an annual increase to 2.5% vs 1.9% prior due to elevated energy prices. Core inflation hasn’t been impacted yet as the annual rate fell to 2.3% vs 2.4% prior. This clearly shows that inflation conditions were pretty much perfect before the war started.
The main story today though has been the WSJ report released in the APAC session saying that Trump would be open to end the war with Iran without the Strait of Hormuz opening condition. This has led to some cautious optimism in the markets as stocks rebounded, oil prices eased and the US dollar pulled back.
Trump basically confirmed the report just a few moments ago as he said in a Truth Social post that countries affected by the Strait of Hormuz closure should get the oil themselves as the US won’t be there to help anymore.
It feels like a deal is really coming at this point and we could see the war ending before the April 6 deadline, so keep a close eye on the headlines and especially on Trump’s Truth Social account.
This article was written by Giuseppe Dellamotta at investinglive.com.
Trump invites countries affected by Hormuz closure to do it themselves; he won’t be there
429115 March 31, 2026 18:40 Forexlive Latest News Market News
Trump on Truth Social:
All of those countries that can’t get jet fuel because of the Strait of Hormuz, like the United Kingdom, which refused to get involved in the decapitation of Iran, I have a suggestion for you: Number 1, buy from the U.S., we have plenty, and Number 2, build up some delayed courage, go to the Strait, and just TAKE IT. You’ll have to start learning how to fight for yourself, the U.S.A. won’t be there to help you anymore, just like you weren’t there for us. Iran has been, essentially, decimated. The hard part is done. Go get your own oil! President DJT
Trump is basically confirming the WSJ report released in the APAC session saying that he would be open to end the war with Iran without the Strait of Hormuz opening condition.
He’s clearly upset as Iran’s resistance turned out to be stronger than expected and the damage being done to the US economy continues to increase.
It looks like he really wants to move forward but Iran is dictating conditions now. He will have to swallow his pride this time around as the longer this war drags on, the worse the impact on the economy and markets will be.
I feel like we are getting close to a deal…
This article was written by Giuseppe Dellamotta at investinglive.com.
Eurozone headline inflation picks up in March as energy prices surge on Middle East war
429114 March 31, 2026 16:40 Forexlive Latest News Market News
The preliminary CPI report for March sees headline annual inflation come in at 2.5%, just a touch softer than the 2.6% estimate. Still, it represents a notable bump to the 1.9% reading in February last month. The main cause for the jump is higher energy prices, as a result of the US-Iran conflict. Of note, energy prices were seen 4.9% higher than it was a year ago.
Other than that, food prices were seen up 2.4% compared to the same month one year ago. Meanwhile, services inflation was seen at 3.2% so that continues to remain a key sticking point for the ECB.
When looking at core prices though, the report was less worrying – at least for now. Core annual inflation was seen at 2.3%, missing slightly on estimates of 2.4%. That is also down a touch from the 2.4% reading in February but still above the 2.2% estimate from January.
While core prices are not showing a material jump just yet, it will eventually see spillover effects from broader inflation pressures in the euro area economy.
That especially if the war carries on for longer and higher energy prices become more entrenched into inflation expectations. That will eventually feed to input cost inflation in general and trickle down to consumers at some point.
As such, don’t be too quick to dismiss the jump in prices here. We’ve seen it all before with the Russia-Ukraine conflict. And ECB policymakers will be guarded in not wanting to repeat the mistake of calling inflation “transitory” again this time around.
This article was written by Justin Low at investinglive.com.
Tuesday 31st March 2026: Asia-Pacific Markets Volatile as Oil Prices Fall on Signs of U.S. De-Escalation With Iran
429113 March 31, 2026 15:40 ICMarkets Market News
Global Markets:
- Asian Stock Markets : Nikkei down 1.14%, Shanghai Composite down 0.3% Hang Seng down 0.52% ASX up 0.63%
- Commodities : Gold at $4,584.51 (0.20%) Silver at $72.145 (2.50%), Brent Oil at $107.71 (0.26%), WTI Oil at $103.57 (0.92%)
- Rates : US 10-year yield at 4.324, UK 10-year yield at 4.9340, Germany 10-year yield at 3.039
News & Data:
- (GBP) M4 Money Supply m/m 0.6% to 0.1% expected
Markets Update:
Asia-Pacific markets swung sharply on Tuesday as oil prices reversed earlier gains after reports suggested President Donald Trump was seeking to avoid a prolonged Middle East conflict. Investors reacted quickly to signals that Washington may scale back military objectives, easing immediate supply fears.
The Wall Street Journal reported that Trump told aides he was prepared to end U.S. hostilities against Iran even if the Strait of Hormuz remained largely closed. Oil futures responded by retreating, with West Texas Intermediate falling 0.72% to $102.14 per barrel and Brent crude slipping 1% to $111.55. Shipping through the vital Hormuz corridor, once responsible for about one-fifth of global seaborne oil flows, has slowed sharply since strikes began in late February.
Analysts said attempts to reopen the strategic waterway could extend the conflict beyond the expected six-week timeline. Strategist Ben Emons noted that easing tensions could help contain fuel costs and inflation pressures, while the evolving conflict increasingly favors de-escalation from the U.S. perspective.
Regional markets reflected the uncertainty. South Korea’s Kospi fell 2.2%, the Kosdaq dropped 1.9%, and the won weakened near multi-year lows. Japan’s Nikkei slipped slightly, while Australia’s benchmark rose 0.9%. Hong Kong’s Hang Seng edged lower, and mainland China’s CSI 300 remained largely steady.
Overnight, U.S. equities were mixed, though futures edged higher as investors watched policy signals closely
Upcoming Events:
- 12:30 PM GMT – CAD GDP m/m
The post Tuesday 31st March 2026: Asia-Pacific Markets Volatile as Oil Prices Fall on Signs of U.S. De-Escalation With Iran first appeared on IC Your Trading Edge | Official Blog.
Tuesday 31st March 2026: Technical Outlook and Review
429095 March 31, 2026 15:40 ICMarkets Market News
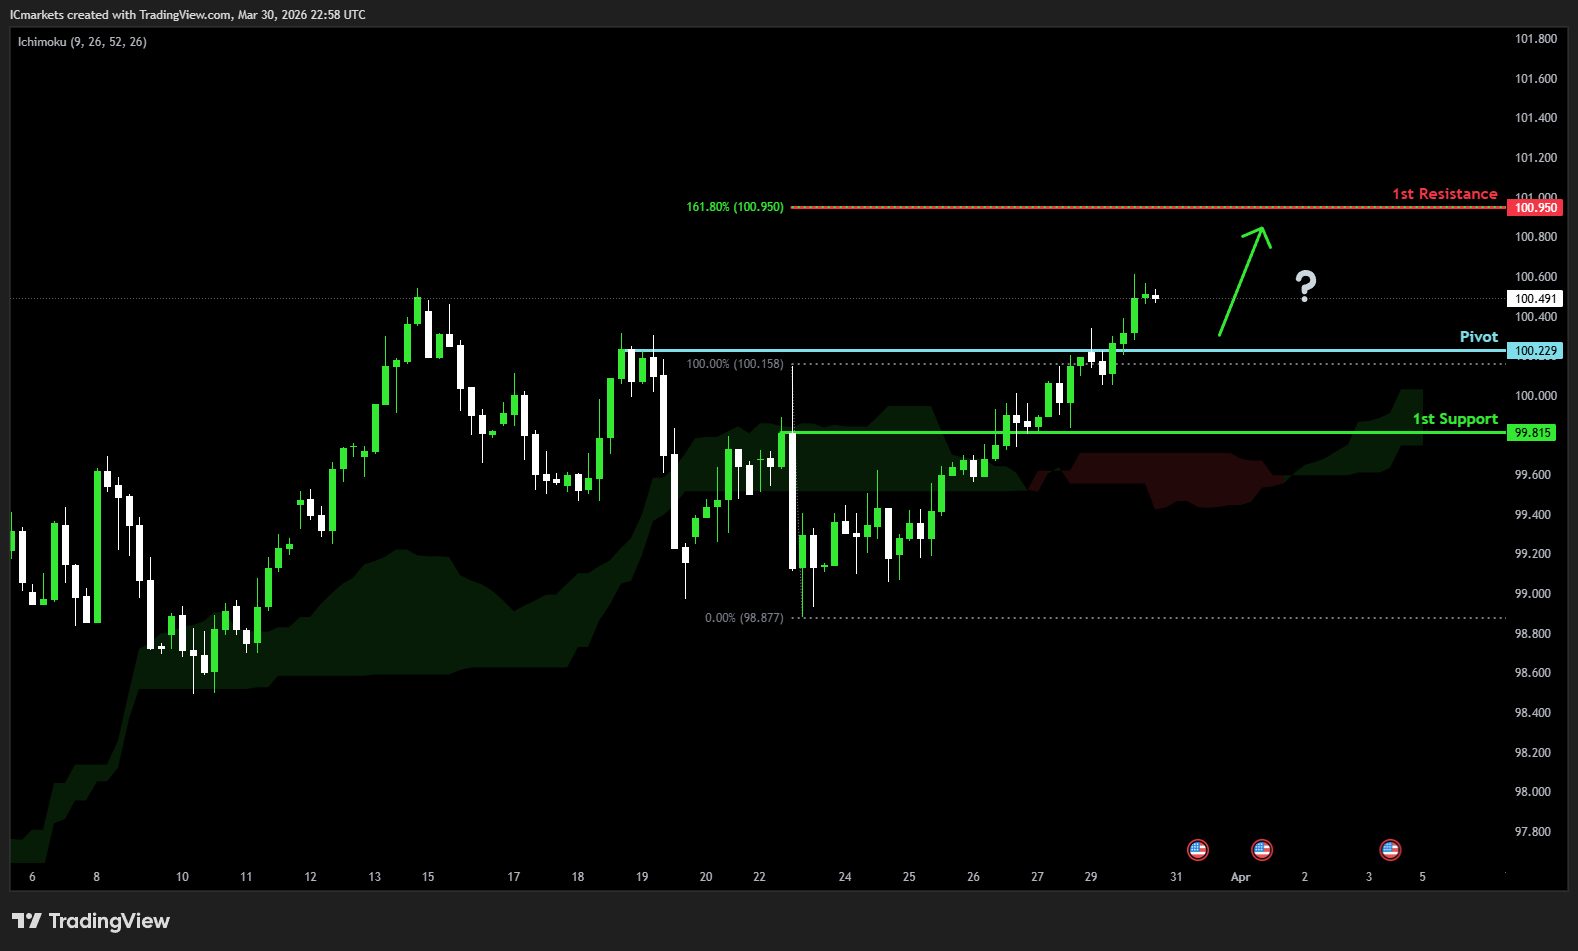
DXY (U.S. Dollar Index):
Potential Direction: Bullish
Overall momentum of the chart: Bearish
The price could see a short-term pullback toward the pivot before rising again toward the 1st resistance.
Pivot: 100.22
Supporting reasons: Identified as a pullback support, where renewed buying pressure could emerge to push the price higher.
1st support: 99.81
Supporting reasons: Identified as an overlap support, indicating a potential area where the price could again stabilize.
1st resistance: 100.95
Supporting reasons: Identified as a resistance that aligns with the 161.8% Fibonacci extension, indicating a potential area that could halt any further upward movement
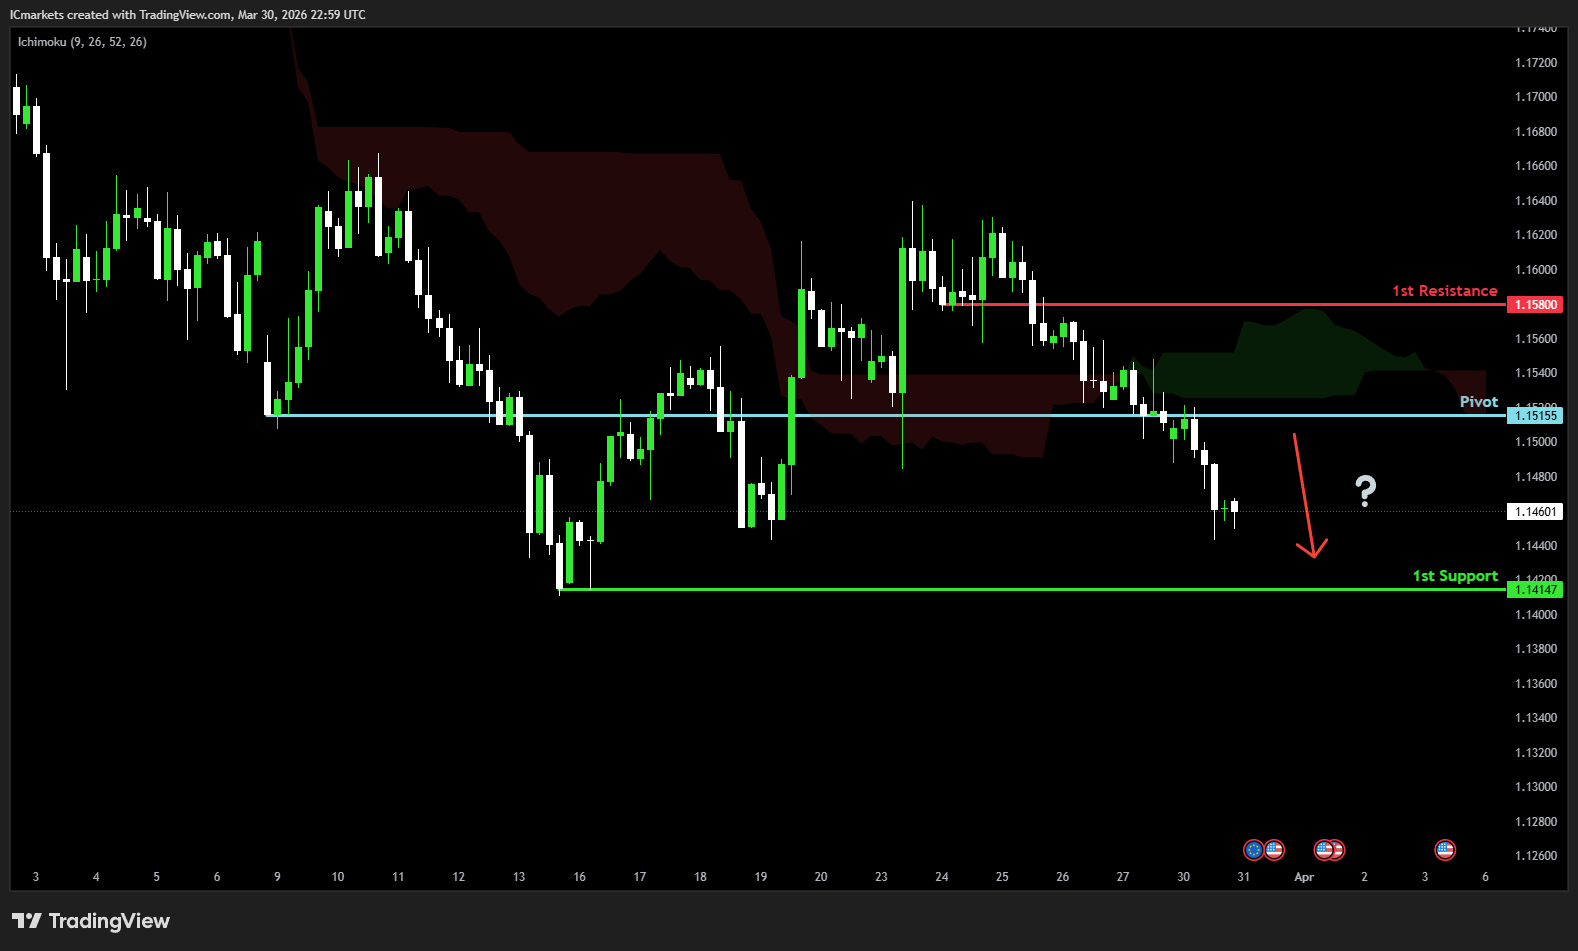
EUR/USD:
Potential Direction: Bearish
Overall momentum of the chart: Bullish
The price could see a short-term pullback toward the pivot before continuing its bearish move down toward the 1st support.
Pivot: 1.1515
Supporting reasons: Identified as a pullback resistance, where selling pressures could intensify and potentially cap any upward retracement.
1st support: 1.1414
Supporting reasons: Identified as a swing low support, indicating a potential level where the price could stabilize once again.
1st resistance: 1.1580
Supporting reasons: Identified as a pullback resistance, indicating a potential level that could cap further upward movement.
EUR/JPY:
Potential Direction: Bearish
Overall momentum of the chart: Bullish
The price could see a short-term pullback toward the pivot before continuing its bearish move down toward the 1st support.
Pivot: 183.60
Supporting reasons: Identified as a pullback resistance that aligns with the 50% Fibonacci retracement, where selling pressures could intensify and potentially cap any upward retracement.
1st support: 182.21
Supporting reasons: Identified as an overlap support, indicating a potential area where the price could again stabilize.
1st resistance: 184.68
Supporting reasons: Identified as an overlap resistance, indicating a potential level that could cap further upward movement.
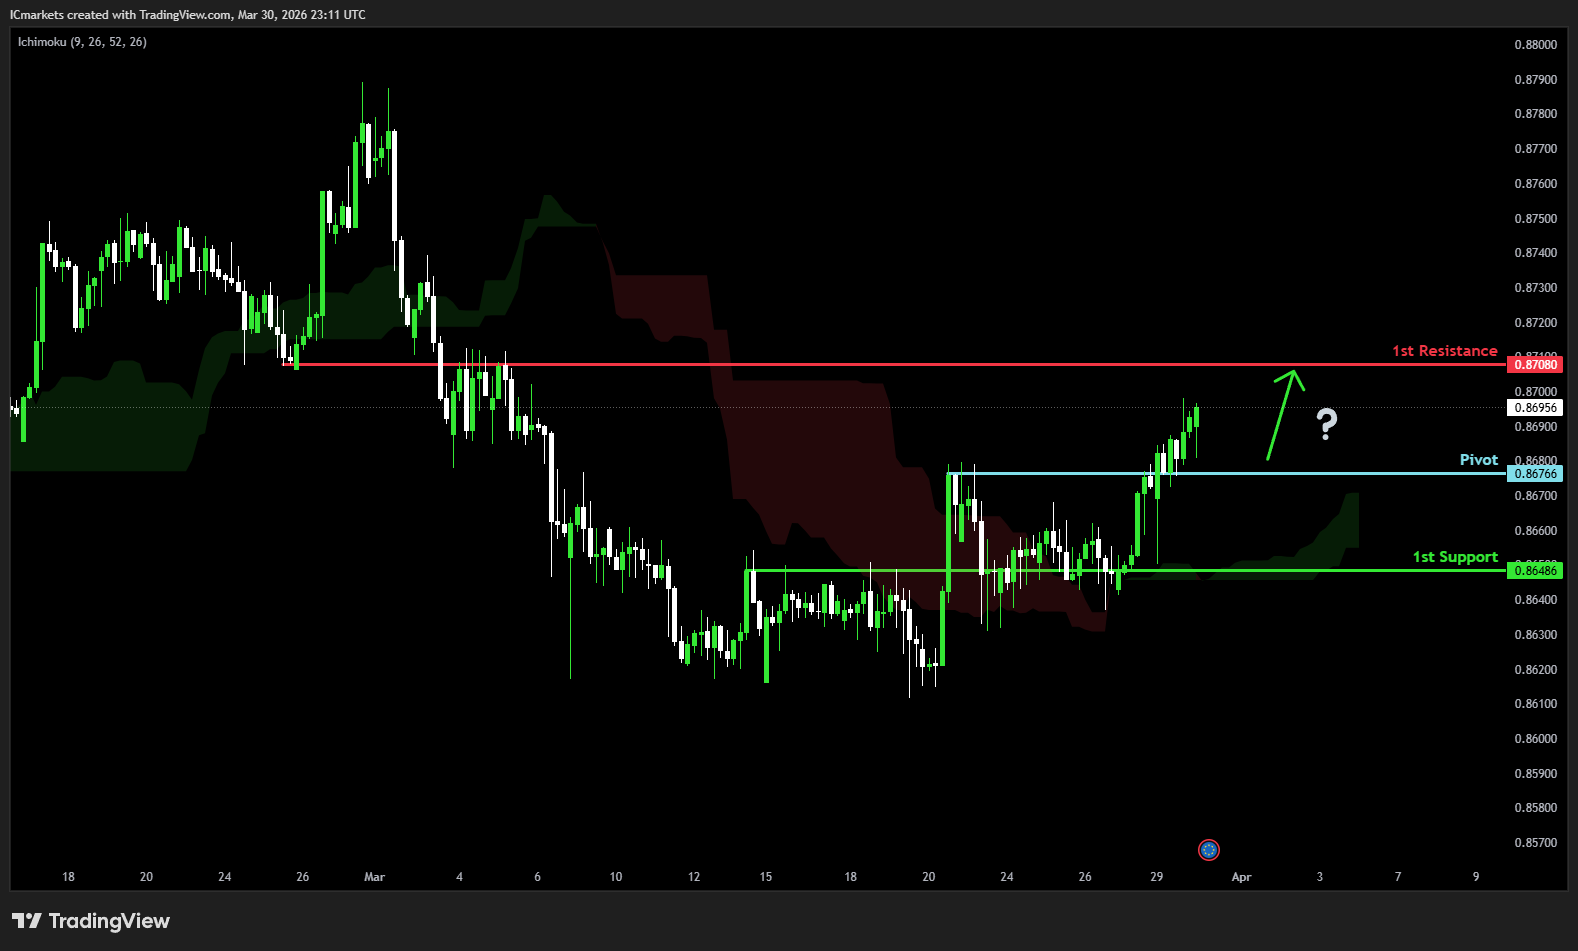
EUR/GBP:
Potential Direction: Bullish
Overall momentum of the chart: Bullish
The price could see a short-term pullback toward the pivot before rising again toward the 1st resistance.
Pivot: 0.8676
Supporting reasons: Identified as a pullback support, where renewed buying pressure could emerge to push the price higher.
1st support: 0.8648
Supporting reasons: Identified as an overlap support, indicating a potential area where the price could stabilize once more.
1st resistance: 0.8708
Supporting reasons: Identified as an overlap resistance, indicating a potential level that could cap further upward movement.
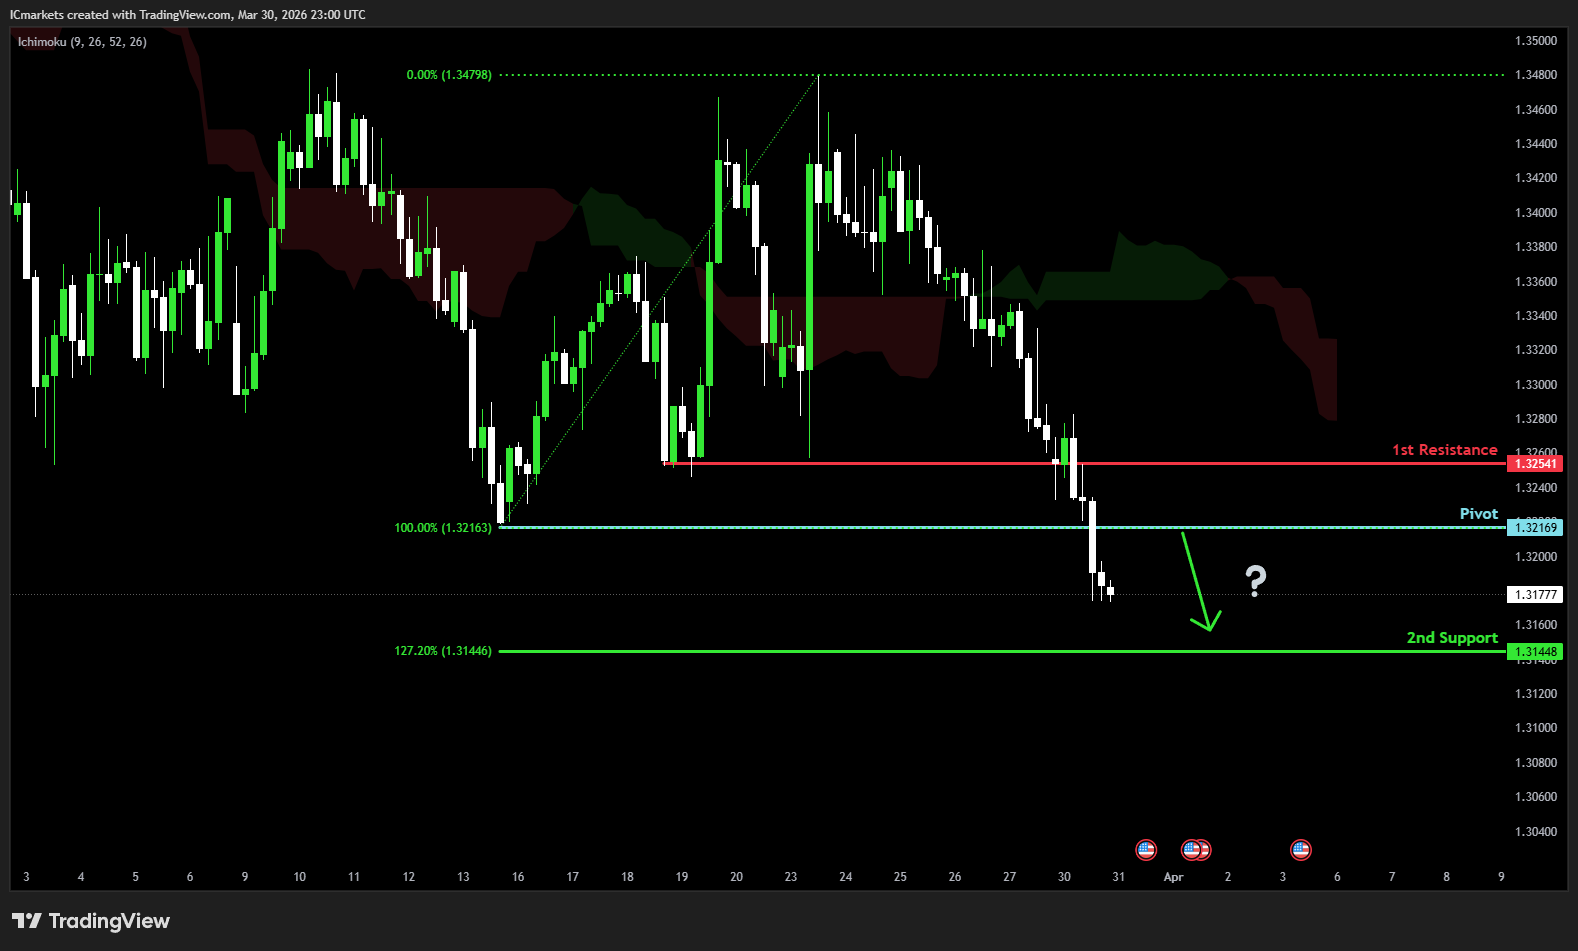
GBP/USD:
Potential Direction: Bearish
Overall momentum of the chart: Bullish
The price could see a short-term pullback toward the pivot before continuing its bearish move down toward the 1st support.
Pivot: 1.3216
Supporting reasons: Identified as a pullback resistance, where selling pressures could intensify and potentially cap any upward retracement.
1st support: 1.3144
Supporting reasons: Identified as a support that aligns with the 127.2% Fibonacci extension, indicating a potential area where the price could stabilize once more.
1st resistance: 1.3254
Supporting reasons: Identified as a pullback resistance, indicating a potential level that could halt further upward movement.
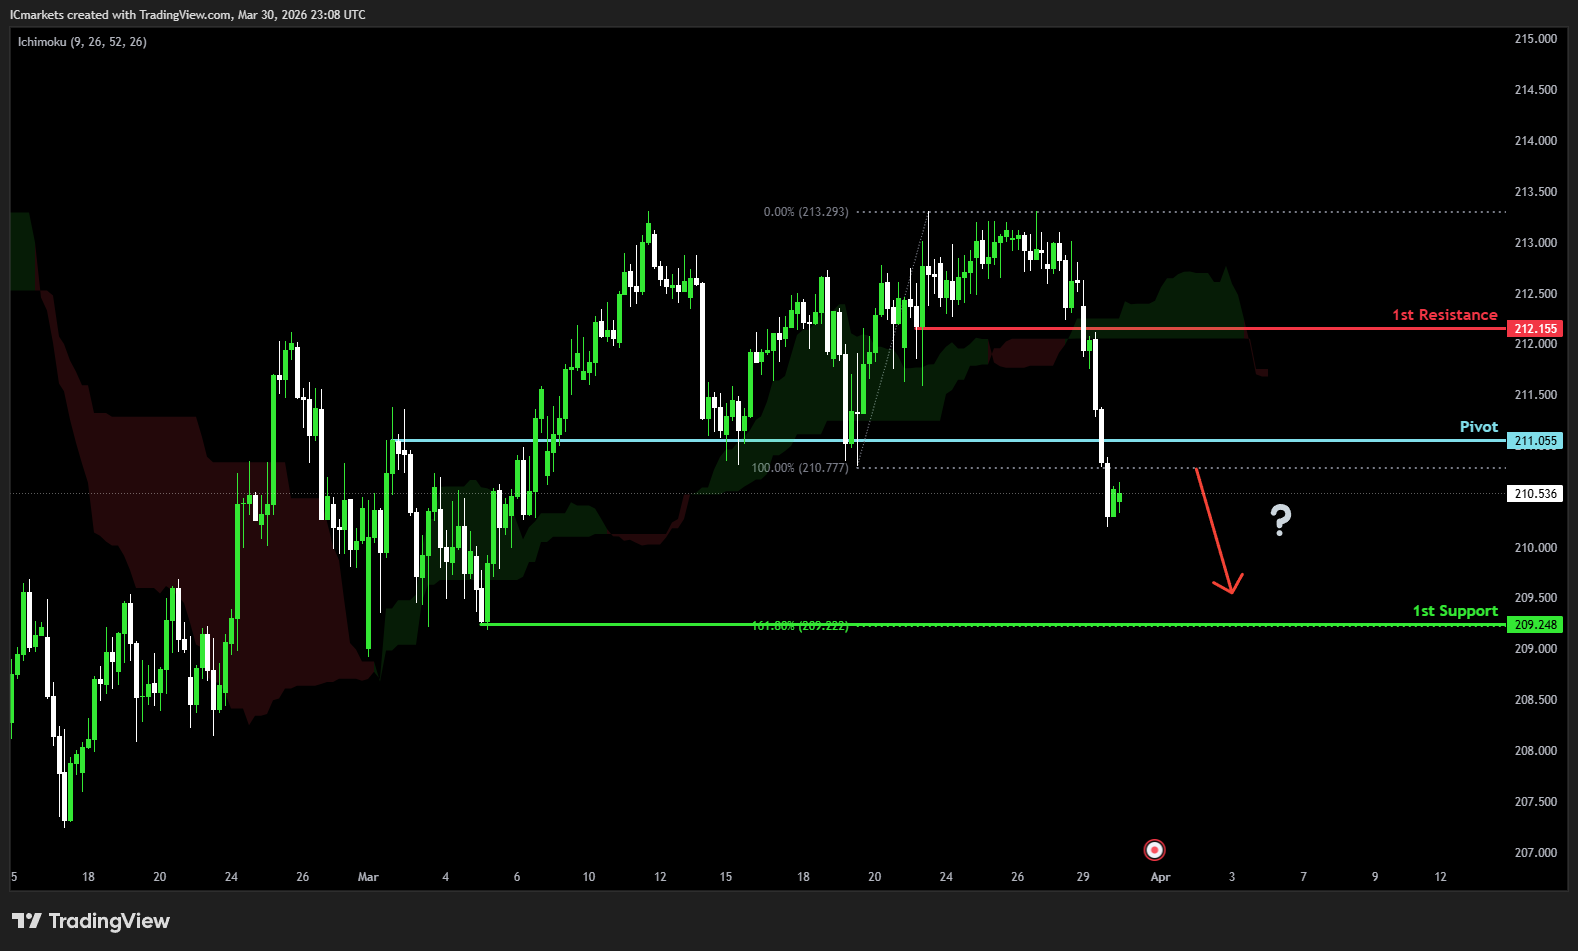
GBP/JPY:
Potential Direction: Bearish
Overall momentum of the chart: Bullish
The price could see a short-term pullback toward the pivot before continuing its bearish move down toward the 1st support.
Pivot: 211.15
Supporting reasons: Identified as a pullback resistance, where selling pressures could intensify and potentially cap any upward retracement.
1st support: 209.24
Supporting reasons: Identified as a swing low support, indicating a potential level where the price could stabilize once more.
1st resistance: 212.15
Supporting reasons: Identified as a pullback resistance, indicating a potential level that could halt further upward movement.
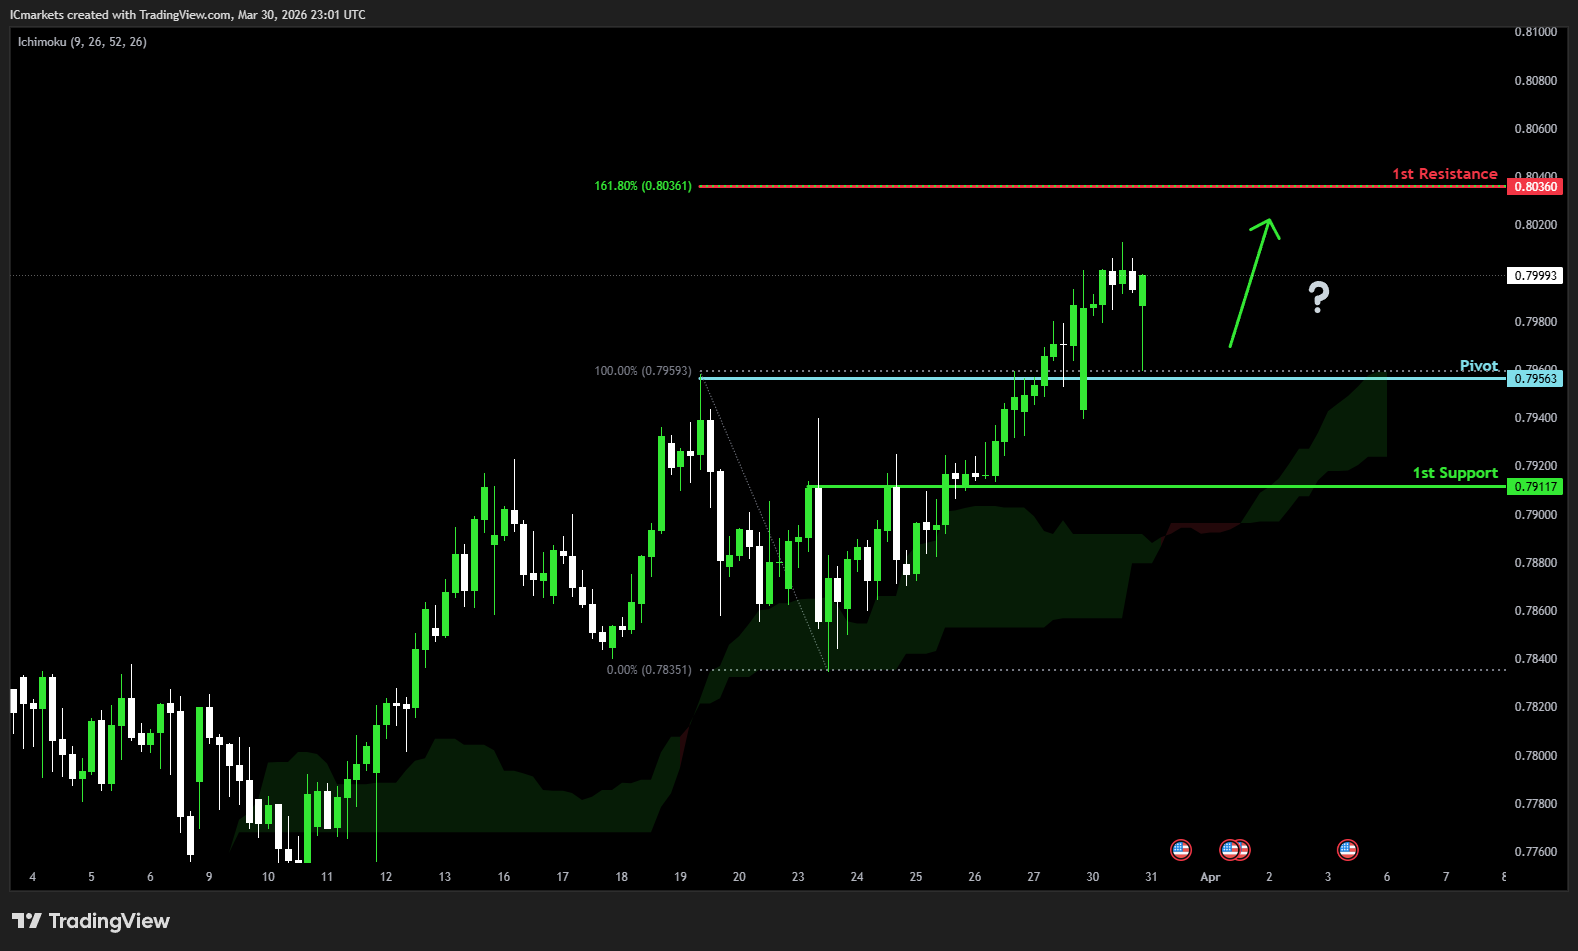
USD/CHF:
Potential Direction: Bullish
Overall momentum of the chart: Bearish
The price could see a short-term pullback toward the pivot before rising again toward the 1st resistance.
Pivot: 0.7956
Supporting reasons: Identified as a pullback support, where renewed buying pressure could emerge to push the price higher.
1st support: 0.7911
Supporting reasons: Identified as a pullback support, indicating a potential level where the price could stabilize once again.
1st resistance: 0.8036
Supporting reasons: Identified as a resistance that aligns with the 161.8% Fibonacci extension, indicating a potential level that could cap further upward movement.
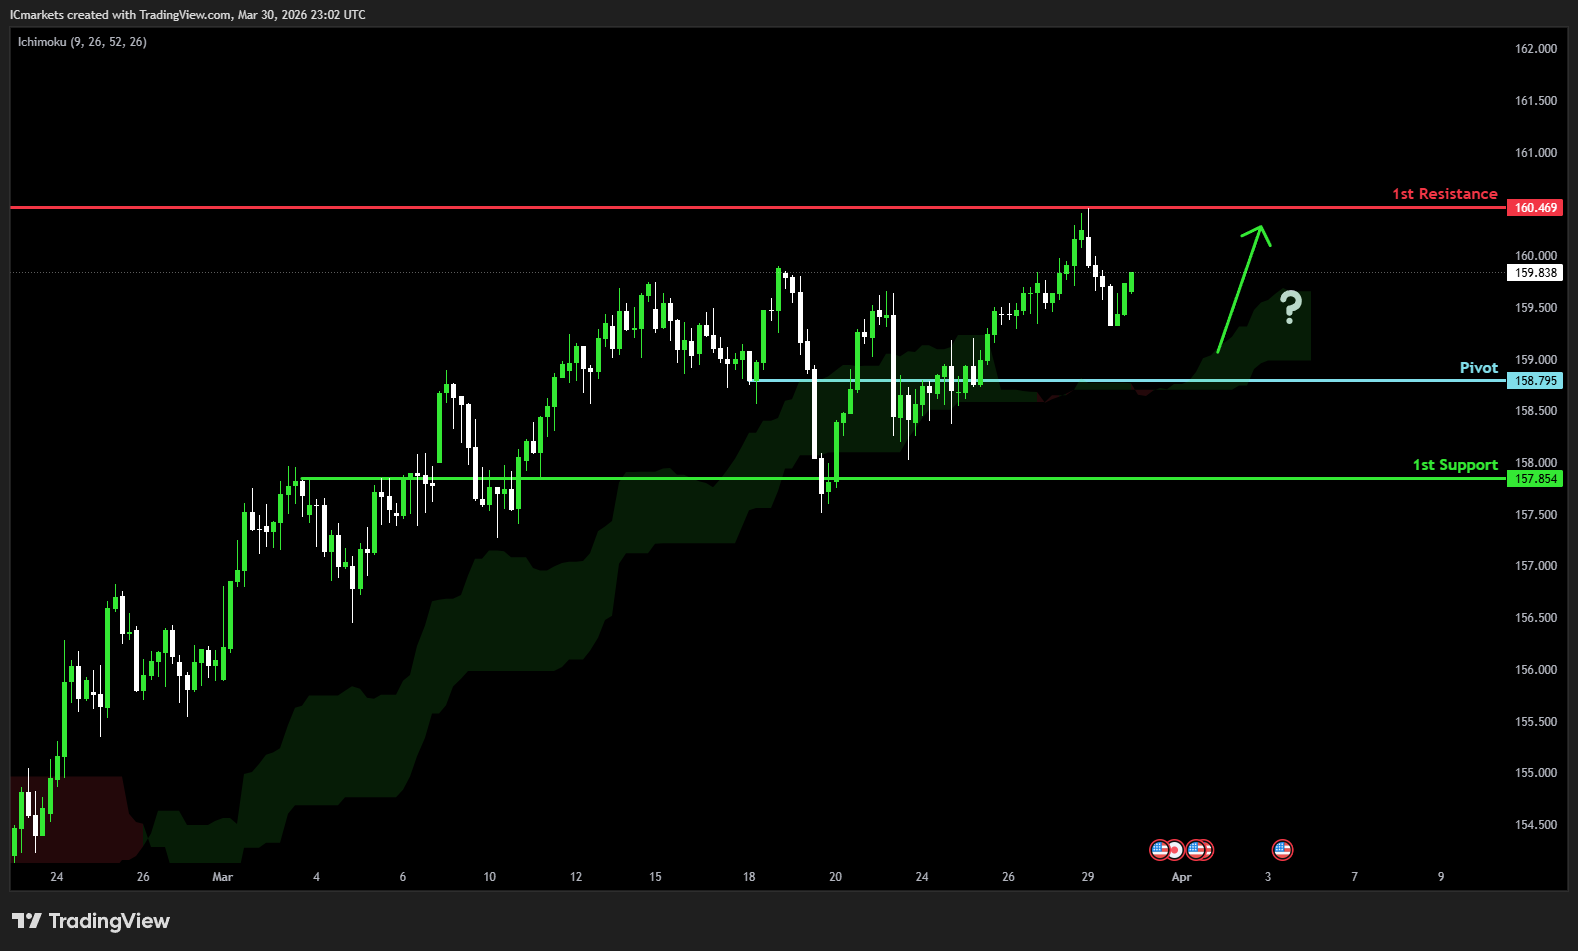
USD/JPY:
Potential Direction: Bullish
Overall momentum of the chart: Bullish
The price could see a short-term pullback toward the pivot before rising again toward the 1st resistance.
Pivot: 158.79
Supporting reasons: Identified as a pullback support, where renewed buying pressure could emerge to push the price higher.
1st support: 157.85
Supporting reasons: Identified as an overlap support, indicating a strong area where buyers might return, and the price could stabilize once again.
1st resistance: 160.45
Supporting reasons: Identified as an overlap resistance. This level represents the next key area where upward movement could be capped amid increased selling pressure
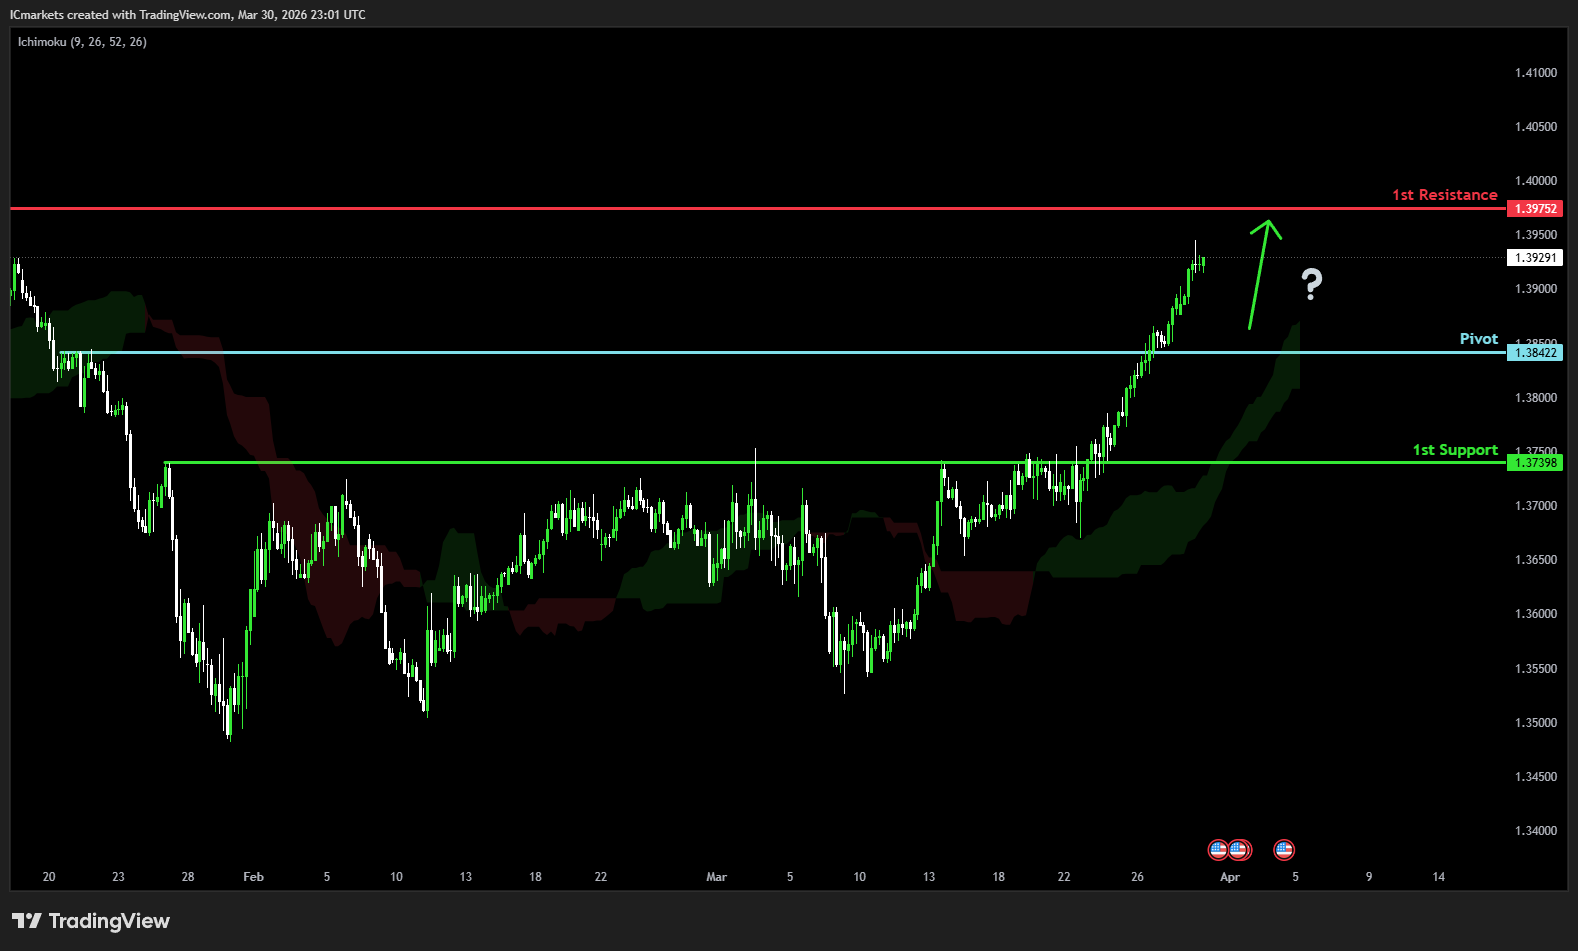
USD/CAD:
Potential Direction: Bullish
Overall momentum of the chart: Bullish
The price could see a short-term pullback toward the pivot before rising again toward the 1st resistance.
Pivot: 1.3842
Supporting reasons: Identified as an overlap support, where renewed buying pressure could emerge to push the price higher.
1st support: 1.3739
Supporting reasons: Identified as a pullback support, indicating a key level where the price could stabilize once more.
1st resistance: 1.3975
Supporting reasons: Identified as a pullback resistance, making it a possible target for bullish advances and a level where some sellers could return to cap gains
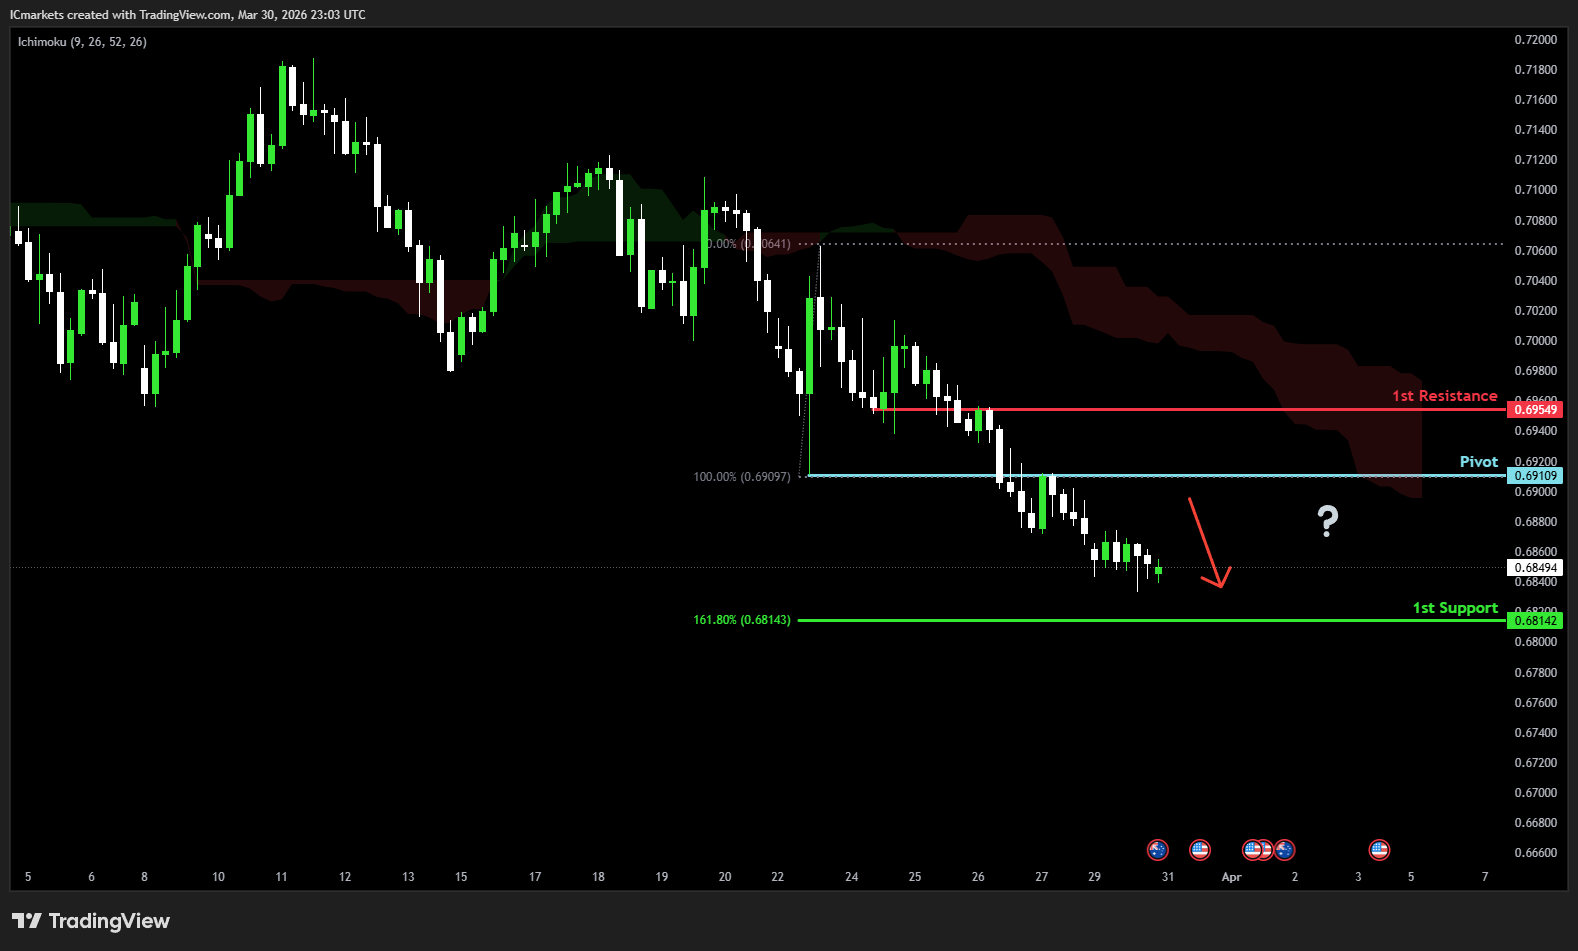
AUD/USD:
Potential Direction: Bearish
Overall momentum of the chart: Bullish
The price could see a short-term pullback toward the pivot before continuing its bearish move down toward the 1st support.
Pivot: 0.6910
Supporting reasons: Identified as a pullback resistance, where selling pressures could intensify and potentially cap any upward retracement.
1st support: 0.6814
Supporting reasons: Identified as a support that aligns with the 161.8% Fibonacci extension, this area has provided strong support historically and may attract buying interest for a potential short-term bounce
1st resistance: 0.6954
Supporting reasons: Identified as an overlap resistance, indicating a potential area that could halt any further upward movement.
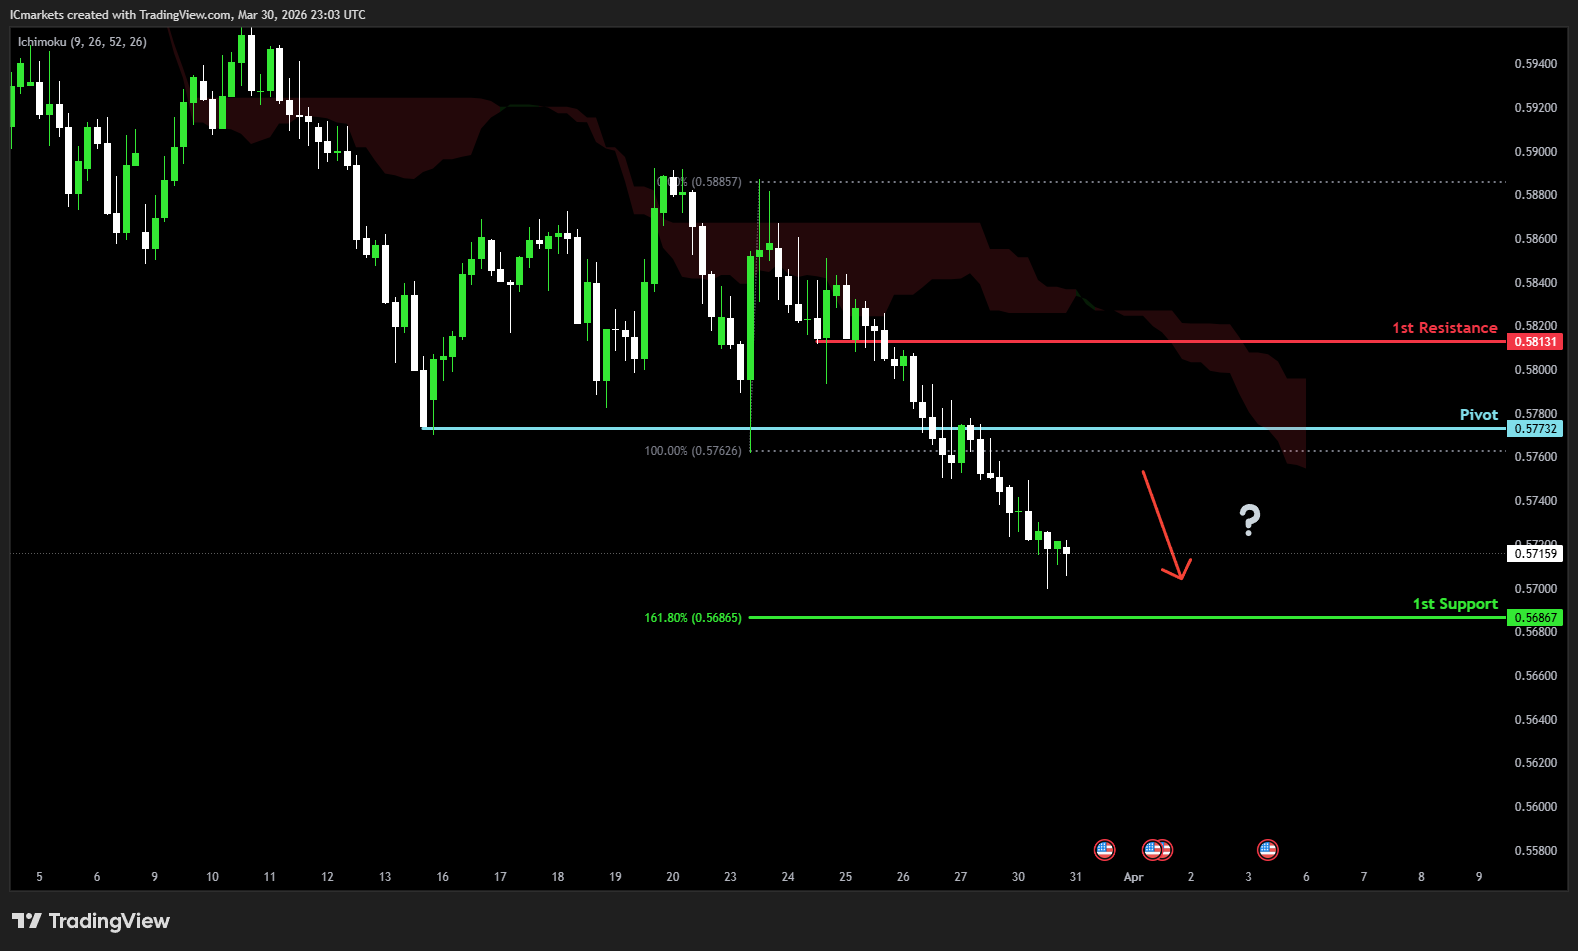
NZD/USD
Potential Direction: Bearish
Overall momentum of the chart: Bullish
The price has already reacted off the pivot and may continue its bearish move toward the 1st support.
Pivot: 0.5773
Supporting reasons: Identified as an overlap resistance, where selling pressures could intensify and potentially cap any upward retracement.
1st support: 0.5686
Supporting reasons: Identified as a support that aligns with the 161.8% Fibonacci extension, this area has provided strong support historically and may attract buying interest for a potential short-term bounce
1st resistance: 0.5813
Supporting reasons: Identified as a pullback resistance, indicating a potential area that could halt any further upward movement.
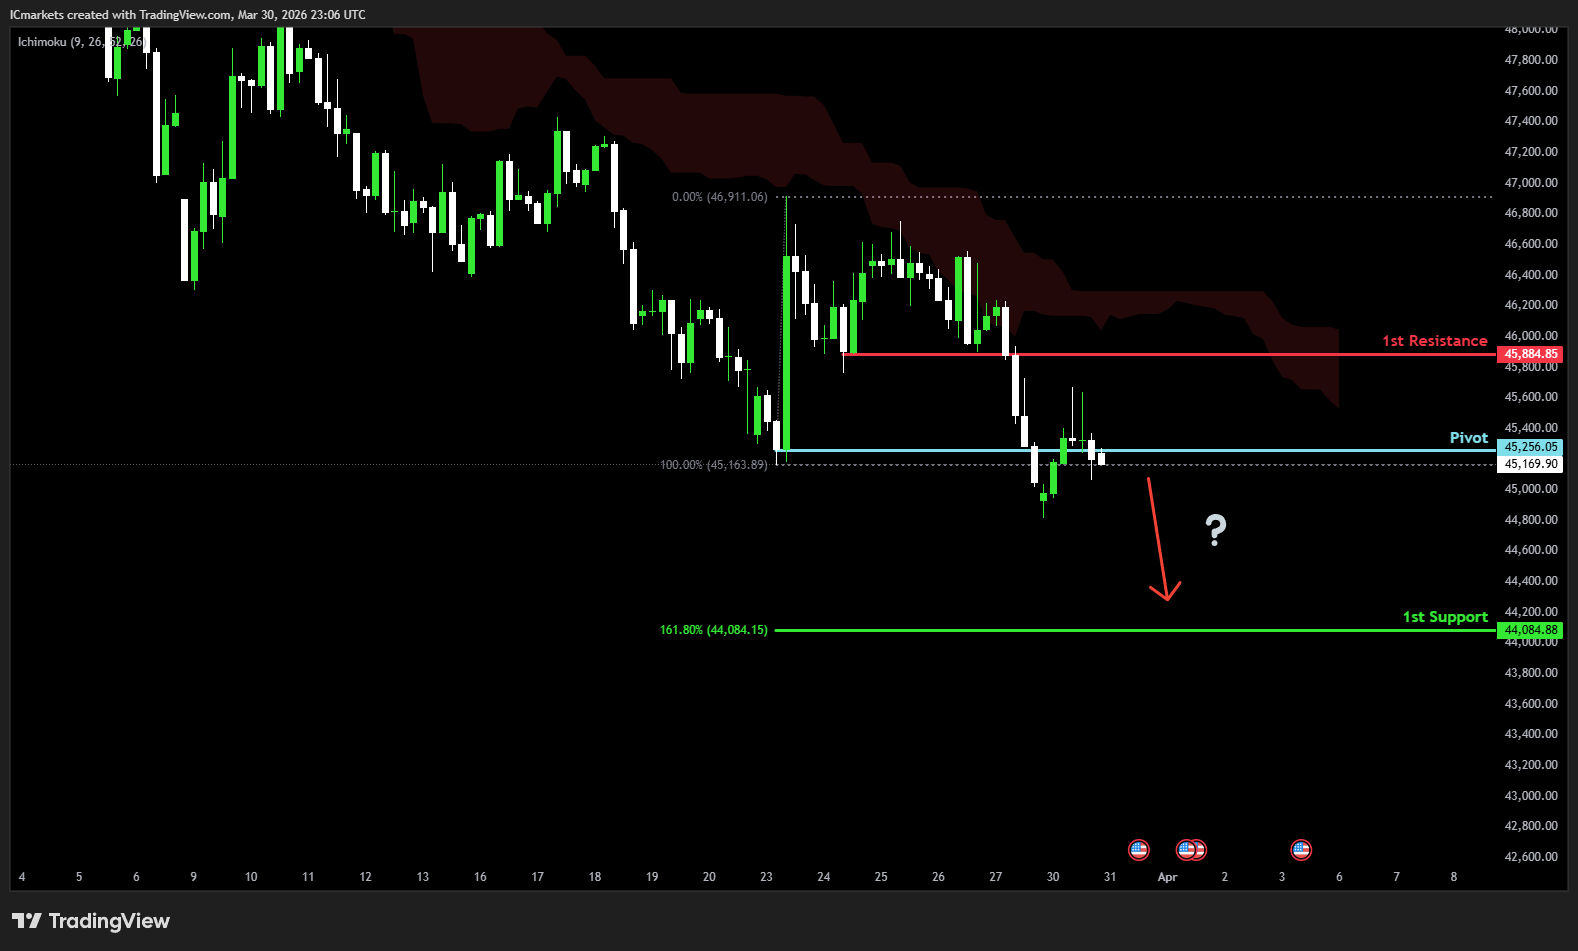
US30 (DJIA):
Potential Direction: Bearish
Overall momentum of the chart: Bullish
The price has already reacted off the pivot and may continue its bearish move toward the 1st support.
Pivot: 45,256.05
Supporting reasons: Identified as an overlap resistance, where selling pressures could intensify and potentially cap any upward retracement.
1st support: 44,084.88
Supporting reasons: Identified as a support that aligns with the 161.8% Fibonacci extension, suggesting a potential area where the price could stabilize once again.
1st resistance: 45,884.85
Supporting reasons: Identified as a pullback resistance, indicating a potential area that could halt any further upward movement.
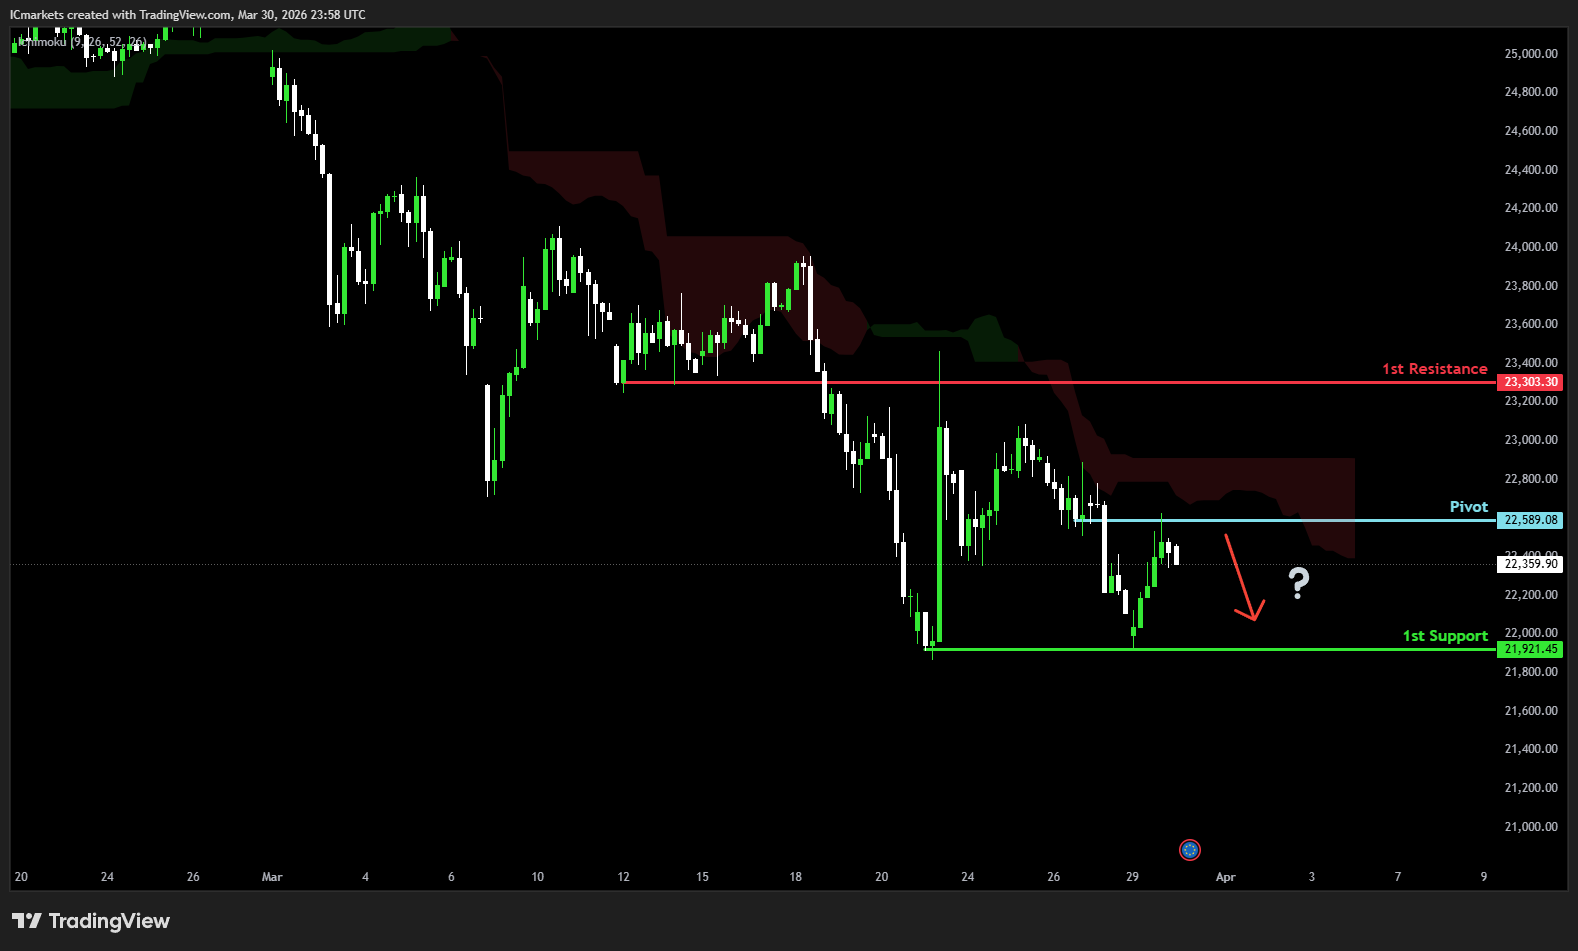
DE40 (DAX):
Potential Direction: Bearish
Overall momentum of the chart: Bullish
The price has already reacted off the pivot and may continue its bearish move toward the 1st support.
Pivot: 22,589.08
Supporting reasons: Identified as an overlap resistance, where selling pressures could intensify and potentially cap any upward retracement.
1st support: 21,921.45
Supporting reasons: Identified as a swing low support, indicating a key level where the price could stabilize once more.
1st resistance: 23.303.30
Supporting reasons: Identified as an overlap resistance, indicating a potential area that could halt any further upward movement.
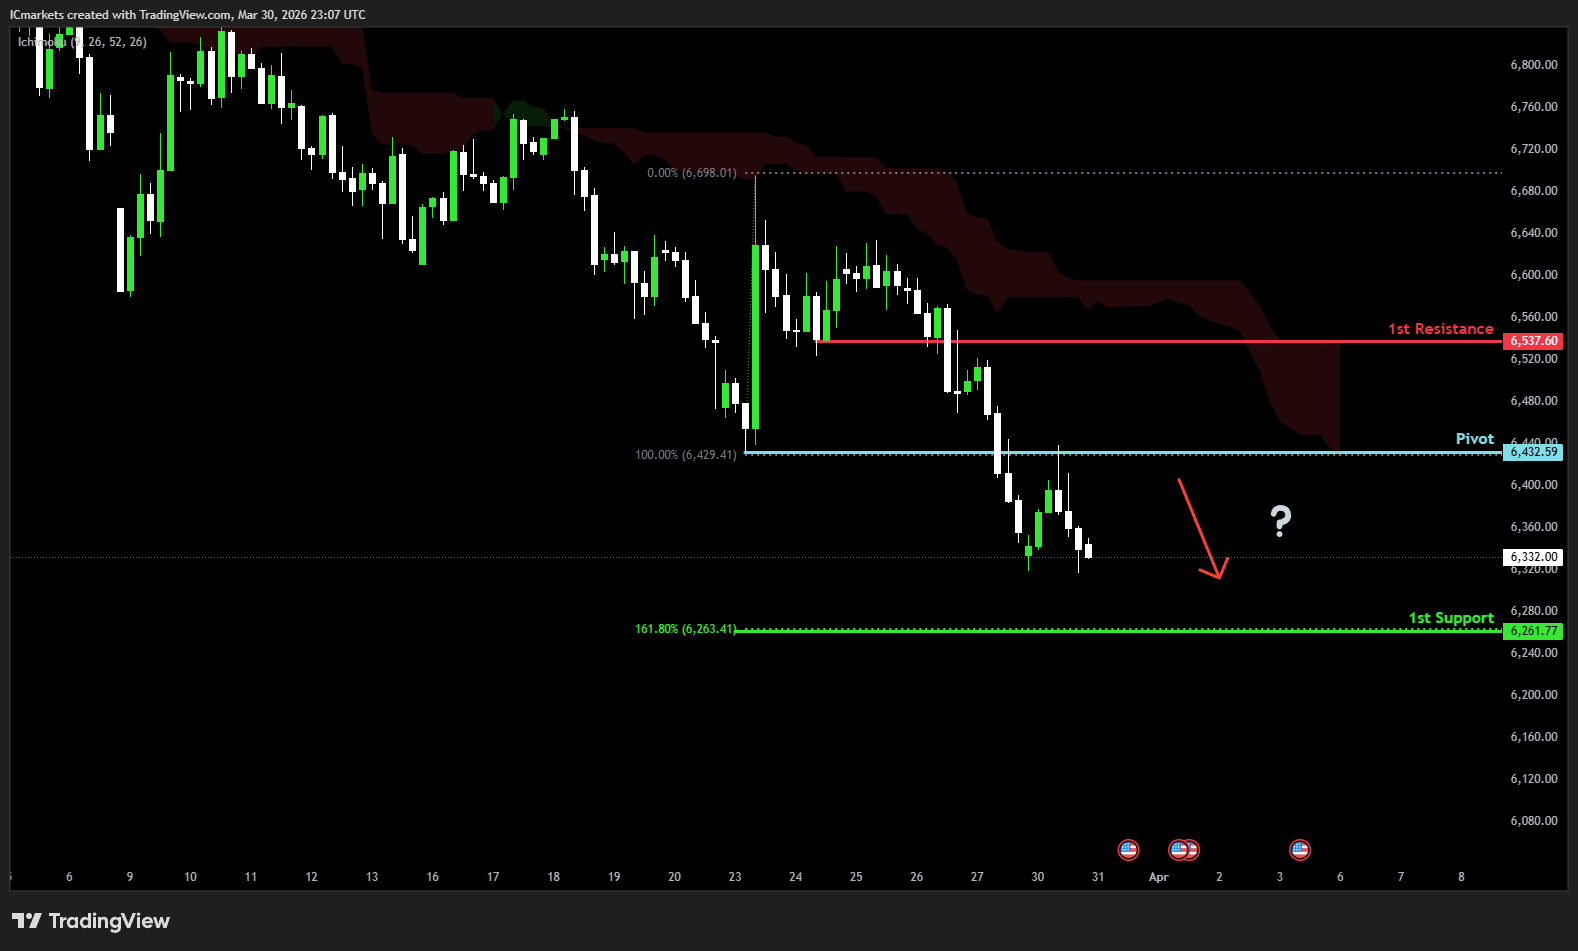
US500 (S&P 500):
Potential Direction: Bearish
Overall momentum of the chart: Bullish
The price has already reacted off the pivot and may continue its bearish move toward the 1st support.
Pivot: 6,432.59
Supporting reasons: Identified as an overlap resistance, where selling pressures could intensify and potentially cap any upward retracement.
1st support: 6,432.59
Supporting reasons: Identified as a support that aligns with the 161.8% Fibonacci extension, indicating a potential level where the price could stabilize once again.
1st resistance: 6,537.60
Supporting reasons: Identified as a pullback resistance, indicating a potential area that could halt any further upward movement.
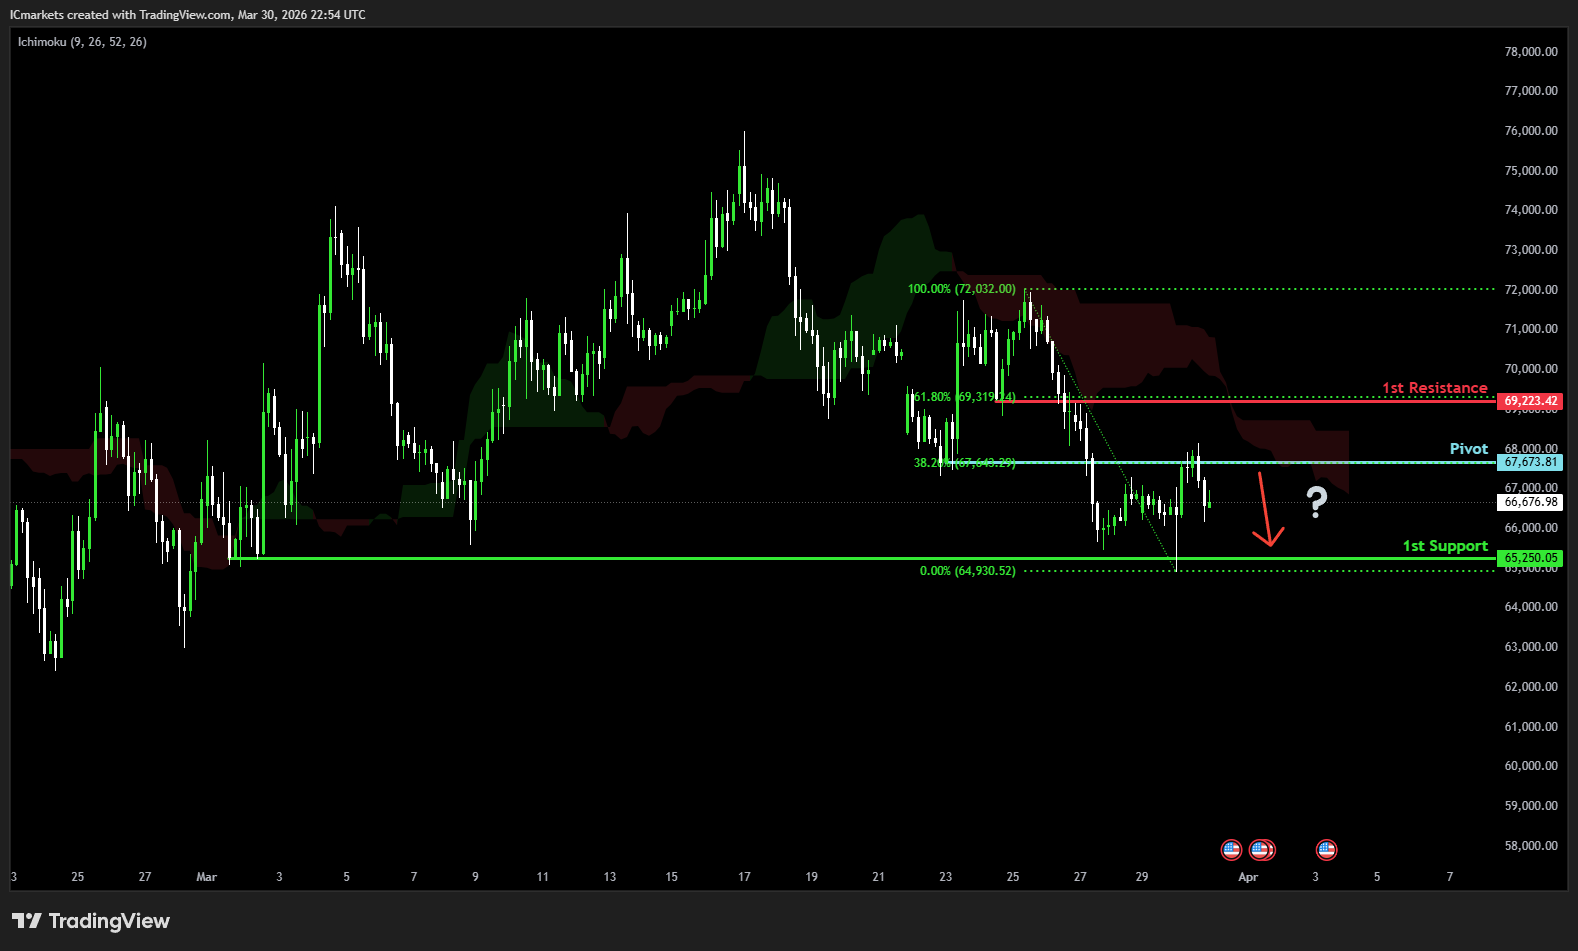
BTC/USD (Bitcoin):
Potential Direction: Bearish
Overall momentum of the chart: Bearish
The price could see a short-term pullback toward the pivot before continuing its bearish move down toward the 1st support.
Pivot: 67,673.42
Supporting reasons: Identified as a pullback resistance that aligns with the 38.2% Fibonacci retracement, where selling pressures could intensify and potentially cap any upward retracement.
1st support: 65,250.42
Supporting reasons: Identified as a swing low support, indicating a potential level where the price could stabilize once more.
1st resistance: 69,223.42
Supporting reasons: Identified as a pullback resistance that aligns with the 61.8% Fibonacci retracement, indicating a potential area that could halt any further upward movement.
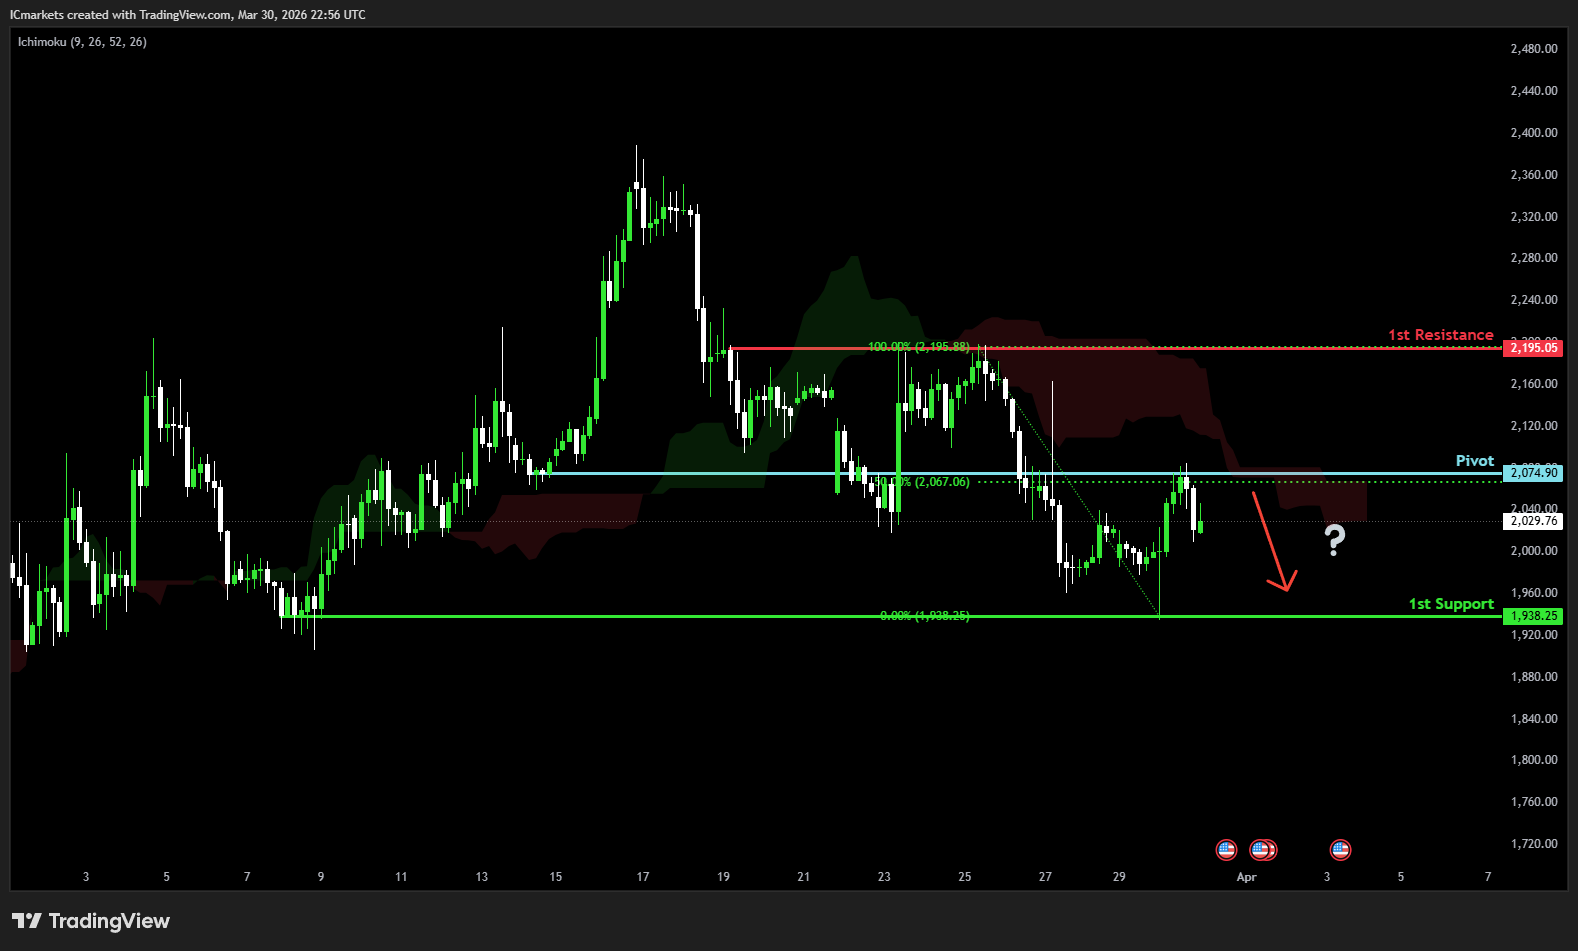
ETH/USD (Ethereum):
Potential Direction: Bearish
Overall momentum of the chart: Bullish
The price has already reacted off the pivot and may continue its bearish move toward the 1st support.
Pivot: 2,074.90
Supporting reasons: Identified as an overlap resistance that aligns with the 50% Fibonacci retracement, where selling pressures could intensify and potentially cap any upward retracement.
1st support: 1,938.25
Supporting reasons: Identified as a multi-swing low support, indicating a potential level where the price could stabilize once more.
1st resistance: 2,195.05
Supporting reasons: Identified as a swing high resistance, indicating a potential area that could halt any further upward movement.
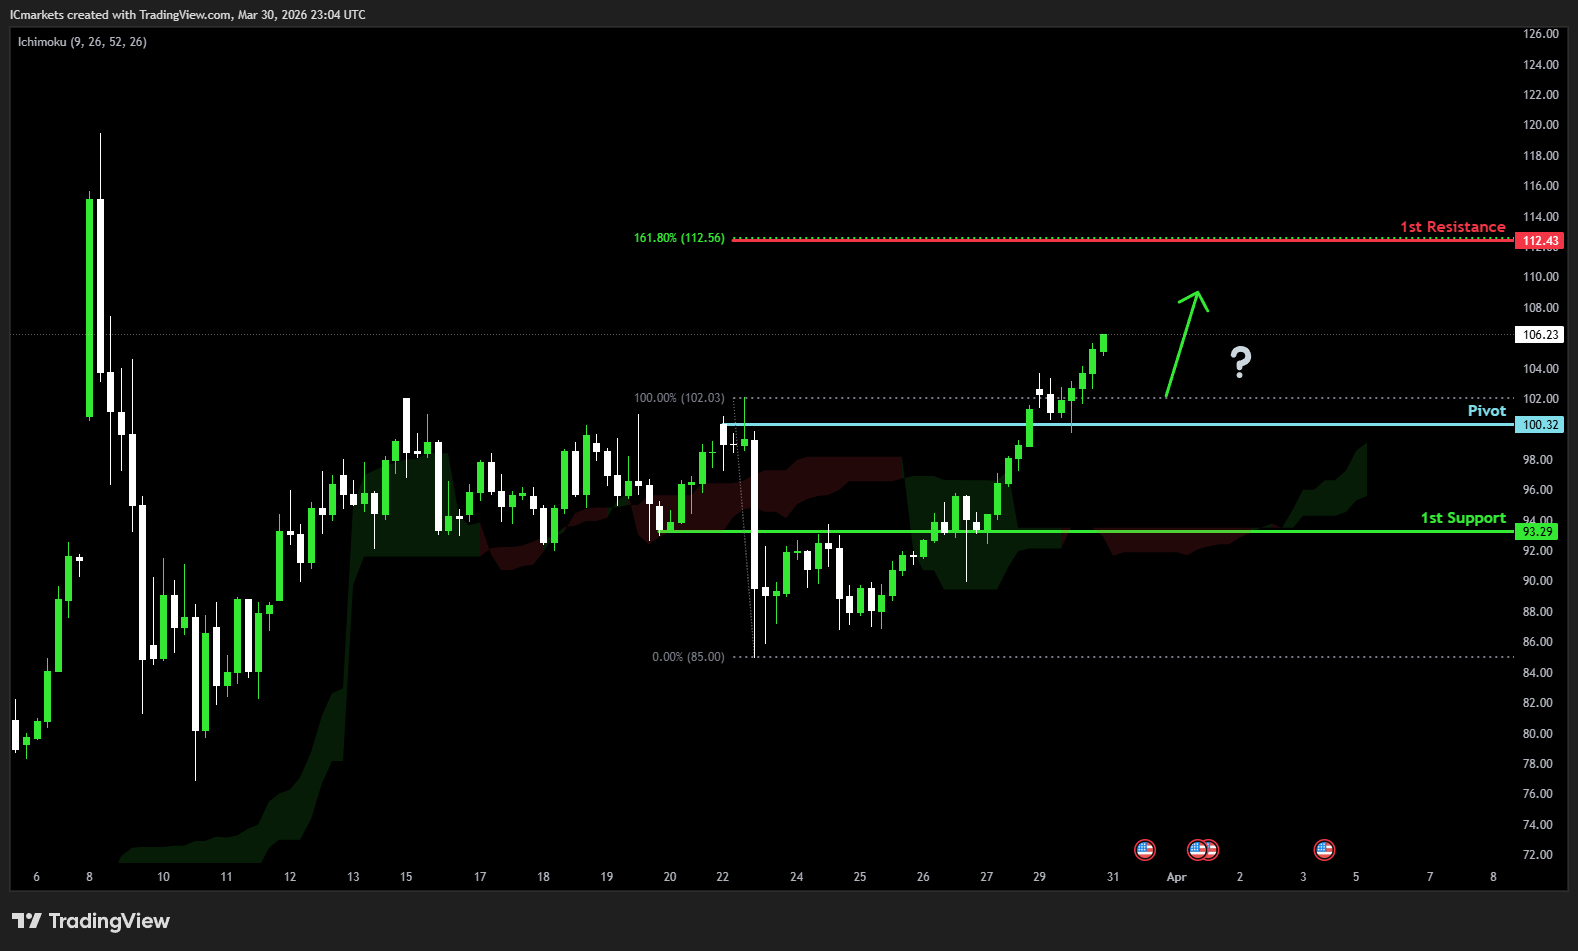
WTI/USD (Oil):
Potential Direction: Bullish
Overall momentum of the chart: Bullish
The price could see a short-term pullback toward the pivot before rising again toward the 1st resistance.
Pivot: 100.32
Supporting reasons: Identified as a pullback support, where renewed buying pressure could emerge to push the price higher.
1st support: 93.29
Supporting reasons: Identified as an overlap support, indicating a key level where the price could stabilize once more.
1st resistance: 112.43
Supporting reasons: Identified as a resistance that aligns with the 161.8% Fibonacci extension, indicating a potential area that could halt any further upward movement.
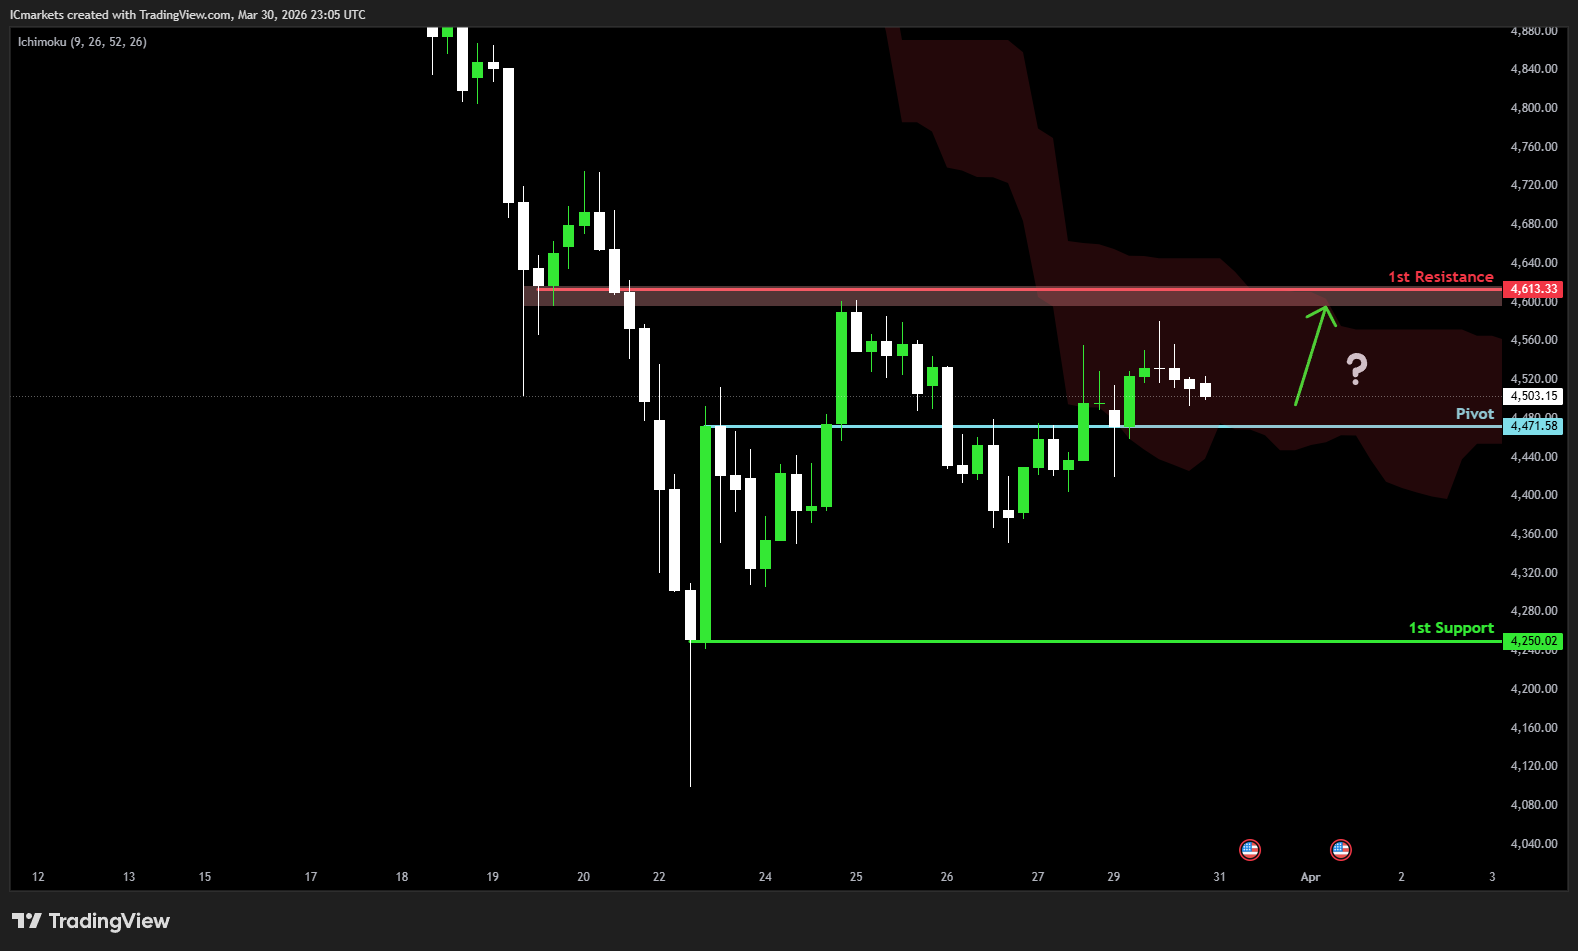
XAU/USD (GOLD):
Potential Direction: Bullish
Overall momentum of the chart: Bullish
The price could see a short-term pullback toward the pivot before rising again toward the 1st resistance.
Pivot: 4,471.58
Supporting reasons: Identified as a pullback support, where renewed buying pressure could emerge to push the price higher.
1st support: 4,250.02
Supporting reasons: Identified as a swing low support, indicating a key level where the price could stabilize once more.
1st resistance: 4,613.33
Supporting reasons: Identified as an overlap resistance, indicating a potential area that could halt any further upward movement.
The accuracy, completeness and timeliness of the information contained on this site cannot be guaranteed. IC Markets Global does not warranty, guarantee or make any representations, or assume any liability regarding financial results based on the use of the information in the site.
News, views, opinions, recommendations and other information obtained from sources outside of www.icmarkets.com, used in this site are believed to be reliable, but we cannot guarantee their accuracy or completeness. All such information is subject to change at any time without notice. IC Markets Global assumes no responsibility for the content of any linked site.
The fact that such links may exist does not indicate approval or endorsement of any material contained on any linked site. IC Markets Global is not liable for any harm caused by the transmission, through accessing the services or information on this site, of a computer virus, or other computer code or programming device that might be used to access, delete, damage, disable, disrupt or otherwise impede in any manner, the operation of the site or of any user’s software, hardware, data or property.
The post Tuesday 31st March 2026: Technical Outlook and Review first appeared on IC Your Trading Edge | Official Blog.
Germany March unemployment change 0k vs 2k expected
429094 March 31, 2026 15:00 Forexlive Latest News Market News
- Prior 1k
- Unemployment rate 6.3% vs 6.3% expected
- Prior 6.3%
German unemployment remains unchanged in March with the jobless rate keeping steady on the month as well. The jobless figure overall remains the same as it was in February at 2.977 million. Well, this at least reaffirms the labour market has been holding up in recent months after having softened modestly in the first half of last year especially.
The labour office notes that: “As usual, the spring upturn in the labour market begins in March, however, without any significant momentum this year.”
This article was written by Justin Low at investinglive.com.