Articles

General Market Analysis – 17/11/25
423573 November 17, 2025 16:00 ICMarkets Market News
US Markets Mixed into the Weekend – Dow down 0.65%
US markets closed mixed on Friday as investors continued to assess the likely timing of upcoming economic data releases and the implications for Federal Reserve rate-cut expectations. The Dow slipped 0.65% to 47,147, while the S&P 500 edged lower by 0.05% to 6,734, and the Nasdaq managed a modest gain of 0.13%, finishing at 22,900. The US dollar also firmed, with the DXY rising 0.13% to 99.27. US Treasury yields moved higher as well, with the 2-year yield climbing 1.5 bps to 3.606% and the 10-year yield rising 2.9 bps to 4.148%. In commodities, oil prices jumped sharply after a key Russian port suspended exports following a Ukrainian drone strike. Brent was up 2.19% to $64.39, while WTI gained 2.39% to $60.09. Gold, however, sold off heavily under renewed Fed hawkishness, dropping 2.09% to $4,084.06.
Dollar in Focus with Return of Data and Fed Rate Hopes
The US dollar increased in trading on Friday, with the DXY rising 0.13% to 99.27, reflecting a shift in rate sentiment as expectations for a December Fed cut continued to fade. The market has now flipped, with a hold looking more likely than a cut in December, as several Fed officials, including Chair Jerome Powell, have advised that inflation remains a concern. The futures market is now pricing in only a 41% chance of a 25-basis-point cut at the final meeting of the year, down from over 95% just a few weeks ago. The return of data this week, especially the Non-Farm Payrolls, will see more volatility for the dollar, and if those numbers start to show a bit of resilience for the jobs market, then traders expect chances of a rate cut falling further south and the dollar to appreciate.
More Volatility for Markets Ahead Today
With the US government now fully reopened and long-delayed data releases set to resume, traders are expecting increased volatility through the week. It’s a relatively quiet calendar day to start the week ahead for traders today; however, there is some data that could move local markets. The initial focus for the Asian session today will be on Japan, where preliminary GDP figures are due early in the day, with the market expecting the quarterly number to show a 0.6% decline. There is little on the cards in the European session to move the market, but later in the New York session, Canada releases its latest CPI data (exp +0.2% m/m and +3.1% median y/y), which should see some strong reactions in the loonie. The US Empire State Manufacturing Index (exp 6.1 vs prev 10.7) is also released at the same time; however, expect investor concerns on Fed moves to continue to dominate sentiment for the initial sessions of the week.
The post General Market Analysis – 17/11/25 first appeared on IC Markets | Official Blog.
IC Markets – Europe Fundamental Forecast | 17 November 2025
423571 November 17, 2025 15:39 ICMarkets Market News
IC Markets – Europe Fundamental Forecast | 17 November 2025
What happened in the Asia session?
The Asia session on November 17 saw mixed activity in regional equity indexes, commodity prices, and currency pairs driven by Japan’s weaker GDP, sectoral pressures, and cautious investor sentiment ahead of major U.S., European, and regional data releases. Tourism and retail stocks in Japan were especially impacted, while the Kospi showed relative strength, and oil prices weakened. The yen held steady after the GDP release, and Indian markets opened firm amid strong domestic flows.
What does it mean for the Europe & US sessions?
Today’s trading sessions are characterized by significant uncertainty stemming from delayed U.S. economic data, shifting Fed rate cut expectations (now at 50% for December), and anticipation of critical corporate earnings. Canadian inflation data (1:30 PM GMT) represents the day’s key macroeconomic release, while Japan’s confirmed GDP contraction highlights global growth concerns. Bitcoin’s 25% pullback from October highs reflects broader risk-off sentiment, while oil prices remain under pressure despite geopolitical tensions.
The Dollar Index (DXY)
Key news events today
Empire State Manufacturing Index (1:35 pm GMT)
FOMC member Waller speaks (8:30 pm GMT)
What can we expect from DXY today?
The US dollar is navigating a complex environment marked by diminished Federal Reserve rate-cut expectations, lingering economic uncertainty from the historic government shutdown, and a critical week of data releases ahead. With the DXY testing key support around 99.00 and December Fed rate cut odds falling below 50%, the dollar’s near-term trajectory hinges on forthcoming economic indicators that will finally shed light on the US economy’s true condition.
Central Bank Notes:
- The Federal Open Market Committee (FOMC) voted, by majority, to lower the federal funds rate target range by 25 basis points to 3.75% — 4.00% at its October 28–29, 2025, meeting, marking the second consecutive cut following the 25 basis points reduction in September.
- The Committee maintained its long-term objectives of maximum employment and 2% inflation, noting that the labor market continues to soften, with modest job creation and an unemployment rate edging higher. In comparison, inflation remains above target at around 3.0%.
- Policymakers highlighted ongoing downside risks to economic growth, tempered by signs of resilient economic activity. September’s consumer price index (CPI) came in slightly below expectations at 3.0% year-over-year, easing inflationary pressure but still warranting vigilance amid tariff-driven price effects.
- Economic activity expanded modestly in the third quarter, with GDP growth estimates around 1.0% annualized; however, uncertainty remains elevated amid persistent global trade tensions and the U.S. government shutdown, which is impacting data availability.
- The updated Summary of Economic Projections reflects an anticipated unemployment rate averaging approximately 4.5% for 2025, with headline and core personal consumption expenditures (PCE) inflation projections holding near 3.0%, indicating a slow easing path ahead.
- The Committee emphasized its flexible, data-dependent approach and underscored that future policy adjustments will be guided by incoming labor market and inflation data. As in prior meetings, there was dissent, including one member advocating a more aggressive 50-basis-point cut.
- The FOMC announced the planned conclusion of its balance sheet reduction (quantitative tightening) program, intending to cease runoff in the near term to maintain market stability, with Treasury redemption caps held steady at $5 billion per month and agency mortgage-backed securities caps at $35 billion.
- The next meeting is scheduled for 9 to 10 December 2025.
Next 24 Hours Bias
Weak Bearish
Gold (XAU)
Key news events today
Empire State Manufacturing Index (1:30 pm GMT)
FOMC Member Waller Speaks (8:35 pm GMT)
What can we expect from Gold today?
Gold stabilized near $4,100 on November 17 after two days of losses driven by collapsing expectations for a December Fed rate cut, now viewed as essentially a coin toss at 44-50% probability. The metal remains up 55-57% year-to-date despite retreating from October’s record high above $4,380.
The recently concluded 43-day U.S. government shutdown created significant volatility, initially boosting gold above $4,240 on safe-haven demand before triggering profit-taking on resolution. Delayed economic data and hawkish Fed commentary have introduced genuine uncertainty for the December 10 FOMC meeting.
Next 24 Hours Bias
Weak Bullish
The Euro (EUR)
Key news events today
No major news event
What can we expect from EUR today?
The euro opened Monday’s trading session on a firm footing at 1.1621, supported by a combination of US dollar weakness, stable ECB policy, and resilient eurozone services sector performance. While the ECB maintains its “good place” with rates on hold and only a 40% chance of cuts by September 2026, the Federal Reserve faces growing pressure to ease further, with December rate cut odds now a coin toss at approximately 50%.
Central Bank Notes:
- The Governing Council of the ECB kept the three key interest rates unchanged at its 30 October 2025 meeting. The main refinancing rate remains at 2.15%, the marginal lending facility at 2.40%, and the deposit facility at 2.00%. This decision reflects policymakers’ assessment that the current monetary stance remains consistent with medium-term price stability, while incoming data confirm a gradual return of inflation towards the target.
- Recent indicators point to stable price dynamics. Headline inflation remains near the 2% mark, with energy prices contained and food inflation easing slightly after earlier supply bottlenecks. Wage growth continues to moderate, contributing to the slowdown in domestic cost pressures. The ECB reiterated its commitment to a data-driven, meeting-by-meeting approach and emphasized flexibility amid uncertain global financial conditions.
- Eurosystem staff projections have not been materially altered since September. Headline inflation averages remain at 2.0% for 2025, 1.8% for 2026, and 2.0% for 2027. Recent softening in producer prices and subdued pipeline pressures suggest limited upside risks to inflation, though geopolitical tensions and potential commodity shocks continue to pose uncertainties to the outlook.
- Euro area GDP growth remains on track with earlier forecasts, projected at 1.1% for 2025, 1.1% for 2026, and 1.4% for 2027. Forward-looking indicators, including PMIs and industrial sentiment surveys, signal some stabilization in activity following weakness in the third quarter. Public investment and recovering export activity are expected to offset softer private sector demand in the near term.
- The labor market remains resilient, with unemployment rates at multi-decade lows and participation rates strong. Real income growth continues to support household spending, even as consumption growth normalizes from earlier highs. Financing conditions remain favorable, aided by stable banking sector liquidity and improved credit demand among small and medium-sized firms.
- Business sentiment remains mixed, reflecting lingering uncertainty over global trade policy and the path of US tariffs. However, easing supply chain costs and improved export competitiveness due to softer exchange rates are providing some relief to manufacturing and external-oriented sectors.
- The Governing Council reaffirmed that future decisions will depend on an integrated assessment of incoming data—covering inflation trends, financial conditions, and the state of policy transmission. The Council emphasized that no pre-set path for rates exists; keeping all options open should the economic outlook shift markedly.
- Balance sheet reduction continues smoothly, with holdings under the APP and PEPP declining as reinvestments have ceased. The ECB confirmed that the pace of portfolio runoff remains in line with its previously communicated normalization plan, supporting a gradual withdrawal of monetary accommodation in a predictable manner.
- The next meeting is on 17 to 18 December 2025
Next 24 Hours Bias
Weak Bearish
The Swiss Franc (CHF)
Key news events today
No major news event
What can we expect from CHF today?
The Swiss Franc enters the week at multi-year highs, supported by three key pillars: the confirmed US tariff reduction from 39% to 15%, ongoing safe-haven demand driven by global uncertainty, and SNB policy stability at 0% with negative rates ruled out. The USD/CHF pair is trading near 0.79, its strongest level since 2011, while EUR/CHF has reached levels not seen since 2015. With Switzerland’s Q3 GDP flash estimate due today and the December 11 SNB meeting on the horizon, the franc’s trajectory will depend on economic data releases and any shifts in the SNB’s confident inflation outlook.
Central Bank Notes:
- The SNB maintained its key policy rate at 0% during its meeting on 25 September 2025, pausing a sequence of six consecutive rate cuts as inflation stabilized and the Swiss franc remained firm.
- Recent data showed a modest rebound in inflation, with Swiss consumer prices rising 0.2% year-on-year in August after staying above zero for three consecutive months; this helped alleviate fears of deflation that were mounting earlier in the year.
- The conditional inflation forecast remains broadly unchanged from June: headline inflation is expected to average 0.2% in 2025, 0.5% in 2026, and 0.7% in 2027. The risk of a negative rate move has diminished for now, but the SNB retains flexibility should inflationary pressures weaken again.
- The global economic outlook has deteriorated further, weighed down by heightened trade tensions—especially with the U.S.—and ongoing uncertainty in key Swiss export markets.
- Swiss GDP growth moderated in Q2 after a strong Q1 boosted by front-loaded U.S. exports. The SNB expects growth to slow and remain subdued, with forecasted GDP expansion between 1% and 1.5% in both 2025 and 2026.
- Labor market sentiment in the Swiss industrial sector has softened on concerns over export competitiveness and potential adjustments to production, but the overall growth outlook stays broadly unchanged
- The SNB reiterated its readiness to respond as needed if deflation risks re-emerge, emphasizing its commitment to medium-term price stability and a robust, transparent communication policy, with the introduction of more detailed monetary policy minutes beginning in October.
- The next meeting is on 11 December 2025.
Next 24 Hours Bias
Medium Bullish
The Pound (GBP)
Key news events today
No major news event
What can we expect from GBP today?
The British Pound faces significant headwinds as Monday’s Asian session begins. The government’s fiscal U-turn has raised questions about the UK’s fiscal credibility, while persistently weak economic data has cemented expectations for a December rate cut. With markets pricing in a 75-80% probability of a 25 basis point cut on 18 December, and technical indicators pointing to further downside risk, Sterling is likely to remain under pressure unless upcoming data surprises to the upside or Catherine Mann’s comments signal resistance to near-term easing. Traders should watch the 1.3150-1.3185 support zone closely, as a break below could accelerate losses toward 1.2875 or lower.
Central Bank Notes:
- The Bank of England’s Monetary Policy Committee (MPC) met on 6 November 2025 and voted by a majority of 7–2 to keep the Bank Rate unchanged at 4.00 percent for a second consecutive meeting. The decision reflects the Committee’s cautious approach as inflation remains above target, but underlying economic momentum continues to weaken. Two members maintained their votes for a 25-basis-point cut, citing further signs of labor-market softening and weak business sentiment.
- The BOE adjusted its guidance on quantitative tightening (QT), maintaining the reduced pace established in September. The planned reduction of UK government bond holdings remains at £67.5 billion over the next 12 months, leaving the current gilt balance near £550 billion. Policymakers described the recalibrated QT path as “appropriate for current market conditions,” emphasizing the importance of liquidity management amid heightened volatility.
- Headline inflation moderated slightly to 3.6 percent in October from 3.8 percent previously, driven by easing food and transport prices. However, core inflation has shown only gradual progress, holding near 3.9 percent. The MPC noted that services inflation and administered energy costs continue to exert pressure, highlighting the challenge of achieving the 2 percent target sustainably. The Committee’s latest projections see inflation falling toward 3 percent by mid-2026, with further downside expected if energy and wage dynamics continue to normalize.
- Economic activity remains subdued. Estimates place Q3 GDP growth close to zero, with both business output and consumer spending restrained. The unemployment rate has edged up to 4.8 percent, while pay growth cooled to just under 5 percent year-on-year. MPC members acknowledged that pay settlements are weakening further, signaling an easing in labor cost pressures as demand softens. Surveys from the manufacturing and services sectors suggest muted hiring intentions through year-end.
- International factors continue to complicate the policy outlook. Fluctuating oil prices—partly linked to renewed Middle East tensions—alongside fragile global demand have contributed to higher market volatility. The MPC reiterated that external shocks, including global food and energy disruptions, could temporarily slow the disinflation path but remain unlikely to derail the medium-term moderation in prices.
- The Committee assessed risks around inflation as balanced. Downside risks arise from sluggish domestic growth and declining real income momentum, while upside risks remain tied to elevated inflation expectations and stubborn services inflation. Policymakers emphasized the need for patience, maintaining that any rate cuts ahead of clear inflation progress could undermine confidence in policy credibility.
- The MPC’s overall stance remains restrictive but increasingly balanced, with future moves expected to follow a cautious, data-driven trajectory. The Committee reaffirmed that monetary policy will stay tight until there is compelling evidence that inflation is returning to the 2 percent target on a durable basis.
- The next meeting is on 18 December 2025.
Next 24 Hours Bias
Medium Bearish
The Canadian Dollar (CAD)
Key news events today
CPI m/m (1:30 pm GMT)
Median CPI y/y (1:30 pm GMT)
Trimmed CPI y/y (1:30 pm GMT)
Common CPI y/y (1:30 pm GMT)
What can we expect from CAD today?
Today marks a pivotal moment for Canadian Dollar traders with the October CPI release. Inflation data coming in line with expectations would likely reinforce the market consensus that the Bank of Canada has paused rate cuts, providing technical support for the loonie around current levels near 1.40. However, the broader outlook remains subdued with rate differentials and trade uncertainty weighing on medium-term CAD performance. The market will closely watch both the headline and core inflation figures alongside any forward guidance cues for the December 10 BoC decision.
Central Bank Notes:
- The Council noted that U.S. tariff tensions have eased slightly following early progress in bilateral discussions, though the external trade environment remains fragile. Businesses continue to hold back on long-term investment, with the Bank highlighting that sustained clarity on U.S. trade policy is needed to restore confidence.
- The Bank acknowledged that uncertainty persists despite the softer U.S. tone, as incoming data show limited improvement in export orders. The manufacturing sector has stabilized but remains below pre-2024 output levels, reflecting weak global demand and cautious corporate spending.
- Canada’s economy showed tentative signs of recovery in early Q4, with GDP estimated to expand by 0.3% in October after two quarters of contraction. Mining and energy activity strengthened modestly, aided by steady crude demand, while goods exports posted a fractional gain.
- Service sector growth remained uneven, supported mainly by tourism-related and technology services. However, retail spending and household consumption were subdued, constrained by slower job creation and lingering consumer caution. The Bank judged overall momentum as fragile but improving marginally.
- Housing activity showed modest reacceleration in major urban markets as mortgage rates stabilized near record lows. Nonetheless, affordability pressures and stricter lending standards continue to cap overall resale volumes, leading to only a gradual recovery in the housing sector.
- Headline CPI inflation rose to 2.1% in October, reaching the Bank’s target for the first time in six months. Higher energy prices and a modest uptick in food and shelter costs drove the increase. Core inflation measures remained stable, suggesting underlying price pressures are contained.
- The Governing Council reiterated its data-dependent stance, indicating that the current policy rate remains appropriate amid tentative growth and balanced inflation risks. Officials noted that while additional stimulus is not ruled out, the emphasis has shifted toward monitoring the sustainability of the recovery rather than immediate rate adjustments.
- The next meeting is on 17 to 18 December 2025.
Next 24 Hours Bias
WeaK Bullish
Oil
Key news events today
No major news event
What can we expect from Oil today?
Oil prices declined on Monday, November 17, as Russian export operations resumed at Novorossiysk following Ukrainian strikes. The market faces significant bearish pressure from a growing supply glut, with the IEA warning of surpluses reaching 4 million bpd in 2026. Despite geopolitical risks from intensifying Ukrainian attacks on Russian energy infrastructure, US sanctions on Rosneft and Lukoil taking effect on November 21, and Iran’s tanker seizure in the Strait of Hormuz, these supply risks have proven insufficient to offset fundamental oversupply concerns.
Next 24 Hours Bias
Weak Bearish
The post IC Markets – Europe Fundamental Forecast | 17 November 2025 first appeared on IC Markets | Official Blog.
IC Markets – Asia Fundamental Forecast | 17 November 2025
423570 November 17, 2025 15:39 ICMarkets Market News
IC Markets – Asia Fundamental Forecast | 17 November 2025
What happened in the U.S. session?
U.S. markets overnight experienced extreme volatility, triggered by collapsing expectations for a Federal Reserve rate cut, a sharp sell-off in AI and tech stocks, and a cryptocurrency crash. Odds for a December rate reduction plunged below 50% from 96% a month ago, following hawkish Fed signals and delayed economic data after the government shutdown.
What does it mean for the Asia Session?
Canada’s October CPI (forecast 0.2% m/m) and Japan’s Q3 GDP (expected -2.5% annualized contraction) are Monday’s marquee events, while China releases FDI data showing continued foreign investment weakness. RBA meeting minutes (Tuesday) will clarify the path forward after higher-than-expected Q3 inflation pushed back rate cut expectations to February 2026 at the earliest. Fed’s Williams speaks Wednesday amid reduced December rate cut odds (now around 50%).
The Dollar Index (DXY)
Key news events today
Empire State Manufacturing Index (1:30 pm GMT)
FOMC Member Waller Speaks (8:35 pm GMT)
What can we expect from DXY today?
The US dollar faces a pivotal week as markets digest the end of the government shutdown, reassess Fed rate cut probabilities, and await critical Canadian inflation data on Monday. The DXY consolidated around 99 after a volatile period that saw safe-haven demand push the index briefly above 100, only to retreat as political uncertainty eased.
With December Fed rate cut odds now a “coin toss” at 50-53% down dramatically from 95% a month ago, the dollar’s direction hinges on upcoming economic data and Fed communications. Persistent 3% inflation clashes with labor market cooling, creating policy uncertainty that keeps the dollar vulnerable.
Central Bank Notes:
- The Federal Open Market Committee (FOMC) voted, by majority, to lower the federal funds rate target range by 25 basis points to 3.75% — 4.00% at its October 28–29, 2025, meeting, marking the second consecutive cut following the 25 basis points reduction in September.
- The Committee maintained its long-term objectives of maximum employment and 2% inflation, noting that the labor market continues to soften, with modest job creation and an unemployment rate edging higher. In comparison, inflation remains above target at around 3.0%.
- Policymakers highlighted ongoing downside risks to economic growth, tempered by signs of resilient economic activity. September’s consumer price index (CPI) came in slightly below expectations at 3.0% year-over-year, easing inflationary pressure but still warranting vigilance amid tariff-driven price effects.
- Economic activity expanded modestly in the third quarter, with GDP growth estimates around 1.0% annualized; however, uncertainty remains elevated amid persistent global trade tensions and the U.S. government shutdown, which is impacting data availability.
- The updated Summary of Economic Projections reflects an anticipated unemployment rate averaging approximately 4.5% for 2025, with headline and core personal consumption expenditures (PCE) inflation projections holding near 3.0%, indicating a slow easing path ahead.
- The Committee emphasized its flexible, data-dependent approach and underscored that future policy adjustments will be guided by incoming labor market and inflation data. As in prior meetings, there was dissent, including one member advocating a more aggressive 50-basis-point cut.
- The FOMC announced the planned conclusion of its balance sheet reduction (quantitative tightening) program, intending to cease runoff in the near term to maintain market stability, with Treasury redemption caps held steady at $5 billion per month and agency mortgage-backed securities caps at $35 billion.
- The next meeting is scheduled for 9 to 10 December 2025.
Next 24 Hours Bias
Weak Bearish
Gold (XAU)
Key news events today
Empire State Manufacturing Index (1:30 pm GMT)
FOMC Member Waller Speaks (8:35 pm GMT)
What can we expect from Gold today?
Gold enters the week trading around $4,084-$4,100 per ounce, facing crosswinds from sharply reduced Federal Reserve rate-cut expectations (now 50-53% probability for December versus 72% a week earlier) and persistent geopolitical support. Hawkish comments from multiple Fed officials triggered Friday’s selloff to $4,032 before recovery, with upcoming FOMC minutes on November 19 representing a critical catalyst.
Next 24 Hours Bias
Medium Bullish
The Australian Dollar (AUD)
Key news events today
No major news event
What can we expect from AUD today?
The Australian Dollar enters the week with underlying support from robust employment data that has pushed back expectations for near-term RBA rate cuts, but faces headwinds from elevated inflation readings that keep the central bank cautious, uncertainty around Federal Reserve policy, and mixed commodity price dynamics. With inflation still above target and the labour market remaining resilient, the RBA appears set to maintain restrictive policy longer than previously anticipated, providing fundamental support for the Aussie while limiting its upside potential against a still-sturdy US Dollar.
Central Bank Notes:
- The Reserve Bank of Australia held its cash rate steady at 3.60% at the November policy meeting, citing persistent inflationary pressures and lingering uncertainties in both domestic and global outlooks. This is the third consecutive pause following the cut in August.
- Policymakers remain alert to renewed inflation momentum. After a temporary uptick in September’s CPI, trimmed mean inflation for Q3 stands at 3.0%, above the intended 2–3% band. The RBA now anticipates that core inflation will stay above target until at least mid-2026, delaying any hopes of further easing.
- Headline CPI climbed by 3.2% in the year to September 2025, driven by resilient housing (+2.5%) and insurance costs, while discretionary goods inflation is subdued. The transition to monthly CPI reporting from November will improve the accuracy of inflation tracking.
- Domestic demand remains firm, particularly in services and housing, while manufacturing and discretionary retail continue to lag. Household incomes have stabilized, but high borrowing costs and elevated rents are constraining consumption and risking a slowdown in Q1 2026.
- Labor market tightness persists, though job growth has moderated. Underutilization edged higher. Wage growth is plateauing, but weak productivity is keeping unit labor costs elevated—a medium-term risk that remains central to the Board’s narrative.
- The RBA highlights geopolitical tensions and volatile commodity markets as primary global risks, against a backdrop of modest upward revisions to world growth forecasts. The Board stresses that its stance remains “cautious and data-dependent,” with ongoing vigilance on inflation, labor, and spending trends.
- Monetary policy remains mildly restrictive, balancing progress on price stability against vulnerabilities in household demand and global outlook. Board communications reaffirm a dual mandate: price stability and full employment, while underscoring readiness to respond should risks materialize sharply.
- Analysts generally expect the cash rate to remain at current levels through early 2026, with only modest cuts possible later in the year if inflation moderates. The new monthly CPI release (first full edition Nov 2025) will be watched closely for timely signals on price trends.
- The next meeting is on 9 December 2025.
Next 24 Hours Bias
Medium Bullish
The Kiwi Dollar (NZD)
Key news events today
No major news event
What can we expect from NZD today?
The New Zealand Dollar faces significant headwinds, trading near seven-month lows of 0.5680 against the US Dollar and at 12-year lows versus the Australian Dollar. The currency’s weakness reflects domestic economic fragility, including unemployment at a near nine-year high of 5.3%, consecutive quarters of GDP contraction, and aggressive monetary easing by the Reserve Bank of New Zealand (RBNZ). Since August, the central bank has cut rates by 300 basis points to 2.5%, with another 25-basis-point reduction widely anticipated on November 26.
Central Bank Notes:
- The Monetary Policy Committee (MPC) agreed to cut the Official Cash Rate (OCR) by 50 basis points to 2.50% on 8 October 2025, exceeding market expectations for a smaller 25-basis-point reduction and signaling a stronger commitment to reviving growth.
- The decision was reached by consensus, marking a shift from previous split votes, and reflected policymakers’ shared view that sustained economic weakness and persistent disinflationary pressures required a more front-loaded policy response.
- Annual consumer price inflation stood at 2.7% in the June quarter and is seen nearing 3% for the September quarter—above the 2% midpoint but within the 1–3% target range. Despite high near-term readings, the MPC projects inflation will return toward 2% by the first half of 2026 as spare capacity and moderating tradables curb price momentum.
- Policymakers acknowledged that domestic demand remains weak, with household spending, business investment, and construction activity under pressure. While still elevated, services inflation is expected to ease gradually as wage growth slows and unemployment edges higher.
- Financial conditions have eased with expectations as wholesale and retail borrowing rates adjust to lower policy settings. Bank lending data indicate a modest uptick in mortgage approvals, though broader credit demand remains subdued.
- GDP growth stalled in the middle of 2025, with high-frequency indicators showing continued weakness into the third quarter. A combination of elevated costs for essentials and falling savings continues to restrain household consumption, while global trade frictions weigh on business sentiment.
- The MPC noted that global uncertainty—particularly from US trade regulation changes and soft Chinese demand—continues to pose downside risks to export sectors, though these are partly offset by a weaker New Zealand dollar improving competitiveness.
- Subject to data confirming a sustained soft patch in activity and moderating inflation pressures, the MPC signaled further scope to reduce the OCR toward 2.25% at its next meeting on 26 November 2025, consistent with current market and Westpac forecasts.
- The next meeting is on 26 November 2025.
Next 24 Hours Bias
Weak Bullish
The Japanese Yen (JPY)
Key news events today
No major news events
What can we expect from JPY today?
The Japanese yen faces multiple converging pressures as of Monday, November 17, 2025. Prime Minister Takaichi’s administration has prioritized economic growth over currency strength, implementing a massive stimulus package exceeding 17 trillion yen while urging the BoJ to caution on rate hikes. This has widened the monetary policy divergence with the Federal Reserve, pushing USD/JPY to nine-month highs near 155.
Central Bank Notes:
- The Policy Board of the Bank of Japan met on 30–31 October and, by a clear majority vote, decided to maintain its key monetary policy approach for the upcoming period.
- The BOJ will continue to encourage the uncollateralized overnight call rate to remain at around 0.5%, in line with the prior stance.
- The gradual quarterly reduction in monthly outright purchases of Japanese Government Bonds (JGBs) remains intact, with amounts unchanged from the previous schedule. Purchases are set to decrease by about ¥400 billion per quarter through March 2026, shifting to about ¥200 billion per quarter from April to June 2026, and targeting a ¥2 trillion purchase level for Q1 2027. The bank reaffirmed its intention to maintain flexibility, with readiness to respond if market conditions warrant an adjustment.
- Japan’s economy continues to show moderate recovery, primarily led by solid capital expenditures, although export growth and corporate activity remain restrained by external demand uncertainty and the ongoing effects of U.S. trade policies.
- Annual headline inflation (excluding fresh food) accelerated to 2.9% year-on-year in September, marking the first uptick in four months and staying above the BOJ’s 2% target. Broad-based inflation persists, with food and energy cost pressures, but wage growth continues to support household consumption. Input cost pressures from the earlier surge in imports eased slightly.
- Short-term inflation momentum could moderate as food-price hikes ease, though rent, healthcare, and service-sector price increases tied to labor shortages provide support. Firms and households maintain a gradual upward drift in inflation expectations.
- For the near term, BOJ projects growth below trend as external demand stays subdued and corporate investment plans remain cautious. Still, accommodative financial conditions and steady gains in real labor income will underpin domestic consumption.
- Over the medium term, as overseas economies recover and trade conditions normalize, Japan’s growth potential should improve. Persistent labor market tightness, higher wage settlements, and rising medium- to long-term inflation expectations are expected to keep core inflation on a gradual upward trajectory, converging toward the 2% price stability target later in the forecast horizon.
- The next meeting is scheduled for 18 to 19 December 2025.
Next 24 Hours Bias
Medium Bearish
Oil
Key news events today
No major news event
What can we expect from Oil today?
Oil markets face conflicting pressures as they enter the week of November 2025. Ukrainian attacks on Russian infrastructure and U.S. sanctions are adding short-term supply risk premiums, while fundamental oversupply concerns driven by rising OPEC+ production, record U.S. output, and slowing global demand growth continue to limit upside price potential.
Brent crude is expected to trade between $60 and $67 per barrel, with WTI in the $58 to $64 range. The November 21 sanctions deadline and ongoing geopolitical developments will be critical factors determining whether prices break out of their current downtrend or test lower support levels toward $55 per barrel.
Next 24 Hours Bias
Medium Bullish
The post IC Markets – Asia Fundamental Forecast | 17 November 2025 first appeared on IC Markets | Official Blog.
Monday 17th November 2025: Asian Markets Mixed Amid Rate Uncertainty and Weak Global Cues
423569 November 17, 2025 15:15 ICMarkets Market News
Global Markets:
- Asian Stock Markets : Nikkei down -0.27%, Shanghai Composite down -0.43%, Hang Seng down -0.92% ASX down -0.13%
- Commodities : Gold at $4,086.74 (-0.21%), Silver at $50.728 (0.09%), Brent Oil at $63.88 (-0.79%), WTI Oil at $59.53 (-0.70%)
- Rates : US 10-year yield at 4.149, UK 10-year yield at 4.5770, Germany 10-year yield at 2.7166
News & Data:
- (CAD) Manufacturing Sales m/m 3.3% to 2.8% expected
- (CAD) Wholesale Sales m/m 0.6% to 0.0% expected
Markets Update:
Asian stocks traded mixed on Monday, mirroring the uneven cues from Wall Street on Friday, as investors reassessed the outlook for U.S. interest rates, tech sector valuations and overall economic momentum. Market sentiment remains cautious following recent comments from U.S. Federal Reserve officials and concerns that key economic data may be delayed indefinitely due to the prolonged government shutdown. Expectations for a rate cut next month have weakened, with the CME FedWatch Tool showing the probability slipping to 45.8 percent from nearly 67 percent a week earlier.
Australian shares were modestly lower, extending losses from the past week. The S&P/ASX 200 hovered near 8,600, pressured by weakness in financials and mixed movements across major sectors. Miners traded mixed, oil stocks were mostly higher, and tech names saw varied performance, with Appen surging while Block and Xero declined.
Japanese markets also moved lower, with the Nikkei 225 near the 50,000 mark amid losses in automakers, exporters and several major consumer names. However, select tech and financial stocks posted notable gains. Fresh data showed Japan’s GDP contracted 0.4 percent in the third quarter, adding to the cautious tone.
Elsewhere in the region, South Korea led gains, while China, Hong Kong and Singapore edged lower. Wall Street ended Friday mostly flat after recovering from early losses, while European markets closed broadly weaker. Crude oil prices rose sharply following reports of a drone strike on a Russian oil facility.
Upcoming Events:
- 01:30 PM GMT – CAD CPI m/m
- 01:30 PM GMT – CAD Median CPI y/y
- 01:30 PM GMT – CAD Trimmed CPI y/y
The post Monday 17th November 2025: Asian Markets Mixed Amid Rate Uncertainty and Weak Global Cues first appeared on IC Markets | Official Blog.
Monday 17th November 2025: Technical Outlook and Review
423555 November 17, 2025 15:14 ICMarkets Market News
DXY (U.S. Dollar Index):
Potential Direction: Bullish
Overall momentum of the chart: Bearish
The price could make a short-term pullback toward the pivot before rising again toward the 1st resistance
Pivot: 98.80
Supporting reasons: Identified as an overlap support, where renewed buying pressure could emerge to push the price higher.
1st support: 96.64
Supporting reasons: Identified as a swing low support, indicating a potential area where the price could again stabilize.
1st resistance: 101.83
Supporting reasons: Identified as an overlap resistance that aligns closely with the 38.2% Fibonacci retracement and the 100% Fibonacci projection, indicating a potential area that could halt any further upward movement
EUR/USD:
Potential Direction: Bearish
Overall momentum of the chart: Bullish
The price has already reacted off the pivot and may continue its bearish move toward the 1st support
Pivot: 1.1654
Supporting reasons: Identified as an overlap resistance, where selling pressures could intensify and potentially cap any upward retracement
1st support: 1.1403
Supporting reasons: Identified as a swing low support, indicating a potential level where the price could stabilize once again.
1st resistance: 1.1807
Supporting reasons: Identified as a swing high resistance, indicating a potential level that could cap further upward movement.
EUR/JPY:
Potential Direction: Bullish
Overall momentum of the chart: Bullish
The price has already bounced off the pivot and may continue its bullish move toward the 1st resistance
Pivot: 177.55
Supporting reasons: Identified as a pullback support, where renewed buying pressure could emerge to push the price higher.
1st support: 173.94
Supporting reasons: Identified as a pullback support, indicating a potential area where the price could again stabilize.
1st resistance: 182.48
Supporting reasons: Identified as a resistance that is supported by the 100% Fibonacci projection, indicating a potential level that could cap further upward movement.
EUR/GBP:
Potential Direction: Bullish
Overall momentum of the chart: Bullish
The price could make a short-term pullback toward the pivot before rising again toward the 1st resistance
Pivot: 0.8744
Supporting reasons: Identified as a pullback support, where renewed buying pressure could emerge to push the price higher.
1st support: 0.8607
Supporting reasons: Identified as an overlap support, indicating a potential area where the price could stabilize once more.
1st resistance: 0.8976
Supporting reasons: Identified as a resistance that is supported by the 161.8% Fibonacci extension, indicating a potential level that could cap further upward movement.
GBP/USD:
Potential Direction: Bearish
Overall momentum of the chart: Bullish
The price could see a short-term pullback toward the pivot before continuing its bearish move down toward the 1st support.
Pivot: 1.3296
Supporting reasons: Identified as a pullback resistance, where selling pressures could intensify and potentially cap any upward retracement.
1st support: 1.3002
Supporting reasons: Identified as a pullback support that aligns with the 100% Fibonacci projection, indicating a potential area where the price could stabilize once more.
1st resistance: 1.3740
Supporting reasons: Identified as a swing high resistance, indicating a potential level that could halt further upward movement.
GBP/JPY:
Potential Direction: Bullish
Overall momentum of the chart: Bullish
The price could make a short-term pullback toward the pivot before rising again toward the 1st resistance
Pivot: 199.59
Supporting reasons: Identified as a pullback support, where renewed buying pressure could emerge to push the price higher.
1st support: 195.51
Supporting reasons: Identified as an overlap support, indicating a potential level where the price could stabilize once more.
1st resistance: 205.33
Supporting reasons: Identified as an overlap resistance, indicating a potential level that could halt further upward movement.
USD/CHF:
Potential Direction: Bullish
Overall momentum of the chart: Bearish
The price could make a short-term pullback toward the pivot before rising again toward the 1st resistance
Pivot: 0.7875
Supporting reasons: Identified as a multi swing low support, where renewed buying pressure could emerge to push the price higher.
1st support: 0.7720
Supporting reasons: Identified as a support that is supported by the 161.8% Fibonacci extension, indicating a potential level where the price could stabilize once again.
1st resistance: 0.8092
Supporting reasons: Identified as an overlap resistance, indicating a potential level that could cap further upward movement.
USD/JPY:
Potential Direction: Bullish
Overall momentum of the chart: Bullish
The price could make a short-term pullback toward the pivot before rising again toward the 1st resistance
Pivot: 151.18
Supporting reasons: Identified as a pullback support, where renewed buying pressure could emerge to push the price higher.
1st support: 148.83
Supporting reasons: Identified as a pullback support, indicating a strong area where buyers might return, and the price could stabilize once again.
1st resistance: 156.25
Supporting reasons: Identified as an overlap resistance that aligns with the 161.8% Fibonacci extension. This level represents the next key area where upward movement could be capped amid increased selling pressure
USD/CAD:
Potential Direction: Bullish
Overall momentum of the chart: Bearish
The price could make a short-term pullback toward the pivot before rising again toward the 1st resistance
Pivot: 1.3912
Supporting reasons: Identified as a pullback support, where renewed buying pressure could emerge to push the price higher.
1st support: 1.3761
Supporting reasons: Identified as an overlap support, indicating a key level where the price could stabilize once more.
1st resistance: 1.4151
Supporting reasons: Identified as a pullback resistance that aligns with the 61.8% Fibonacci retracement, making it a possible target for bullish advances and a level where some sellers could return to cap gains
AUD/USD:
Potential Direction: Bearish
Overall momentum of the chart: Bullish
The price could trigger a bearish breakout of the pivot before continuing its bearish move down toward the 1st support.
Pivot: 0.6532
Supporting reasons: Identified as a pullback resistance, where selling pressures could intensify and potentially cap any upward retracement.
1st support: 0.6328
Supporting reasons: Identified as a pullback support that aligns with the 161.8% Fibonacci extension, this area has provided strong support historically and may attract buying interest for a potential short-term bounce
1st resistance: 0.6681
Supporting reasons: Identified as a swing high resistance, indicating a potential area that could halt any further upward movement.
NZD/USD
Potential Direction: Bearish
Overall momentum of the chart: Bearish
The price could see a short-term pullback toward the pivot before continuing its bearish move down toward the 1st support.
Pivot: 0.5705
Supporting reasons: Identified as a pullback resistance, where selling pressures could intensify and potentially cap any upward retracement.
1st support: 0.5542
Supporting reasons: Identified as a swing low support that aligns with the 161.8% Fibonacci projection, this area has provided strong support historically and may attract buying interest for a potential short-term bounce
1st resistance: 0.5847
Supporting reasons: Identified as an overlap resistance, indicating a potential area that could halt any further upward movement.
US30 (DJIA):
Potential Direction: Bullish
Overall momentum of the chart: Bullish
The price could make a short-term pullback toward the pivot before rising again toward the 1st resistance
Pivot: 46,841.88
Supporting reasons: Identified as a pullback support, where renewed buying pressure could emerge to push the price higher.
1st support: 45,103.25
Supporting reasons: Identified as an overlap support, suggesting a potential area where the price could stabilize once again.
1st resistance: 50,240.06
Supporting reasons: Identified as a resistance that is supported by the 161.8% Fibonacci extension, indicating a potential area that could halt any further upward movement.
DE40 (DAX):
Potential Direction: Sideways
Overall momentum of the chart: Bullish
Price is oscillating within a defined range, repeatedly testing resistance and support without significant follow-through in either direction.
1st support: 23,354.00
Supporting reasons: Identified as an overlap support, indicating a key level where the price could stabilize once more.
1st resistance: 24,635.40
Supporting reasons: Identified as a swing high resistance, indicating a potential area that could halt any further upward movement.
US500 (S&P 500):
Potential Direction: Bullish
Overall momentum of the chart: Bullish
The price could make a short-term pullback toward the pivot before rising again toward the 1st resistance
Pivot: 6,505.98
Supporting reasons: Identified as an overlap support, where renewed buying pressure could emerge to push the price higher.
1st support: 6,141.15
Supporting reasons: Identified as a pullback support, indicating a potential level where the price could stabilize once again.
1st resistance: 6,978.39
Supporting reasons: Identified as a resistance that is supported by the 161.8% Fibonacci extension, indicating a potential area that could halt any further upward movement.
BTC/USD (Bitcoin):
Potential Direction: Bearish
Overall momentum of the chart: Bullish
The price could see a short-term pullback toward the pivot before continuing its bearish move down toward the 1st support.
Pivot: 100.180.68
Supporting reasons: Identified as a pullback resistance, where selling pressures could intensify and potentially cap any upward retracement.
1st support: 89,284.13
Supporting reasons: Identified as an overlap support that aligns with the 100% Fibonacci projection, indicating a potential level where the price could stabilize once more.
1st resistance: 107,086.85
Supporting reasons: Identified as an overlap resistance, indicating a potential area that could halt any further upward movement.
ETH/USD (Ethereum):
Potential Direction: Bearish
Overall momentum of the chart: Bullish
The price could see a short-term pullback toward the pivot before continuing its bearish move down toward the 1st support.
Pivot: 3,694.00
Supporting reasons: Identified as a pullback resistance, where selling pressures could intensify and potentially cap any upward retracement.
1st support: 2,830.12
Supporting reasons: Identified as a pullback support that aligns with the 61.8% Fibonacci retracement and the 127.2% Fibonacci extension, indicating a potential level where the price could stabilize once more.
1st resistance: 4,267.40
Supporting reasons: Identified as an overlap resistance, indicating a potential area that could halt any further upward movement.
WTI/USD (Oil):
Potential Direction: Bullish
Overall momentum of the chart: Bullish
The price could make a short-term pullback toward the pivot before rising again toward the 1st resistance
Pivot: 57.62
Supporting reasons: Identified as a pullback support, where renewed buying pressure could emerge to push the price higher.
1st support: 54.92
Supporting reasons: Identified as a swing low support, indicating a key level where the price could stabilize once more.
1st resistance: 65.95
Supporting reasons: Identified as an overlap resistance that aligns with the 61.8% Fibonacci retracement, indicating a potential area that could halt any further upward movement.
XAU/USD (GOLD):
Potential Direction: Bearish
Overall momentum of the chart: Bullish
The price could see a short-term pullback toward the pivot before continuing its bearish move down toward the 1st support.
Pivot: 4,200.43
Supporting reasons: Identified as a pullback resistance that aligns closely with the 78.6% Fibonacci retracement, where selling pressures could intensify and potentially cap any upward retracement.
1st support: 3,923.18
Supporting reasons: Identified as a swing low support, indicating a key level where the price could stabilize once more.
1st resistance: 4,379.38
Supporting reasons: Identified as a swing resistance, indicating a potential area that could halt any further upward movement.
The accuracy, completeness and timeliness of the information contained on this site cannot be guaranteed. IC Markets Global does not warranty, guarantee or make any representations, or assume any liability regarding financial results based on the use of the information in the site.
News, views, opinions, recommendations and other information obtained from sources outside of www.icmarkets.com, used in this site are believed to be reliable, but we cannot guarantee their accuracy or completeness. All such information is subject to change at any time without notice. IC Markets Global assumes no responsibility for the content of any linked site.
The fact that such links may exist does not indicate approval or endorsement of any material contained on any linked site. IC Markets Global is not liable for any harm caused by the transmission, through accessing the services or information on this site, of a computer virus, or other computer code or programming device that might be used to access, delete, damage, disable, disrupt or otherwise impede in any manner, the operation of the site or of any user’s software, hardware, data or property.
The post Monday 17th November 2025: Technical Outlook and Review first appeared on IC Markets | Official Blog.
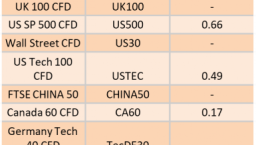
Ex-Dividend 17/11/2025
423513 November 14, 2025 17:00 ICMarkets Market News
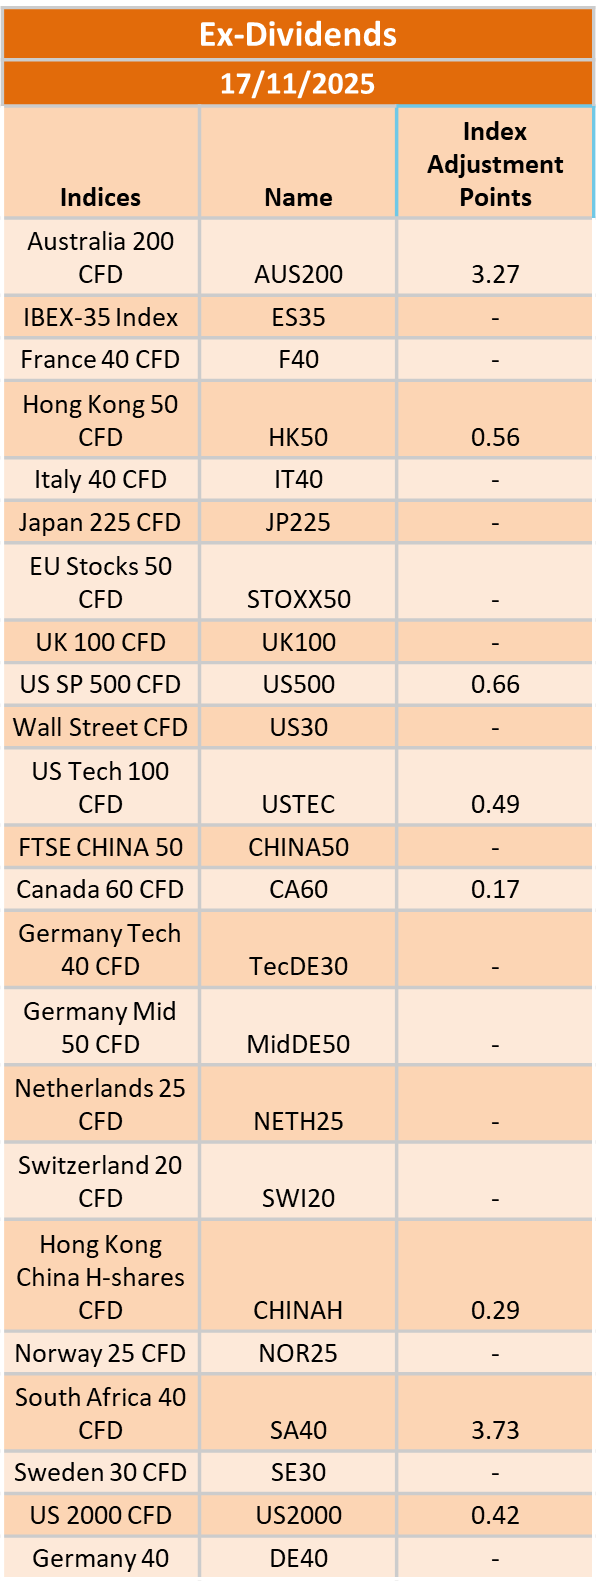
The post Ex-Dividend 17/11/2025 first appeared on IC Markets | Official Blog.
Friday 14th November 2025: Technical Outlook and Review
423500 November 14, 2025 16:14 ICMarkets Market News
DXY (U.S. Dollar Index):
Potential Direction: Bullish
Overall momentum of the chart: Bearish
The price has already bounced off the pivot and may continue its bullish move toward the 1st resistance
Pivot: 99.13
Supporting reasons: Identified as an overlap support that aligns closely with the 61.8% Fibonacci retracement, where renewed buying pressure could emerge to push the price higher.
1st support: 98.66
Supporting reasons: Identified as an overlap support, indicating a potential area where the price could again stabilize.
1st resistance: 99.72
Supporting reasons: Identified as an overlap resistance, indicating a potential area that could halt any further upward movement
EUR/USD:
Potential Direction: Bullish
Overall momentum of the chart: Bearish
The price could see a short-term pullback toward the pivot before rising again toward the 1st resistance.
Pivot: 1.1598
Supporting reasons: Identified as a pullback support, where renewed buying pressure could emerge to push the price higher.
1st support: 1.1537
Supporting reasons: Identified as an overlap support, indicating a potential level where the price could stabilize once again.
1st resistance: 1.1669
Supporting reasons: Identified as a swing high resistance, indicating a potential level that could cap further upward movement.
EUR/JPY:
Potential Direction: Bullish
Overall momentum of the chart: Bullish
The price could see a short-term pullback toward the pivot before rising again toward the 1st resistance.
Pivot: 178.70
Supporting reasons: Identified as a pullback support, where renewed buying pressure could emerge to push the price higher.
1st support: 177.13
Supporting reasons: Identified as a pullback support, indicating a potential area where the price could again stabilize.
1st resistance: 180.73
Supporting reasons: Identified as a resistance that is supported by the 161.8% Fibonacci extension, indicating a potential level that could cap further upward movement.
EUR/GBP:
Potential Direction: Bullish
Overall momentum of the chart: Bullish
The price could see a short-term pullback toward the pivot before rising again toward the 1st resistance.
Pivot: 0.8817
Supporting reasons: Identified as a pullback support, where renewed buying pressure could emerge to push the price higher.
1st support: 0.8763
Supporting reasons: Identified as a swing low support, indicating a potential area where the price could stabilize once more.
1st resistance: 0.8872
Supporting reasons: Identified as a resistance that is supported by the 161.8% Fibnacci extension, indicating a potential level that could cap further upward movement.
GBP/USD:
Potential Direction: Bearish
Overall momentum of the chart: Bullish
The price could see a short-term pullback toward the pivot before continuing its bearish move down toward the 1st support.
Pivot: 1.3257
Supporting reasons: Identified as a pullback resistance that aligns with the 50% Fibonacci retracement, where selling pressures could intensify and potentially cap any upward retracement.
1st support: 1.3102
Supporting reasons: Identified as an overlap support, indicating a potential area where the price could stabilize once more.
1st resistance: 1.3319
Supporting reasons: Identified as a pullback resistance, indicating a potential level that could halt further upward movement.
GBP/JPY:
Potential Direction: Bullish
Overall momentum of the chart: Bullish
The price could see a short-term pullback toward the pivot before rising again toward the 1st resistance.
Pivot: 201.71
Supporting reasons: Identified as a pullback support, where renewed buying pressure could emerge to push the price higher.
1st support: 200.40
Supporting reasons: Identified as an overlap support, indicating a potential level where the price could stabilize once more.
1st resistance: 204.84
Supporting reasons: Identified as a swing high resistance, indicating a potential level that could halt further upward movement.
USD/CHF:
Potential Direction: Bearish
Overall momentum of the chart: Bearish
The price could see a short-term pullback toward the pivot before continuing its bearish move down toward the 1st support.
Pivot: 0.7975
Supporting reasons: Identified as a pullback resistance, where selling pressures could intensify and potentially cap any upward retracement.
1st support: 0.7892
Supporting reasons: Identified as a swing low support, indicating a potential level where the price could stabilize once again.
1st resistance: 0.8037
Supporting reasons: Identified as a pullback resistance, indicating a potential level that could cap further upward movement.
USD/JPY:
Potential Direction: Bullish
Overall momentum of the chart: Bullish
The price could see a short-term pullback toward the pivot before rising again toward the 1st resistance.
Pivot: 153.06
Supporting reasons: Identified as an overlap support, where renewed buying pressure could emerge to push the price higher.
1st support: 151.15
Supporting reasons: Identified as a pullback support, indicating a strong area where buyers might return, and the price could stabilize once again.
1st resistance: 155.43
Supporting reasons: Identified as a resistance that is supported by the 161.8% Fibonacci extension. This level represents the next key area where upward movement could be capped amid increased selling pressure
USD/CAD:
Potential Direction: Bullish
Overall momentum of the chart: Bearish
The price has already bounced off the pivot and may continue its bullish move toward the 1st resistance
Pivot: 1.3984
Supporting reasons: Identified as a pullback support that aligns closely with the 61.8% Fibonacci retracement, where renewed buying pressure could emerge to push the price higher.
1st support: 1.3947
Supporting reasons: Identified as a pullback support that aligns with the 78.6% Fibonacci retracement, indicating a key level where the price could stabilize once more.
1st resistance: 1.4079
Supporting reasons: Identified as a pullback resistance, making it a possible target for bullish advances and a level where some sellers could return to cap gains
AUD/USD:
Potential Direction: Bullish
Overall momentum of the chart: Bullish
The price has already bounced off the pivot and may continue its bullish move toward the 1st resistance
Pivot: 0.6515
Supporting reasons: Identified as an overlap support that aligns cl0sely with the 50% Fibonacci retracement, where renewed buying pressure could emerge to push the price higher.
1st support: 0.6447
Supporting reasons: Identified as a swing low support, this area has provided strong support historically and may attract buying interest for a potential short-term bounce
1st resistance: 0.6621
Supporting reasons: Identified as a swing high resistance, indicating a potential area that could halt any further upward movement.
NZD/USD
Potential Direction: Bearish
Overall momentum of the chart: Bullish
The price could see a short-term pullback toward the pivot before continuing its bearish move down toward the 1st support.
Pivot: 0.5689
Supporting reasons: Identified as a pullback resistance, where selling pressures could intensify and potentially cap any upward retracement.
1st support: 0.5614
Supporting reasons: Identified as a support that is supported by the 161.8% Fibonacci extension, this area has provided strong support historically and may attract buying interest for a potential short-term bounce
1st resistance: 0.5760
Supporting reasons: Identified as a pullback resistance, indicating a potential area that could halt any further upward movement.
US30 (DJIA):
Potential Direction: Bullish
Overall momentum of the chart: Bullish
The price could fall toward the pivot and could make a short-term pullback toward this level before rising again toward the 1st resistance.
Pivot: 47,416.67
Supporting reasons: Identified as a pullback support, where renewed buying pressure could emerge to push the price higher.
1st support: 46,883.92
Supporting reasons: Identified as an overlap support, suggesting a potential area where the price could stabilize once again.
1st resistance: 48,422.09
Supporting reasons: Identified as a swing high resistance, indicating a potential area that could halt any further upward movement.
DE40 (DAX):
Potential Direction: Bullish
Overall momentum of the chart: Bullish
The price could fall toward the pivot and could make a short-term pullback toward this level before rising again toward the 1st resistance.
Pivot: 23,966.11
Supporting reasons: Identified as an overlap support, where renewed buying pressure could emerge to push the price higher.
1st support: 23,55.71
Supporting reasons: Identified as a swing low support, indicating a key level where the price could stabilize once more.
1st resistance: 24,512.32
Supporting reasons: Identified as a pullback resistance, indicating a potential area that could halt any further upward movement.
US500 (S&P 500):
Potential Direction: Bearish
Overall momentum of the chart: Bullish
The price could see a short-term pullback toward the pivot before continuing its bearish move down toward the 1st support.
Pivot: 6,805.54
Supporting reasons: Identified as a pullback resistance, where selling pressures could intensify and potentially cap any upward retracement.
1st support: 6,668.11
Supporting reasons: Identified as a swing low support, indicating a potential level where the price could stabilize once again.
1st resistance: 6.919.84
Supporting reasons: Identified as a swing high resistance, indicating a potential area that could halt any further upward movement.
BTC/USD (Bitcoin):
Potential Direction: Bearish
Overall momentum of the chart: Bullish
The price could see a short-term pullback toward the pivot before continuing its bearish move down toward the 1st support.
Pivot: 103,689.44
Supporting reasons: Identified as an overlap resistance, where selling pressures could intensify and potentially cap any upward retracement.
1st support: 97,922.97
Supporting reasons: Identified as an overlap support, indicating a potential level where the price could stabilize once more.
1st resistance: 107,315.33
Supporting reasons: Identified as an overlap resistance, indicating a potential area that could halt any further upward movement.
ETH/USD (Ethereum):
Potential Direction: Bearish
Overall momentum of the chart: Bullish
The price could see a short-term pullback toward the pivot before continuing its bearish move down toward the 1st support.
Pivot: 3,411.03
Supporting reasons: Identified as a pullback resistance, where selling pressures could intensify and potentially cap any upward retracement.
1st support: 3,055.28
Supporting reasons: Identified as a swing low support, indicating a potential level where the price could stabilize once more.
1st resistance: 3,691.20
Supporting reasons: Identified as a pullback resistance, indicating a potential area that could halt any further upward movement.
WTI/USD (Oil):
Potential Direction: Bearish
Overall momentum of the chart: Bullish
The price could see a short-term pullback toward the pivot before continuing its bearish move down toward the 1st support.
Pivot: 60.14
Supporting reasons: Identified as a pullback resistance that aligns with the 61.8% Fibonacci retracement, where selling pressures could intensify and potentially cap any upward retracement.
1st support: 57.72
Supporting reasons: Identified as a pullback support, indicating a key level where the price could stabilize once more.
1st resistance: 62.41
Supporting reasons: Identified as a swing high resistance, indicating a potential area that could halt any further upward movement.
XAU/USD (GOLD):
Potential Direction: Bullish
Overall momentum of the chart: Bullish
The price could fall toward the pivot and could make a short-term pullback toward this level before rising again toward the 1st resistance.
Pivot: 4,144.95
Supporting reasons: Identified as a pullback support, where renewed buying pressure could emerge to push the price higher.
1st support: 4,053.95
Supporting reasons: Identified as a pullback support, indicating a key level where the price could stabilize once more.
1st resistance: 4,274.95
Supporting reasons: Identified as a pullback resistance that aligns with the 78.6% Fibonacci retracement and the 78.6% Fibonacci projection, indicating a potential area that could halt any further upward movement.
The accuracy, completeness and timeliness of the information contained on this site cannot be guaranteed. IC Markets Global does not warranty, guarantee or make any representations, or assume any liability regarding financial results based on the use of the information in the site.
News, views, opinions, recommendations and other information obtained from sources outside of www.icmarkets.com, used in this site are believed to be reliable, but we cannot guarantee their accuracy or completeness. All such information is subject to change at any time without notice. IC Markets Global assumes no responsibility for the content of any linked site.
The fact that such links may exist does not indicate approval or endorsement of any material contained on any linked site. IC Markets Global is not liable for any harm caused by the transmission, through accessing the services or information on this site, of a computer virus, or other computer code or programming device that might be used to access, delete, damage, disable, disrupt or otherwise impede in any manner, the operation of the site or of any user’s software, hardware, data or property.
The post Friday 14th November 2025: Technical Outlook and Review first appeared on IC Markets | Official Blog.
General Market Analysis – 14/11/25
423499 November 14, 2025 16:00 ICMarkets Market News
US Stocks Hit After Government Reopens – Nasdaq off 2.3%
US equities dropped sharply on Thursday as traders digested the government’s reopening after a record 43-day shutdown. Inflation concerns and shifting rate-cut expectations were the main drivers as investors became nervous ahead of renewed data releases. The Dow dropped 1.65% to 47,457, the S&P 500 fell 1.66% to 6,737, and the Nasdaq led losses with a 2.29% slide to 22,870. The US dollar fell against the majors, the DXY slipping 0.32% to 99.15, while Treasury yields pushed higher as markets reassessed the Fed outlook. The 2-year yield rose 2.3 bps to 3.591%, and the 10-year gained 3.7 bps to 4.106%. Commodities were mixed. Brent edged up 0.32% to $62.91, and WTI added 0.22% to $58.62 following the previous day’s steep decline. Gold, despite an early push higher, reversed to finish the NY session down 0.57% at $4,171.52 an ounce.
Fed Rate Cut Drops to a 50–50 Chance in December
Expectations for a Federal Reserve rate cut in December have taken a sharp drop in the last few weeks, with estimates from the CME’s FedWatch dropping from a near-certain rate cut — over 95% — a month ago to now sit at a 50% chance. The US government’s reopening, which had fuelled positive risk sentiment in the early part of the week, saw a dramatic turnaround in trading yesterday when it occurred. Originally, thoughts that the resumption would see data renewed and confirm a rate cut from the Fed have led to increased concerns that the lack of recent data will force the FOMC to hold fire until they have more certainty on the state of the economy. Jobs numbers, which we have missed two releases of, and inflation data, as always, will be closely watched if or when they come out, with traders anxiously awaiting updates on when we will have the next releases and what form they will take. In the meantime, expect more volatility on news updates and what could then become a very ‘live’ Fed meeting in December.
Quiet Calendar Day to Close Out the Week
It is a quiet calendar day ahead for traders today, with little in the way of data or major central bank updates to move markets; however, volatility is expected to remain relatively high as the US government reopens and investors look ahead to renewed data releases. The Asian session does have some big data coming out of China that could move local markets: Industrial Production (exp. 5.5% y/y), Retail Sales (exp. 2.7% y/y) and the Unemployment Rate (exp. 5.2%) are all due out midway through the day. There is little scheduled in the London session to move markets; however, once again the New York day is expected to see plenty of action as traders hear the latest updates on the reopening of the US government and data release updates. We are also set to hear from Fed members Schmid, Logan and Bostic towards the end of the day.
The post General Market Analysis – 14/11/25 first appeared on IC Markets | Official Blog.
IC Markets – Asia Fundamental Forecast | 14 November 2025
423498 November 14, 2025 16:00 ICMarkets Market News
IC Markets – Asia Fundamental Forecast | 14 November 2025
What happened in the U.S. session?
The U.S. overnight session delivered a tale of two markets. While the government reopening on November 12 provided political relief and initially boosted cyclical sectors, deeper concerns about Federal Reserve policy, economic data unavailability, and stretched technology valuations triggered one of November’s sharpest selloffs on Thursday. The collapse in December rate cut expectations from 96% to 52% probability reflected growing Fed hawkishness amid persistent 3% inflation and labor market uncertainty.
What does it mean for the Asia Session?
Asian markets on Friday face a data-heavy session with China’s October industrial production and retail sales taking center stage alongside US retail sales and PPI. The recently ended US government shutdown should allow official data releases to resume, providing clarity on Fed policy direction. Japan’s yen remains under pressure near intervention levels (155), though actual action appears unlikely given Prime Minister Takaichi’s fiscal expansion plans
The Dollar Index (DXY)
Key news events today
No major news event
What can we expect from DXY today?
The US dollar in a consolidation phase around 99.30 on the DXY index, caught between conflicting forces. The end of the government shutdown provides relief but leaves economic scars estimated at $14 billion in permanent losses. Federal Reserve policy remains highly uncertain, with December rate cut odds hovering around 54% as officials navigate inflation concerns, labor market weakness, and missing economic data. The dollar has weakened significantly over the past year, down 7.08%, as Trump’s aggressive tariff policies and political uncertainty challenge its traditional safe-haven status.
Central Bank Notes:
- The Federal Open Market Committee (FOMC) voted, by majority, to lower the federal funds rate target range by 25 basis points to 3.75%–4.00% at its October 28–29, 2025, meeting, marking the second consecutive cut following the 25 basis points reduction in September.
- The Committee maintained its long-term objectives of maximum employment and 2% inflation, noting that the labor market continues to soften, with modest job creation and an unemployment rate edging higher. In comparison, inflation remains above target at around 3.0%.
- Policymakers highlighted ongoing downside risks to economic growth, tempered by signs of resilient economic activity. September’s consumer price index (CPI) came in slightly lower than expected at 3.0% year-over-year, easing inflation pressure but still warranting vigilance given tariff-driven price effects.
- Economic activity expanded modestly in the third quarter, with GDP growth estimates around 1.0% annualized; however, uncertainty remains elevated amid persistent global trade tensions and the U.S. government shutdown, which is impacting data availability.
- The updated Summary of Economic Projections reflects an anticipated unemployment rate averaging approximately 4.5% for 2025, with headline and core personal consumption expenditures (PCE) inflation projections holding near 3.0%, indicating a slow easing path ahead.
- The Committee emphasized its flexible, data-dependent approach and underscored that future policy adjustments will be guided by incoming labor market and inflation data. As in prior meetings, there was dissent, including one member advocating a more aggressive 50-basis-point cut.
- The FOMC announced the planned conclusion of its balance sheet reduction (quantitative tightening) program, intending to cease runoff in the near term to maintain market stability, with Treasury redemption caps held steady at $5 billion per month and agency mortgage-backed securities caps at $35 billion.
- The next meeting is scheduled for 9 to 10 December 2025.
Next 24 Hours Bias
Weak Bearish
Gold (XAU)
Key news events today
No major news event
What can we expect from Gold today?
Gold’s powerful rally to three-week highs reflects a compelling convergence of monetary policy expectations, geopolitical uncertainty, and structural demand shifts from central banks. The 63-68% probability of a December Federal Reserve rate cut, combined with 12 consecutive months of Chinese central bank buying and resolution of the U.S. government shutdown, has created favorable conditions for continued precious metals strength.
Next 24 Hours Bias
Strong Bullish
The Australian Dollar (AUD)
Key news events today
No major news event
What can we expect from AUD today?
The Australian dollar is trading firmly around 0.6556, supported by stronger-than-expected employment data that has sharply reduced expectations of RBA rate cuts. The currency has gained 1.03% over the past month and 1.52% over the past year. Key factors underpinning the AUD’s strength include a resilient domestic labor market, the RBA’s commitment to maintaining a restrictive policy stance amid persistent inflation, improved US–China trade relations, and renewed weakness in the US dollar following the resolution of the government shutdown.
Central Bank Notes:
- The Reserve Bank of Australia held its cash rate steady at 3.60% at the November policy meeting, citing persistent inflationary pressures and lingering uncertainties in both domestic and global outlooks. This is the third consecutive pause following the cut in August.
- Policymakers remain alert to renewed inflation momentum. After a temporary uptick in September’s CPI, trimmed mean inflation for Q3 stands at 3.0%, above the intended 2–3% band. The RBA now anticipates that core inflation will stay above target until at least mid-2026, delaying any hopes of further easing.
- Headline CPI climbed by 3.2% in the year to September 2025, driven by resilient housing (+2.5%) and insurance costs, while discretionary goods inflation is subdued. The transition to monthly CPI reporting from November will improve the accuracy of inflation tracking.
- Domestic demand remains firm, particularly in services and housing, while manufacturing and discretionary retail continue to lag. Household incomes have stabilized, but high borrowing costs and elevated rents are constraining consumption and risking a slowdown in Q1 2026.
- Labor market tightness persists, though job growth has moderated. Underutilization edged higher. Wage growth is plateauing, but weak productivity is keeping unit labor costs elevated—a medium-term risk that remains central to the Board’s narrative.
- The RBA highlights geopolitical tensions and volatile commodity markets as primary global risks, against a backdrop of modest upward revisions to world growth forecasts. The Board stresses that its stance remains “cautious and data-dependent,” with ongoing vigilance on inflation, labor, and spending trends.
- Monetary policy remains mildly restrictive, balancing progress on price stability against vulnerabilities in household demand and global outlook. Board communications reaffirm a dual mandate: price stability and full employment, while underscoring readiness to respond should risks materialize sharply.
- Analysts generally expect the cash rate to remain at current levels through early 2026, with only modest cuts possible later in the year if inflation moderates. The new monthly CPI release (first full edition Nov 2025) will be watched closely for timely signals on price trends.
- The next meeting is on 9 December 2025.
Next 24 Hours Bias
Weak Bullish
The Kiwi Dollar (NZD)
Key news events today
No major news event
What can we expect from NZD today?
The New Zealand Dollar faces a challenging environment on trading near 0.5650 as multiple headwinds converge. Domestically, weak manufacturing activity (PMI at 49.9), rising unemployment (5.3%), and expectations for continued RBNZ rate cuts (25 basis points expected on November 26 to 2.25%) are weighing on the currency. The central bank’s aggressive easing cycle reflects deep concerns about economic fragility, with markets pricing in rates falling to 2.00% by 2026.
Central Bank Notes:
- The Monetary Policy Committee (MPC) agreed to cut the Official Cash Rate (OCR) by 50 basis points to 2.50% on 8 October 2025, exceeding market expectations for a smaller 25-basis-point reduction and signaling a stronger commitment to reviving growth.
- The decision was reached by consensus, marking a shift from previous split votes, and reflected policymakers’ shared view that sustained economic weakness and persistent disinflationary pressures required a more front-loaded policy response.
- Annual consumer price inflation stood at 2.7% in the June quarter and is seen nearing 3% for the September quarter—above the 2% midpoint but within the 1–3% target range. Despite high near-term readings, the MPC projects inflation will return toward 2% by the first half of 2026 as spare capacity and moderating tradables curb price momentum.
- Policymakers acknowledged that domestic demand remains weak, with household spending, business investment, and construction activity under pressure. While still elevated, services inflation is expected to ease gradually as wage growth slows and unemployment edges higher.
- Financial conditions have eased with expectations as wholesale and retail borrowing rates adjust to lower policy settings. Bank lending data indicate a modest uptick in mortgage approvals, though broader credit demand remains subdued.
- GDP growth stalled in the middle of 2025, with high-frequency indicators showing continued weakness into the third quarter. A combination of elevated costs for essentials and falling savings continues to restrain household consumption, while global trade frictions weigh on business sentiment.
- The MPC noted that global uncertainty—particularly from US trade regulation changes and soft Chinese demand—continues to pose downside risks to export sectors, though these are partly offset by a weaker New Zealand dollar improving competitiveness.
- Subject to data confirming a sustained soft patch in activity and moderating inflation pressures, the MPC signaled further scope to reduce the OCR toward 2.25% at its next meeting on 26 November 2025, consistent with current market and Westpac forecasts.
- The next meeting is on 26 November 2025.
Next 24 Hours Bias
Medium Bearish
The Japanese Yen (JPY)
Key news events today
No major news events
What can we expect from JPY today?
The Japanese yen faces a confluence of bearish pressures. Prime Minister Takaichi’s pro-stimulus stance and preference for keeping rates low has created policy uncertainty that undermines yen strength, even as underlying inflation trends would typically warrant Bank of Japan tightening. The persistent decline in real wages for nine straight months complicates the central bank’s policy calculus, as Governor Ueda seeks wage-driven rather than cost-push inflation.
Central Bank Notes:
- The Policy Board of the Bank of Japan met on 30–31 October and, by a clear majority vote, decided to maintain its key monetary policy approach for the upcoming period.
- The BOJ will continue to encourage the uncollateralized overnight call rate to remain at around 0.5%, in line with the prior stance.
- The gradual quarterly reduction in monthly outright purchases of Japanese Government Bonds (JGBs) remains intact, with amounts unchanged from the previous schedule. Purchases are set to decrease by about ¥400 billion per quarter through March 2026, shifting to about ¥200 billion per quarter from April to June 2026, and targeting a ¥2 trillion purchase level for Q1 2027. The bank reaffirmed its intention to maintain flexibility, with readiness to respond if market conditions warrant an adjustment.
- Japan’s economy continues to show moderate recovery, primarily led by solid capital expenditures, although export growth and corporate activity remain restrained by external demand uncertainty and the ongoing effects of U.S. trade policies.
- Annual headline inflation (excluding fresh food) accelerated to 2.9% year-on-year in September, marking the first uptick in four months and staying above the BOJ’s 2% target. Broad-based inflation persists, with food and energy cost pressures, but wage growth continues to support household consumption. Input cost pressures from the earlier surge in imports eased slightly.
- Short-term inflation momentum could moderate as food-price hikes ease, though rent, healthcare, and service-sector price increases tied to labor shortages provide support. Firms and households maintain a gradual upward drift in inflation expectations.
- For the near term, BOJ projects growth below trend as external demand stays subdued and corporate investment plans remain cautious. Still, accommodative financial conditions and steady gains in real labor income will underpin domestic consumption.
- Over the medium term, as overseas economies recover and trade conditions normalize, Japan’s growth potential should improve. Persistent labor market tightness, higher wage settlements, and rising medium- to long-term inflation expectations are expected to keep core inflation on a gradual upward trajectory, converging toward the 2% price stability target later in the forecast horizon.
- The next meeting is scheduled for 18 to 19 December 2025.
Next 24 Hours Bias
Weak Bearish
Oil
Key news events today
No major news event
What can we expect from Oil today?
Oil markets face mounting oversupply pressures as production growth significantly outpaces demand expansion. Key developments include:Prices: Brent trading around $63/barrel and WTI near $58.85/barrel after recovering modestly from 4% Wednesday losses that pushed both benchmarks to three-week lows.Supply Outlook: OPEC now acknowledges Q3 2025 supply surplus of 500,000 barrels per day; IEA projects 2026 global surplus exceeding 4 million barrels per day with supply growing 3.1 million barrels per day in 2025 and 2.5 million barrels per day in 2026.
Next 24 Hours Bias
Weak Bearish
The post IC Markets – Asia Fundamental Forecast | 14 November 2025 first appeared on IC Markets | Official Blog.
IC Markets – Europe Fundamental Forecast | 14 November 2025
423497 November 14, 2025 15:39 ICMarkets Market News
IC Markets – Europe Fundamental Forecast | 14 November 2025
What happened in the Asia session?
The Asia session was marked by risk-off sentiment, with losses in regional equities led by tech, persistent weakness in the yen, and notable resilience in CNY and MYR following positive domestic data and Chinese policy signals.Macroeconomic releases in Malaysia reinforced regional EM FX strength, while China’s upcoming data will be critical for the Q4 outlook and Asian currency performance.Delayed U.S. data releases, the resolution of the government shutdown, and uncertainty about Fed interest-rate moves were the primary external drivers for Asia trading today.
What does it mean for the Europe & US sessions?
Friday’s trading sessions are dominated by critical US economic data releases that were delayed by the government shutdown, particularly retail sales and PPI figures that will inform Federal Reserve policy deliberations. Expectations for a December rate cut have fallen to coin-toss territory around 50%, down sharply from earlier in the week, following hawkish Fed commentary and persistent inflation concerns.
The Dollar Index (DXY)
Key news events today
No major news event
What can we expect from DXY today?
The dollar’s weakness on November 14 reflects market anxiety about what delayed economic data will reveal once released, rather than relief over the shutdown’s end. Traders are navigating a rare period where the Federal Reserve is effectively “data blind,” forcing reliance on incomplete private-sector indicators and creating elevated uncertainty across all asset classes.
Central Bank Notes:
- The Federal Open Market Committee (FOMC) voted, by majority, to lower the federal funds rate target range by 25 basis points to 3.75% — 4.00% at its October 28–29, 2025, meeting, marking the second consecutive cut following the 25 basis points reduction in September.
- The Committee maintained its long-term objectives of maximum employment and 2% inflation, noting that the labor market continues to soften, with modest job creation and an unemployment rate edging higher. In comparison, inflation remains above target at around 3.0%.
- Policymakers highlighted ongoing downside risks to economic growth, tempered by signs of resilient economic activity. September’s consumer price index (CPI) came in slightly lower than expected at 3.0% year-over-year, easing inflation pressure but still warranting vigilance given tariff-driven price effects.
- Economic activity expanded modestly in the third quarter, with GDP growth estimates around 1.0% annualized; however, uncertainty remains elevated amid persistent global trade tensions and the U.S. government shutdown, which is impacting data availability.
- The updated Summary of Economic Projections reflects an anticipated unemployment rate averaging approximately 4.5% for 2025, with headline and core personal consumption expenditures (PCE) inflation projections holding near 3.0%, indicating a slow easing path ahead.
- The Committee emphasized its flexible, data-dependent approach and underscored that future policy adjustments will be guided by incoming labor market and inflation data. As in prior meetings, there was dissent, including one member advocating a more aggressive 50-basis-point cut.
- The FOMC announced the planned conclusion of its balance sheet reduction (quantitative tightening) program, intending to cease runoff in the near term to maintain market stability, with Treasury redemption caps held steady at $5 billion per month and agency mortgage-backed securities caps at $35 billion.
- The next meeting is scheduled for 9 to 10 December 2025.
Next 24 Hours Bias
Weak Bearish
Gold (XAU)
Key news events today
No major news event
What can we expect from Gold today?
Friday, November 14, 2025, marked the fifth consecutive day of gains for gold, with prices consolidating near three-week highs around $4,200 per ounce, positioning the metal for its best weekly performance in a month. The precious metal’s 7% rally over five sessions was driven by multiple converging factors: the resolution of the 43-day US government shutdown, removing a major uncertainty, and a weaker US dollar falling to
99.60, and market expectations of a 50-70% probability for a Federal Reserve rate cut in December.
Next 24 Hours Bias
Strong Bullish
The Euro (EUR)
Key news events today
No major news event
What can we expect from EUR today?
The euro strengthened to two-week highs around 1.1636, supported by US dollar weakness following the 43-day government shutdown resolution and dovish Federal Reserve expectations. The ECB maintained its cautious stance with rates unchanged at 2.00% (deposit facility), emphasizing data dependence while inflation hovers near the 2% target at 2.1%. The eurozone economy showed modest growth of 0.2% in Q3, with resilient services (PMI 52.6) offsetting manufacturing stabilization at 50.0.
Central Bank Notes:
- The Governing Council of the ECB kept the three key interest rates unchanged at its 30 October 2025 meeting. The main refinancing rate remains at 2.15%, the marginal lending facility at 2.40%, and the deposit facility at 2.00%. This decision reflects policymakers’ assessment that the current monetary stance remains consistent with medium-term price stability, while incoming data confirm a gradual return of inflation towards the target.
- Recent indicators point to stable price dynamics. Headline inflation remains near the 2% mark, with energy prices contained and food inflation easing slightly after earlier supply bottlenecks. Wage growth continues to moderate, contributing to the slowdown in domestic cost pressures. The ECB reiterated its commitment to a data-driven, meeting-by-meeting approach and emphasized flexibility amid uncertain global financial conditions.
- Eurosystem staff projections have not been materially altered since September. Headline inflation averages remain at 2.0% for 2025, 1.8% for 2026, and 2.0% for 2027. Recent softening in producer prices and subdued pipeline pressures suggest limited upside risks to inflation, though geopolitical tensions and potential commodity shocks continue to pose uncertainties to the outlook.
- Euro area GDP growth remains on track with earlier forecasts, projected at 1.1% for 2025, 1.1% for 2026, and 1.4% for 2027. Forward-looking indicators, including PMIs and industrial sentiment surveys, signal some stabilization in activity following weakness in the third quarter. Public investment and recovering export activity are expected to offset softer private sector demand in the near term.
- The labor market remains resilient, with unemployment rates at multi-decade lows and participation rates strong. Real income growth continues to support household spending, even as consumption growth normalizes from earlier highs. Financing conditions remain favorable, aided by stable banking sector liquidity and improved credit demand among small and medium-sized firms.
- Business sentiment remains mixed, reflecting lingering uncertainty over global trade policy and the path of US tariffs. However, easing supply chain costs and improved export competitiveness due to softer exchange rates are providing some relief to manufacturing and external-oriented sectors.
- The Governing Council reaffirmed that future decisions will depend on an integrated assessment of incoming data—covering inflation trends, financial conditions, and the state of policy transmission. The Council emphasized that no pre-set path for rates exists; keeping all options open should the economic outlook shift markedly.
- Balance sheet reduction continues smoothly, with holdings under the APP and PEPP declining as reinvestments have ceased. The ECB confirmed that the pace of portfolio runoff remains in line with its previously communicated normalization plan, supporting a gradual withdrawal of monetary accommodation in a predictable manner.
- The next meeting is on 17 to 18 December 2025
Next 24 Hours Bias
Weak Bearish
The Swiss Franc (CHF)
Key news events today
No major news event
What can we expect from CHF today?
The Swiss franc is experiencing robust appreciation, driven by three primary factors: the imminent U.S.-Swiss trade deal reducing tariffs from 39% to 15%, persistent safe-haven demand amid global market uncertainties, and weak U.S. dollar performance. USD/CHF has fallen to 0.7920-0.7934, EUR/CHF to 0.9224-0.9249, and GBP/CHF to 1.0446-1.0459, with the franc up approximately 12% against the dollar year-to-date.
Central Bank Notes:
- The SNB maintained its key policy rate at 0% during its meeting on 25 September 2025, pausing a sequence of six consecutive rate cuts as inflation stabilized and the Swiss franc remained firm.
- Recent data showed a modest rebound in inflation, with Swiss consumer prices rising 0.2% year-on-year in August after staying above zero for three consecutive months; this helped alleviate fears of deflation that were mounting earlier in the year.
- The conditional inflation forecast remains broadly unchanged from June: headline inflation is expected to average 0.2% in 2025, 0.5% in 2026, and 0.7% in 2027. The risk of a negative rate move has diminished for now, but the SNB retains flexibility should inflationary pressures weaken again.
- The global economic outlook has deteriorated further, weighed down by heightened trade tensions—especially with the U.S.—and ongoing uncertainty in key Swiss export markets.
- Swiss GDP growth moderated in Q2 after a strong Q1 boosted by front-loaded U.S. exports. The SNB expects growth to slow and remain subdued, with forecasted GDP expansion between 1% and 1.5% in both 2025 and 2026.
- Labor market sentiment in the Swiss industrial sector has softened on concerns over export competitiveness and potential adjustments to production, but the overall growth outlook stays broadly unchanged
- The SNB reiterated its readiness to respond as needed if deflation risks re-emerge, emphasizing its commitment to medium-term price stability and a robust, transparent communication policy, with the introduction of more detailed monetary policy minutes beginning in October.
- The next meeting is on 11 December 2025.
Next 24 Hours Bias
Weak Bullish
The Pound (GBP)
Key news events today
No major news event
What can we expect from GBP today?
The pound faces significant headwinds entering the final weeks of 2025. The government’s dramatic U-turn on income tax rises has created fiscal and political uncertainty, while weak economic data and rising unemployment are strengthening expectations for a Bank of England rate cut in December. GBP/USD is currently consolidating around 1.3150-1.3168, struggling to break above resistance near 1.3200 while key support at 1.3100 remains in focus. The pound’s near-term trajectory depends heavily on the credibility of the November 26 Budget and whether upcoming UK inflation data supports the BoE’s dovish tilt.
Central Bank Notes:
- The Bank of England’s Monetary Policy Committee (MPC) met on 6 November 2025 and voted by a majority of 7–2 to keep the Bank Rate unchanged at 4.00 percent for a second consecutive meeting. The decision reflects the Committee’s cautious approach as inflation remains above target, but underlying economic momentum continues to weaken. Two members maintained their votes for a 25-basis-point cut, citing further signs of labor-market softening and weak business sentiment.
- The BOE adjusted its guidance on quantitative tightening (QT), maintaining the reduced pace established in September. The planned reduction of UK government bond holdings remains at £67.5 billion over the next 12 months, leaving the current gilt balance near £550 billion. Policymakers described the recalibrated QT path as “appropriate for current market conditions,” emphasizing the importance of liquidity management amid heightened volatility.
- Headline inflation moderated slightly to 3.6 percent in October from 3.8 percent previously, driven by easing food and transport prices. However, core inflation has shown only gradual progress, holding near 3.9 percent. The MPC noted that services inflation and administered energy costs continue to exert pressure, highlighting the challenge of achieving the 2 percent target sustainably. The Committee’s latest projections see inflation falling toward 3 percent by mid-2026, with further downside expected if energy and wage dynamics continue to normalize.
- Economic activity remains subdued. Estimates place Q3 GDP growth close to zero, with both business output and consumer spending restrained. The unemployment rate has edged up to 4.8 percent, while pay growth cooled to just under 5 percent year-on-year. MPC members acknowledged that pay settlements are weakening further, signaling an easing in labor cost pressures as demand softens. Surveys from the manufacturing and services sectors suggest muted hiring intentions through year-end.
- International factors continue to complicate the policy outlook. Fluctuating oil prices—partly linked to renewed Middle East tensions—alongside fragile global demand have contributed to higher market volatility. The MPC reiterated that external shocks, including global food and energy disruptions, could temporarily slow the disinflation path but remain unlikely to derail the medium-term moderation in prices.
- The Committee assessed risks around inflation as balanced. Downside risks arise from sluggish domestic growth and declining real income momentum, while upside risks remain tied to elevated inflation expectations and stubborn services inflation. Policymakers emphasized the need for patience, maintaining that any rate cuts ahead of clear inflation progress could undermine confidence in policy credibility.
- The MPC’s overall stance remains restrictive but increasingly balanced, with future moves expected to follow a cautious, data-driven trajectory. The Committee reaffirmed that monetary policy will stay tight until there is compelling evidence that inflation is returning to the 2 percent target on a durable basis.
- The next meeting is on 18 December 2025.
Next 24 Hours Bias
Medium Bearish
The Canadian Dollar (CAD)
Key news events today
No major news event
What can we expect from CAD today?
The Canadian dollar remains range-bound near the 1.40 level, pressured by widening yield spreads favoring the US dollar and weaker commodity prices. While robust domestic labor and inflation data have paused further BoC easing, subdued industrial indicators and trade uncertainties limit upside for the currency. Traders should monitor upcoming central bank guidance, oil movements, and key data releases for new directional cues.
Central Bank Notes:
- The Council noted that U.S. tariff tensions have eased slightly following early progress in bilateral discussions, though the external trade environment remains fragile. Businesses continue to hold back on long-term investment, with the Bank highlighting that sustained clarity on U.S. trade policy is needed to restore confidence.
- The Bank acknowledged that uncertainty persists despite the softer U.S. tone, as incoming data show limited improvement in export orders. The manufacturing sector has stabilized but remains below pre-2024 output levels, reflecting weak global demand and cautious corporate spending.
- Canada’s economy showed tentative signs of recovery in early Q4, with GDP estimated to expand by 0.3% in October after two quarters of contraction. Mining and energy activity strengthened modestly, aided by steady crude demand, while goods exports posted a fractional gain.
- Service sector growth remained uneven, supported mainly by tourism-related and technology services. However, retail spending and household consumption were subdued, constrained by slower job creation and lingering consumer caution. The Bank judged overall momentum as fragile but improving marginally.
- Housing activity showed modest reacceleration in major urban markets as mortgage rates stabilized near record lows. Nonetheless, affordability pressures and stricter lending standards continue to cap overall resale volumes, leading to only a gradual recovery in the housing sector.
- Headline CPI inflation rose to 2.1% in October, reaching the Bank’s target for the first time in six months. Higher energy prices and a modest uptick in food and shelter costs drove the increase. Core inflation measures remained stable, suggesting underlying price pressures are contained.
- The Governing Council reiterated its data-dependent stance, indicating that the current policy rate remains appropriate amid tentative growth and balanced inflation risks. Officials noted that while additional stimulus is not ruled out, the emphasis has shifted toward monitoring the sustainability of the recovery rather than immediate rate adjustments.
- The next meeting is on 17 to 18 December 2025.
Next 24 Hours Bias
WeaK Bullish
Oil
Key news events today
No major news event
What can we expect from Oil today?
Oil markets experienced a modest recovery following the week’s steep declines, with Brent rising above $64/bbl and WTI approaching $60/bbl. However, this bounce occurred against a backdrop of increasingly dire fundamental warnings from major energy agencies. The IEA’s projection of a record 4 million bpd surplus in 2026, OPEC’s shift to acknowledging oversupply in Q3 2025, and massive US inventory builds totaling 6.4 million barrels last week all point toward persistent price pressure ahead.
Next 24 Hours Bias
Medium Bearish
The post IC Markets – Europe Fundamental Forecast | 14 November 2025 first appeared on IC Markets | Official Blog.
Friday 14th November 2025: Asian Markets Slide as Uncertainty Grows Over Missing U.S. Economic Data
423496 November 14, 2025 15:39 ICMarkets Market News
Global Markets:
- Asian Stock Markets : Nikkei down -1.60%, Shanghai Composite down -0.16%, Hang Seng down -1.44% ASX down -1.40%
- Commodities : Gold at $4,205.71 (0.24%), Silver at $53.105 (-0.13%), Brent Oil at $63.93 (1.44%), WTI Oil at $59.62 (1.58%)
- Rates : US 10-year yield at 4.106, UK 10-year yield at 4.4400, Germany 10-year yield at 2.6874
News & Data:
- (GBP) GDP m/mc -0.1% to 0.0% expected
Markets Update:
Asian stock markets traded mostly lower on Friday, mirroring the weak cues from Wall Street as uncertainty persisted over whether key U.S. economic reports would be released following the end of the longest government shutdown in U.S. history. Despite President Donald Trump signing a short-term funding bill, the White House indicated that crucial October jobs and inflation data may never be published, leaving markets and the Federal Reserve “flying blind” regarding the strength of the U.S. economy. This lack of clarity has also reduced expectations for another Fed rate cut, with CME FedWatch showing the probability slipping to 51.6 percent.
In Australia, the S&P/ASX 200 fell sharply, dropping below 8,650 with broad weakness across mining, technology, banking and gold sectors. Major miners like BHP, Rio Tinto and Fortescue declined around 2 percent, while tech names such as Block and Zip slumped between 5 and 6 percent. Shares of TPG Telecom plunged nearly 30 percent as they went ex-dividend.
Japan’s Nikkei 225 also dropped significantly, losing 1.65 percent amid heavy selling in technology and heavyweight stocks. Tokyo Electron and Advantest fell sharply, while SoftBank and Fast Retailing also weakened.
Elsewhere in Asia, South Korea, Taiwan, China and Hong Kong traded lower, while Indonesia bucked the trend with modest gains. On Wall Street, major U.S. indexes extended losses, and in commodities, crude oil inched higher as renewed government operations boosted demand optimism.
Upcoming Events:
- 01:30 PM GMT – CAD Manufacturing Sales m/m
- 01:30 PM GMT – CAD Wholesale Sales m/m
The post Friday 14th November 2025: Asian Markets Slide as Uncertainty Grows Over Missing U.S. Economic Data first appeared on IC Markets | Official Blog.
IC Markets – Asia Fundamental Forecast | 13 November 2025
423462 November 13, 2025 18:14 ICMarkets Market News
IC Markets – Asia Fundamental Forecast | 13 November 2025
What happened in the U.S. session?
The overnight US session was dominated by optimism surrounding the imminent end of the 43-day government shutdown, which drove the Dow Jones to record highs while triggering a significant rotation from technology stocks into traditional value sectors. Healthcare, financials, and consumer stocks led gains, while the technology sector suffered notable losses following SoftBank’s $5.8 billion Nvidia stake sale. The Fed’s rate cut outlook remains uncertain, with December odds declining to 63-68% as inflation persists above target at 3%. Treasury yields eased, the dollar strengthened modestly, and commodities presented mixed results with gold holding near recent highs while oil retreated.
What does it mean for the Asia Session?
Asian traders face a data-heavy session with Australian employment figures taking center stage early in the day. The potential release of delayed US CPI data adds significant event risk, while Asian markets continue benefiting from optimism over the US shutdown resolution. Key themes include diverging central bank policies (Fed easing versus BoJ tightening considerations), persistent China growth concerns despite policy support, oil market weakness from supply surplus projections, and currency volatility, particularly in JPY and AUD pairs.
The Dollar Index (DXY)
Key news events today
No major news event
What can we expect from DXY today?
Thursday, November 13, 2025, marks a pivotal day for the US dollar with three major catalysts converging: the October CPI inflation report at 8:30 AM ET (expected to show 3.0% headline and core inflation), the likely House vote to end the 43-day government shutdown, and key international economic data from Australia and the UK. The dollar is trading weakly around 99.50-99.60 on the DXY, down significantly over the past year, as markets price in a 68-70% probability of a Federal Reserve rate cut in December.
Central Bank Notes:
- The Federal Open Market Committee (FOMC) voted, by majority, to lower the federal funds rate target range by 25 basis points to 3.75%–4.00% at its October 28–29, 2025, meeting, marking the second consecutive cut following the 25 basis points reduction in September.
- The Committee maintained its long-term objectives of maximum employment and 2% inflation, noting that the labor market continues to soften, with modest job creation and an unemployment rate edging higher. In comparison, inflation remains above target at around 3.0%.
- Policymakers highlighted ongoing downside risks to economic growth, tempered by signs of resilient economic activity. September’s consumer price index (CPI) came in slightly lower than expected at 3.0% year-over-year, easing inflation pressure but still warranting vigilance given tariff-driven price effects.
- Economic activity expanded modestly in the third quarter, with GDP growth estimates around 1.0% annualized; however, uncertainty remains elevated amid persistent global trade tensions and the U.S. government shutdown, which is impacting data availability.
- The updated Summary of Economic Projections reflects an anticipated unemployment rate averaging approximately 4.5% for 2025, with headline and core personal consumption expenditures (PCE) inflation projections holding near 3.0%, indicating a slow easing path ahead.
- The Committee emphasized its flexible, data-dependent approach and underscored that future policy adjustments will be guided by incoming labor market and inflation data. As in prior meetings, there was dissent, including one member advocating a more aggressive 50-basis-point cut.
- The FOMC announced the planned conclusion of its balance sheet reduction (quantitative tightening) program, intending to cease runoff in the near term to maintain market stability, with Treasury redemption caps held steady at $5 billion per month and agency mortgage-backed securities caps at $35 billion.
- The next meeting is scheduled for 9 to 10 December 2025.
Next 24 Hours Bias
Medium Bearish
Gold (XAU)
Key news events today
No major news event
What can we expect from Gold today?
A pivotal day for gold markets, as the October CPI release will likely determine the near-term direction. Gold’s fundamental backdrop remains exceptionally supportive, with mounting expectations of Fed rate cuts (a 64–70% probability for December), unprecedented central bank purchases (634 tonnes year-to-date), and persistent geopolitical uncertainties all underpinning prices. The metal has successfully broken above $4,100 and is now testing resistance at the $4,150–$4,200 range.
Next 24 Hours Bias
Medium Bullish
The Australian Dollar (AUD)
Key news events today
Employment Change (12:30 am GMT)
Unemployment Rate (12:30 am GMT)
What can we expect from AUD today?
The Australian dollar faces a pivotal moment with employment data acting as the key catalyst. The currency is caught between competing forces: a hawkish RBA maintaining restrictive policy to combat sticky inflation, weakening Chinese demand and falling iron ore prices, and mixed signals from US monetary policy and political developments. The labour market report will be crucial in determining whether the RBA’s hawkish hold stance is justified or if softer conditions will force a policy reassessment.
Central Bank Notes:
- The Reserve Bank of Australia held its cash rate steady at 3.60% at the November policy meeting, citing persistent inflationary pressures and lingering uncertainties in both domestic and global outlooks. This is the third consecutive pause following the cut in August.
- Policymakers remain alert to renewed inflation momentum. After a temporary uptick in September’s CPI, trimmed mean inflation for Q3 stands at 3.0%, above the intended 2–3% band. The RBA now anticipates that core inflation will stay above target until at least mid-2026, delaying any hopes of further easing.
- Headline CPI climbed by 3.2% in the year to September 2025, driven by resilient housing (+2.5%) and insurance costs, while discretionary goods inflation is subdued. The transition to monthly CPI reporting from November will improve the accuracy of inflation tracking.
- Domestic demand remains firm, particularly in services and housing, while manufacturing and discretionary retail continue to lag. Household incomes have stabilized, but high borrowing costs and elevated rents are constraining consumption and risking a slowdown in Q1 2026.
- Labor market tightness persists, though job growth has moderated. Underutilization edged higher. Wage growth is plateauing, but weak productivity is keeping unit labor costs elevated—a medium-term risk that remains central to the Board’s narrative.
- The RBA highlights geopolitical tensions and volatile commodity markets as primary global risks, against a backdrop of modest upward revisions to world growth forecasts. The Board stresses that its stance remains “cautious and data-dependent,” with ongoing vigilance on inflation, labor, and spending trends.
- Monetary policy remains mildly restrictive, balancing progress on price stability against vulnerabilities in household demand and global outlook. Board communications reaffirm a dual mandate: price stability and full employment, while underscoring readiness to respond should risks materialize sharply.
- Analysts generally expect the cash rate to remain at current levels through early 2026, with only modest cuts possible later in the year if inflation moderates. The new monthly CPI release (first full edition Nov 2025) will be watched closely for timely signals on price trends.
- The next meeting is on 9 December 2025.
Next 24 Hours Bias
Weak Bullish
The Kiwi Dollar (NZD)
Key news events today
No major news event
What can we expect from NZD today?
The New Zealand Dollar faces a challenging environment heading into Thursday’s trading session on November 13, 2025. The combination of aggressive RBNZ easing, deteriorating domestic labor market conditions, weakening dairy prices, and mixed signals from China creates a predominantly bearish outlook. The currency is testing critical support levels around 0.5600, with the psychological 0.5500 floor representing the next major downside target.
Central Bank Notes:
- The Monetary Policy Committee (MPC) agreed to cut the Official Cash Rate (OCR) by 50 basis points to 2.50% on 8 October 2025, exceeding market expectations for a smaller 25-basis-point reduction and signaling a stronger commitment to reviving growth.
- The decision was reached by consensus, marking a shift from previous split votes, and reflected policymakers’ shared view that sustained economic weakness and persistent disinflationary pressures required a more front-loaded policy response.
- Annual consumer price inflation stood at 2.7% in the June quarter and is seen nearing 3% for the September quarter—above the 2% midpoint but within the 1–3% target range. Despite high near-term readings, the MPC projects inflation will return toward 2% by the first half of 2026 as spare capacity and moderating tradables curb price momentum.
- Policymakers acknowledged that domestic demand remains weak, with household spending, business investment, and construction activity under pressure. While still elevated, services inflation is expected to ease gradually as wage growth slows and unemployment edges higher.
- Financial conditions have eased with expectations as wholesale and retail borrowing rates adjust to lower policy settings. Bank lending data indicate a modest uptick in mortgage approvals, though broader credit demand remains subdued.
- GDP growth stalled in the middle of 2025, with high-frequency indicators showing continued weakness into the third quarter. A combination of elevated costs for essentials and falling savings continues to restrain household consumption, while global trade frictions weigh on business sentiment.
- The MPC noted that global uncertainty—particularly from US trade regulation changes and soft Chinese demand—continues to pose downside risks to export sectors, though these are partly offset by a weaker New Zealand dollar improving competitiveness.
- Subject to data confirming a sustained soft patch in activity and moderating inflation pressures, the MPC signaled further scope to reduce the OCR toward 2.25% at its next meeting on 26 November 2025, consistent with current market and Westpac forecasts.
- The next meeting is on 26 November 2025.
Next 24 Hours Bias
Medium Bearish
The Japanese Yen (JPY)
Key news events today
No major news events
What can we expect from JPY today?
The Japanese yen faces multiple headwinds, including Prime Minister Takaichi’s dovish rhetoric emphasizing close BoJ coordination, the impending large-scale stimulus package urging accommodative monetary policy, and improving global risk sentiment following progress on the US government shutdown. While BoJ’s internal debate suggests conditions for rate hikes are nearly met, political pressure and economic uncertainties are likely to delay any policy tightening. Intervention warnings from Japanese authorities have intensified but lack credibility until USD/JPY approaches 160.00.
Central Bank Notes:
- The Policy Board of the Bank of Japan met on 30–31 October and, by a clear majority vote, decided to maintain its key monetary policy approach for the upcoming period.
- The BOJ will continue to encourage the uncollateralized overnight call rate to remain at around 0.5%, in line with the prior stance.
- The gradual quarterly reduction in monthly outright purchases of Japanese Government Bonds (JGBs) remains intact, with amounts unchanged from the previous schedule. Purchases are set to decrease by about ¥400 billion per quarter through March 2026, shifting to about ¥200 billion per quarter from April to June 2026, and targeting a ¥2 trillion purchase level for Q1 2027. The bank reaffirmed its intention to maintain flexibility, with readiness to respond if market conditions warrant an adjustment.
- Japan’s economy continues to show moderate recovery, primarily led by solid capital expenditures, although export growth and corporate activity remain restrained by external demand uncertainty and the ongoing effects of U.S. trade policies.
- Annual headline inflation (excluding fresh food) accelerated to 2.9% year-on-year in September, marking the first uptick in four months and staying above the BOJ’s 2% target. Broad-based inflation persists, with food and energy cost pressures, but wage growth continues to support household consumption. Input cost pressures from the earlier surge in imports eased slightly.
- Short-term inflation momentum could moderate as food-price hikes ease, though rent, healthcare, and service-sector price increases tied to labor shortages provide support. Firms and households maintain a gradual upward drift in inflation expectations.
- For the near term, BOJ projects growth below trend as external demand stays subdued and corporate investment plans remain cautious. Still, accommodative financial conditions and steady gains in real labor income will underpin domestic consumption.
- Over the medium term, as overseas economies recover and trade conditions normalize, Japan’s growth potential should improve. Persistent labor market tightness, higher wage settlements, and rising medium- to long-term inflation expectations are expected to keep core inflation on a gradual upward trajectory, converging toward the 2% price stability target later in the forecast horizon.
- The next meeting is scheduled for 18 to 19 December 2025.
Next 24 Hours Bias
Medium Bullish
Oil
Key news events today
No major news event
What can we expect from Oil today?
Oil markets are grappling with multiple crosscurrents. Key bearish factors include OPEC’s acknowledgment of Q3 market surplus, expectations of substantial inventory builds through 2026, persistent oversupply from both OPEC+ production increases and non-OPEC growth, and sluggish demand, particularly from China. Supportive elements include US sanctions disrupting Russian oil exports and forcing supply chain adjustments.
Next 24 Hours Bias
Weak Bearish
The post IC Markets – Asia Fundamental Forecast | 13 November 2025 first appeared on IC Markets | Official Blog.