Articles
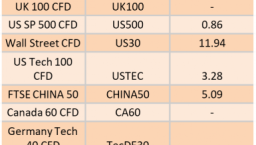
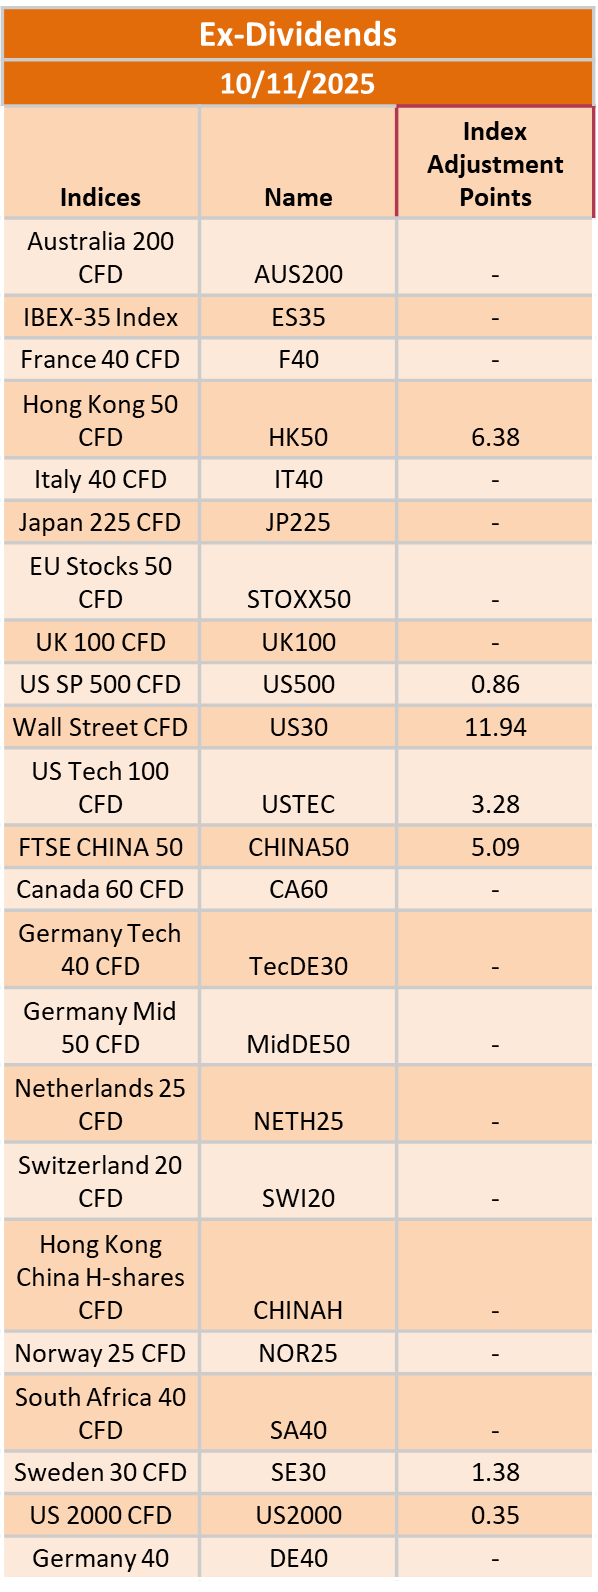
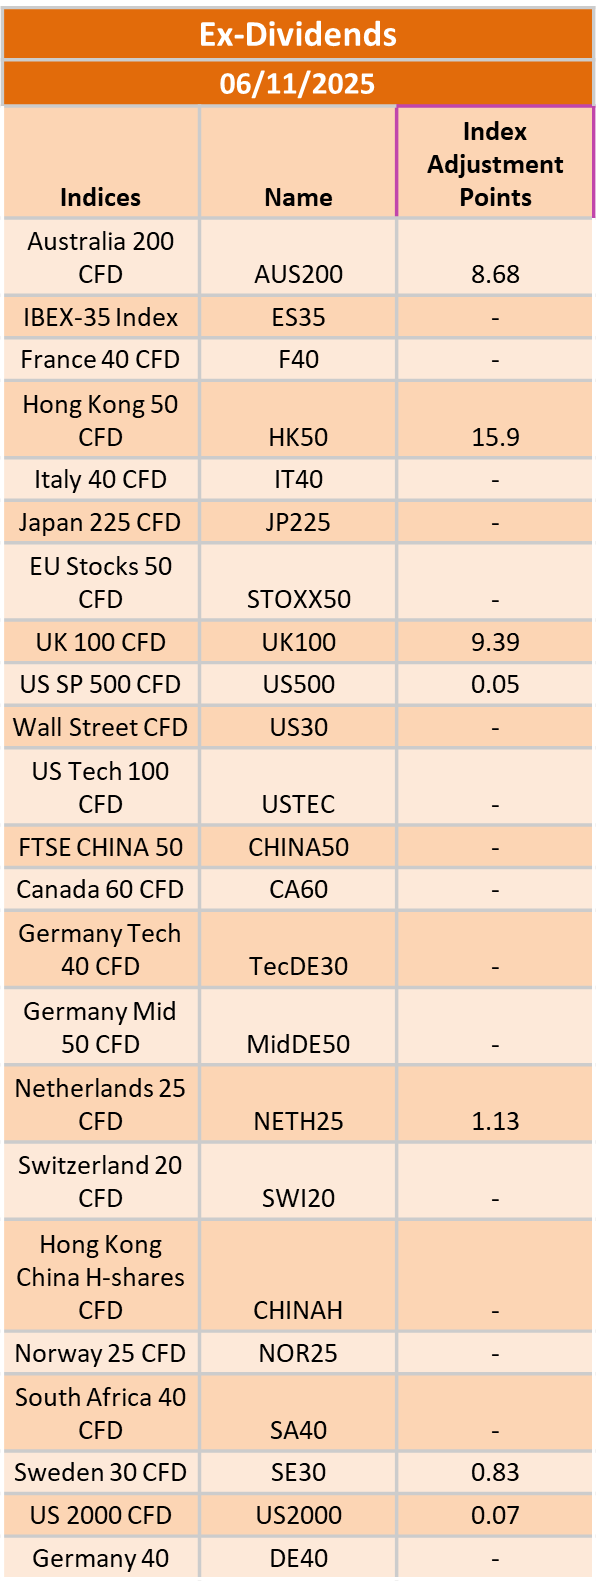
Ex-Dividend 10/11/2025
423252 November 7, 2025 17:39 ICMarkets Market News
The post Ex-Dividend 10/11/2025 first appeared on IC Markets | Official Blog.
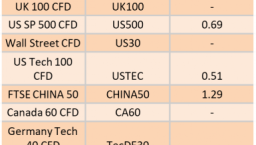
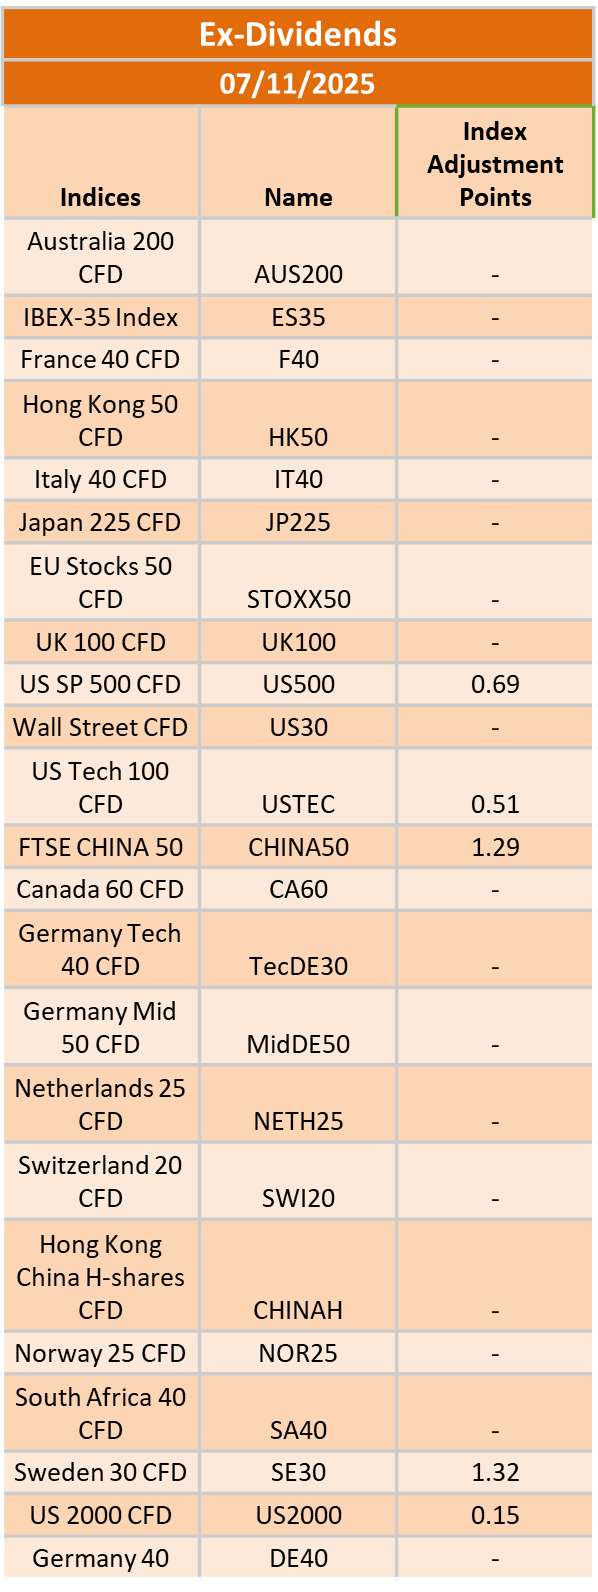
Ex-Dividend 7/11/2025
423250 November 7, 2025 17:39 ICMarkets Market News
The post Ex-Dividend 7/11/2025 first appeared on IC Markets | Official Blog.

General Market Analysis – 7/11/25
423247 November 7, 2025 16:05 ICMarkets Market News
US Stocks Hit Again on Tech Concerns – Nasdaq Down 1.9%
US stocks slumped overnight as renewed concerns over stretched tech and AI valuations, and a sharp rise in layoffs from independent employment data, rattled investors. The Nasdaq led the declines, falling 1.9% to 46,912, while the S&P 500 dropped 1.1% to 6,720 and the Dow Jones shed 0.8% to finish the day at 23,053. Bond markets rallied strongly in the risk-off environment, sending yields sharply lower across the curve. The two-year Treasury yield fell 7.4 basis points to 3.56%, while the ten-year yield dropped 7.6 basis points to 4.08%. The US dollar also weakened, with the DXY index sliding 0.4% to 99.72, as softer sentiment and the ongoing government shutdown continued to weigh. Commodities were relatively steady despite the risk-off tone. Brent crude edged lower by 0.1% to settle around $63.45 a barrel, while WTI slipped 0.15% to $59.51. Gold had another rare quiet day, trading in a relatively tight range and dipping just 0.06% to close at $3,977 per ounce.
Dollar Falls off Multi-Month Highs – DXY Down 0.4%
The dollar took a dip off multi-month highs in trading yesterday as a usually little-followed jobs data update led to significant selling against most of the majors. The lack of official jobs numbers, which would normally have dominated market commentary this week, has led investors to look at other sources, and last night’s Challenger numbers indicated a 153k loss of jobs in October, which, if we’d seen a similar number in NFPs, would have rocked the market. It has to be noted that the ADP data on Wednesday, however, did show an improvement, so it is difficult for traders to put too much store in these data hits, and really, we will have to wait until the shutdown finishes and we see the next NFP data. The DXY peaked at 100.36 on Wednesday, just above the August high and at levels not seen since late May, before pulling back into more familiar ranges. Traders are expecting more volatility in the next few days, and with majors still sitting near sensitive levels, we could yet see the dollar push higher again, especially if sentiment flips again in the coming sessions.
Quiet Calendar Day to End the Trading Week
With official US employment data still unavailable due to the government shutdown, markets face another quiet trading day from a data perspective. However, traders will continue to keep a close eye on geopolitical developments, which are expected to remain a key driver of volatility through the sessions. There is little of note on the calendar during both the Asian and London sessions today; however, we do get some data once New York opens. Initially, attention will turn north of the border to Canadian labour market data, with Employment Change numbers (exp -5.0k) and the Unemployment Rate (exp 7.1%) due out, and traders are expecting plenty of volatility in the loonie around the releases. Later in the day, the University of Michigan’s preliminary consumer sentiment (exp 53.0) and inflation expectations (last 4.6%) will be released. Volatility is likely to remain elevated as markets search for direction in the absence of key US data and amid ongoing global uncertainty.
The post General Market Analysis – 7/11/25 first appeared on IC Markets | Official Blog.
Friday 7th November 2025: Technical Outlook and Review
423234 November 7, 2025 16:00 ICMarkets Market News
DXY (U.S. Dollar Index):
Potential Direction: Bullish
Overall momentum of the chart: Bearish
The price could fall toward the pivot and could make a short-term pullback toward this level before rising again toward the 1st resistance.
Pivot: 99.53
Supporting reasons: Identified as a pullback support that aligns with the 50% Fibonacci retracement, where renewed buying pressure could emerge to push the price higher.
1st support: 99.13
Supporting reasons: Identified as a pullback support, indicating a potential area where the price could again stabilize.
1st resistance: 100.49
Supporting reasons: Identified as an overlap resistance that aligns with the 161.8% Fibonacci extension, indicating a potential area that could halt any further upward movement
EUR/USD:
Potential Direction: Bearish
Overall momentum of the chart: Bearish
The price has already reacted off the pivot and may continue its bearish move toward the 1st support
Pivot: 1.15526
Supporting reasons: Identified as an overlap resistance, where selling pressures could intensify and potentially cap any upward retracement
1st support: 1.1471
Supporting reasons: Identified as a swing low support that aligns with the 127.2% Fibonacci projection, indicating a potential level where the price could stabilize once again.
1st resistance: 1.1603
Supporting reasons: Identified as a pullback resistance, indicating a potential level that could cap further upward movement.
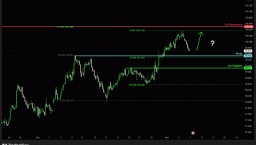
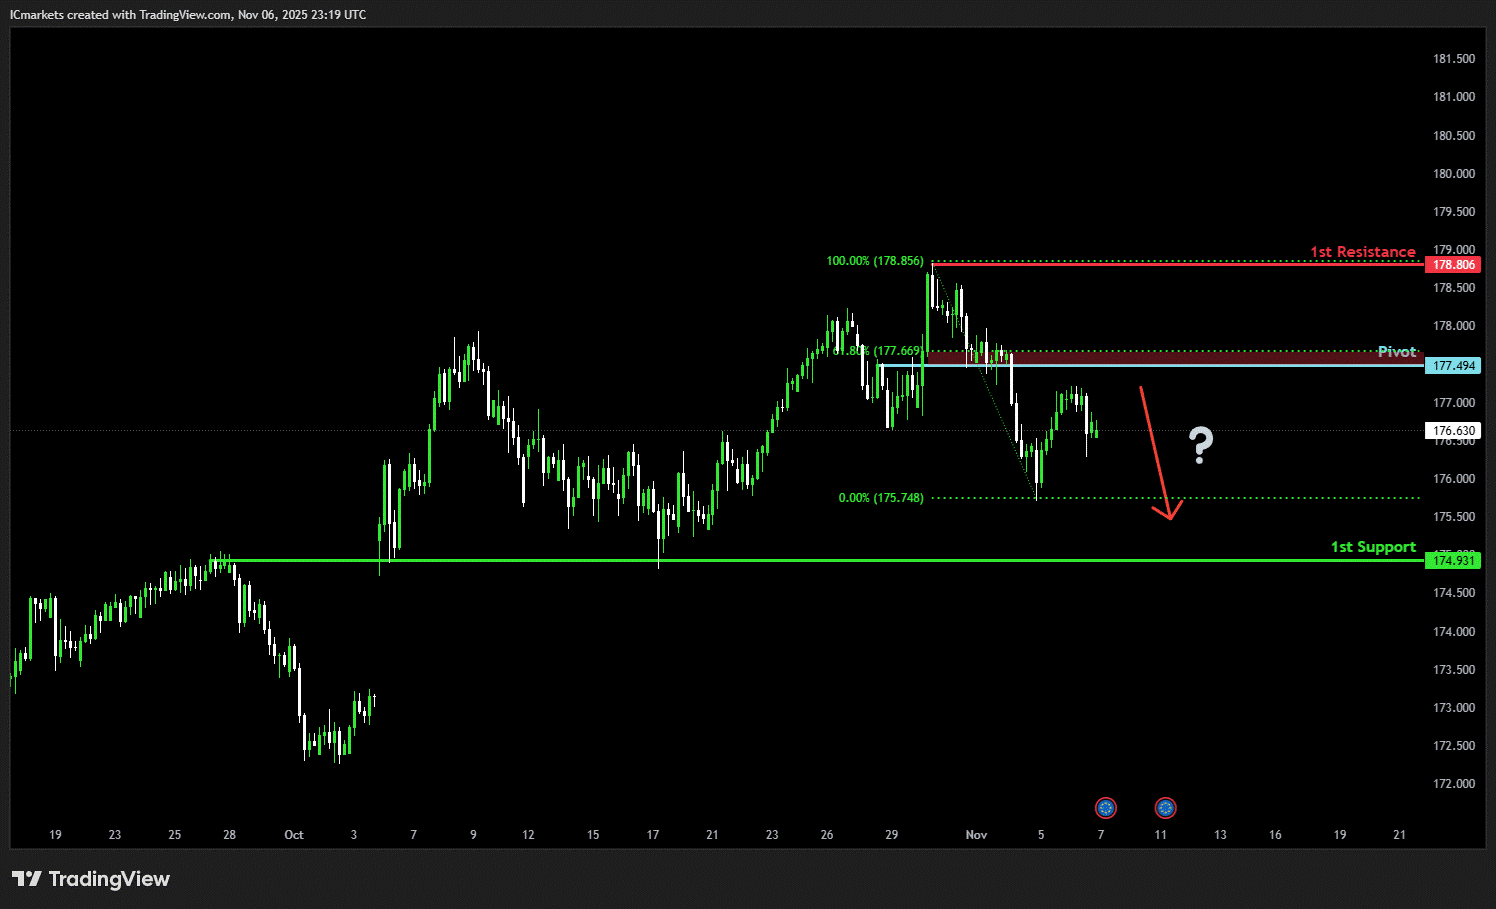
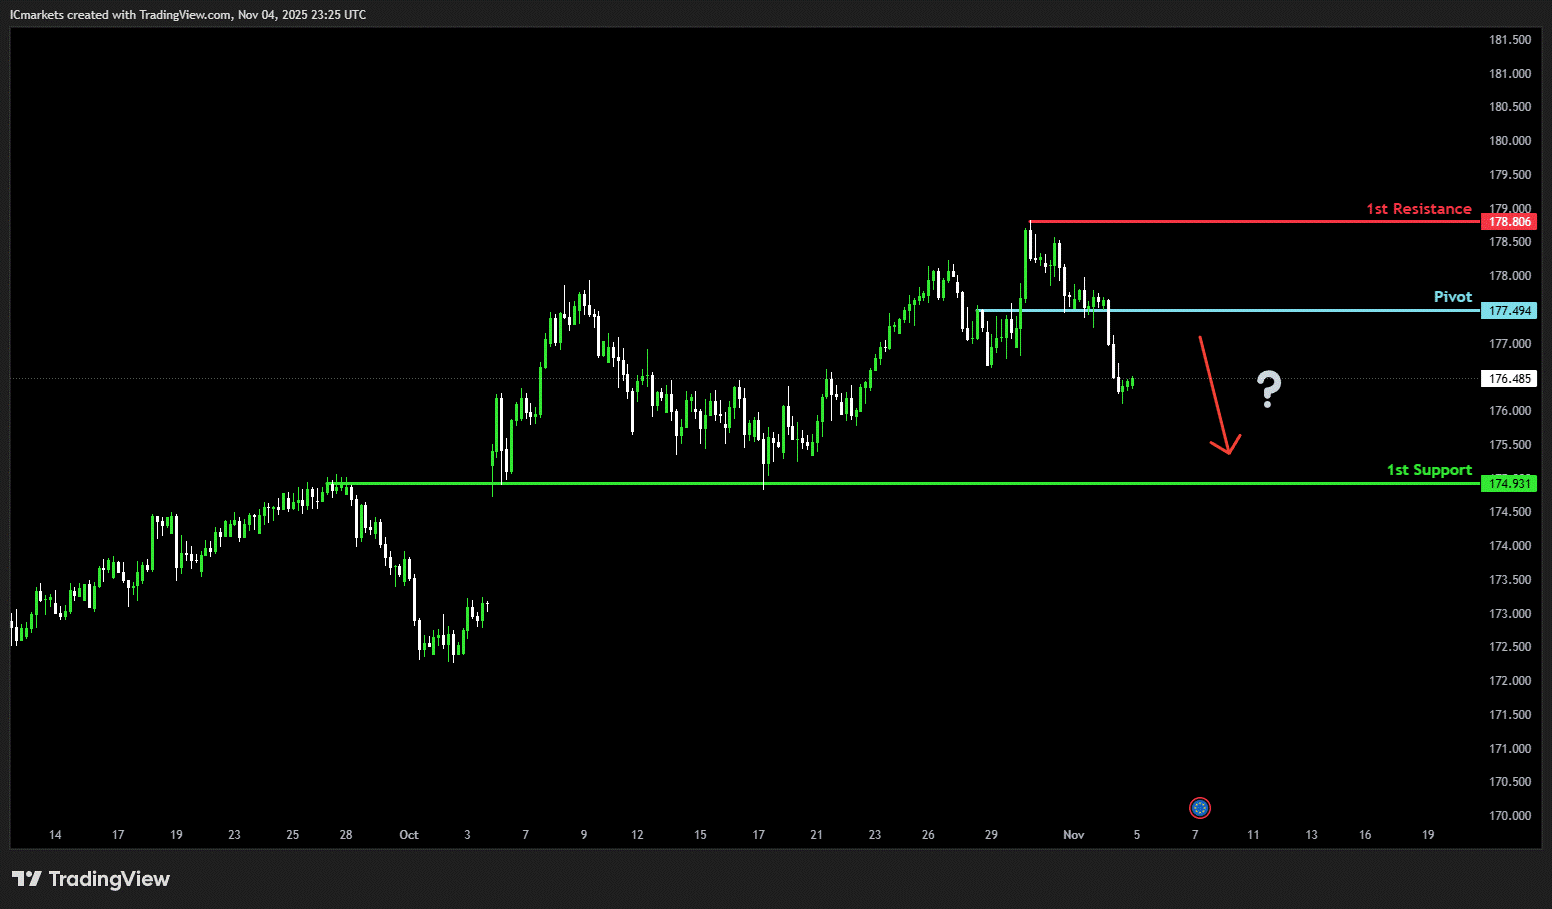
EUR/JPY:
Potential Direction: Bearish
Overall momentum of the chart: Bullish
The price could see a short-term pullback toward the pivot before continuing its bearish move down toward the 1st support.
Pivot: 177.49
Supporting reasons: Identified as a pullback resistance that aligns with the 61.8% Fibonacci retracement, where selling pressures could intensify and potentially cap any upward retracement.
1st support: 174.93
Supporting reasons: Identified as an overlap support, indicating a potential area where the price could again stabilize.
1st resistance: 177.49
Supporting reasons: Identified as a pullback resistance that aligns with the 61.8% Fibonacci retracement, indicating a potential level that could cap further upward movement.
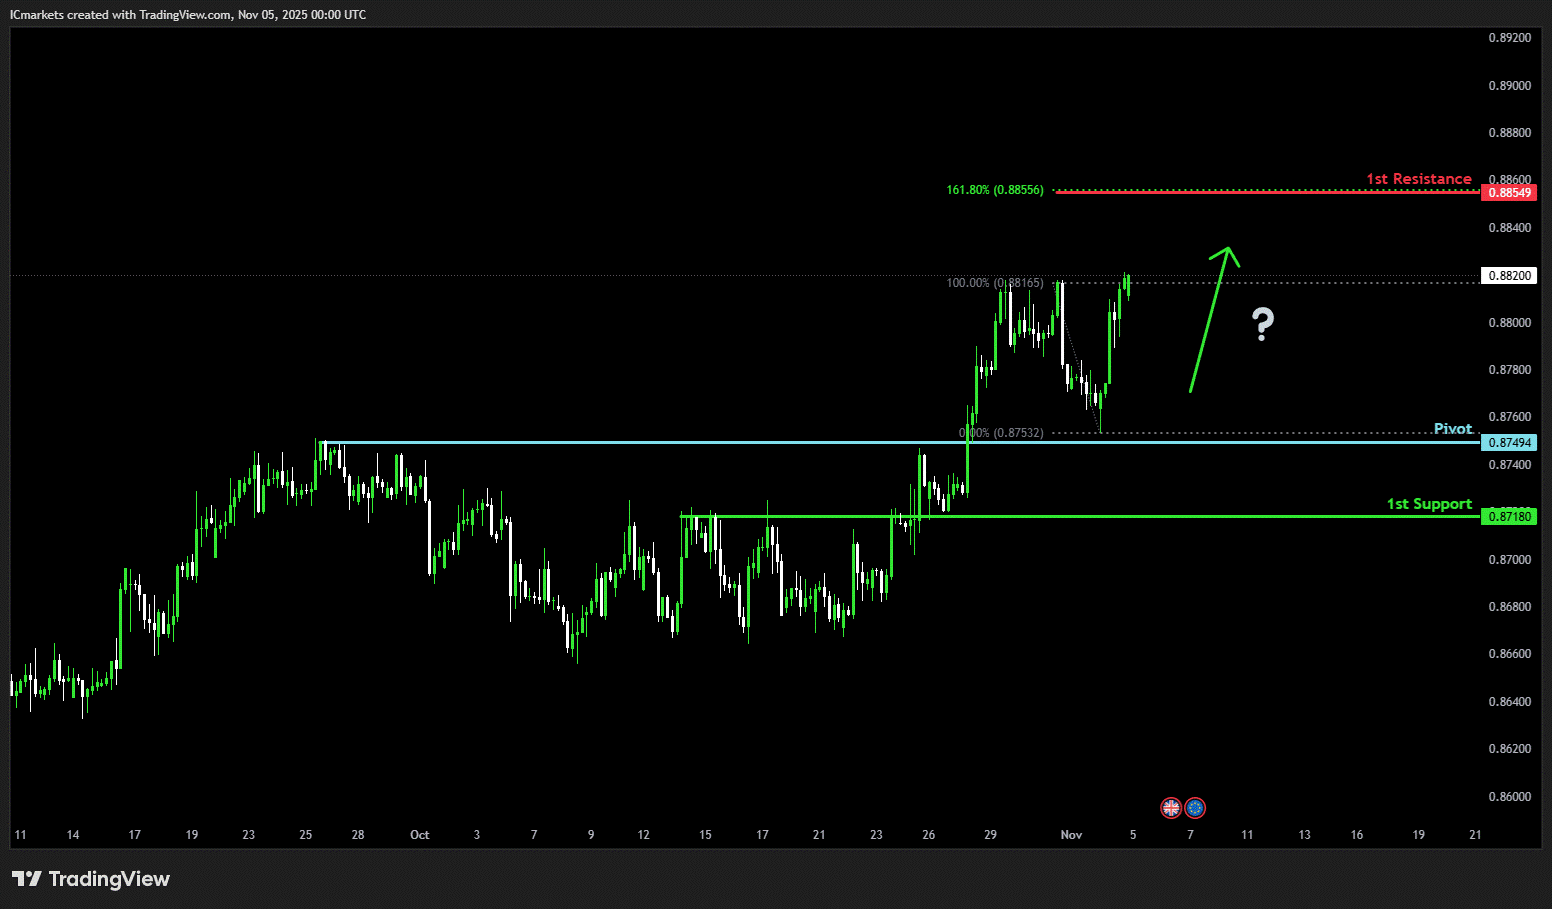
EUR/GBP:
Potential Direction: Bullish
Overall momentum of the chart: Bullish
The price could see a short-term pullback toward the pivot before rising again toward the 1st resistance.
Pivot: 0.8749
Supporting reasons: Identified as a pullback support, where renewed buying pressure could emerge to push the price higher.
1st support: 0.8718
Supporting reasons: Identified as overlap support, indicating a potential area where the price could stabilize once more.
1st resistance: 0.8825
Supporting reasons: Identified as a swing high resistance, indicating a potential level that could cap further upward movement.
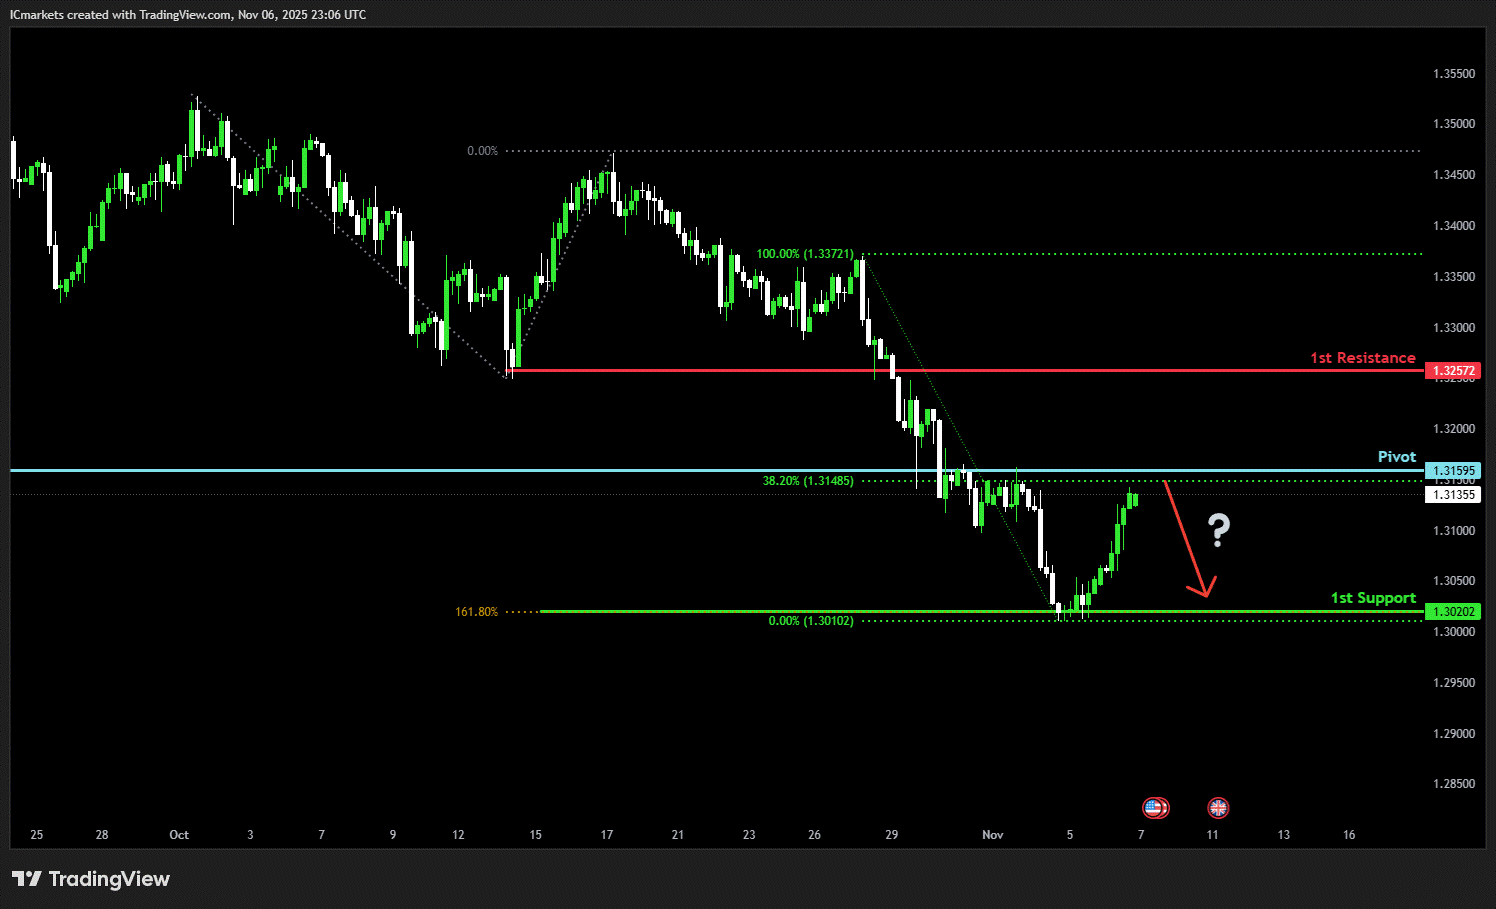
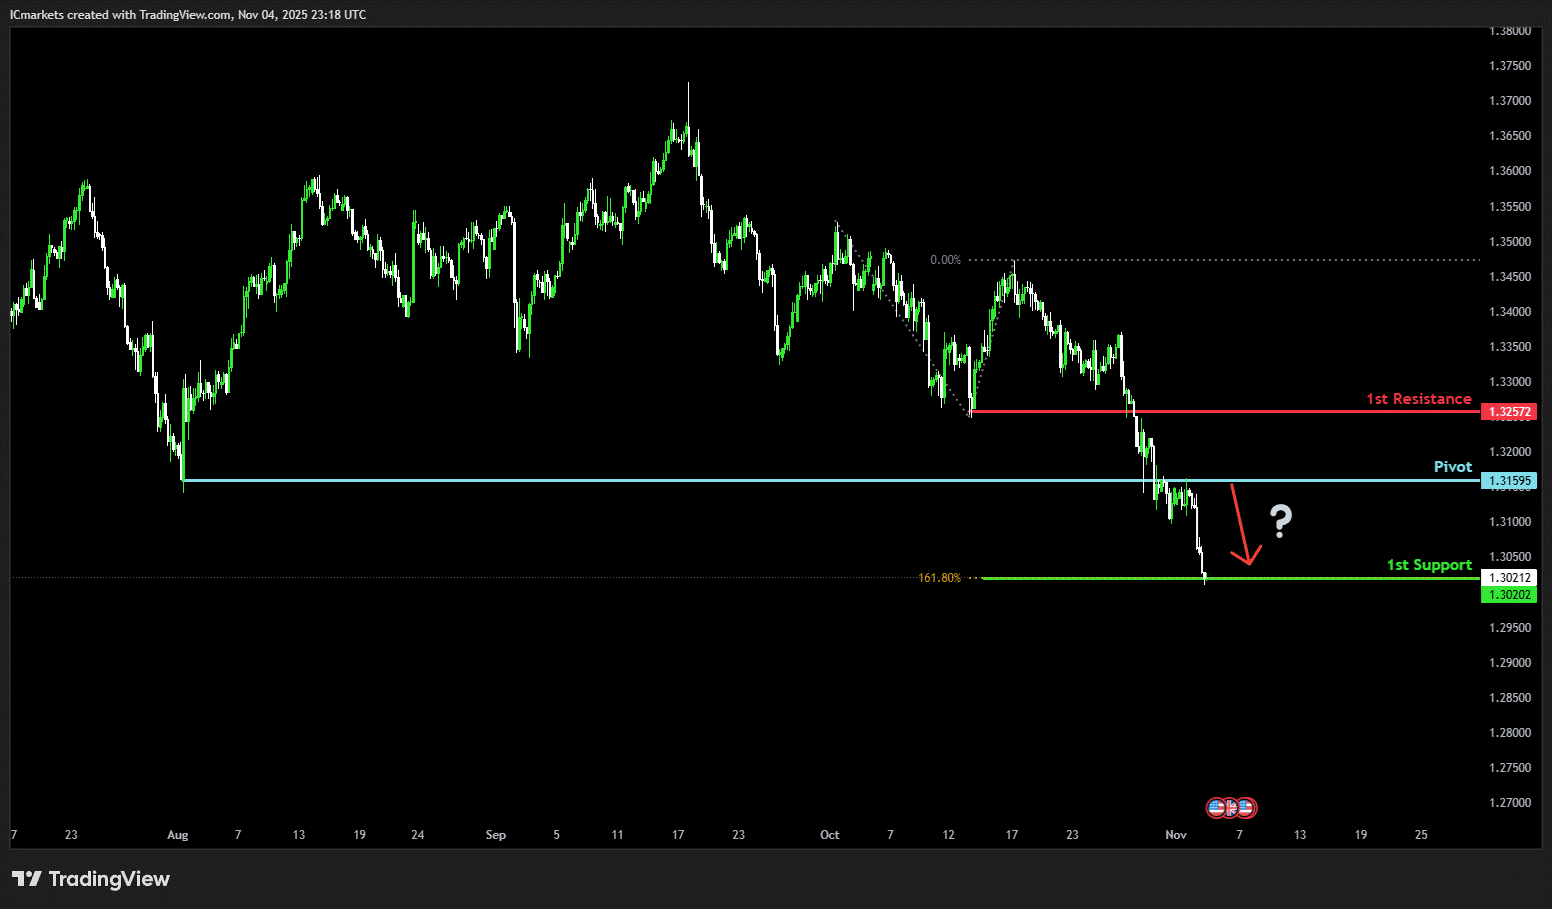
GBP/USD:
Potential Direction: Bearish
Overall momentum of the chart: Bullish
The price could see a short-term pullback toward the pivot before continuing its bearish move down toward the 1st support.
Pivot: 1.3159
Supporting reasons: Identified as an overlap resistance that aligns with the 38.2% Fibonacci retracement, where selling pressures could intensify and potentially cap any upward retracement.
1st support: 1.3020
Supporting reasons: Identified as a support that is supported by the 161.8% Fibonacci extension, indicating a potential area where the price could stabilize once more.
1st resistance: 1.3257
Supporting reasons: Identified as a pullback resistance, indicating a potential level that could halt further upward movement.
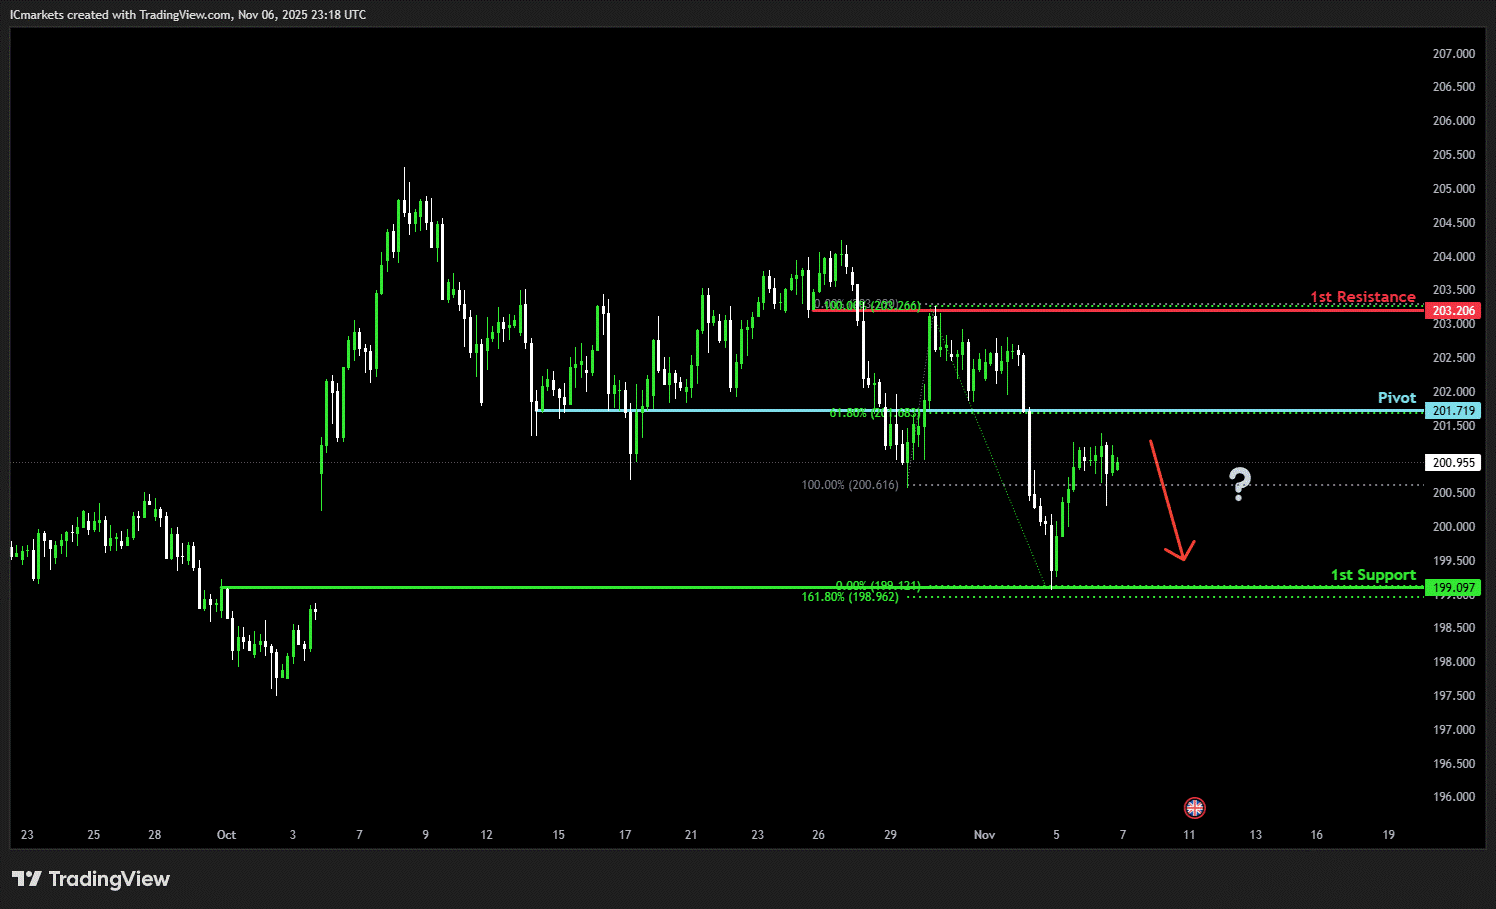
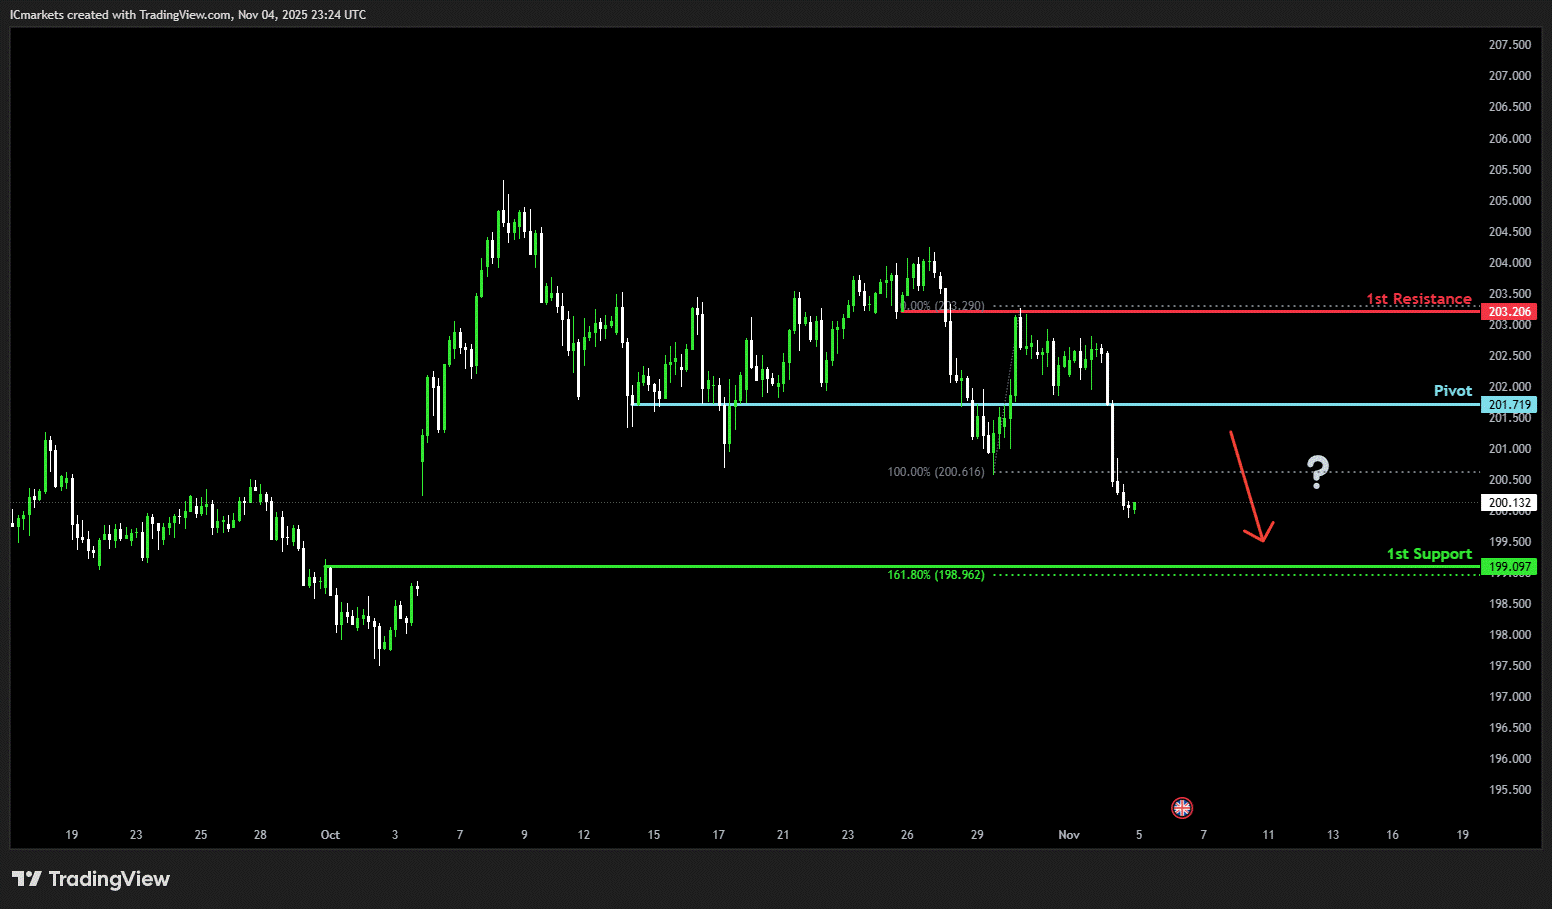
GBP/JPY:
Potential Direction: Bearish
Overall momentum of the chart: Bullish
The price has already reacted off the pivot and may continue its bearish move toward the 1st support
Pivot: 201.71
Supporting reasons: Identified as an overlap resistance that aligns with the 61.8% Fibonacci retracement, where selling pressures could intensify and potentially cap any upward retracement
1st support: 199.09
Supporting reasons: Identified as a pullback support that aligns with the 161.8% Fibonacci retracement, indicating a potential level where the price could stabilize once more.
1st resistance: 203.20
Supporting reasons: Identified as an overlap resistance, indicating a potential level that could halt further upward movement.
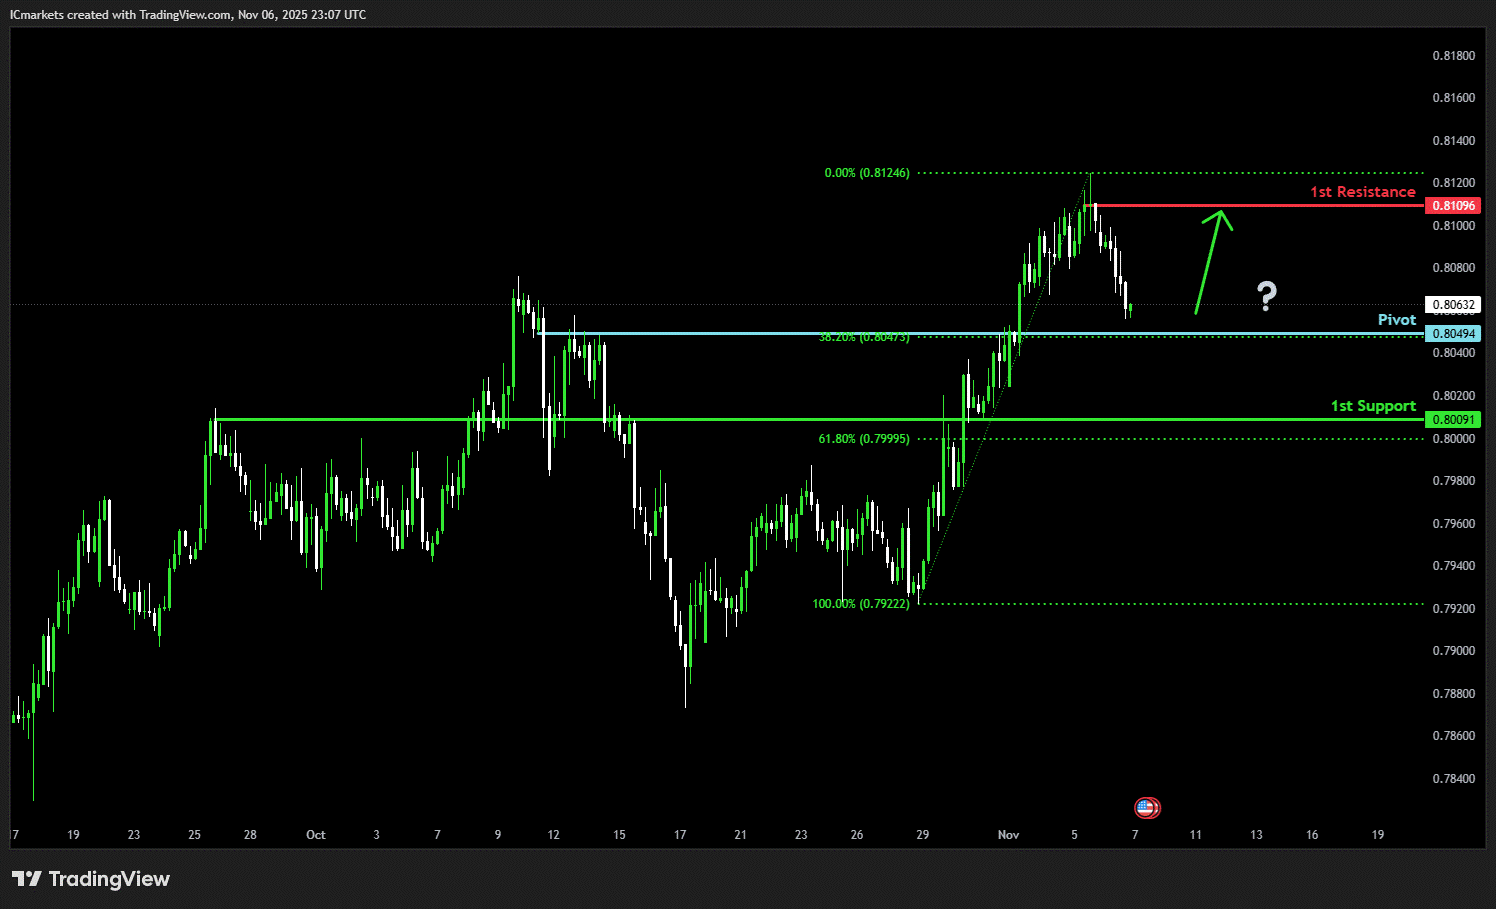
USD/CHF:
Potential Direction: Bullish
Overall momentum of the chart: Bearish
The price could see a short-term pullback toward the pivot before rising again toward the 1st resistance.
Pivot: 0.8049
Supporting reasons: Identified as a pullback support that aligns with the 38.2% Fibonacci retracement, where renewed buying pressure could emerge to push the price higher.
1st support: 0.8009
Supporting reasons: Identified as a pullback support, indicating a potential level where the price could stabilize once again.
1st resistance: 0.8109
Supporting reasons: Identified as a swing high resistance, indicating a potential level that could cap further upward movement.
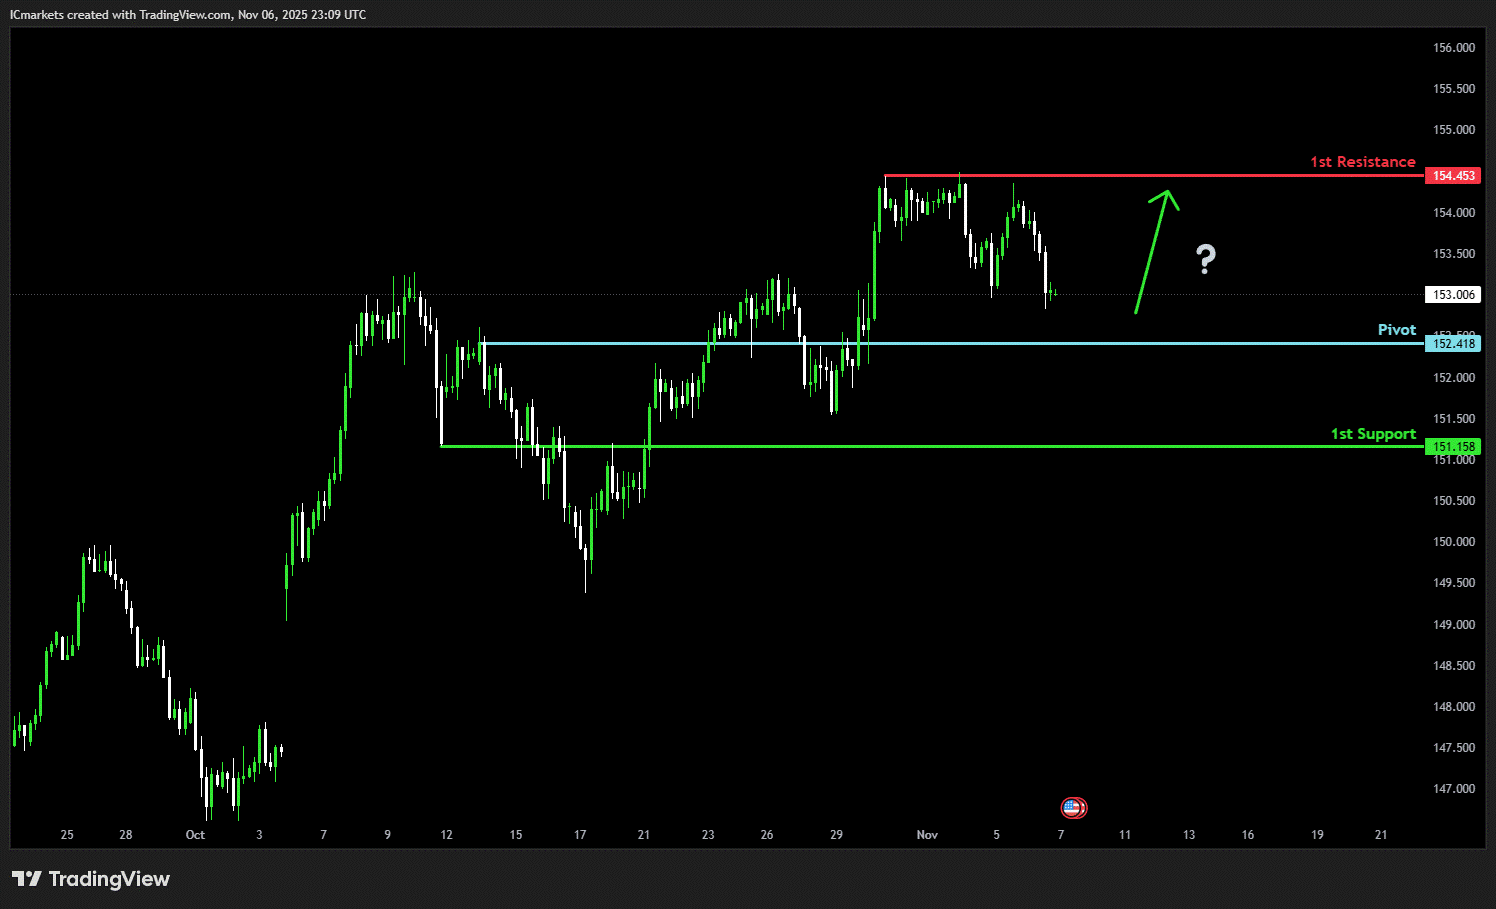
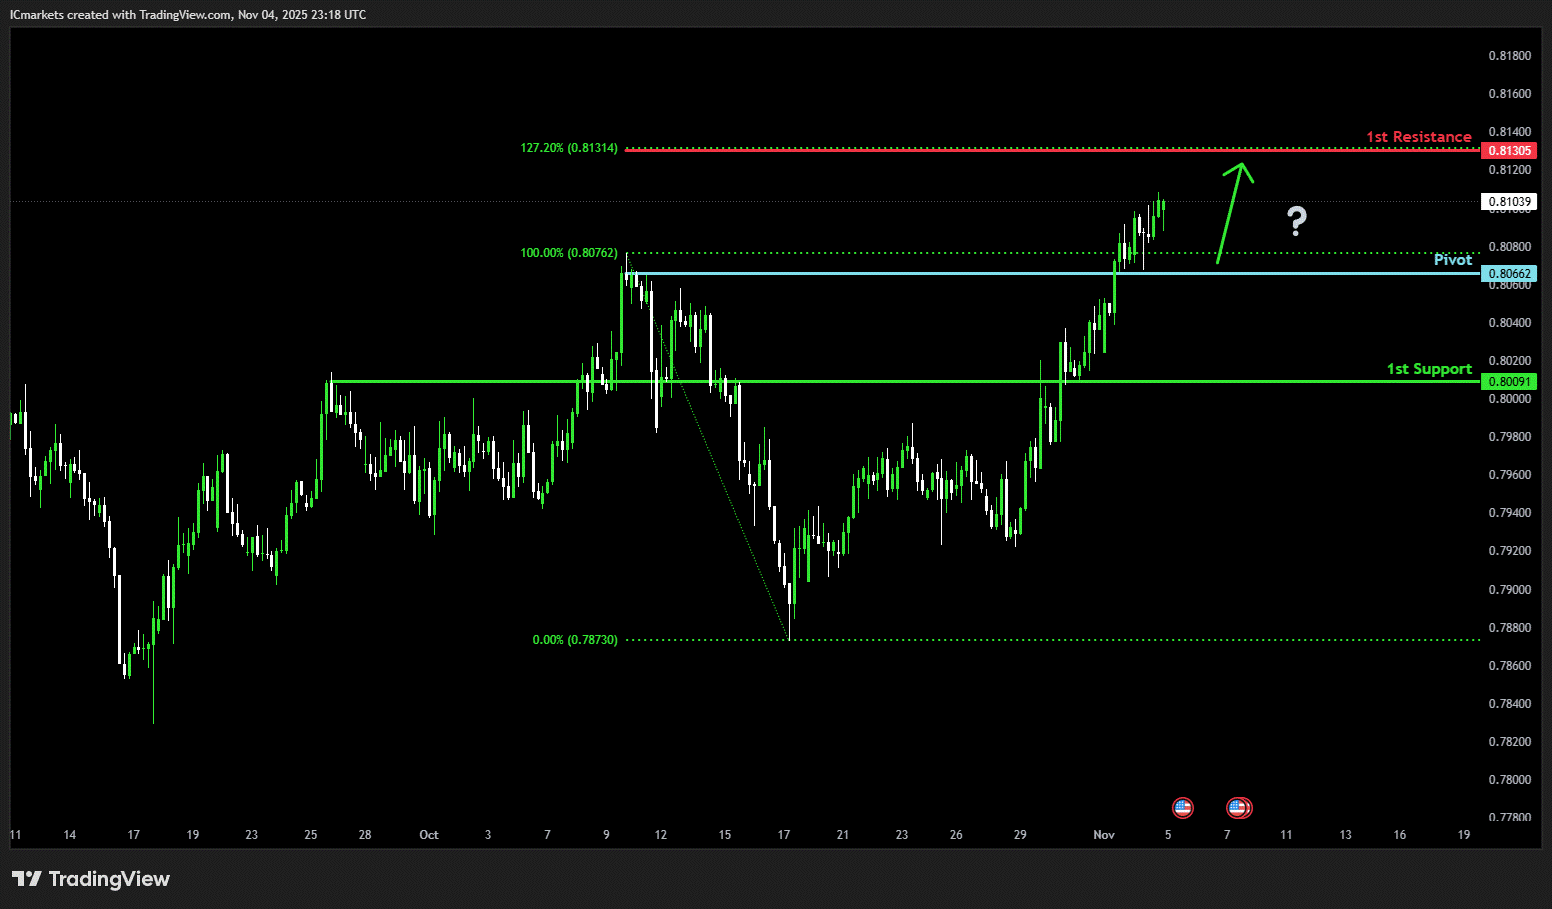
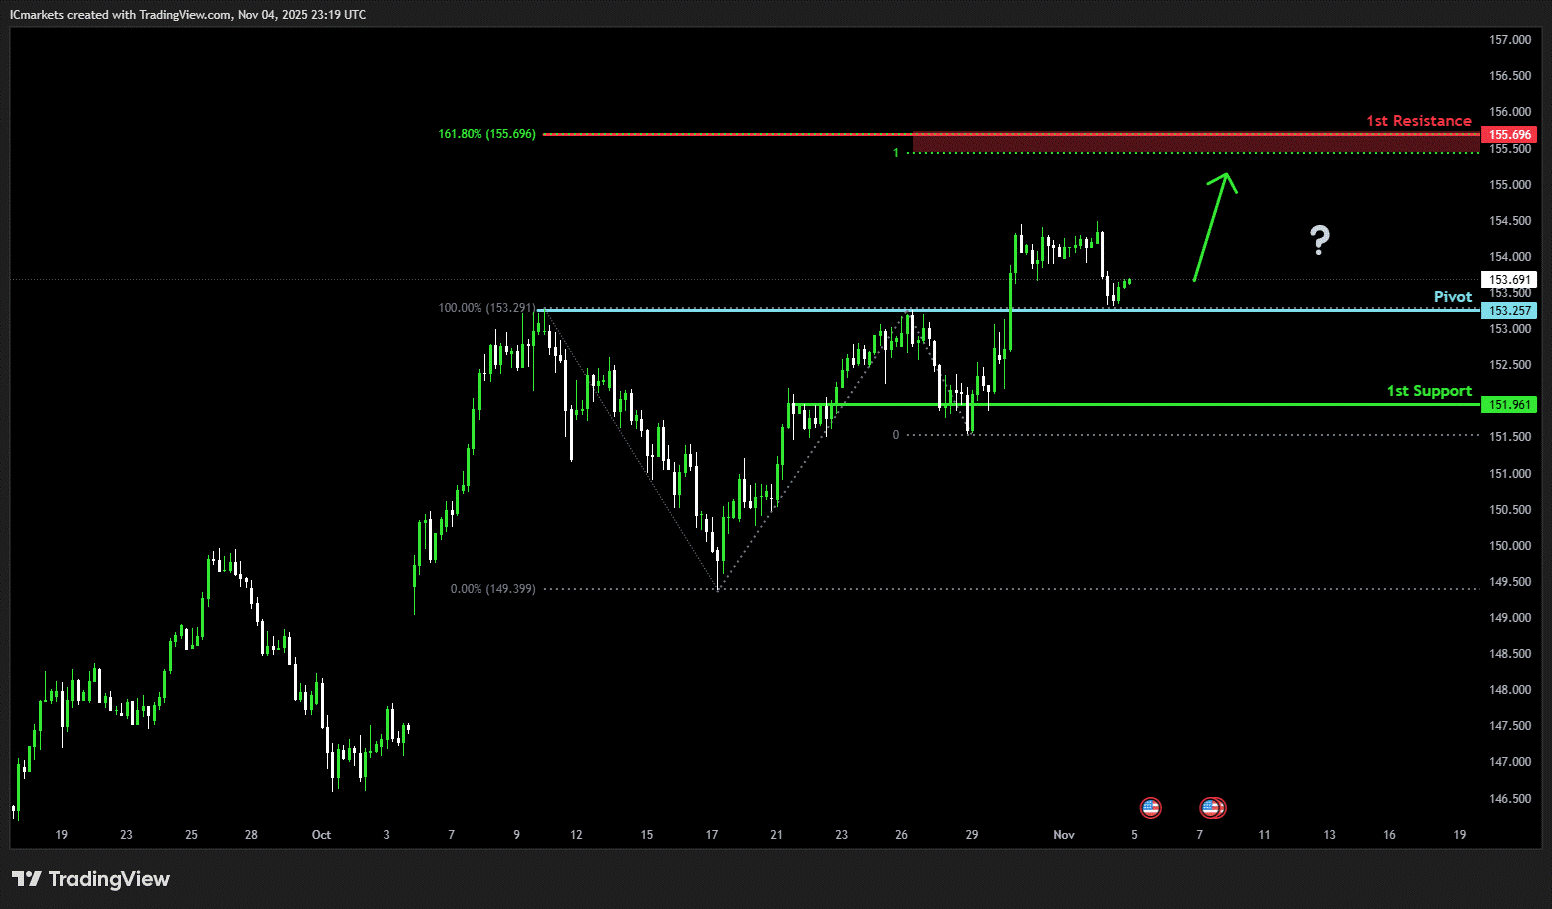
USD/JPY:
Potential Direction: Bullish
Overall momentum of the chart: Bullish
The price could see a short-term pullback toward the pivot before rising again toward the 1st resistance.
Pivot: 152.41
Supporting reasons: Identified as a pullback support, where renewed buying pressure could emerge to push the price higher.
1st support: 151.15
Supporting reasons: Identified as a pullback support, indicating a strong area where buyers might return, and the price could stabilize once again.
1st resistance: 154.45
Supporting reasons: Identified as a swing high resistance. This level represents the next key area where upward movement could be capped amid increased selling pressure
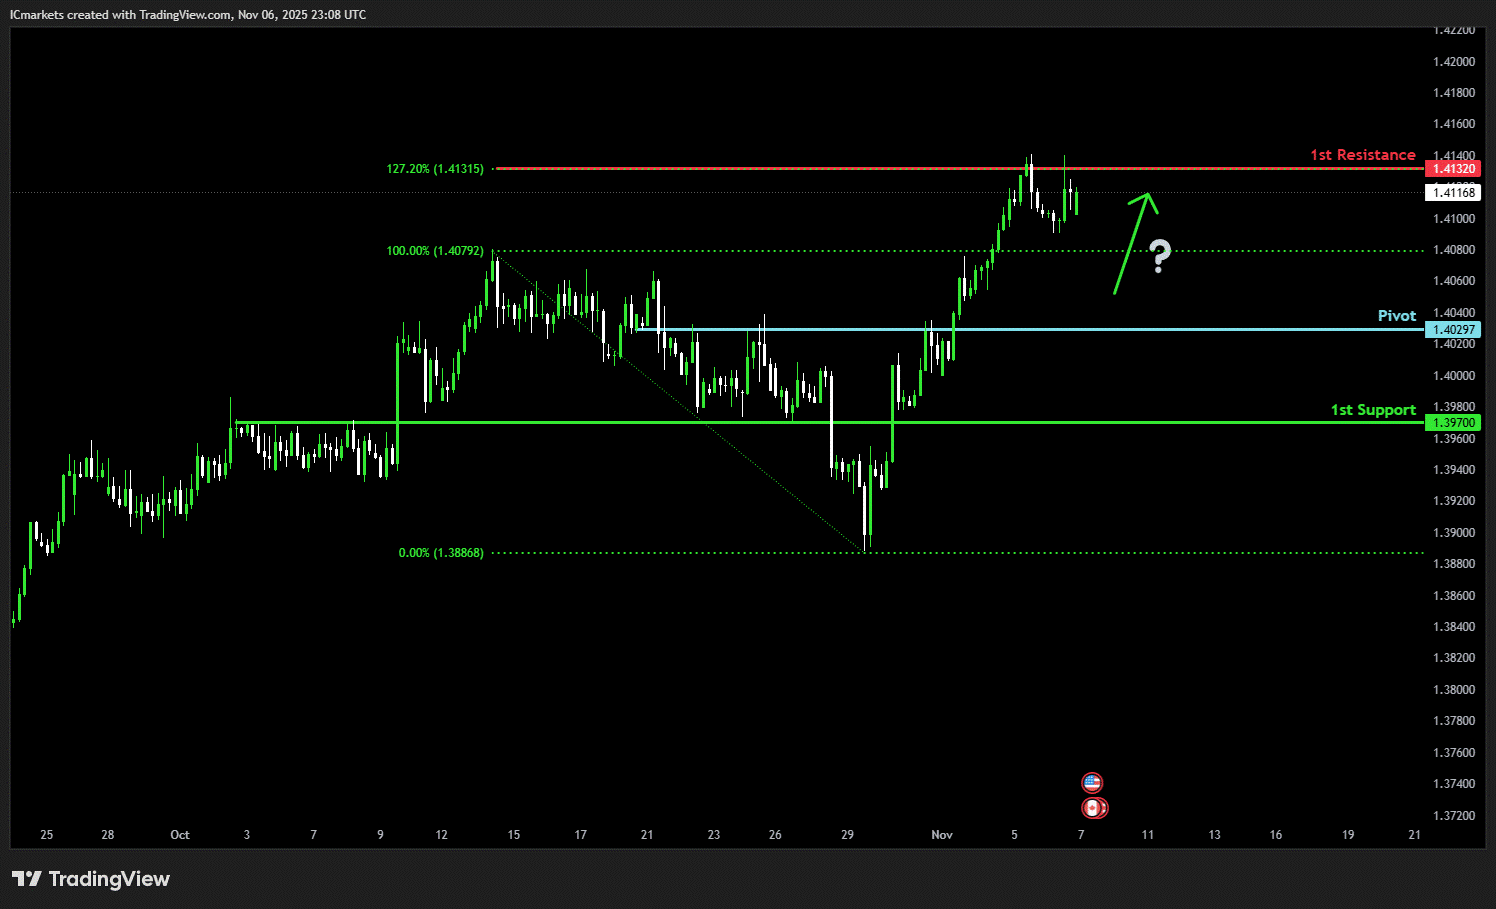
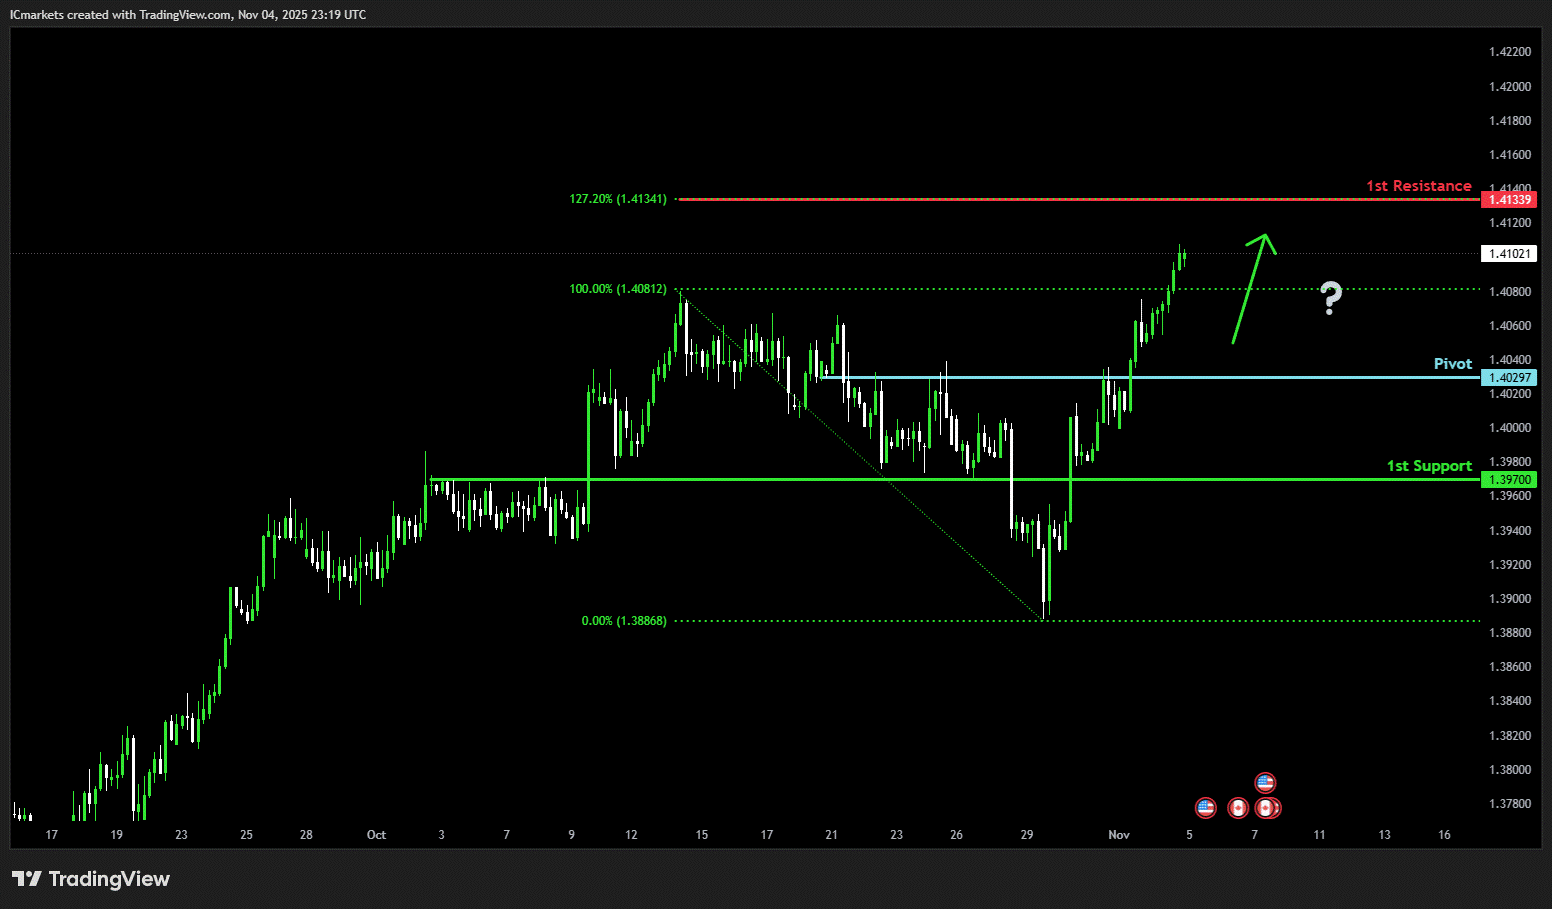
USD/CAD:
Potential Direction: Bullish
Overall momentum of the chart: Bearish
The price could see a short-term pullback toward the pivot before rising again toward the 1st resistance.
Pivot: 1.4029
Supporting reasons: Identified as a pullback support, where renewed buying pressure could emerge to push the price higher.
1st support: 1.3970
Supporting reasons: Identified as a pullback support, indicating a key level where the price could stabilize once more.
1st resistance: 1.4132
Supporting reasons: Identified as a swing high resistance that aligns with the 127.2% Fibonacci extension, making it a possible target for bullish advances and a level where some sellers could return to cap gains
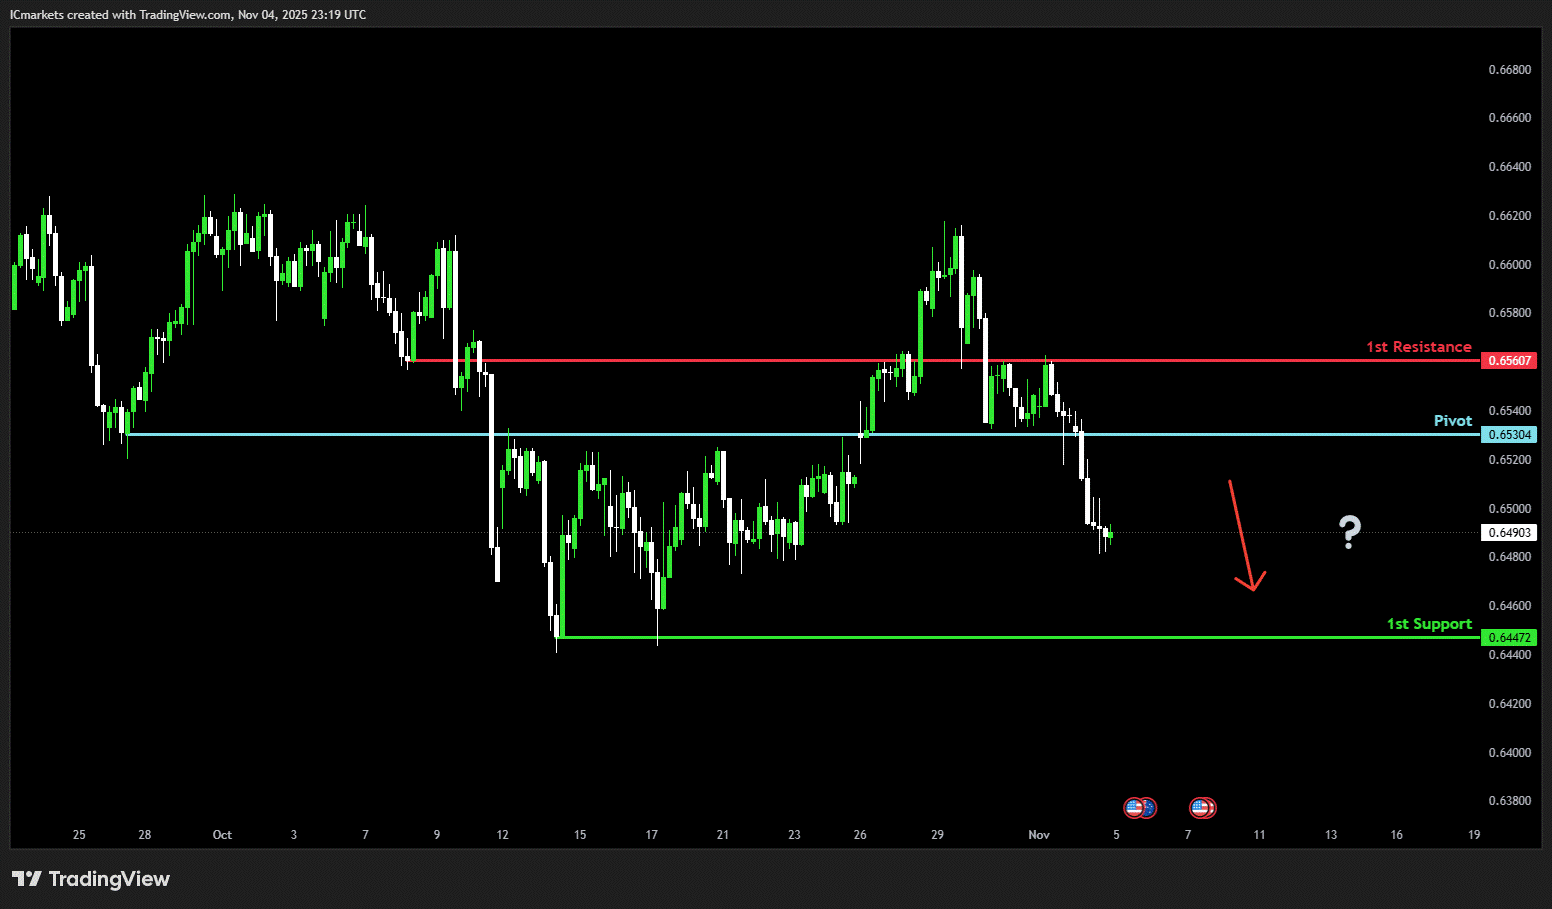
AUD/USD:
Potential Direction: Bearish
Overall momentum of the chart: Bullish
The price could see a short-term pullback toward the pivot before continuing its bearish move down toward the 1st support.
Pivot: 0.6530
Supporting reasons: Identified as a pullback resistance, where selling pressures could intensify and potentially cap any upward retracement..
1st support: 0.6447
Supporting reasons: Identified as a swing low support, this area has provided strong support historically and may attract buying interest for a potential short-term bounce
1st resistance: 0.6560
Supporting reasons: Identified as an overlap resistance, indicating a potential area that could halt any further upward movement.
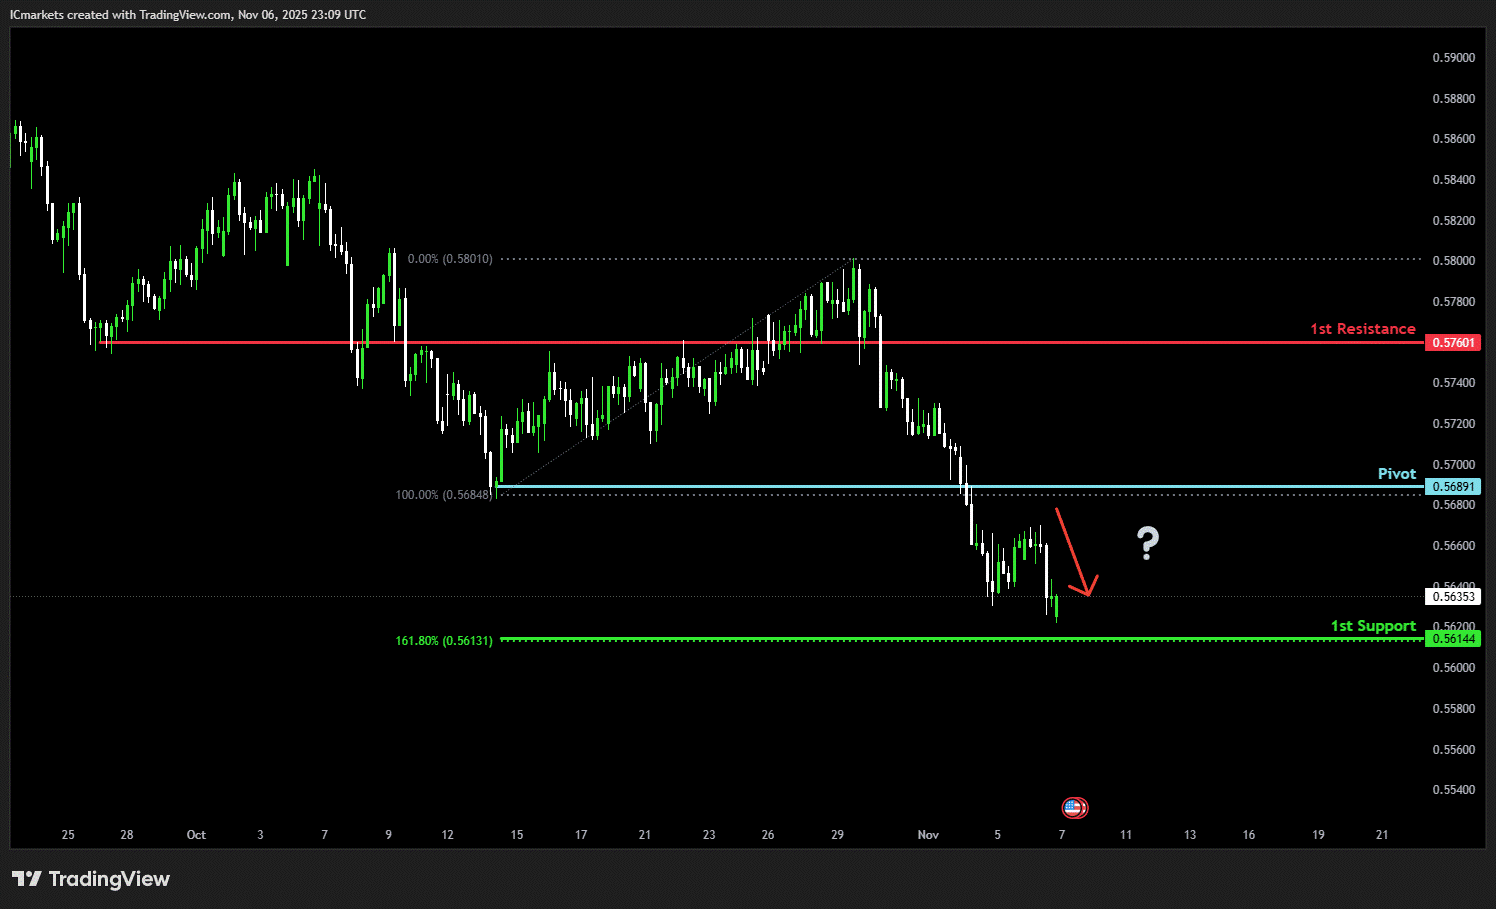
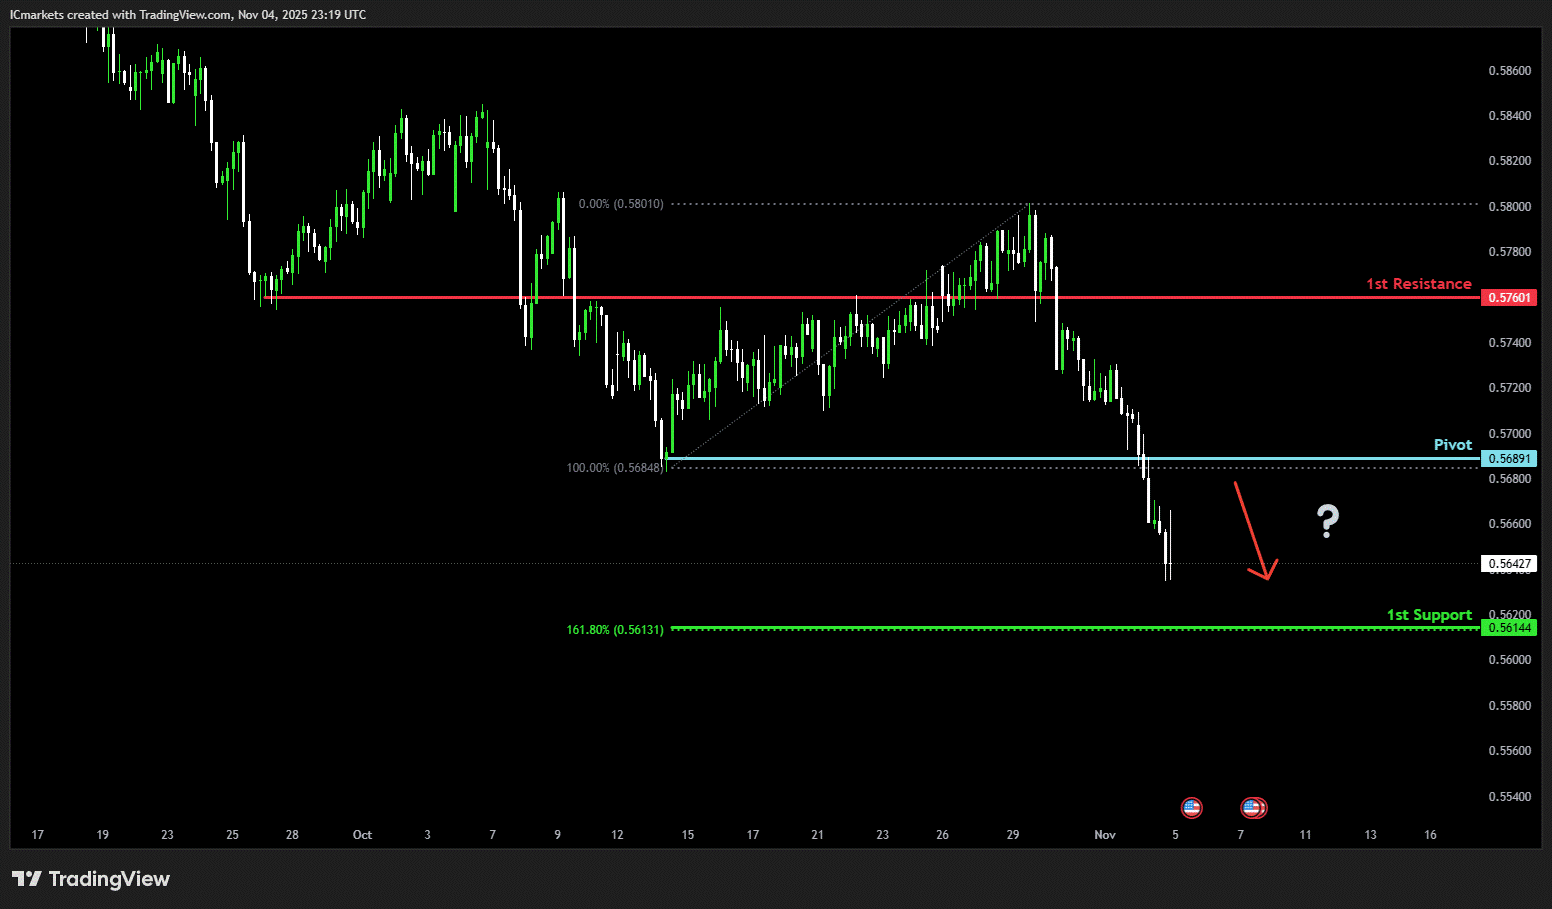
NZD/USD
Potential Direction: Bearish
Overall momentum of the chart: Bullish
The price could see a short-term pullback toward the pivot before continuing its bearish move down toward the 1st support.
Pivot: 0.5689
Supporting reasons: Identified as a pullback resistance, where selling pressures could intensify and potentially cap any upward retracement.
1st support: 0.5614
Supporting reasons: Identified as a support that is supported by the 161.8% Fibonacci extension, this area has provided strong support historically and may attract buying interest for a potential short-term bounce
1st resistance: 0.5760
Supporting reasons: Identified as a pullback resistance, indicating a potential area that could halt any further upward movement.
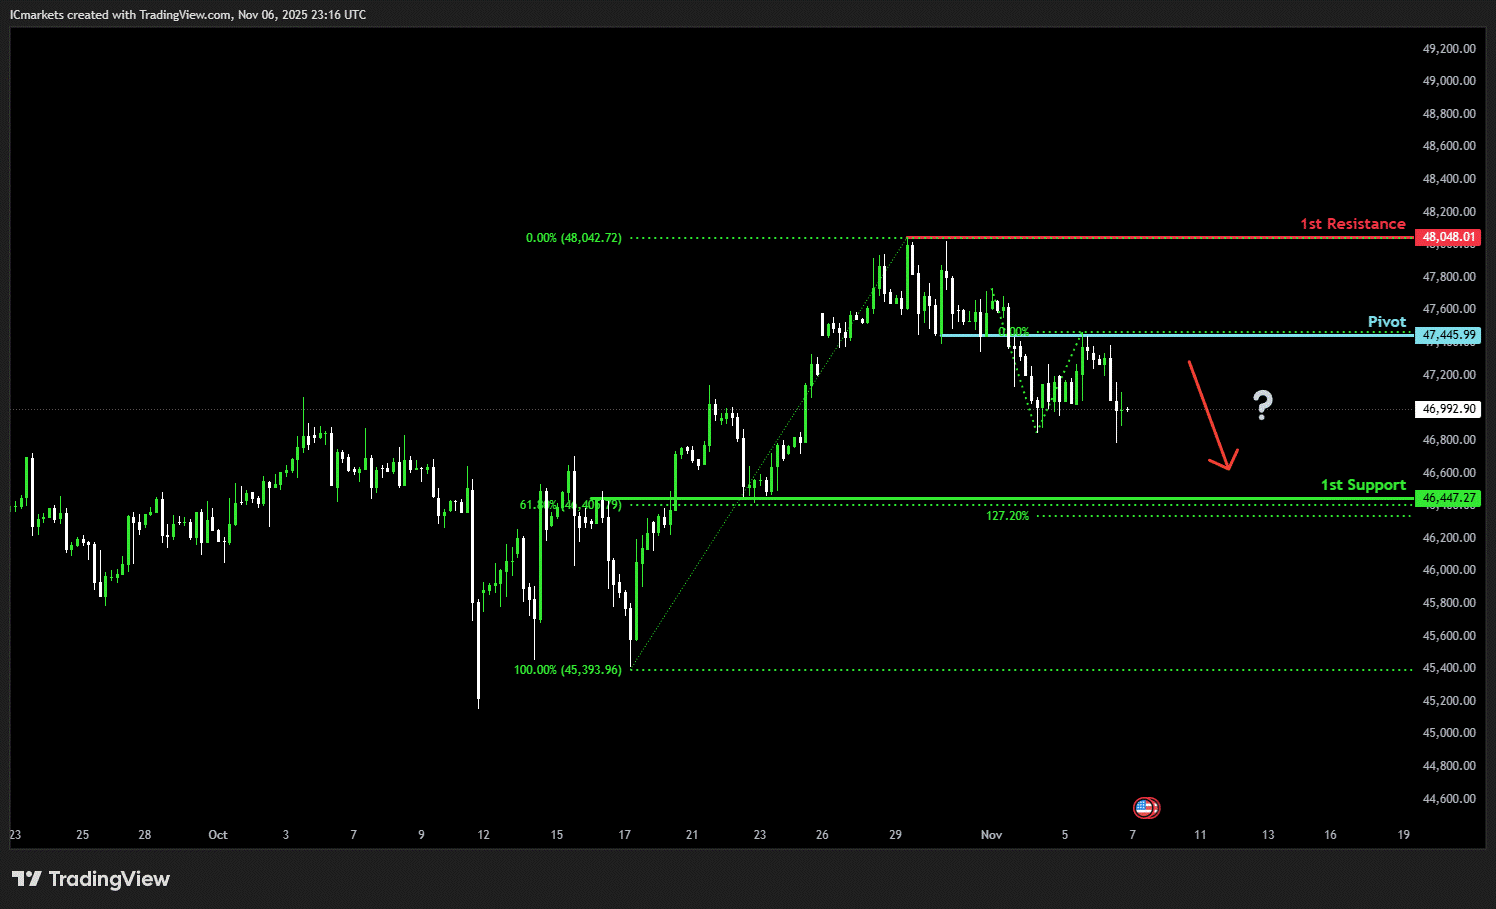
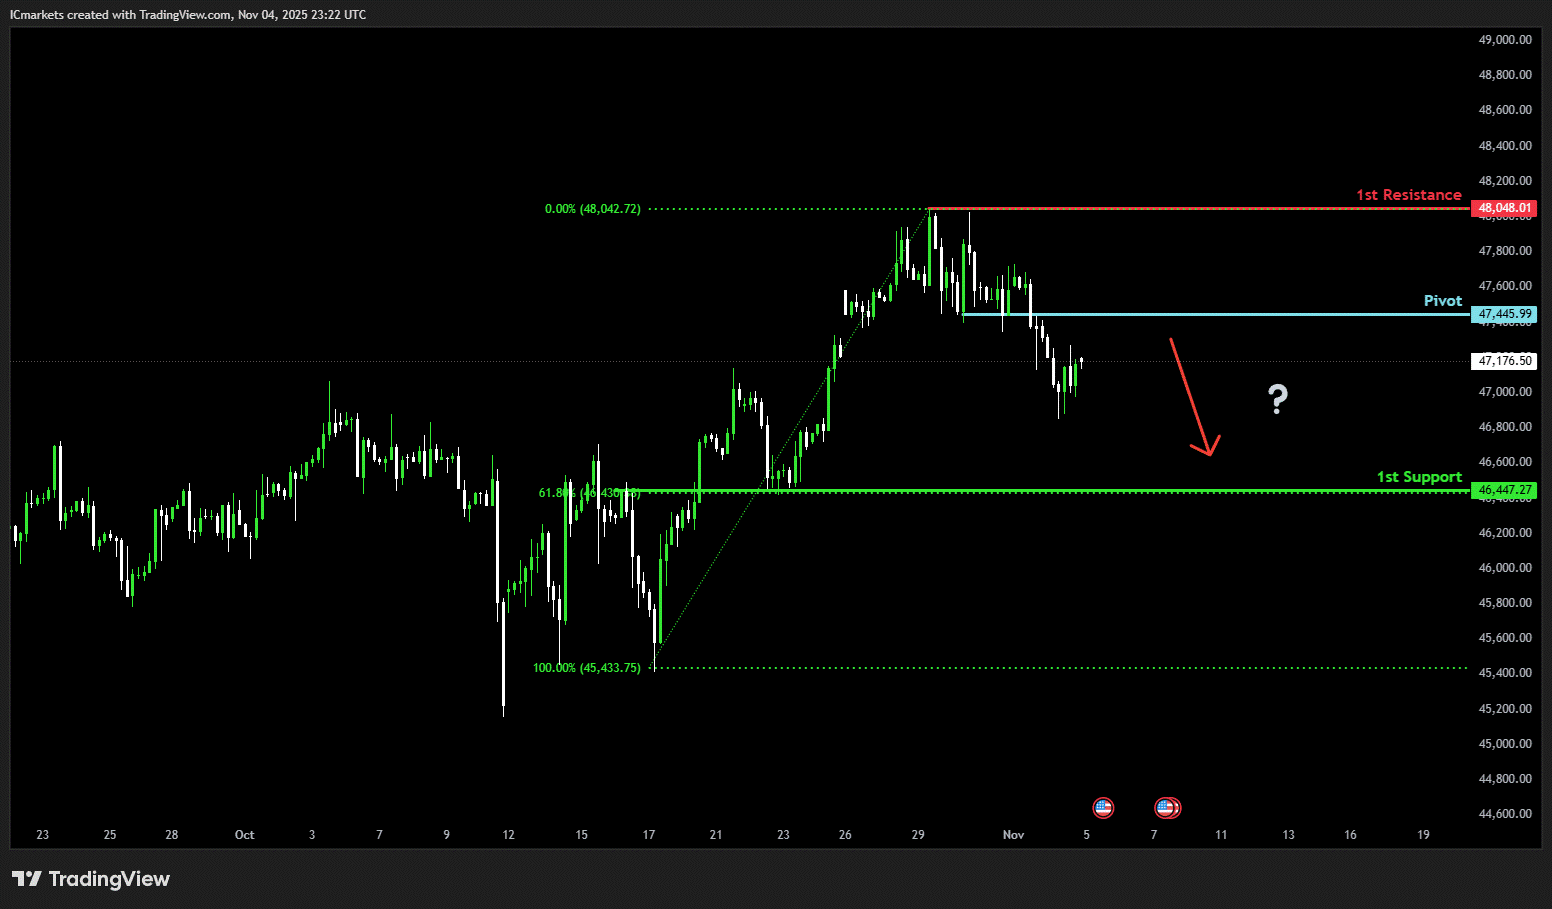
US30 (DJIA):
Potential Direction: Bullish
Overall momentum of the chart: Bullish
The price has already reacted off the pivot and may continue its bearish move toward the 1st support
Pivot: 47,445.99
Supporting reasons: Identified as an overlap resistance that aligns with the 61.8% Fibonacci retracement, where selling pressures could intensify and potentially cap any upward retracement
1st support: 46,447.27
Supporting reasons: Identified as a pullback support that aligns with the 61.8% Fibonacci retracement, suggesting a potential area where the price could stabilize once again.
1st resistance: 48,048.01
Supporting reasons: Identified as a swing high resistance, indicating a potential area that could halt any further upward movement.
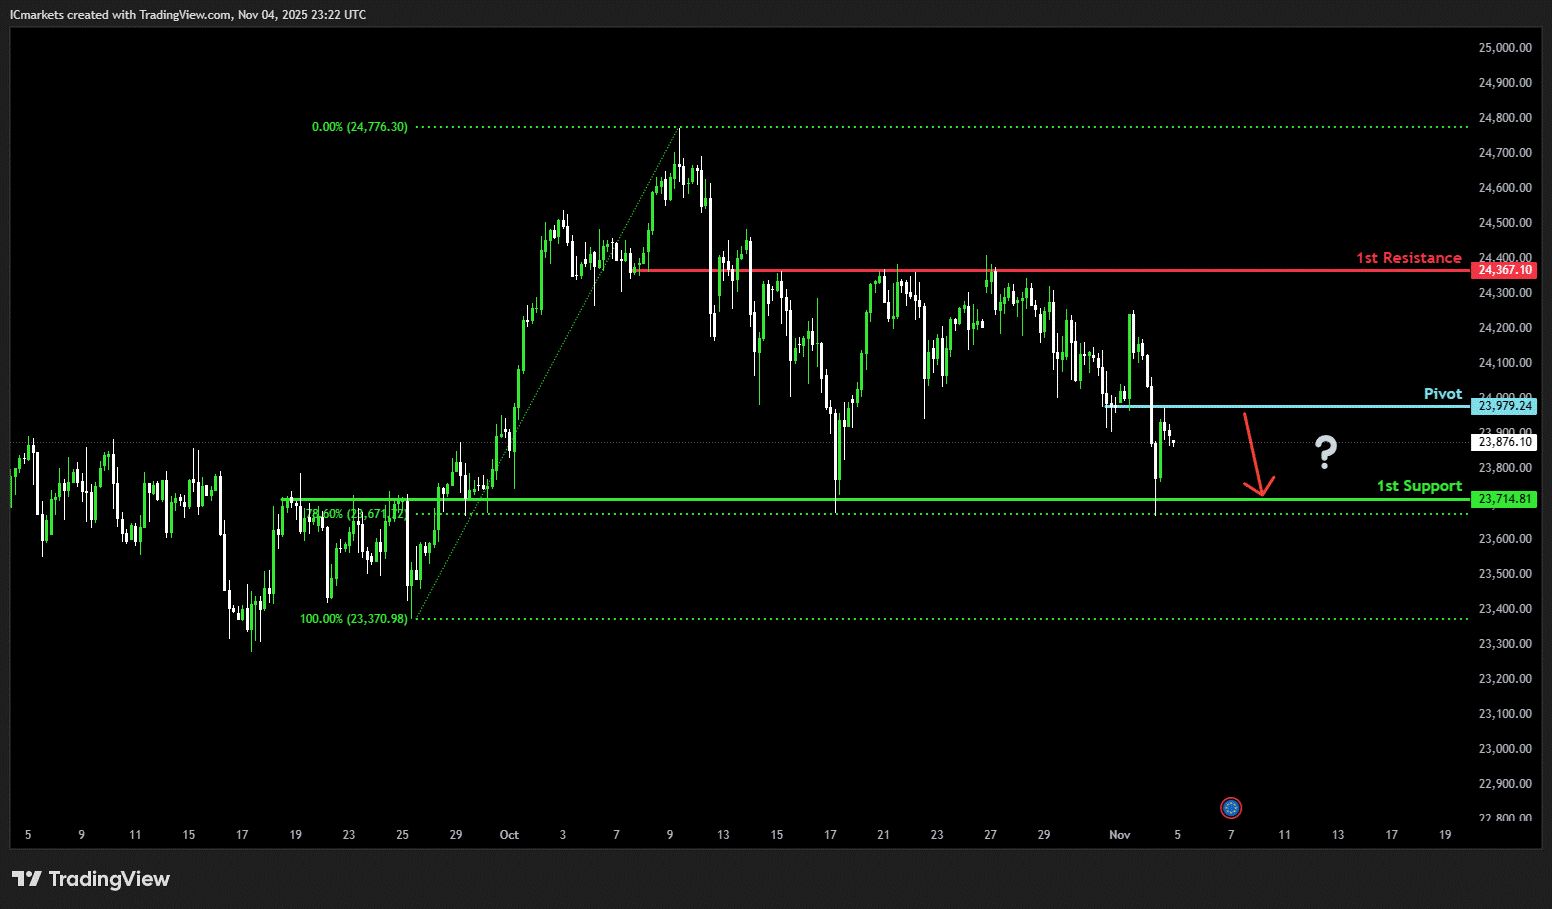
DE40 (DAX):
Potential Direction: Bearish
Overall momentum of the chart: Bullish
The price could see a short-term pullback toward the pivot before continuing its bearish move down toward the 1st support.
Pivot: 23,958.20
Supporting reasons: Identified as a pullback resistance, where selling pressures could intensify and potentially cap any upward retracement.
1st support: 23,434.30
Supporting reasons: Identified as a swing low support that aligns with the 127.2% Fibonacci extension, indicating a key level where the price could stabilize once more.
1st resistance: 24,218.20
Supporting reasons: Identified as an overlap resistance, indicating a potential area that could halt any further upward movement.
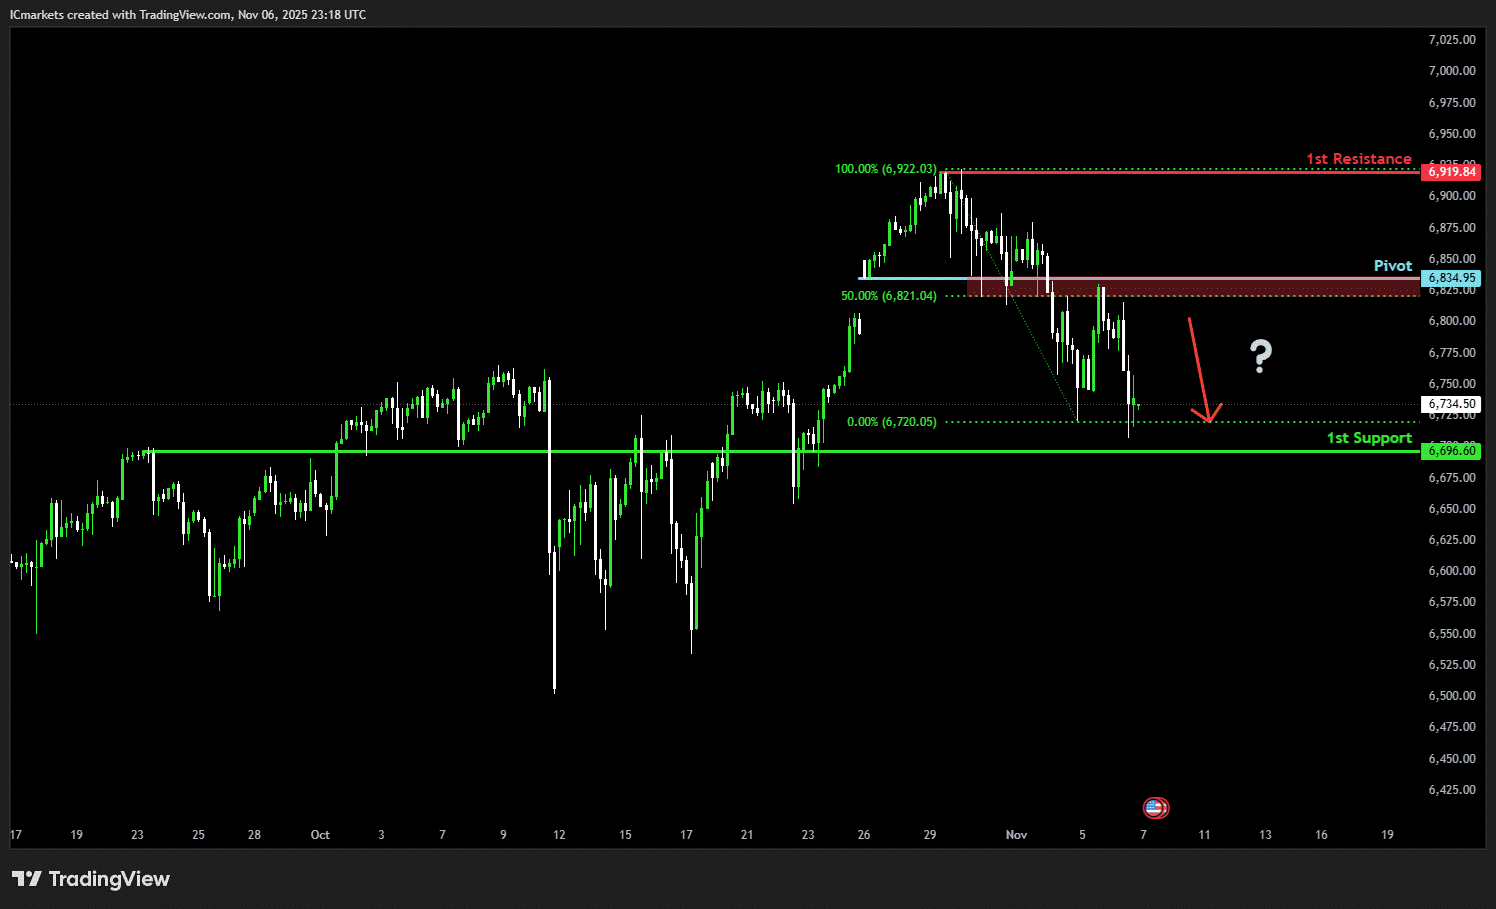
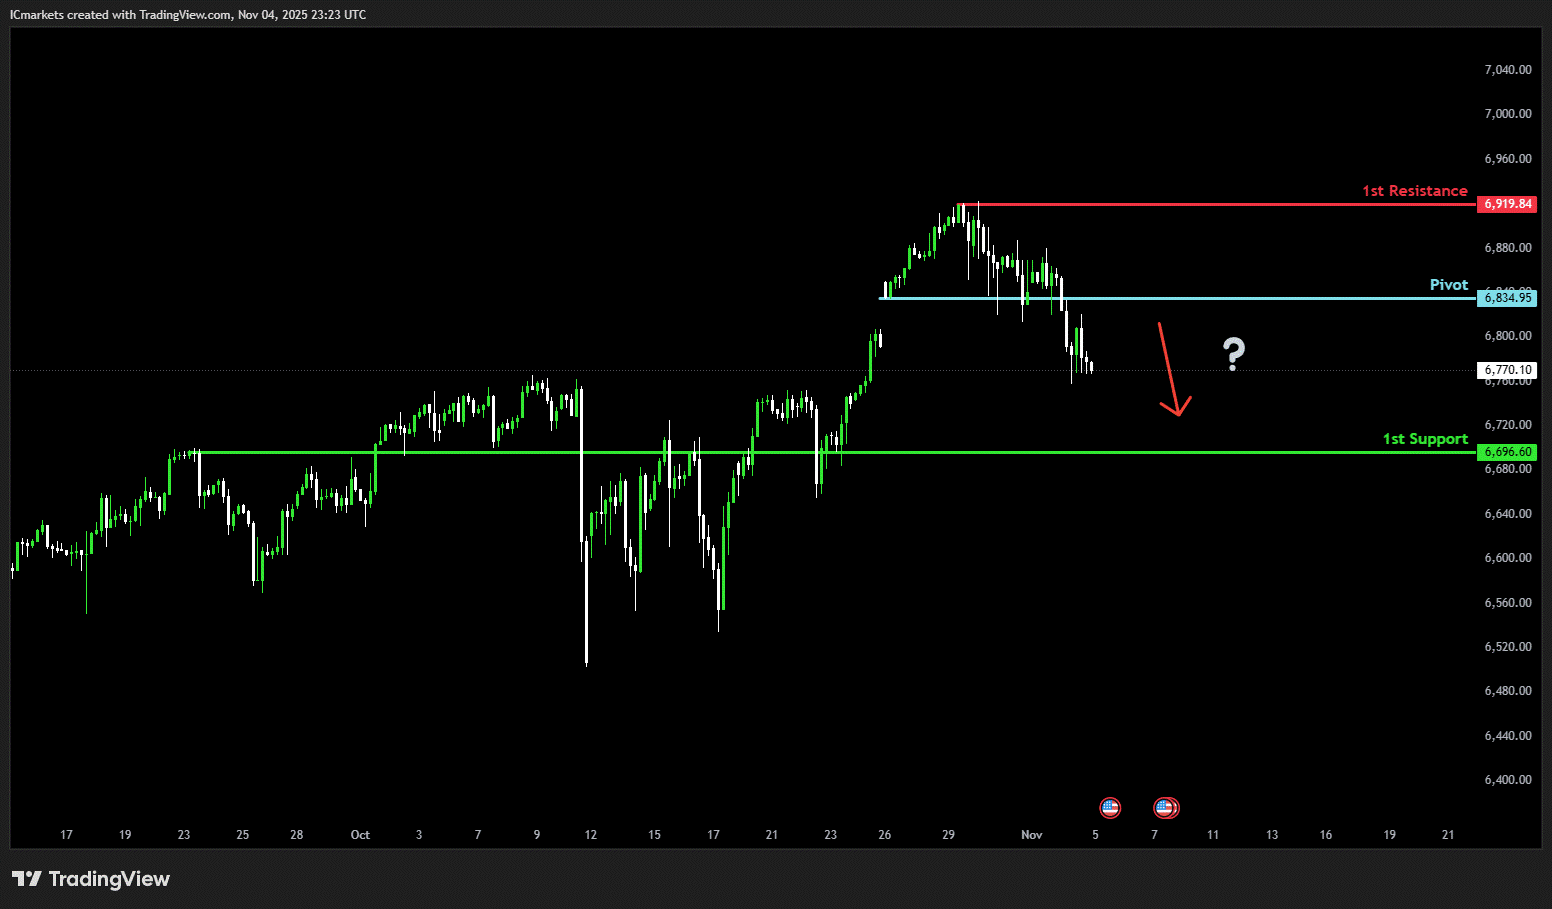
US500 (S&P 500):
Potential Direction: Bearish
Overall momentum of the chart: Bullish
The price has already reacted off the pivot and may continue its bearish move toward the 1st support
Pivot: 6,834.95
Supporting reasons: Identified as a pullback resistance that aligns with the 50% Fibonacci retracement, where selling pressures could intensify and potentially cap any upward retracement
1st support: 6,696.60
Supporting reasons: Identified as a pullback support, indicating a potential level where the price could stabilize once again.
1st resistance: 6.919.84
Supporting reasons: Identified as a swing high resistance, indicating a potential area that could halt any further upward movement.
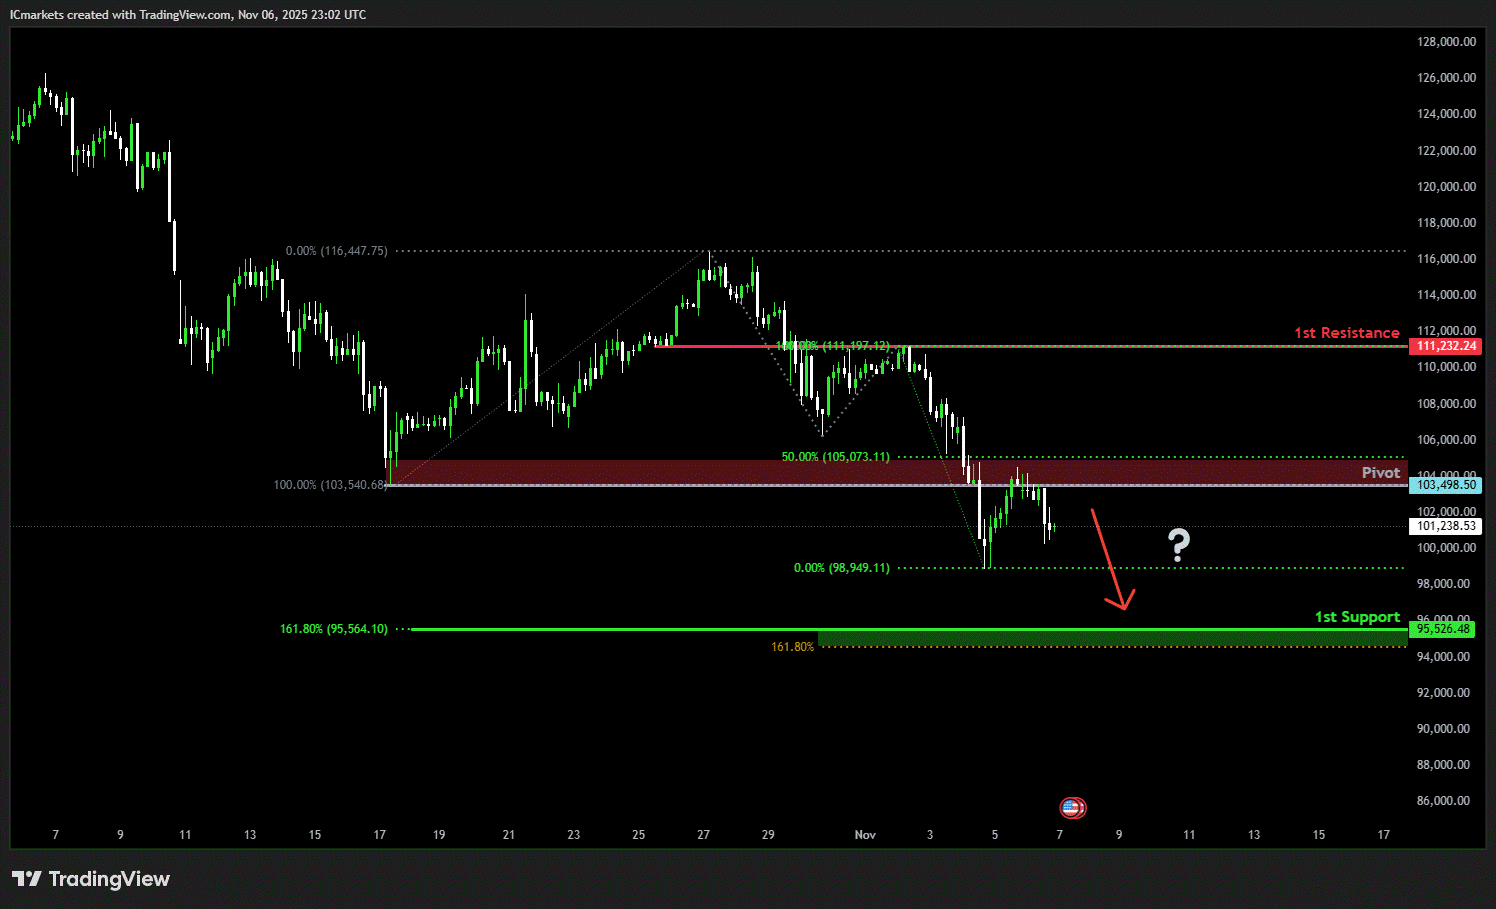
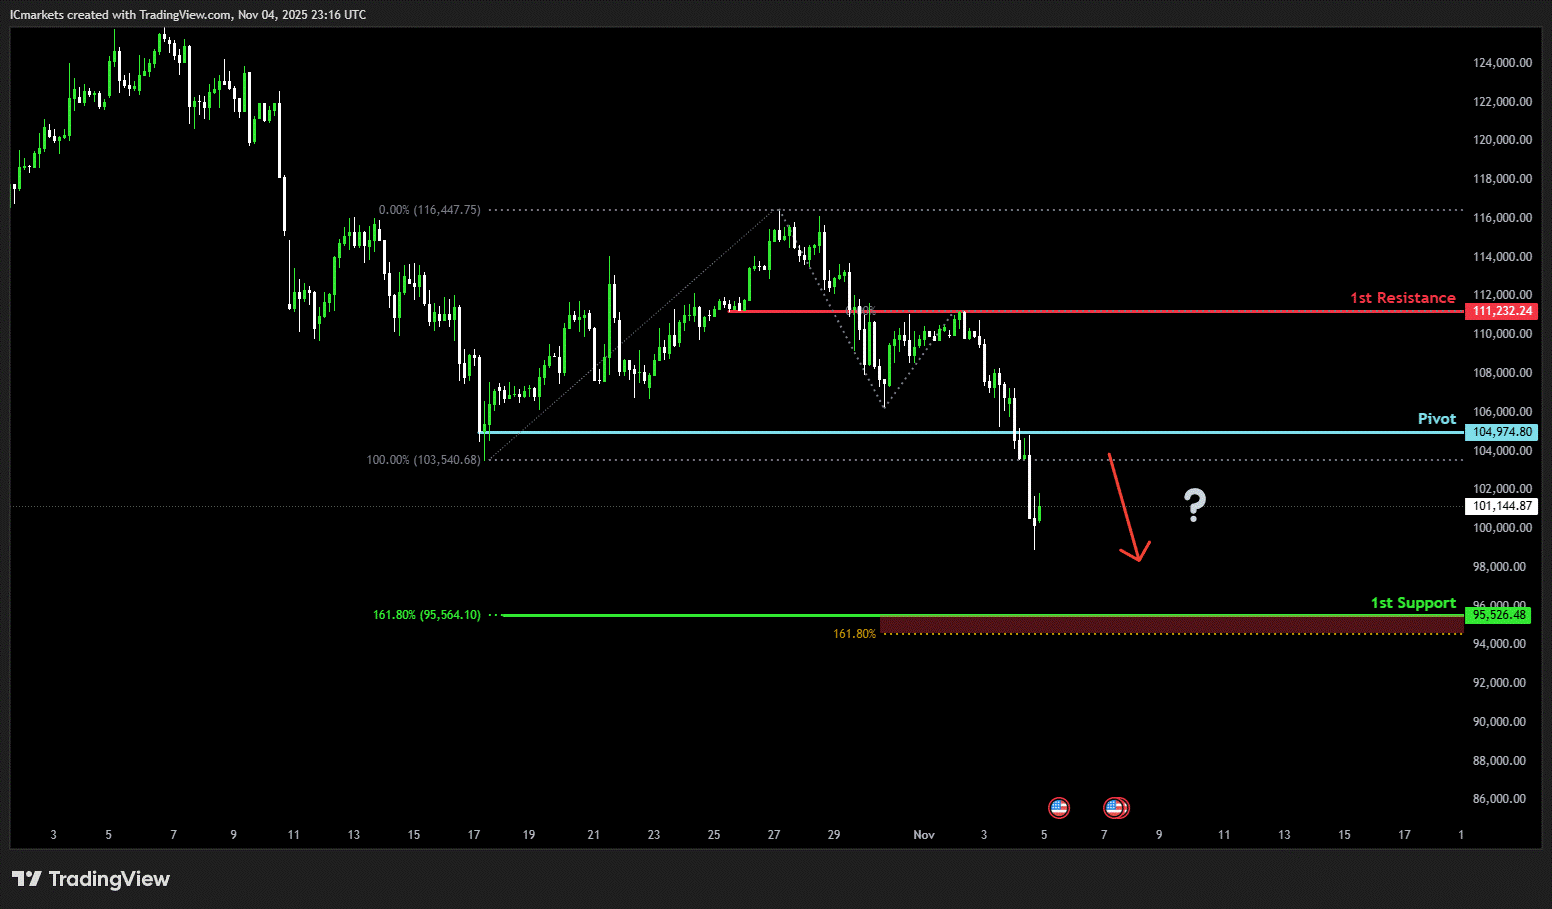
BTC/USD (Bitcoin):
Potential Direction: Bearish
Overall momentum of the chart: Bullish
The price has already reacted off the pivot and may continue its bearish move toward the 1st support
Pivot: 103,498.50
Supporting reasons: Identified as a pullback resistance that aligns with the 50% Fibonacci retracement, where selling pressures could intensify and potentially cap any upward retracement
1st support: 95,526.48
Supporting reasons: Identified as an overlap support that aligns closely with the 161.8% Fibonacci extension, indicating a potential level where the price could stabilize once more.
1st resistance: 111,232.24
Supporting reasons: Identified as an overlap resistance, indicating a potential area that could halt any further upward movement.
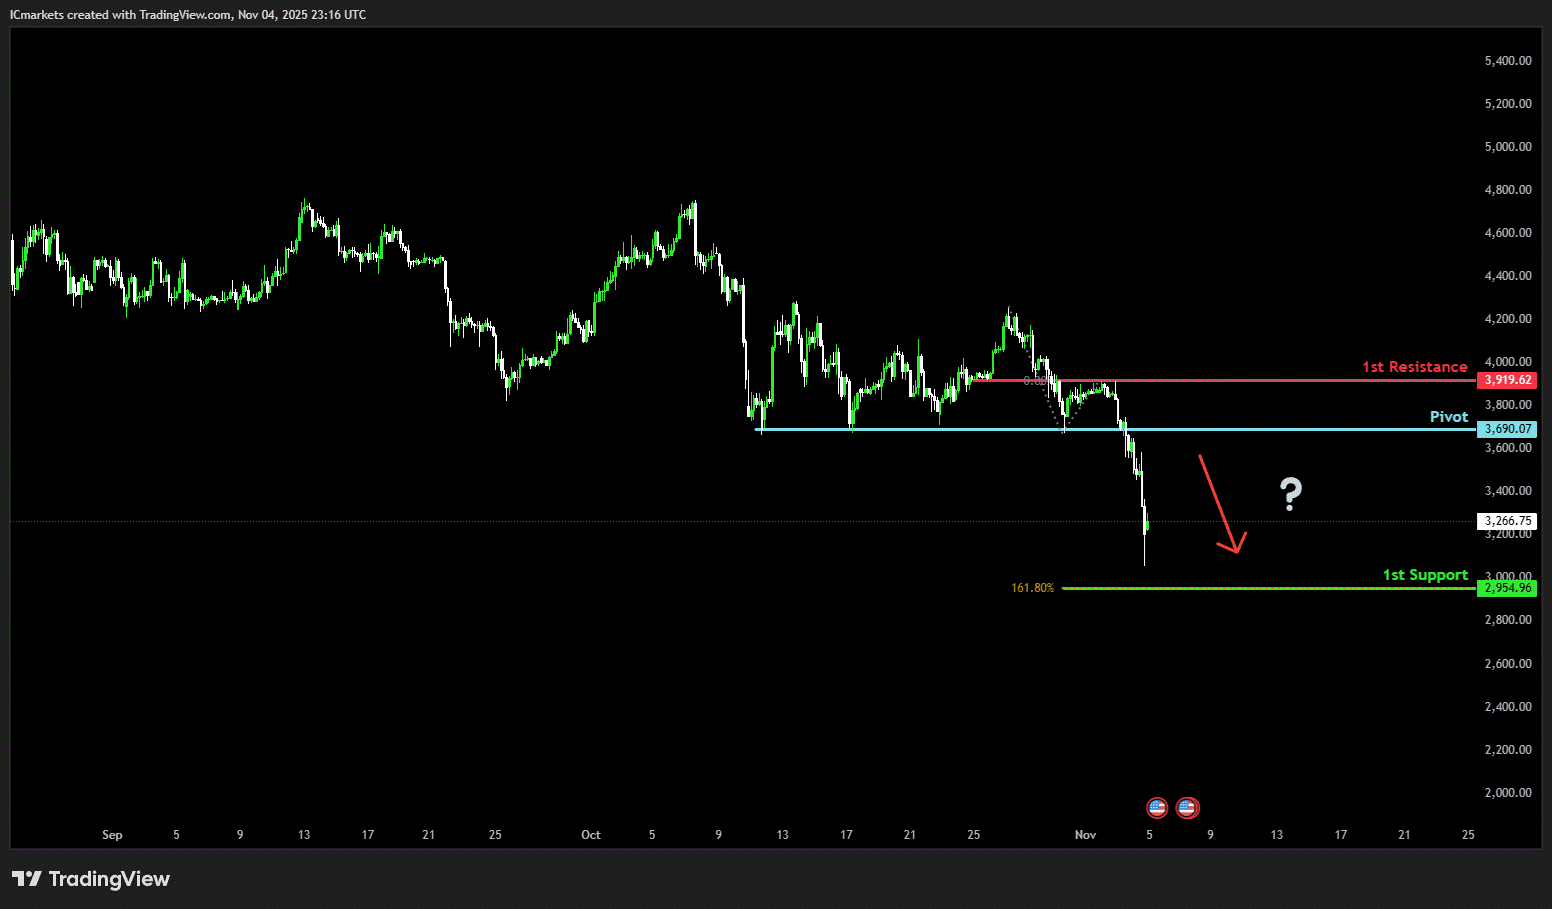
ETH/USD (Ethereum):
Potential Direction: Bearish
Overall momentum of the chart: Bullish
The price could see a short-term pullback toward the pivot before continuing its bearish move down toward the 1st support.
Pivot: 3,691.29
Supporting reasons: Identified as a pullback resistance, where selling pressures could intensify and potentially cap any upward retracement.
1st support: 2,954.96
Supporting reasons: Identified as a support that is supported by the 161.8% Fibonacci projection, indicating a potential level where the price could stabilize once more.
1st resistance: 3,919.62
Supporting reasons: Identified as an overlap resistance, indicating a potential area that could halt any further upward movement.
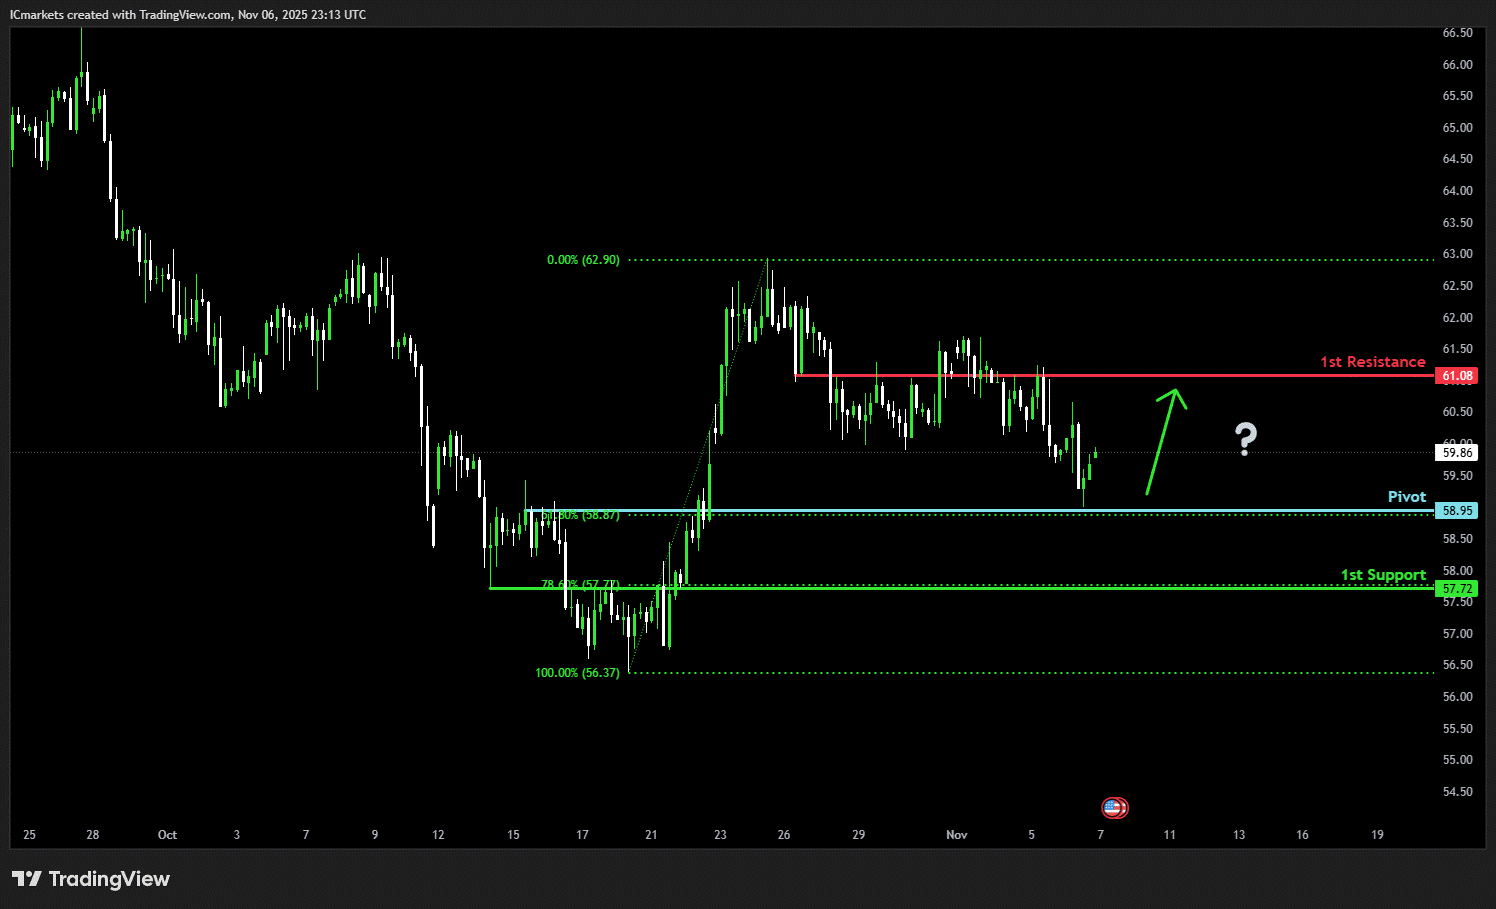
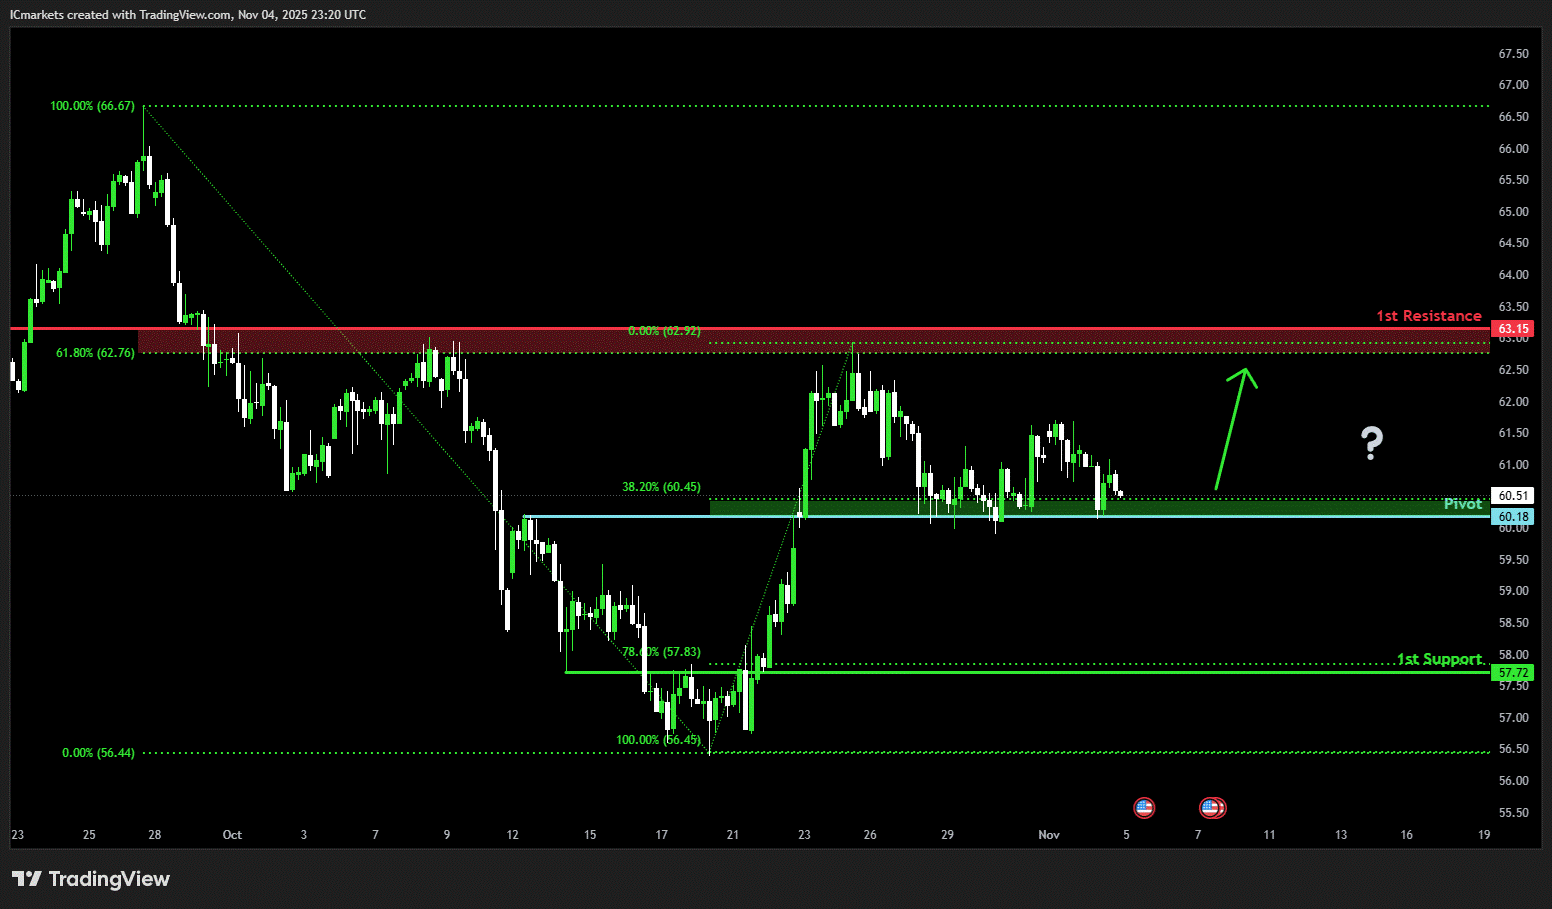
WTI/USD (Oil):
Potential Direction: Bullish
Overall momentum of the chart: Bullish
The price has already bounced off the pivot and may continue its bullish move toward the 1st resistance
Pivot: 58.95
Supporting reasons: Identified as a pullback support that aligns with the 61.8% Fibonacci retracement, where renewed buying pressure could emerge to push the price higher.
1st support: 57.72
Supporting reasons: Identified as a pullback support that aligns with the 78.6% Fibonacci retracement, indicating a key level where the price could stabilize once more.
1st resistance: 61.08
Supporting reasons: Identified as an overlap resistance, indicating a potential area that could halt any further upward movement.
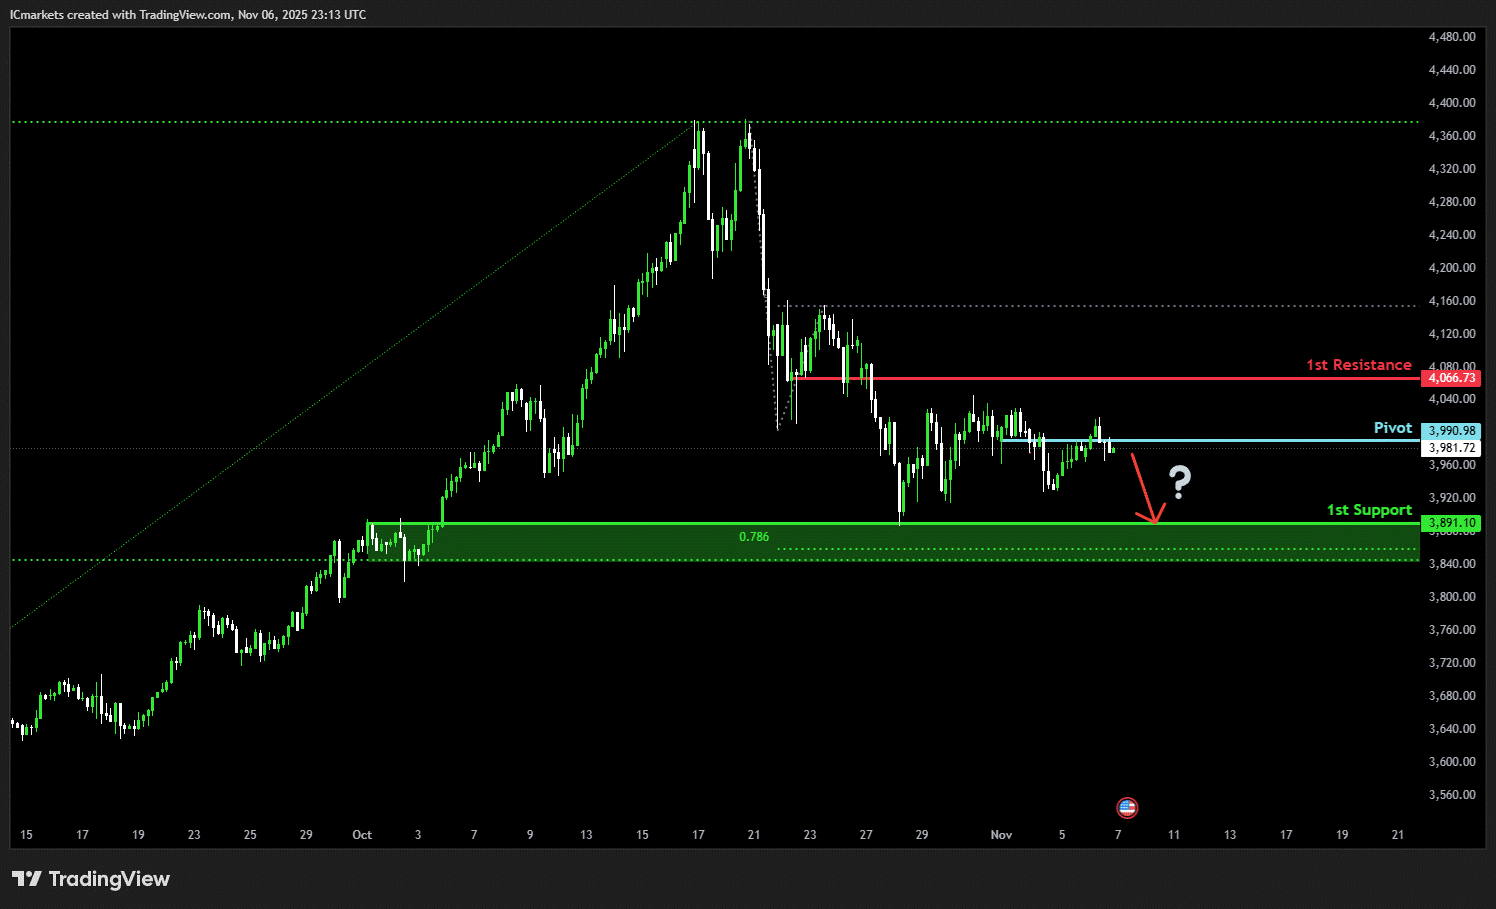
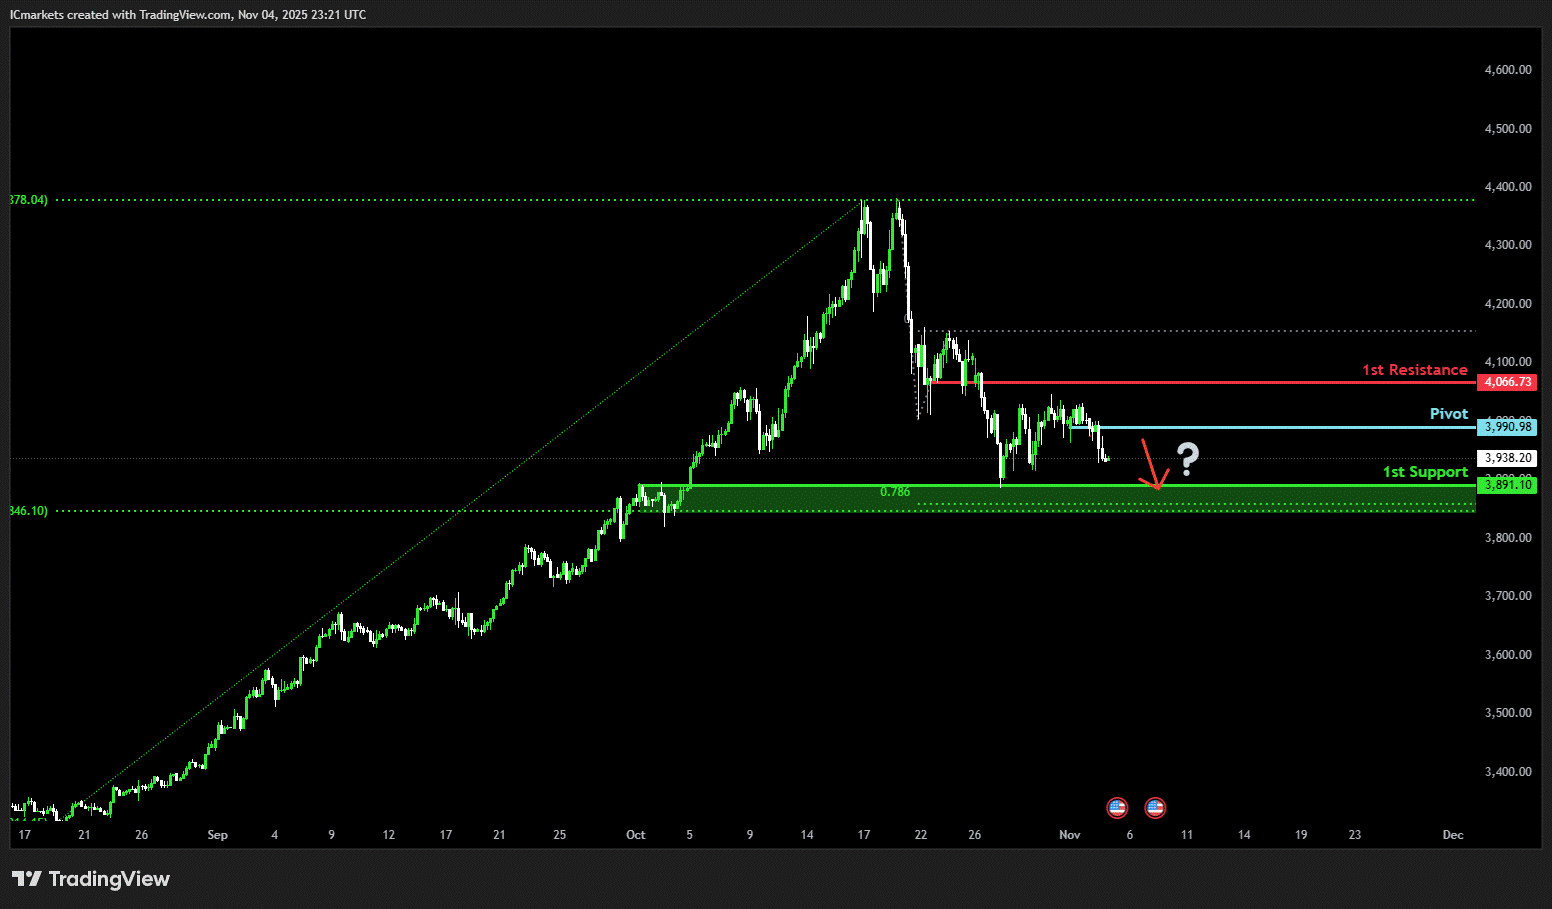
XAU/USD (GOLD):
Potential Direction: Bearish
Overall momentum of the chart: Bullish
The price has already reacted off the pivot and may continue its bearish move toward the 1st support
Pivot: 3.990.98
Supporting reasons: Identified as an overlap resistance, where selling pressures could intensify and potentially cap any upward retracement
1st support: 3,891.10
Supporting reasons: Identified as an overlap support that aligns closely with the 78.6% Fibonacci projection, indicating a key level where the price could stabilize once more.
1st resistance: 4,066.73
Supporting reasons: Identified as a pullback resistance, indicating a potential area that could halt any further upward movement.
The accuracy, completeness and timeliness of the information contained on this site cannot be guaranteed. IC Markets does not warranty, guarantee or make any representations, or assume any liability regarding financial results based on the use of the information in the site.
News, views, opinions, recommendations and other information obtained from sources outside of www.icmarkets.com, used in this site are believed to be reliable, but we cannot guarantee their accuracy or completeness. All such information is subject to change at any time without notice. IC Markets assumes no responsibility for the content of any linked site.
The fact that such links may exist does not indicate approval or endorsement of any material contained on any linked site. IC Markets is not liable for any harm caused by the transmission, through accessing the services or information on this site, of a computer virus, or other computer code or programming device that might be used to access, delete, damage, disable, disrupt or otherwise impede in any manner, the operation of the site or of any user’s software, hardware, data or property.
The post Friday 7th November 2025: Technical Outlook and Review first appeared on IC Markets | Official Blog.
IC Markets – Asia Fundamental Forecast | 07 November 2025
423233 November 7, 2025 16:00 ICMarkets Market News
IC Markets – Asia Fundamental Forecast | 07 November 2025
What happened in the U.S. session?
The session was dominated by softer consumer sentiment, resilient inflation expectations, and the market’s increasing confidence in an imminent Fed rate cut. Data on employment and spending drove a risk-off tone, impacting the USD, stocks, bonds, and commodities. Technology stocks were especially volatile, and safe-haven flows into Treasuries were observed. Currency pairs sensitive to U.S. data, such as EUR/USD and USD/JPY, saw significant movement, while commodities reacted to revised growth risks.
What does it mean for the Asia Session?
Labor and sentiment data out of the US and Canada will drive FX and equity direction, while Asian markets face additional pressure from commodity headlines and geopolitical risk. Watch for high volatility around the US jobs release, ongoing US-China developments, and persistent uncertainty in monetary policy direction. Russian oil is trading at its steepest discounts as Asian refiners reduce purchases post new US sanctions, affecting Asia’s commodity markets and potentially influencing regional inflation.
The Dollar Index (DXY)
Key news events today
Prelim UoM Consumer Sentiment (3:00 pm GMT)
Prelim UoM Inflation Expectations (3:00 pm GMT)
What can we expect from DXY today?
The US dollar enters Friday, November 7, 2025, in a position of relative strength, supported by Fed hawkishness and better-than-expected private sector data. However, the critical jobs report scheduled for 14:30 UTC represents a pivotal test that could either validate recent dollar gains or trigger a reversal. The unprecedented government shutdown adds significant uncertainty, with market participants operating in a data fog that has elevated the importance of alternative indicators.
Central Bank Notes:
- The Federal Open Market Committee (FOMC) voted, by majority, to lower the federal funds rate target range by 25 basis points to 3.75%–4.00% at its October 28–29, 2025, meeting, marking the second consecutive cut following the 25 basis points reduction in September.
- The Committee maintained its long-term objectives of maximum employment and 2% inflation, noting that the labor market continues to soften, with modest job creation and an unemployment rate edging higher. In comparison, inflation remains above target at around 3.0%.
- Policymakers highlighted ongoing downside risks to economic growth, tempered by signs of resilient economic activity. September’s consumer price index (CPI) came in slightly lower than expected at 3.0% year-over-year, easing inflation pressure but still warranting vigilance given tariff-driven price effects.
- Economic activity expanded modestly in the third quarter, with GDP growth estimates around 1.0% annualized; however, uncertainty remains elevated amid persistent global trade tensions and the U.S. government shutdown, which is impacting data availability.
- The updated Summary of Economic Projections reflects an anticipated unemployment rate averaging approximately 4.5% for 2025, with headline and core personal consumption expenditures (PCE) inflation projections holding near 3.0%, indicating a slow easing path ahead.
- The Committee emphasized its flexible, data-dependent approach and underscored that future policy adjustments will be guided by incoming labor market and inflation data. As in prior meetings, there was dissent, including one member advocating a more aggressive 50-basis-point cut.
- The FOMC announced the planned conclusion of its balance sheet reduction (quantitative tightening) program, intending to cease runoff in the near term to maintain market stability, with Treasury redemption caps held steady at $5 billion per month and agency mortgage-backed securities caps at $35 billion.
- The next meeting is scheduled for 9 to 10 December 2025.
Next 24 Hours Bias
Weak Bearish
Gold (XAU)
Key news events today
Prelim UoM Consumer Sentiment (3:00 pm GMT)
Prelim UoM Inflation Expectations (3:00 pm GMT)
What can we expect from Gold today?
Gold remains well-supported around $4,000 per ounce despite facing headwinds from a cautious Federal Reserve, a stronger dollar, and profit-taking after this year’s 48% rally. The precious metal continues to benefit from the longest US government shutdown in history, sustained central bank accumulation totaling 634 tonnes year-to-date, record-breaking ETF inflows of $72 billion, and persistent geopolitical risks.
Next 24 Hours Bias
Weak Bullish
The Australian Dollar (AUD)
Key news events today
No major news event
What can we expect from AUD today?
The Australian dollar entered Friday under pressure despite the RBA’s hawkish policy stance, trading near two-week lows around 0.6490-0.6514. While positive US-China trade developments and China’s tariff suspensions provided some support, these were overwhelmed by broad US dollar strength driven by reduced Fed rate cut expectations and cautious central bank messaging. Higher-than-expected Australian inflation has effectively ended the domestic rate-cutting cycle for now, with the RBA projecting inflation to remain elevated through mid-2026.
Central Bank Notes:
- The Reserve Bank of Australia held its cash rate steady at 3.60% at the November policy meeting, citing persistent inflationary pressures and lingering uncertainties in both domestic and global outlooks. This is the third consecutive pause following the cut in August.
- Policymakers remain alert to renewed inflation momentum. After a temporary uptick in September’s CPI, trimmed mean inflation for Q3 stands at 3.0%, above the intended 2–3% band. The RBA now anticipates that core inflation will stay above target until at least mid-2026, delaying any hopes of further easing.
- Headline CPI climbed by 3.2% in the year to September 2025, driven by resilient housing (+2.5%) and insurance costs, while discretionary goods inflation is subdued. The transition to monthly CPI reporting from November will improve the accuracy of inflation tracking.
- Domestic demand remains firm, particularly in services and housing, while manufacturing and discretionary retail continue to lag. Household incomes have stabilized, but high borrowing costs and elevated rents are constraining consumption and risking a slowdown in Q1 2026.
- Labor market tightness persists, though job growth has moderated. Underutilization edged higher. Wage growth is plateauing, but weak productivity is keeping unit labor costs elevated—a medium-term risk that remains central to the Board’s narrative.
- The RBA highlights geopolitical tensions and volatile commodity markets as primary global risks, against a backdrop of modest upward revisions to world growth forecasts. The Board stresses that its stance remains “cautious and data-dependent,” with ongoing vigilance on inflation, labor, and spending trends.
- Monetary policy remains mildly restrictive, balancing progress on price stability against vulnerabilities in household demand and global outlook. Board communications reaffirm a dual mandate: price stability and full employment, while underscoring readiness to respond should risks materialize sharply.
- Analysts generally expect the cash rate to remain at current levels through early 2026, with only modest cuts possible later in the year if inflation moderates. The new monthly CPI release (first full edition Nov 2025) will be watched closely for timely signals on price trends.
- The next meeting is on 9 December 2025.
Next 24 Hours Bias
Weak Bearish
The Kiwi Dollar (NZD)
Key news events today
No major news event
What can we expect from NZD today?
The New Zealand Dollar enters Friday, November 7, under significant pressure from multiple converging factors: weak domestic labor market data showing unemployment at nine-year highs, fully priced-in RBNZ rate cut expectations for late November, softening Chinese economic indicators, six consecutive declines in dairy prices, US Dollar strength amid Fed policy uncertainty, and deteriorating cross-rate performance, particularly against the Australian Dollar.
Central Bank Notes:
- The Monetary Policy Committee (MPC) agreed to cut the Official Cash Rate (OCR) by 50 basis points to 2.50% on 8 October 2025, exceeding market expectations for a smaller 25-basis-point reduction and signaling a stronger commitment to reviving growth.
- The decision was reached by consensus, marking a shift from previous split votes, and reflected policymakers’ shared view that sustained economic weakness and persistent disinflationary pressures required a more front-loaded policy response.
- Annual consumer price inflation stood at 2.7% in the June quarter and is seen nearing 3% for the September quarter—above the 2% midpoint but within the 1–3% target range. Despite high near-term readings, the MPC projects inflation will return toward 2% by the first half of 2026 as spare capacity and moderating tradables curb price momentum.
- Policymakers acknowledged that domestic demand remains weak, with household spending, business investment, and construction activity under pressure. While still elevated, services inflation is expected to ease gradually as wage growth slows and unemployment edges higher.
- Financial conditions have eased with expectations as wholesale and retail borrowing rates adjust to lower policy settings. Bank lending data indicate a modest uptick in mortgage approvals, though broader credit demand remains subdued.
- GDP growth stalled in the middle of 2025, with high-frequency indicators showing continued weakness into the third quarter. A combination of elevated costs for essentials and falling savings continues to restrain household consumption, while global trade frictions weigh on business sentiment.
- The MPC noted that global uncertainty—particularly from US trade regulation changes and soft Chinese demand—continues to pose downside risks to export sectors, though these are partly offset by a weaker New Zealand dollar improving competitiveness.
- Subject to data confirming a sustained soft patch in activity and moderating inflation pressures, the MPC signaled further scope to reduce the OCR toward 2.25% at its next meeting on 26 November 2025, consistent with current market and Westpac forecasts.
- The next meeting is on 26 November 2025.
Next 24 Hours Bias
Medium Bearish
The Japanese Yen (JPY)
Key news events today
No major news events
What can we expect from JPY today?
The Japanese yen faces continued downward pressure as the Bank of Japan signals a slower pace of policy normalization while the Federal Reserve maintains a more hawkish stance. The BOJ’s decision to hold rates and Governor Ueda’s emphasis on 2026 wage negotiations as the determining factor for the next hike have pushed expectations out to Q1 2026, widening the interest rate differential favoring the dollar.
Central Bank Notes:
- The Policy Board of the Bank of Japan met on 30–31 October and, by a clear majority vote, decided to maintain its key monetary policy approach for the upcoming period.
- The BOJ will continue to encourage the uncollateralized overnight call rate to remain at around 0.5%, in line with the prior stance.
- The gradual quarterly reduction in monthly outright purchases of Japanese Government Bonds (JGBs) remains intact, with amounts unchanged from the previous schedule. Purchases are set to decrease by about ¥400 billion per quarter through March 2026, shifting to about ¥200 billion per quarter from April to June 2026, and targeting a ¥2 trillion purchase level for Q1 2027. The bank reaffirmed its intention to maintain flexibility, with readiness to respond if market conditions warrant an adjustment.
- Japan’s economy continues to show moderate recovery, primarily led by solid capital expenditures, although export growth and corporate activity remain restrained by external demand uncertainty and the ongoing effects of U.S. trade policies.
- Annual headline inflation (excluding fresh food) accelerated to 2.9% year-on-year in September, marking the first uptick in four months and staying above the BOJ’s 2% target. Broad-based inflation persists, with food and energy cost pressures, but wage growth continues to support household consumption. Input cost pressures from the earlier surge in imports eased slightly.
- Short-term inflation momentum could moderate as food-price hikes ease, though rent, healthcare, and service-sector price increases tied to labor shortages provide support. Firms and households maintain a gradual upward drift in inflation expectations.
- For the near term, BOJ projects growth below trend as external demand stays subdued and corporate investment plans remain cautious. Still, accommodative financial conditions and steady gains in real labor income will underpin domestic consumption.
- Over the medium term, as overseas economies recover and trade conditions normalize, Japan’s growth potential should improve. Persistent labor market tightness, higher wage settlements, and rising medium- to long-term inflation expectations are expected to keep core inflation on a gradual upward trajectory, converging toward the 2% price stability target later in the forecast horizon.
- The next meeting is scheduled for 18 to 19 December 2025.
Next 24 Hours Bias
Weak Bearish
Oil
Key news events today
No major news event
What can we expect from Oil today?
The oil market faces significant headwinds from multiple directions. A record U.S. inventory build of 5.2 million barrels, weakening global demand growth, and forecasts of a massive 4 million barrels per day oversupply in 2026 are pushing prices lower. OPEC+’s decision to pause production increases in Q1 2026 and Saudi Arabia’s aggressive price cuts to Asian buyers reflect recognition of deteriorating market fundamentals.
Next 24 Hours Bias
Medium Bearish
The post IC Markets – Asia Fundamental Forecast | 07 November 2025 first appeared on IC Markets | Official Blog.
Friday 7th November 2025: Asian Markets Slide as Tech Stocks Tumble and AI Bubble Fears Intensify
423232 November 7, 2025 15:39 ICMarkets Market News
Global Markets:
- Asian Stock Markets : Nikkei down -2.26%, Shanghai Composite down -0.16%, Hang Seng down -1.26% ASX down -0.54%
- Commodities : Gold at $4,001.40 (0.26%), Silver at $48.190 (0.50%), Brent Oil at $63.57 (0.30%), WTI Oil at $59.63 (0.34%)
- Rates : US 10-year yield at 4.091, UK 10-year yield at 4.4370, Germany 10-year yield at 2.6576
News & Data:
- (GBP) Official Bank Rate 4.00% to 4.00% expected
Markets Update:
Asian stocks traded mostly lower on Friday, mirroring the sharp declines on Wall Street, with tech-heavy markets in Japan and South Korea leading regional losses as AI-related stocks slumped on renewed fears of an AI bubble burst. This weakness came despite markets ending higher on Thursday. Sentiment was further weighed by a Challenger, Gray & Christmas report showing a steep rise in October layoff announcements.
In Australia, the ASX reversed Thursday’s gains and moved modestly lower, dragged by weakness in iron ore miners and tech stocks, although gold miners, energy and financials offered some support. The S&P/ASX 200 slipped below 8,800, while major miners like BHP, Rio Tinto and Fortescue declined. Tech names saw sharp selling, with Block plunging over 14 percent. Qantas-backed Alliance Aviation crashed nearly 40 percent after warning of weaker FY26 results, while Macquarie Group dropped over 7 percent on disappointing earnings.
Japan’s Nikkei 225 tumbled more than 2 percent, falling below 49,800 as tech stocks and heavyweights like SoftBank sank sharply. Exporters including Sony and Panasonic also slipped. Several stocks saw steep declines, though Recruit Holdings and Nissan posted strong gains. Economic data showed household spending in Japan rose 1.8 percent year-on-year in September but missed expectations.
Across Asia, South Korea, China, Hong Kong and Taiwan were lower, while New Zealand, Singapore and Indonesia posted modest gains. Meanwhile, Wall Street closed sharply lower, with the Nasdaq dropping 1.9 percent and crude oil prices easing on oversupply concerns.
Upcoming Events:
- 01:30 PM GMT – CAD Employment Change
- 01:30 PM GMT – CAD Unemployment Rate
The post Friday 7th November 2025: Asian Markets Slide as Tech Stocks Tumble and AI Bubble Fears Intensify first appeared on IC Markets | Official Blog.
IC Markets – Europe Fundamental Forecast | 07 November 2025
423231 November 7, 2025 15:39 ICMarkets Market News
IC Markets – Europe Fundamental Forecast | 07 November 2025
What happened in the Asia session?
CAD was pressured by weaker-than-expected employment change and a steady unemployment rate.USD saw mixed impacts from softer preliminary consumer sentiment and steady inflation expectations. Asian equities broadly slid, led by Japanese, South Korean, and Australian markets, due to global tech valuation concerns and labor market worries. Risk sentiment mildly favored NZD, AUD, and GBP over safe havens like CAD and CHF. Treasury yields rose as US employment data trimmed expectations of a Fed rate cut.
What does it mean for the Europe & US sessions?
Friday’s trading sessions face multiple crosscurrents: the unprecedented U.S. government shutdown creating a data vacuum, concerning labor market signals with record October job cuts, and central bank divergence as the BoE signals potential December easing while Fed hawks resist further cuts. Canadian employment data and U.S. consumer sentiment provide rare economic insights amid the blackout. Technology sector volatility, particularly AI stocks facing valuation concerns, has triggered broad risk-off sentiment affecting cryptocurrencies and equity markets globally.
The Dollar Index (DXY)
Key news events today
Prelim UoM Consumer Sentiment (3:00 pm GMT)
Prelim UoM Inflation Expectations (3:00 pm GMT)
What can we expect from DXY today?
The US dollar is in a state of uncertainty, trading near 100.0 on the DXY after retreating from recent highs. The dollar is caught between competing forces: supportive factors include elevated US interest rates and cautious Fed rhetoric, while headwinds include the historic government shutdown, mixed labor market signals, and expectations for further monetary easing.
Private-sector data shows a labor market that is simultaneously adding jobs (ADP: +42K) and experiencing record layoffs (Challenger: 153K cuts), creating confusion about the economy’s true trajectory.
Central Bank Notes:
- The Federal Open Market Committee (FOMC) voted, by majority, to lower the federal funds rate target range by 25 basis points to 3.75%–4.00% at its October 28–29, 2025, meeting, marking the second consecutive cut following the 25 basis points reduction in September.
- The Committee maintained its long-term objectives of maximum employment and 2% inflation, noting that the labor market continues to soften, with modest job creation and an unemployment rate edging higher. In comparison, inflation remains above target at around 3.0%.
- Policymakers highlighted ongoing downside risks to economic growth, tempered by signs of resilient economic activity. September’s consumer price index (CPI) came in slightly lower than expected at 3.0% year-over-year, easing inflation pressure but still warranting vigilance given tariff-driven price effects.
- Economic activity expanded modestly in the third quarter, with GDP growth estimates around 1.0% annualized; however, uncertainty remains elevated amid persistent global trade tensions and the U.S. government shutdown, which is impacting data availability.
- The updated Summary of Economic Projections reflects an anticipated unemployment rate averaging approximately 4.5% for 2025, with headline and core personal consumption expenditures (PCE) inflation projections holding near 3.0%, indicating a slow easing path ahead.
- The Committee emphasized its flexible, data-dependent approach and underscored that future policy adjustments will be guided by incoming labor market and inflation data. As in prior meetings, there was dissent, including one member advocating a more aggressive 50-basis-point cut.
- The FOMC announced the planned conclusion of its balance sheet reduction (quantitative tightening) program, intending to cease runoff in the near term to maintain market stability, with Treasury redemption caps held steady at $5 billion per month and agency mortgage-backed securities caps at $35 billion.
- The next meeting is scheduled for 9 to 10 December 2025.
Next 24 Hours Bias
Medium Bullish
Gold (XAU)
Key news events today
Prelim UoM Consumer Sentiment (3:00 pm GMT)
Prelim UoM Inflation Expectations (3:00 pm GMT)
What can we expect from Gold today?
Gold spent consolidating above the $4,000 level despite recent volatility spurred by a correction from October’s record highs and shifting expectations for U.S. interest rates. The Federal Reserve’s potential policy easing and ongoing global demand remain the dominant bullish drivers. Most forecasts see gold in a consolidative phase with the potential for further gains if support levels hold or rates are cut, but caution remains as technicals show the risk of additional corrections if key supports are breached. Institutional forecasts for 2026 remain bullish, expecting new all-time highs in the coming year.
Next 24 Hours Bias
Weak bearish
The Euro (EUR)
Key news events today
No major news event
What can we expect from EUR today?
The euro faces headwinds from a strengthening dollar and concerns about weak retail consumption, though ECB officials express comfort with current policy rates and view inflation as close to target. Manufacturing has stabilized but remains fragile, while the divergence between France’s strong growth and Germany’s stagnation highlights uneven economic performance across the eurozone. Technical indicators suggest EUR/USD may test resistance around 1.1565 before potentially resuming its downward trend toward 1.14 or lower.
Central Bank Notes:
- The Governing Council of the ECB kept the three key interest rates unchanged at its 30 October 2025 meeting. The main refinancing rate remains at 2.15%, the marginal lending facility at 2.40%, and the deposit facility at 2.00%. This decision reflects policymakers’ assessment that the current monetary stance remains consistent with medium-term price stability, while incoming data confirm a gradual return of inflation towards the target.
- Recent indicators point to stable price dynamics. Headline inflation remains near the 2% mark, with energy prices contained and food inflation easing slightly after earlier supply bottlenecks. Wage growth continues to moderate, contributing to the slowdown in domestic cost pressures. The ECB reiterated its commitment to a data-driven, meeting-by-meeting approach and emphasized flexibility amid uncertain global financial conditions.
- Eurosystem staff projections have not been materially altered since September. Headline inflation averages remain at 2.0% for 2025, 1.8% for 2026, and 2.0% for 2027. Recent softening in producer prices and subdued pipeline pressures suggest limited upside risks to inflation, though geopolitical tensions and potential commodity shocks continue to pose uncertainties to the outlook.
- Euro area GDP growth remains on track with earlier forecasts, projected at 1.1% for 2025, 1.1% for 2026, and 1.4% for 2027. Forward-looking indicators, including PMIs and industrial sentiment surveys, signal some stabilization in activity following weakness in the third quarter. Public investment and recovering export activity are expected to offset softer private sector demand in the near term.
- The labor market remains resilient, with unemployment rates at multi-decade lows and participation rates strong. Real income growth continues to support household spending, even as consumption growth normalizes from earlier highs. Financing conditions remain favorable, aided by stable banking sector liquidity and improved credit demand among small and medium-sized firms.
- Business sentiment remains mixed, reflecting lingering uncertainty over global trade policy and the path of US tariffs. However, easing supply chain costs and improved export competitiveness due to softer exchange rates are providing some relief to manufacturing and external-oriented sectors.
- The Governing Council reaffirmed that future decisions will depend on an integrated assessment of incoming data—covering inflation trends, financial conditions, and the state of policy transmission. The Council emphasized that no pre-set path for rates exists; keeping all options open should the economic outlook shift markedly.
- Balance sheet reduction continues smoothly, with holdings under the APP and PEPP declining as reinvestments have ceased. The ECB confirmed that the pace of portfolio runoff remains in line with its previously communicated normalization plan, supporting a gradual withdrawal of monetary accommodation in a predictable manner.
- The next meeting is on 17 to 18 December 2025
Next 24 Hours Bias
Medium Bearish
The Swiss Franc (CHF)
Key news events today
No major news event
What can we expect from CHF today?
The Swiss franc maintains its position as a preferred safe-haven currency on November 7, 2025, trading near multi-year highs against the US dollar and approaching decade highs versus the euro. While October’s surprisingly low inflation data (0.1% year-over-year) has sparked some speculation about potential SNB rate cuts, policymakers have signaled comfort with the current 0% policy rate, with rates expected to remain unchanged at the December 11 meeting. The franc’s strength continues to be supported by global uncertainties, though the currency faces increasing competition from diversified safe-haven strategies.
Central Bank Notes:
- The SNB maintained its key policy rate at 0% during its meeting on 25 September 2025, pausing a sequence of six consecutive rate cuts as inflation stabilized and the Swiss franc remained firm.
- Recent data showed a modest rebound in inflation, with Swiss consumer prices rising 0.2% year-on-year in August after staying above zero for three consecutive months; this helped alleviate fears of deflation that were mounting earlier in the year.
- The conditional inflation forecast remains broadly unchanged from June: headline inflation is expected to average 0.2% in 2025, 0.5% in 2026, and 0.7% in 2027. The risk of a negative rate move has diminished for now, but the SNB retains flexibility should inflationary pressures weaken again.
- The global economic outlook has deteriorated further, weighed down by heightened trade tensions—especially with the U.S.—and ongoing uncertainty in key Swiss export markets.
- Swiss GDP growth moderated in Q2 after a strong Q1 boosted by front-loaded U.S. exports. The SNB expects growth to slow and remain subdued, with forecasted GDP expansion between 1% and 1.5% in both 2025 and 2026.
- Labor market sentiment in the Swiss industrial sector has softened on concerns over export competitiveness and potential adjustments to production, but the overall growth outlook stays broadly unchanged
- The SNB reiterated its readiness to respond as needed if deflation risks re-emerge, emphasizing its commitment to medium-term price stability and a robust, transparent communication policy, with the introduction of more detailed monetary policy minutes beginning in October.
- The next meeting is on 11 December 2025.
Next 24 Hours Bias
Weak Bearish
The Pound (GBP)
Key news events today
No major news event
What can we expect from GBP today?
The British pound is under considerable pressure following the Bank of England’s decision to hold interest rates at 4% in a tighter-than-expected 5-4 vote. Sterling continues to trade near seven-month lows around $1.305, facing technical resistance at 1.32 and potential downside targets at 1.2750-1.2875 if key support levels break. With inflation elevated at 3.8%, uncertainty surrounding Chancellor Reeves’ November 26 budget and potential tax increases, and expectations building for a December rate cut, the pound faces a challenging near-term outlook.
Central Bank Notes:
- The Bank of England’s Monetary Policy Committee (MPC) met on 6 November 2025 and voted by a majority of 7–2 to keep the Bank Rate unchanged at 4.00 percent for a second consecutive meeting. The decision reflects the Committee’s cautious approach as inflation remains above target, but underlying economic momentum continues to weaken. Two members maintained their vote for a 25-basis-point cut, citing further signs of labor market softening and weak business sentiment.
- The BOE adjusted its guidance on quantitative tightening (QT), maintaining the reduced pace established in September. The planned reduction of UK government bond holdings remains at £67.5 billion over the next 12 months, leaving the current gilt balance near £550 billion. Policymakers described the recalibrated QT path as “appropriate for current market conditions,” emphasizing the importance of liquidity management amid heightened volatility.
- Headline inflation moderated slightly to 3.6 percent in October from 3.8 percent previously, driven by easing food and transport prices. However, core inflation has shown only gradual progress, holding near 3.9 percent. The MPC noted that services inflation and administered energy costs continue to exert pressure, highlighting the challenge of achieving the 2 percent target sustainably. The Committee’s latest projections see inflation falling toward 3 percent by mid-2026, with further downside expected if energy and wage dynamics continue to normalize.
- Economic activity remains subdued. Estimates place Q3 GDP growth close to zero, with both business output and consumer spending restrained. The unemployment rate has edged up to 4.8 percent, while pay growth cooled to just under 5 percent year-on-year. MPC members acknowledged that pay settlements are weakening further, signaling an easing in labor cost pressures as demand softens. Surveys from the manufacturing and services sectors suggest muted hiring intentions through year-end.
- International factors continue to complicate the policy outlook. Fluctuating oil prices—partly linked to renewed Middle East tensions—alongside fragile global demand have contributed to higher market volatility. The MPC reiterated that external shocks, including global food and energy disruptions, could temporarily slow the disinflation path but remain unlikely to derail the medium-term moderation in prices.
- The Committee assessed risks around inflation as balanced. Downside risks arise from sluggish domestic growth and declining real income momentum, while upside risks remain tied to elevated inflation expectations and stubborn services inflation. Policymakers emphasized the need for patience, maintaining that any rate cuts ahead of clear inflation progress could undermine confidence in policy credibility.
- The MPC’s overall stance remains restrictive but increasingly balanced, with future moves expected to follow a cautious, data-driven trajectory. The Committee reaffirmed that monetary policy will stay tight until there is compelling evidence that inflation is returning to the 2 percent target on a durable basis.
- The next meeting is on 18 December 2025.
Next 24 Hours Bias
Medium Bearish
The Canadian Dollar (CAD)
Key news events today
Employment Change (1:30 pm GMT)
Unemployment Rate (1:30 pm GMT)
What can we expect from CAD today?
The Canadian dollar faces multiple headwinds as it trades near seven-month lows around 1.41 per US dollar. Key pressures include weak oil prices hovering near $60/barrel, a stronger US dollar supported by hawkish Fed commentary, widening trade deficits, and the ongoing impact of US tariffs on Canadian exports. Today’s employment data release will be critical in determining near-term direction, with markets expecting weak numbers that could further pressure the loonie.
Central Bank Notes:
- The Council noted that U.S. tariff tensions have eased slightly following early progress in bilateral discussions, though the external trade environment remains fragile. Businesses continue to hold back on long-term investment, with the Bank highlighting that sustained clarity on U.S. trade policy is needed to restore confidence.
- The Bank acknowledged that uncertainty persists despite the softer U.S. tone, as incoming data show limited improvement in export orders. The manufacturing sector has stabilized but remains below pre-2024 output levels, reflecting weak global demand and cautious corporate spending.
- Canada’s economy showed tentative signs of recovery in early Q4, with GDP estimated to expand by 0.3% in October after two quarters of contraction. Mining and energy activity strengthened modestly, aided by steady crude demand, while goods exports posted a fractional gain.
- Service sector growth remained uneven, supported mainly by tourism-related and technology services. However, retail spending and household consumption were subdued, constrained by slower job creation and lingering consumer caution. The Bank judged overall momentum as fragile but improving marginally.
- Housing activity showed modest reacceleration in major urban markets as mortgage rates stabilized near record lows. Nonetheless, affordability pressures and stricter lending standards continue to cap overall resale volumes, leading to only a gradual recovery in the housing sector.
- Headline CPI inflation rose to 2.1% in October, reaching the Bank’s target for the first time in six months. Higher energy prices and a modest uptick in food and shelter costs drove the increase. Core inflation measures remained stable, suggesting underlying price pressures are contained.
- The Governing Council reiterated its data-dependent stance, indicating that the current policy rate remains appropriate amid tentative growth and balanced inflation risks. Officials noted that while additional stimulus is not ruled out, the emphasis has shifted toward monitoring the sustainability of the recovery rather than immediate rate adjustments.
- The next meeting is on 17 to 18 December 2025.
Next 24 Hours Bias
Medium Bearish
Oil
Key news events today
No major news event
What can we expect from Oil today?
Friday’s oil market faces a perfect storm of bearish pressures: massive US inventory builds, OPEC+ production increases despite pausing future hikes, surging Brazilian output, Libya’s expansion plans, Saudi price cuts signaling market weakness, disrupted Russian flows being absorbed by alternative suppliers, weak global demand growth, and economic uncertainty from the prolonged US government shutdown. While prices recovered slightly on Friday, the second consecutive weekly decline of approximately 2% reflects deep-seated market concerns about an emerging supply glut that could persist well into 2026.
Next 24 Hours Bias
Medium Bearish
The post IC Markets – Europe Fundamental Forecast | 07 November 2025 first appeared on IC Markets | Official Blog.
Ex-Dividend 6/11/2025
423166 November 5, 2025 16:39 ICMarkets Market News
The post Ex-Dividend 6/11/2025 first appeared on IC Markets | Official Blog.
Wednesday 5th November 2025: Technical Outlook and Review
423147 November 5, 2025 16:14 ICMarkets Market News
DXY (U.S. Dollar Index):
Potential Direction: Bullish
Overall momentum of the chart: Bearish
The price could fall toward the pivot and could make a short-term pullback toward this level before rising again toward the 1st resistance.
Pivot: 99.53
Supporting reasons: Identified as a pullback support, where renewed buying pressure could emerge to push the price higher.
1st support: 99.13
Supporting reasons: Identified as a pullback support, indicating a potential area where the price could again stabilize.
1st resistance: 100.49
Supporting reasons: Identified as an overlap resistance that aligns with the 161.8% Fibonacci extension, indicating a potential area that could halt any further upward movement
EUR/USD:
Potential Direction: Bearish
Overall momentum of the chart: Bearish
The price has already reacted off the pivot and may continue its bearish move toward the 1st support
Pivot: 1.1542
Supporting reasons: Identified as an overlap resistance, where selling pressures could intensify and potentially cap any upward retracement
1st support: 1.1418
Supporting reasons: Identified as a support that is supported by the 181.8% Fibonacci extension and the 161.8% Fibonacci projection, indicating a potential level where the price could stabilize once again.
1st resistance: 1.1603
Supporting reasons: Identified as a pullback resistance, indicating a potential level that could cap further upward movement.
EUR/JPY:
Potential Direction: Bullish
Overall momentum of the chart: Bullish
The price could see a short-term pullback toward the pivot before continuing its bearish move down toward the 1st support.
Pivot: 177.49
Supporting reasons: Identified as an overlap resistance, where selling pressures could intensify and potentially cap any upward retracement.
1st support: 174.93
Supporting reasons: Identified as a pullback support, indicating a potential area where the price could again stabilize.
1st resistance: 178.80
Supporting reasons: Identified as a swing high resistance that is supported by the 161.8% Fibonacci extension, indicating a potential level that could cap further upward movement.
EUR/GBP:
Potential Direction: Bullish
Overall momentum of the chart: Bullish
The price could see a short-term pullback toward the pivot before rising again toward the 1st resistance.
Pivot: 0.8749
Supporting reasons: Identified as a pullback support, where renewed buying pressure could emerge to push the price higher.
1st support: 0.8718
Supporting reasons: Identified as overlap support, indicating a potential area where the price could stabilize once more.
1st resistance: 0.8854
Supporting reasons: Identified as a resistance that is supported by the 161.8% Fibonacci extension, indicating a potential level that could cap further upward movement.
GBP/USD:
Potential Direction: Bearish
Overall momentum of the chart: Bullish
The price could see a short-term pullback toward the pivot before continuing its bearish move down toward the 1st support.
Pivot: 1.3159
Supporting reasons: Identified as an overlap resistance, where selling pressures could intensify and potentially cap any upward retracement.
1st support: 1.3020
Supporting reasons: Identified as a support that is supported by the 161.8% Fibonacci extension, indicating a potential area where the price could stabilize once more.
1st resistance: 1.3257
Supporting reasons: Identified as a pullback resistance, indicating a potential level that could halt further upward movement.
GBP/JPY:
Potential Direction: Bearish
Overall momentum of the chart: Bullish
The price has already reacted off the pivot and may continue its bearish move toward the 1st support
Pivot: 201.71
Supporting reasons: Identified as an overlap resistance, where selling pressures could intensify and potentially cap any upward retracement
1st support: 199.09
Supporting reasons: Identified as a pullback support that aligns with the 161.8% Fibonacci retracement, indicating a potential level where the price could stabilize once more.
1st resistance: 203.20
Supporting reasons: Identified as an overlap resistance, indicating a potential level that could halt further upward movement.
USD/CHF:
Potential Direction: Bullish
Overall momentum of the chart: Bearish
The price has already bounced off the pivot and may continue its bullish move toward the 1st resistance
Pivot: 0.8066
Supporting reasons: Identified as an overlap support, where renewed buying pressure could emerge to push the price higher.
1st support: 0.8009
Supporting reasons: Identified as an overlap support, indicating a potential level where the price could stabilize once again.
1st resistance: 0.8130
Supporting reasons: Identified as a resistance that is supported by the 127.2% Fibonacci extension, indicating a potential level that could cap further upward movement.
USD/JPY:
Potential Direction: Bullish
Overall momentum of the chart: Bullish
The price has already bounced off the pivot and may continue its bullish move toward the 1st resistance
Pivot: 153.25
Supporting reasons: Identified as an overlap support, where renewed buying pressure could emerge to push the price higher.
1st support: 151.96
Supporting reasons: Identified as a pullback support, indicating a strong area where buyers might return, and the price could stabilize once again.
1st resistance: 155.69
Supporting reasons: Identified as a resistance that is supported by the 161.8% Fibonacci extension. This level represents the next key area where upward movement could be capped amid increased selling pressure
USD/CAD:
Potential Direction: Bullish
Overall momentum of the chart: Bearish
The price could see a short-term pullback toward the pivot before rising again toward the 1st resistance.
Pivot: 1.4021
Supporting reasons: Identified as a pullback support, where renewed buying pressure could emerge to push the price higher.
1st support: 1.3970
Supporting reasons: Identified as a pullback support, indicating a key level where the price could stabilize once more.
1st resistance: 1.4133
Supporting reasons: Identified as a resistance that aligns with the 127.2% Fibonacci extension, making it a possible target for bullish advances and a level where some sellers could return to cap gains
AUD/USD:
Potential Direction: Bearish
Overall momentum of the chart: Bullish
The price could see a short-term pullback toward the pivot before continuing its bearish move down toward the 1st support.
Pivot: 0.6530
Supporting reasons: Identified as a pullback resistance, where selling pressures could intensify and potentially cap any upward retracement..
1st support: 0.6447
Supporting reasons: Identified as a swing low support, this area has provided strong support historically and may attract buying interest for a potential short-term bounce
1st resistance: 0.6560
Supporting reasons: Identified as an overlap resistance, indicating a potential area that could halt any further upward movement.
NZD/USD
Potential Direction: Bearish
Overall momentum of the chart: Bullish
The price could see a short-term pullback toward the pivot before continuing its bearish move down toward the 1st support.
Pivot: 0.5689
Supporting reasons: Identified as a pullback resistance, where selling pressures could intensify and potentially cap any upward retracement.
1st support: 0.5614
Supporting reasons: Identified as a support that is supported by the 161.8% Fibonacci extension, this area has provided strong support historically and may attract buying interest for a potential short-term bounce
1st resistance: 0.5760
Supporting reasons: Identified as a pullback resistance, indicating a potential area that could halt any further upward movement.
US30 (DJIA):
Potential Direction: Bullish
Overall momentum of the chart: Bullish
The price could see a short-term pullback toward the pivot before rising again toward the 1st resistance.
Pivot: 47,445.99
Supporting reasons: Identified as a pullback support that aligns with the 61.8% Fibonacci retracement, indicating a potential area where buying interest could pick up
1st support: 46,447.27
Supporting reasons: Identified as a pullback support, suggesting a potential area where the price could stabilize once again.
1st resistance: 48,048.01
Supporting reasons: Identified as a swing high resistance, indicating a potential area that could halt any further upward movement.
DE40 (DAX):
Potential Direction: Bearish
Overall momentum of the chart: Bullish
The price could see a short-term pullback toward the pivot before continuing its bearish move down toward the 1st support.
Pivot: 24,227.04
Supporting reasons: Identified as an overlap resistance, where selling pressures could intensify and potentially cap any upward retracement.
1st support: 23,714.81
Supporting reasons: Identified as an overlap support that aligns with the 61.8% Fibonacci retracement, indicating a key level where the price could stabilize once more.
1st resistance: 24,511.47
Supporting reasons: Identified as a pullback resistance, indicating a potential area that could halt any further upward movement.
US500 (S&P 500):
Potential Direction: Bearish
Overall momentum of the chart: Bullish
The price could see a short-term pullback toward the pivot before continuing its bearish move down toward the 1st support.
Pivot: 6,834.95
Supporting reasons: Identified as a pullback resistance, where selling pressures could intensify and potentially cap any upward retracement.
1st support: 6,696.60
Supporting reasons: Identified as a pullback support, indicating a potential level where the price could stabilize once again.
1st resistance: 6.919.84
Supporting reasons: Identified as a swing high resistance, indicating a potential area that could halt any further upward movement.
BTC/USD (Bitcoin):
Potential Direction: Bearish
Overall momentum of the chart: Bullish
The price could see a short-term pullback toward the pivot before continuing its bearish move down toward the 1st support.
Pivot: 104,974.80
Supporting reasons: Identified as a pullback resistance, where selling pressures could intensify and potentially cap any upward retracement.
1st support: 95,526.48
Supporting reasons: Identified as a support that is supported by the 161.8% Fibonacci extension, indicating a potential level where the price could stabilize once more.
1st resistance: 111,232.24
Supporting reasons: Identified as an overlap resistance, indicating a potential area that could halt any further upward movement.
ETH/USD (Ethereum):
Potential Direction: Bearish
Overall momentum of the chart: Bullish
The price could see a short-term pullback toward the pivot before continuing its bearish move down toward the 1st support.
Pivot: 3,690.07
Supporting reasons: Identified as a pullback resistance, where selling pressures could intensify and potentially cap any upward retracement.
1st support: 2,954.96
Supporting reasons: Identified as a support that is supported by the 161.8% Fibonacci projection, indicating a potential level where the price could stabilize once more.
1st resistance: 3,919.62
Supporting reasons: Identified as an overlap resistance, indicating a potential area that could halt any further upward movement.
WTI/USD (Oil):
Potential Direction: Bullish
Overall momentum of the chart: Bullish
The price has already bounced off the pivot and may continue its bullish move toward the 1st resistance
Pivot: 60.18
Supporting reasons: Identified as an overlap support that aligns with the 38.2% Fibonacci retracement, where renewed buying pressure could emerge to push the price higher.
1st support: 57.72
Supporting reasons: Identified as a pullback support that aligns with the 78.6% Fibonacci retracement, indicating a key level where the price could stabilize once more.
1st resistance: 63.15
Supporting reasons: Identified as an overlap resistance that aligns with the 61.8% Fibonacci retracement, indicating a potential area that could halt any further upward movement.
XAU/USD (GOLD):
Potential Direction: Bearish
Overall momentum of the chart: Bullish
The price could see a short-term pullback toward the pivot before continuing its bearish move down toward the 1st support.
Pivot: 3,990.98
Supporting reasons: Identified as a pullback resistance, where selling pressures could intensify and potentially cap any upward retracement.
1st support: 3,891.10
Supporting reasons: Identified as an overlap support that aligns closely with the 78.6% Fibonacci projection, indicating a key level where the price could stabilize once more.
1st resistance: 4,066.73
Supporting reasons: Identified as a pullback resistance, indicating a potential area that could halt any further upward movement.
The accuracy, completeness and timeliness of the information contained on this site cannot be guaranteed. IC Markets does not warranty, guarantee or make any representations, or assume any liability regarding financial results based on the use of the information in the site.
News, views, opinions, recommendations and other information obtained from sources outside of www.icmarkets.com, used in this site are believed to be reliable, but we cannot guarantee their accuracy or completeness. All such information is subject to change at any time without notice. IC Markets assumes no responsibility for the content of any linked site.
The fact that such links may exist does not indicate approval or endorsement of any material contained on any linked site. IC Markets is not liable for any harm caused by the transmission, through accessing the services or information on this site, of a computer virus, or other computer code or programming device that might be used to access, delete, damage, disable, disrupt or otherwise impede in any manner, the operation of the site or of any user’s software, hardware, data or property.
The post Wednesday 5th November 2025: Technical Outlook and Review first appeared on IC Markets | Official Blog.
Wednesday 5th November 2025: Asian Markets Plunge as Tech Rout Deepens and AI Bubble Fears Mount
423143 November 5, 2025 16:00 ICMarkets Market News
Global Markets:
- Asian Stock Markets : Nikkei down -3.32%, Shanghai Composite up 0.05%, Hang Seng down -0.45% ASX down -0.27%
- Commodities : Gold at $3,966.17 (0.14%), Silver at $47.289 (0.01%), Brent Oil at $64.29 (-0.23%), WTI Oil at $60.37 (-0.31%)
- Rates : US 10-year yield at 4.065, UK 10-year yield at 4.4210, Germany 10-year yield at 2.6518
News & Data:
- (NZD) Employment Change q/q 0.0% to 0.1% expected
- (NZD) Unemployment Rate 5.3% to 5.3% expected
Markets Update:
Asian stock markets are sharply lower on Wednesday, mirroring Wall Street’s steep overnight losses as concerns mount over a possible bursting of the global AI bubble. Japan and South Korea are leading declines, plunging nearly 5 percent each amid worries about stretched valuations in tech stocks. Goldman Sachs CEO David Solomon’s warning of a potential equity market correction within the next two years added to the bearish sentiment.
With the U.S. government shutdown extending to 35 days and delaying key economic data releases, traders now look to private indicators for clues on the economy. The ADP employment report, due later today, is expected to provide insight into labor market strength.
In Australia, the S&P/ASX 200 is down 0.4 percent, dragged by losses in mining, energy, and technology stocks. Miners like Fortescue and Mineral Resources are down nearly 4 percent each, while gold miners are also under pressure.
Japan’s Nikkei 225 has slumped 4.7 percent, weighed by sharp declines in tech heavyweights such as SoftBank, Advantest, and Tokyo Electron. Minutes from the Bank of Japan’s recent meeting indicated gradual economic recovery but hinted at policy normalization with reduced ETF holdings.
Elsewhere, South Korea, Taiwan, and Hong Kong are also lower. On Wall Street, the Nasdaq tumbled 2 percent and the S&P 500 shed 1.2 percent, while oil prices slipped on supply concerns.
Upcoming Events:
- 01:15 PM GMT – USD ADP Non-Farm Employment Change
- 03:00 PM GMT – USD ISM Services PMI
The post Wednesday 5th November 2025: Asian Markets Plunge as Tech Rout Deepens and AI Bubble Fears Mount first appeared on IC Markets | Official Blog.
IC Markets – Europe Fundamental Forecast | 05 November 2025
423142 November 5, 2025 16:00 ICMarkets Market News
IC Markets – Europe Fundamental Forecast | 05 November 2025
What happened in the Asia session?
Today’s Asia session was marked by a broad-based equity selloff, sharp NZD depreciation after adverse jobs data, and safe haven flows into JPY and USD. The selloff was triggered by profit-taking and concerns about stretched tech valuations. After a prolonged artificial intelligence-driven rally in the U.S. macro numbers, particularly out of New Zealand and China, reinforced bearish sentiment in local currencies and commodities, while global uncertainty kept risk aversion elevated across markets.
What does it mean for the Europe & US sessions?
Watch for sharp stock market swings triggered by valuation worries and big bank warnings of a correction; tech remains the focal point for volatility.Key U.S. economic releases (ADP employment and ISM Services PMI) are likely to set the tone for USD pairs and broader risk sentiment.Speeches by central bank officials could impact NZD, USD, and CAD price action, especially if commentary addresses policy outlook or economic risks.Stay alert to market reactions at the overlap between European and U.S. sessions, as this is typically the day’s peak for volatility and volume.
The Dollar Index (DXY)
Key news events today
ADP non-farm employment change (11:15 pm GMT)
ISM services PMI (3:00 pm GMT)
What can we expect from DXY today?
The US dollar is exhibiting significant strength, reaching five-month highs near 100 on the DXY as multiple factors converge. The Federal Reserve’s increasingly cautious stance on further rate cuts, with December probabilities dropping from 94% to 65%, has provided fundamental support for the greenback. Weak labor market data from the ADP report showing -137,000 jobs paradoxically strengthened the dollar through safe-haven flows rather than weakening it.
Central Bank Notes:
- The Federal Open Market Committee (FOMC) voted, by majority, to lower the federal funds rate target range by 25 basis points to 3.75%–4.00% at its October 28–29, 2025, meeting, marking the second consecutive cut following the 25 basis points reduction in September.
- The Committee maintained its long-term objectives of maximum employment and 2% inflation, noting that the labor market continues to soften, with modest job creation and an unemployment rate edging higher. In comparison, inflation remains above target at around 3.0%.
- Policymakers highlighted ongoing downside risks to economic growth, tempered by signs of resilient economic activity. September’s consumer price index (CPI) came in slightly lower than expected at 3.0% year-over-year, easing inflation pressure but still warranting vigilance given tariff-driven price effects.
- Economic activity expanded modestly in the third quarter, with GDP growth estimates around 1.0% annualized; however, uncertainty remains elevated amid persistent global trade tensions and the U.S. government shutdown, which is impacting data availability.
- The updated Summary of Economic Projections reflects an anticipated unemployment rate averaging approximately 4.5% for 2025, with headline and core personal consumption expenditures (PCE) inflation projections holding near 3.0%, indicating a slow easing path ahead.
- The Committee emphasized its flexible, data-dependent approach and underscored that future policy adjustments will be guided by incoming labor market and inflation data. As in prior meetings, there was dissent, including one member advocating a more aggressive 50-basis-point cut.
- The FOMC announced the planned conclusion of its balance sheet reduction (quantitative tightening) program, intending to cease runoff in the near term to maintain market stability, with Treasury redemption caps held steady at $5 billion per month and agency mortgage-backed securities caps at $35 billion.
- The next meeting is scheduled for 9 to 10 December 2025.
Next 24 Hours Bias
Medium Bullish
Gold (XAU)
Key news events today
ADP non-farm employment change (11:15 pm GMT)
ISM services PMI (3:00 pm GMT)
What can we expect from Gold today?
Gold faces near-term headwinds on Wednesday, November 5, 2025, as the market digests reduced Federal Reserve rate cut expectations, dollar strength near three-month highs, and easing US-China trade tensions. The metal is consolidating around $3,930-$4,000 after retreating from its October record high of $4,381. China’s removal of gold tax incentives adds additional pressure on consumer demand. However, structural support remains intact through robust central bank buying (220 tonnes in Q3), gold’s role as an inflation hedge amid elevated US inflation at 3.0%, and strong year-to-date ETF inflows of $38 billion through mid-2025.
Next 24 Hours Bias
Weak bearish
The Euro (EUR)
Key news events today
No major news event
What can we expect from EUR today?
The euro faces mounting headwinds on Wednesday, November 5, 2025, trading at three-month lows near 1.1485 against the dollar. While the eurozone economy shows resilience—with Q3 GDP growth of 0.2%, stabilizing manufacturing activity, and robust services expansion—the currency is caught between a strengthening US dollar fueled by reduced Fed rate cut expectations and domestic challenges, including persistent services inflation at 3.4%, sharply declining exports, and political uncertainty in France.
Central Bank Notes:
- The Governing Council of the ECB kept the three key interest rates unchanged at its 30 October 2025 meeting. The main refinancing rate remains at 2.15%, the marginal lending facility at 2.40%, and the deposit facility at 2.00%. This decision reflects policymakers’ assessment that the current monetary stance remains consistent with medium-term price stability, while incoming data confirm a gradual return of inflation towards the target.
- Recent indicators point to stable price dynamics. Headline inflation remains near the 2% mark, with energy prices contained and food inflation easing slightly after earlier supply bottlenecks. Wage growth continues to moderate, contributing to the slowdown in domestic cost pressures. The ECB reiterated its commitment to a data-driven, meeting-by-meeting approach and emphasized flexibility amid uncertain global financial conditions.
- Eurosystem staff projections have not been materially altered since September. Headline inflation averages remain at 2.0% for 2025, 1.8% for 2026, and 2.0% for 2027. Recent softening in producer prices and subdued pipeline pressures suggest limited upside risks to inflation, though geopolitical tensions and potential commodity shocks continue to pose uncertainties to the outlook.
- Euro area GDP growth remains on track with earlier forecasts, projected at 1.1% for 2025, 1.1% for 2026, and 1.4% for 2027. Forward-looking indicators, including PMIs and industrial sentiment surveys, signal some stabilization in activity following weakness in the third quarter. Public investment and recovering export activity are expected to offset softer private sector demand in the near term.
- The labor market remains resilient, with unemployment rates at multi-decade lows and participation rates strong. Real income growth continues to support household spending, even as consumption growth normalizes from earlier highs. Financing conditions remain favorable, aided by stable banking sector liquidity and improved credit demand among small and medium-sized firms.
- Business sentiment remains mixed, reflecting lingering uncertainty over global trade policy and the path of US tariffs. However, easing supply chain costs and improved export competitiveness due to softer exchange rates are providing some relief to manufacturing and external-oriented sectors.
- The Governing Council reaffirmed that future decisions will depend on an integrated assessment of incoming data—covering inflation trends, financial conditions, and the state of policy transmission. The Council emphasized that no pre-set path for rates exists; keeping all options open should the economic outlook shift markedly.
- Balance sheet reduction continues smoothly, with holdings under the APP and PEPP declining as reinvestments have ceased. The ECB confirmed that the pace of portfolio runoff remains in line with its previously communicated normalization plan, supporting a gradual withdrawal of monetary accommodation in a predictable manner.
- The next meeting is on 17 to 18 December 2025
Next 24 Hours Bias
Medium Bearish
The Swiss Franc (CHF)
Key news events today
No major news event
What can we expect from CHF today?
The Swiss franc faces conflicting pressures in early November 2025: weak domestic inflation data (0.1% year-over-year) and dovish SNB commentary have weakened the currency to three-week lows near 0.81 per USD, while punishing 39% US tariffs continue to weigh on economic growth prospects. The SNB maintains its 0% policy rate, with officials suggesting rates are appropriately positioned, though negative rate speculation persists. Trade negotiations with the US continue, with President Trump meeting Swiss representatives on November 4, though no breakthrough has been announced. Economic growth forecasts have been slashed to below 1% for 2026, and the franc’s safe-haven appeal has temporarily diminished amid improved global risk sentiment.
Central Bank Notes:
- The SNB maintained its key policy rate at 0% during its meeting on 25 September 2025, pausing a sequence of six consecutive rate cuts as inflation stabilized and the Swiss franc remained firm.
- Recent data showed a modest rebound in inflation, with Swiss consumer prices rising 0.2% year-on-year in August after staying above zero for three consecutive months; this helped alleviate fears of deflation that were mounting earlier in the year.
- The conditional inflation forecast remains broadly unchanged from June: headline inflation is expected to average 0.2% in 2025, 0.5% in 2026, and 0.7% in 2027. The risk of a negative rate move has diminished for now, but the SNB retains flexibility should inflationary pressures weaken again.
- The global economic outlook has deteriorated further, weighed down by heightened trade tensions—especially with the U.S.—and ongoing uncertainty in key Swiss export markets.
- Swiss GDP growth moderated in Q2 after a strong Q1 boosted by front-loaded U.S. exports. The SNB expects growth to slow and remain subdued, with forecasted GDP expansion between 1% and 1.5% in both 2025 and 2026.
- Labor market sentiment in the Swiss industrial sector has softened on concerns over export competitiveness and potential adjustments to production, but the overall growth outlook stays broadly unchanged
- The SNB reiterated its readiness to respond as needed if deflation risks re-emerge, emphasizing its commitment to medium-term price stability and a robust, transparent communication policy, with the introduction of more detailed monetary policy minutes beginning in October.
- The next meeting is on 11 December 2025.
Next 24 Hours Bias
Weak Bearish
The Pound (GBP)
Key news events today
No major event
What can we expect from GBP today?
The pound faces a confluence of negative factors: fiscal uncertainty ahead of a tax-raising budget, a closely divided Bank of England that may resume rate cuts, persistent but cooling inflation, weakening economic growth, and a resilient US dollar. With the critical BoE decision on Thursday and the Autumn Budget on November 26, sterling is likely to remain volatile and vulnerable to further downside in the near term. Market participants are pricing in increased rate cut expectations through December, with approximately 60-68% odds of a cut by year-end, adding to the currency’s challenges.
Central Bank Notes:
- The Bank of England’s Monetary Policy Committee (MPC) voted on 18 September 2025 by a majority (expected split likely 7–2 or 6–3) to hold the Bank Rate steady at 4.00%, following the rate cut in August. Most members cited persistent inflation and mixed indicators on growth and employment, while a minority favored further easing due to the cooling labor market and subdued GDP growth.
- The Committee decided to decrease the pace of quantitative tightening, planning to reduce the stock of UK government bond purchases by £67.5 billion over the next 12 months, instead of the prior £100 billion pace, with the gilt balance now standing at nearly £558 billion. This reflects increased volatility in bond markets and a shift to a more gradual approach.
- Headline inflation rose unexpectedly to 3.8% in July and is projected at 4% for September, above the Bank’s 2% target. Price pressures are driven by regulated energy costs and ongoing food price increases. While previous disinflation has been substantial, core inflation remains elevated and sticky.
- The MPC expects headline inflation to remain above target through Q4, with a resumption of the downward trend projected for early 2026 as energy and regulated price pressures abate. The Committee remains watchful for signs of persistent inflation despite previous policy tightening.
- UK GDP growth is stagnant, with business and consumer activity subdued. Recent labor market data show rising unemployment rates (now at 4.7%) and stabilizing wage growth (holding near 5%), indicating slack but continued wage price pressure. The Committee remains cautious amid lackluster demand and soft survey sentiment.
- Pay growth and employment indicators have moderated further, alongside confirmation from business surveys that pay settlements are slowing. The Committee expects wage growth to decelerate significantly through Q4 and the rest of 2025.
- Global uncertainty persists due to volatile energy prices, supply chain disruptions linked to Middle East conflicts, and renewed trade tensions. The MPC remains vigilant in tracking transmission of external cost/wage shocks to UK inflation.
- Risks to inflation are considered two-sided. While subdued domestic growth and softening labor activity suggest scope for easing, persistent inflation requires caution. The MPC anticipates a slow, gradual reduction path in rates, continuing its data-dependent approach with careful adjustment as warranted by economic developments.
- The Committee’s bias remains toward maintaining a restrictive monetary policy stance until firmer evidence emerges that inflation will return sustainably to the 2% target. All future decisions will remain highly data dependent, with a strong emphasis on evolving demand, inflation expectations, costs, and labor market conditions.
- The next meeting is on 6 November 2025.
Next 24 Hours Bias
Medium Bearish
The Canadian Dollar (CAD)
Key news events today
BOC Gov Macklem speaks (9:30 pm GMT)
What can we expect from CAD today?
The Canadian dollar faces a confluence of bearish pressures. The currency is trading near seven-month lows against the U.S. dollar, driven by U.S. trade tariffs causing economic contraction, a dovish Bank of Canada that has likely ended its rate-cutting cycle at 2.25%, widening interest rate differentials favoring the USD, weak oil prices around $60 per barrel, and a massive federal budget deficit driven by tariff-related economic damage.
Central Bank Notes:
- The Council noted that U.S. tariff tensions have eased slightly following early progress in bilateral discussions, though the external trade environment remains fragile. Businesses continue to hold back on long-term investment, with the Bank highlighting that sustained clarity on U.S. trade policy is needed to restore confidence.
- The Bank acknowledged that uncertainty persists despite the softer U.S. tone, as incoming data show limited improvement in export orders. The manufacturing sector has stabilized but remains below pre-2024 output levels, reflecting weak global demand and cautious corporate spending.
- Canada’s economy showed tentative signs of recovery in early Q4, with GDP estimated to expand by 0.3% in October after two quarters of contraction. Mining and energy activity strengthened modestly, aided by steady crude demand, while goods exports posted a fractional gain.
- Service sector growth remained uneven, supported mainly by tourism-related and technology services. However, retail spending and household consumption were subdued, constrained by slower job creation and lingering consumer caution. The Bank judged overall momentum as fragile but improving marginally.
- Housing activity showed modest reacceleration in major urban markets as mortgage rates stabilized near record lows. Nonetheless, affordability pressures and stricter lending standards continue to cap overall resale volumes, leading to only a gradual recovery in the housing sector.
- Headline CPI inflation rose to 2.1% in October, reaching the Bank’s target for the first time in six months. Higher energy prices and a modest uptick in food and shelter costs drove the increase. Core inflation measures remained stable, suggesting underlying price pressures are contained.
- The Governing Council reiterated its data-dependent stance, indicating that the current policy rate remains appropriate amid tentative growth and balanced inflation risks. Officials noted that while additional stimulus is not ruled out, the emphasis has shifted toward monitoring the sustainability of the recovery rather than immediate rate adjustments.
- The next meeting is on 17 to 18 December 2025.
Next 24 Hours Bias
Medium Bearish
Oil
Key news events today
EIA crude oil inventories (2:30 pm GMT)
What can we expect from Oil today?
Wednesday’s oil market is characterized by extended losses as crude prices struggle under the weight of a massive US inventory build, the strongest in months. Despite OPEC+’s efforts to support the market through production pauses, oversupply concerns dominate alongside a strengthening dollar and weakening manufacturing data. While geopolitical risks from Russian sanctions and Ukrainian infrastructure attacks remain, they have been insufficient to offset the bearish fundamental backdrop. With analysts forecasting continued inventory builds and subdued demand growth, particularly from China, the outlook for oil prices remains under pressure as 2025 progresses.
Next 24 Hours Bias
Medium Bearish
The post IC Markets – Europe Fundamental Forecast | 05 November 2025 first appeared on IC Markets | Official Blog.
IC Markets – Asia Fundamental Forecast | 05 November 2025
423141 November 5, 2025 15:39 ICMarkets Market News
IC Markets – Asia Fundamental Forecast | 05 November 2025
What happened in the U.S. session?
The U.S. session was marked by risk-off sentiment as top bank leaders flagged the possibility of a correction in equities, leading to selloffs in both stocks and select high-flying tech names. Forex volatility is concentrated in major dollar pairs, driven by anticipation for upcoming economic releases and broader shifts in market mood. U.S. stock indices to retreat from recent highs. Additionally, the tech sector was in focus as Palantir shares dropped sharply in European trading despite strong quarterly results, illustrating the market’s sensitivity to valuation concerns and profit-taking.
What does it mean for the Asia Session?
The US dollar remains supported by strong labor market expectations and central bank division, with Asian currencies sensitive to local macro and central bank developments.Asian equity markets are responding to global mixed cues, tech sector optimism, and local economic uncertainty, especially in Japan and Australia.Gold and oil traders should watch for changes in supply decisions, Fed commentary, and ongoing USD strength.
The Dollar Index (DXY)
Key news events today
ADP non-farm employment change (11:15 pm GMT)
ISM services PMI (3:00 pm GMT)
What can we expect from DXY today?
The US Dollar traded strongly and remained near three-month highs on Tuesday, supported by cautious signals from Federal Reserve officials who tempered expectations for further interest rate cuts. Market participants reacted to remarks from Fed Governor Lisa Cook and Chicago Fed President Austan Goolsbee, who both indicated concerns about inflation and did not fully back another rate cut in December. The DXY (Dollar Index) held above 99.5, with a slight decline of 0.06% from the previous session, but is up 1.74% over the past month.
Central Bank Notes:
- The Federal Open Market Committee (FOMC) voted, by majority, to lower the federal funds rate target range by 25 basis points to 3.75%–4.00% at its October 28–29, 2025, meeting, marking the second consecutive cut following the 25 basis points reduction in September.
- The Committee maintained its long-term objectives of maximum employment and 2% inflation, noting that the labor market continues to soften, with modest job creation and an unemployment rate edging higher. In comparison, inflation remains above target at around 3.0%.
- Policymakers highlighted ongoing downside risks to economic growth, tempered by signs of resilient economic activity. September’s consumer price index (CPI) came in slightly lower than expected at 3.0% year-over-year, easing inflation pressure but still warranting vigilance given tariff-driven price effects.
- Economic activity expanded modestly in the third quarter, with GDP growth estimates around 1.0% annualized; however, uncertainty remains elevated amid persistent global trade tensions and the U.S. government shutdown, which is impacting data availability.
- The updated Summary of Economic Projections reflects an anticipated unemployment rate averaging approximately 4.5% for 2025, with headline and core personal consumption expenditures (PCE) inflation projections holding near 3.0%, indicating a slow easing path ahead.
- The Committee emphasized its flexible, data-dependent approach and underscored that future policy adjustments will be guided by incoming labor market and inflation data. As in prior meetings, there was dissent, including one member advocating a more aggressive 50-basis-point cut.
- The FOMC announced the planned conclusion of its balance sheet reduction (quantitative tightening) program, intending to cease runoff in the near term to maintain market stability, with Treasury redemption caps held steady at $5 billion per month and agency mortgage-backed securities caps at $35 billion.
- The next meeting is scheduled for 9 to 10 December 2025.
Next 24 Hours Bias
Medium Bullish
Gold (XAU)
Key news events today
ADP non-farm employment change (11:15 pm GMT)
ISM services PMI (3:00 pm GMT)
What can we expect from Gold today?
Gold is undergoing a healthy correction after its extraordinary 2025 rally, pressured by dollar strength and reduced Fed rate cut expectations following Powell’s hawkish stance. However, structural support remains firmly in place through accelerating central bank purchases, recovering ETF inflows after multi-year outflows, and sustained investment demand despite softening jewelry consumption in China and India. While near-term volatility is expected as markets digest upcoming U.S. economic data, the fundamental case for gold remains intact, supported by dedollarization trends, geopolitical uncertainties, and its traditional role as a safe-haven asset during periods of monetary policy uncertainty and financial system stress.
Next 24 Hours Bias
Weak Bearish
The Australian Dollar (AUD)
Key news events today
No major news event
What can we expect from AUD today?
The Australian dollar faces headwinds from multiple directions on November 4, 2025. The RBA’s decision to hold rates amid stubborn inflation has delayed rate cut expectations to 2026, while the Fed’s cautious stance on further easing has strengthened the USD. Despite positive developments in US-China trade relations and resilient commodity prices, the AUD continues its fifth consecutive day of losses, trading near 0.6495.
Central Bank Notes:
- The Reserve Bank of Australia held its cash rate steady at 3.60% at the November policy meeting, citing persistent inflationary pressures and lingering uncertainties in both domestic and global outlooks. This is the third consecutive pause following the cut in August.
- Policymakers remain alert to renewed inflation momentum. After a temporary uptick in September’s CPI, trimmed mean inflation for Q3 stands at 3.0%, above the intended 2–3% band. The RBA now anticipates that core inflation will stay above target until at least mid-2026, delaying any hopes of further easing.
- Headline CPI climbed by 3.2% in the year to September 2025, driven by resilient housing (+2.5%) and insurance costs, while discretionary goods inflation is subdued. The transition to monthly CPI reporting from November will improve the accuracy of inflation tracking.
- Domestic demand remains firm, particularly in services and housing, while manufacturing and discretionary retail continue to lag. Household incomes have stabilized, but high borrowing costs and elevated rents are constraining consumption and risking a slowdown in Q1 2026.
- Labor market tightness persists, though job growth has moderated. Underutilization edged higher. Wage growth is plateauing, but weak productivity is keeping unit labor costs elevated—a medium-term risk that remains central to the Board’s narrative.
- The RBA highlights geopolitical tensions and volatile commodity markets as primary global risks, against a backdrop of modest upward revisions to world growth forecasts. The Board stresses that its stance remains “cautious and data-dependent,” with ongoing vigilance on inflation, labor, and spending trends.
- Monetary policy remains mildly restrictive, balancing progress on price stability against vulnerabilities in household demand and global outlook. Board communications reaffirm a dual mandate: price stability and full employment, while underscoring readiness to respond should risks materialize sharply.
- Analysts generally expect the cash rate to remain at current levels through early 2026, with only modest cuts possible later in the year if inflation moderates. The new monthly CPI release (first full edition Nov 2025) will be watched closely for timely signals on price trends.
- The next meeting is on 9 December 2025.
Next 24 Hours Bias
Weak Bullish
The Kiwi Dollar (NZD)
Key news events today
RBNZ press conference (12:00 am GMT)
What can we expect from NZD today?
Persistent weakness in China’s manufacturing sector is affecting New Zealand’s largest export market, policy divergence with other central banks (RBA holding steady while RBNZ continues cutting), and technical deterioration with NZD/USD approaching critical support at 0.5685. US Dollar strength ahead of key employment data, six consecutive dairy auction declines totaling -10%+ since August, and upcoming RBNZ press conference with markets pricing 90% chance of another 25bp cut on November 26.
Central Bank Notes:
- The Monetary Policy Committee (MPC) agreed to cut the Official Cash Rate (OCR) by 50 basis points to 2.50% on 8 October 2025, exceeding market expectations for a smaller 25-basis-point reduction and signaling a stronger commitment to reviving growth.
- The decision was reached by consensus, marking a shift from previous split votes, and reflected policymakers’ shared view that sustained economic weakness and persistent disinflationary pressures required a more front-loaded policy response.
- Annual consumer price inflation stood at 2.7% in the June quarter and is seen nearing 3% for the September quarter—above the 2% midpoint but within the 1–3% target range. Despite high near-term readings, the MPC projects inflation will return toward 2% by the first half of 2026 as spare capacity and moderating tradables curb price momentum.
- Policymakers acknowledged that domestic demand remains weak, with household spending, business investment, and construction activity under pressure. While still elevated, services inflation is expected to ease gradually as wage growth slows and unemployment edges higher.
- Financial conditions have eased with expectations as wholesale and retail borrowing rates adjust to lower policy settings. Bank lending data indicate a modest uptick in mortgage approvals, though broader credit demand remains subdued.
- GDP growth stalled in the middle of 2025, with high-frequency indicators showing continued weakness into the third quarter. A combination of elevated costs for essentials and falling savings continues to restrain household consumption, while global trade frictions weigh on business sentiment.
- The MPC noted that global uncertainty—particularly from US trade regulation changes and soft Chinese demand—continues to pose downside risks to export sectors, though these are partly offset by a weaker New Zealand dollar improving competitiveness.
- Subject to data confirming a sustained soft patch in activity and moderating inflation pressures, the MPC signaled further scope to reduce the OCR toward 2.25% at its next meeting on 26 November 2025, consistent with current market and Westpac forecasts.
- The next meeting is on 26 November 2025.
Next 24 Hours Bias
Weak Bearish
The Japanese Yen (JPY)
Key news events today
No major news events
What can we expect from JPY today?
The Japanese yen faces significant headwinds from diverging U.S.-Japan monetary policies, with the BoJ maintaining its cautious stance despite inflation remaining above target. While Tokyo inflation accelerated in October and nominal wages hit record highs, real purchasing power continues declining, presenting challenges for the new Takaichi administration. Government officials have intensified verbal intervention warnings as USD/JPY approaches nine-month highs, though fundamental support for dollar strength persists.
Central Bank Notes:
- The Policy Board of the Bank of Japan met on 30–31 October and, by a clear majority vote, decided to maintain its key monetary policy approach for the upcoming period.
- The BOJ will continue to encourage the uncollateralized overnight call rate to remain at around 0.5%, in line with the prior stance.
- The gradual quarterly reduction in monthly outright purchases of Japanese Government Bonds (JGBs) remains intact, with amounts unchanged from the previous schedule. Purchases are set to decrease by about ¥400 billion per quarter through March 2026, shifting to about ¥200 billion per quarter from April to June 2026, and targeting a ¥2 trillion purchase level for Q1 2027. The bank reaffirmed its intention to maintain flexibility, with readiness to respond if market conditions warrant an adjustment.
- Japan’s economy continues to show moderate recovery, primarily led by solid capital expenditures, although export growth and corporate activity remain restrained by external demand uncertainty and the ongoing effects of U.S. trade policies.
- Annual headline inflation (excluding fresh food) accelerated to 2.9% year-on-year in September, marking the first uptick in four months and staying above the BOJ’s 2% target. Broad-based inflation persists, with food and energy cost pressures, but wage growth continues to support household consumption. Input cost pressures from the earlier surge in imports eased slightly.
- Short-term inflation momentum could moderate as food-price hikes ease, though rent, healthcare, and service-sector price increases tied to labor shortages provide support. Firms and households maintain a gradual upward drift in inflation expectations.
- For the near term, BOJ projects growth below trend as external demand stays subdued and corporate investment plans remain cautious. Still, accommodative financial conditions and steady gains in real labor income will underpin domestic consumption.
- Over the medium term, as overseas economies recover and trade conditions normalize, Japan’s growth potential should improve. Persistent labor market tightness, higher wage settlements, and rising medium- to long-term inflation expectations are expected to keep core inflation on a gradual upward trajectory, converging toward the 2% price stability target later in the forecast horizon.
- The next meeting is scheduled for 18 to 19 December 2025.
Next 24 Hours Bias
Medium Bearish
Oil
Key news events today
EIA crude oil inventories (2:30 pm GMT)
What can we expect from Oil today?
Oil prices retreated as markets digested multiple bearish signals despite OPEC+’s decision to pause Q1 2026 production increases. The combination of a strengthening dollar, weak US manufacturing data pointing to subdued demand, and persistent oversupply concerns outweighed supportive factors, including US sanctions on Russian oil giants and Ukrainian attacks on Russian infrastructure. With WTI testing the critical $60 support level and Brent below $65, markets appear increasingly focused on the structural oversupply developing for 2026, while OPEC+’s production pause signals the group’s own concerns about market balance.
Next 24 Hours Bias
Medium Bullish
The post IC Markets – Asia Fundamental Forecast | 05 November 2025 first appeared on IC Markets | Official Blog.