Articles
Monday 3rd November 2025: Technical Outlook and Review
423019 November 3, 2025 16:05 ICMarkets Market News
DXY (U.S. Dollar Index):
Potential Direction: Bullish
Overall momentum of the chart: Bearish
The price has already bounced off the pivot and may continue its bullish move toward the 1st resistance
Pivot: 98.59
Supporting reasons: Identified as an overlap support, where renewed buying pressure could emerge to push the price higher.
1st support: 96.64
Supporting reasons: Identified as a swing low support, indicating a potential area where the price could again stabilize.
1st resistance: 100.83
Supporting reasons: Identified as an overlap resistance that aligns closely with the 38.2% Fibonacci retracement and the 100% Fibonacci projection, indicating a potential area that could halt any further upward movement
EUR/USD:
Potential Direction: Bearish
Overall momentum of the chart: Bullish
The price has already reacted off the pivot and may continue its bearish move toward the 1st support
Pivot: 1.1735
Supporting reasons: Identified as an overlap resistance that aligns with the 50% Fibonacci retracement, where selling pressures could intensify and potentially cap any upward retracement
1st support: 1.1192
Supporting reasons: Identified as a pullback support that aligns with the 127.2% Fibonacci projection and the 38.2% Fibonacci retracement, indicating a potential level where the price could stabilize once again.
1st resistance: 1.1920
Supporting reasons: Identified as a swing high resistance, indicating a potential level that could cap further upward movement.
EUR/JPY:
Potential Direction: Bullish
Overall momentum of the chart: Bullish
The price has already bounced off the pivot and may continue its bullish move toward the 1st resistance
Pivot: 175.06
Supporting reasons: Identified as an overlap support, where renewed buying pressure could emerge to push the price higher.
1st support: 170.43
Supporting reasons: Identified as an overlap support, indicating a potential area where the price could again stabilize.
1st resistance: 179.83
Supporting reasons: Identified as a resistance that is supported by the 161.8% Fibonacci extension, indicating a potential level that could cap further upward movement.
EUR/GBP:
Potential Direction: Bullish
Overall momentum of the chart: Bullish
The price could make a short-term pullback toward the pivot before rising again toward the 1st resistance
Pivot: 0.8744
Supporting reasons: Identified as a pullback support, where renewed buying pressure could emerge to push the price higher.
1st support: 0.8607
Supporting reasons: Identified as an overlap support, indicating a potential area where the price could stabilize once more.
1st resistance: 0.8842
Supporting reasons: Identified as a resistance that is supported by the 127.2% Fibonacci extension, indicating a potential level that could cap further upward movement.
GBP/USD:
Potential Direction: Bearish
Overall momentum of the chart: Bullish
The price could see a short-term pullback toward the pivot before continuing its bearish move down toward the 1st support.
Pivot: 1.3296
Supporting reasons: Identified as a pullback resistance, where selling pressures could intensify and potentially cap any upward retracement.
1st support: 1.3002
Supporting reasons: Identified as a pullback support that aligns with the 100% Fibonacci projection, indicating a potential area where the price could stabilize once more.
1st resistance: 1.3740
Supporting reasons: Identified as a swing high resistance, indicating a potential level that could halt further upward movement.
GBP/JPY:
Potential Direction: Bullish
Overall momentum of the chart: Bullish
The price could make a short-term pullback toward the pivot before rising again toward the 1st resistance
Pivot: 199.59
Supporting reasons: Identified as a pullback support, where renewed buying pressure could emerge to push the price higher.
1st support: 195.51
Supporting reasons: Identified as an overlap support, indicating a potential level where the price could stabilize once more.
1st resistance: 205.33
Supporting reasons: Identified as an overlap resistance, indicating a potential level that could halt further upward movement.
USD/CHF:
Potential Direction: Bullish
Overall momentum of the chart: Bearish
The price could make a short-term pullback toward the pivot before rising again toward the 1st resistance
Pivot: 0.7986
Supporting reasons: Identified as a pullback support, where renewed buying pressure could emerge to push the price higher.
1st support: 0.7872
Supporting reasons: Identified as a swing low support, indicating a potential level where the price could stabilize once again.
1st resistance: 0.8197
Supporting reasons: Identified as an overlap resistance that aligns with the 161.8% Fibonacci extension, indicating a potential level that could cap further upward movement.
USD/JPY:
Potential Direction: Bullish
Overall momentum of the chart: Bullish
The price could make a short-term pullback toward the pivot before rising again toward the 1st resistance
Pivot: 151.18
Supporting reasons: Identified as a pullback support, where renewed buying pressure could emerge to push the price higher.
1st support: 148.83
Supporting reasons: Identified as a pullback support, indicating a strong area where buyers might return, and the price could stabilize once again.
1st resistance: 156.25
Supporting reasons: Identified as an overlap resistance that aligns with the 161.8% Fibonacci extension. This level represents the next key area where upward movement could be capped amid increased selling pressure
USD/CAD:
Potential Direction: Bullish
Overall momentum of the chart: Bearish
The price has already bounced off the pivot and may continue its bullish move toward the 1st resistance
Pivot: 1.3908
Supporting reasons: Identified as an overlap support that aligns with the 50% Fibonacci retracement, where renewed buying pressure could emerge to push the price higher.
1st support: 1.3742
Supporting reasons: Identified as an overlap support, indicating a key level where the price could stabilize once more.
1st resistance: 1.4166
Supporting reasons: Identified as a pullback resistance that aligns with the 61.8% Fibonacci retracement, making it a possible target for bullish advances and a level where some sellers could return to cap gains
AUD/USD:
Potential Direction: Bearish
Overall momentum of the chart: Bullish
The price could trigger a bearish breakout of the pivot before continuing its bearish move down toward the 1st support.
Pivot: 0.6532
Supporting reasons: Identified as a pullback resistance, where selling pressures could intensify and potentially cap any upward retracement.
1st support: 0.6328
Supporting reasons: Identified as a pullback support that aligns with the 161.8% Fibonacci extension, this area has provided strong support historically and may attract buying interest for a potential short-term bounce
1st resistance: 0.6681
Supporting reasons: Identified as a swing high resistance, indicating a potential area that could halt any further upward movement.
NZD/USD
Potential Direction: Bearish
Overall momentum of the chart: Bearish
The price could see a short-term pullback toward the pivot before continuing its bearish move down toward the 1st support.
Pivot: 0.5758
Supporting reasons: Identified as a pullback resistance, where selling pressures could intensify and potentially cap any upward retracement.
1st support: 0.5542
Supporting reasons: Identified as a swing low support that aligns with the 161.8% Fibonacci projection, this area has provided strong support historically and may attract buying interest for a potential short-term bounce
1st resistance: 0.5847
Supporting reasons: Identified as an overlap resistance, indicating a potential area that could halt any further upward movement.
US30 (DJIA):
Potential Direction: Bullish
Overall momentum of the chart: Bullish
The price could make a short-term pullback toward the pivot before rising again toward the 1st resistance
Pivot: 46,841.88
Supporting reasons: Identified as a pullback support, where renewed buying pressure could emerge to push the price higher.
1st support: 45,643.90
Supporting reasons: Identified as an overlap support, suggesting a potential area where the price could stabilize once again.
1st resistance: 50,240.06
Supporting reasons: Identified as a resistance that is supported by the 161.8% Fibonacci extension, indicating a potential area that could halt any further upward movement.
DE40 (DAX):
Potential Direction: Bullish
Overall momentum of the chart: Bullish
The price could make a short-term pullback toward the pivot before rising again toward the 1st resistance
Pivot: 23,712.00
Supporting reasons: Identified as an overlap support that aligns with the 61.8% Fibonacci retracement, where renewed buying pressure could emerge to push the price higher.
1st support: 23,145.40
Supporting reasons: Identified as an overlap support, indicating a key level where the price could stabilize once more.
1st resistance: 24,624.84
Supporting reasons: Identified as a swing high resistance, indicating a potential area that could halt any further upward movement.
US500 (S&P 500):
Potential Direction: Bullish
Overall momentum of the chart: Bullish
The price has already bounced off the pivot and may continue its bullish move toward the 1st resistance
Pivot: 6,505.98
Supporting reasons: Identified as an overlap support, where renewed buying pressure could emerge to push the price higher.
1st support: 6,141.15
Supporting reasons: Identified as a pullback support, indicating a potential level where the price could stabilize once again.
1st resistance: 6,978.39
Supporting reasons: Identified as a resistance that is supported by the 161.8% Fibonacci extension, indicating a potential area that could halt any further upward movement.
BTC/USD (Bitcoin):
Potential Direction: Bearish
Overall momentum of the chart: Bullish
The price could see a short-term pullback toward the pivot before continuing its bearish move down toward the 1st support.
Pivot: 117,334.88
Supporting reasons: Identified as a pullback resistance that aligns with the 61.8% Fibonacci retracement, where selling pressures could intensify and potentially cap any upward retracement.
1st support: 99,932.19
Supporting reasons: Identified as an overlap support that aligns with the 50% Fibonacci retracement, indicating a potential level where the price could stabilize once more.
1st resistance: 125,853.86
Supporting reasons: Identified as a swing high resistance, indicating a potential area that could halt any further upward movement.
ETH/USD (Ethereum):
Potential Direction: Bearish
Overall momentum of the chart: Bullish
The price has already reacted off the pivot and may continue its bearish move toward the 1st support
Pivot: 4,232.33
Supporting reasons: Identified as an overlap resistance that aligns with the 50% Fibonacci retracement, where selling pressures could intensify and potentially cap any upward retracement
1st support: 3,467.65
Supporting reasons: Identified as an overlap support, indicating a potential level where the price could stabilize once more.
1st resistance: 4,846.95
Supporting reasons: Identified as a swing high resistance, indicating a potential area that could halt any further upward movement.
WTI/USD (Oil):
Potential Direction: Bullish
Overall momentum of the chart: Bullish
The price has already bounced off the pivot and may continue its bullish move toward the 1st resistance
Pivot: 60.16
Supporting reasons: Identified as an overlap support, where renewed buying pressure could emerge to push the price higher.
1st support: 54.92
Supporting reasons: Identified as a swing low support, indicating a key level where the price could stabilize once more.
1st resistance: 65.95
Supporting reasons: Identified as an overlap resistance, indicating a potential area that could halt any further upward movement.
XAU/USD (GOLD):
Potential Direction: Bearish
Overall momentum of the chart: Bullish
The price could see a short-term pullback toward the pivot before continuing its bearish move down toward the 1st support.
Pivot: 4,059.16
Supporting reasons: Identified as a pullback resistance, where selling pressures could intensify and potentially cap any upward retracement.
1st support: 3,504.31
Supporting reasons: Identified as a pullback support that aligns closely with the 78.6% Fibonacci retracement, indicating a key level where the price could stabilize once more.
1st resistance: 4,379.38
Supporting reasons: Identified as a swing resistance, indicating a potential area that could halt any further upward movement.
The accuracy, completeness and timeliness of the information contained on this site cannot be guaranteed. IC Markets does not warranty, guarantee or make any representations, or assume any liability regarding financial results based on the use of the information in the site.
News, views, opinions, recommendations and other information obtained from sources outside of www.icmarkets.com, used in this site are believed to be reliable, but we cannot guarantee their accuracy or completeness. All such information is subject to change at any time without notice. IC Markets assumes no responsibility for the content of any linked site.
The fact that such links may exist does not indicate approval or endorsement of any material contained on any linked site. IC Markets is not liable for any harm caused by the transmission, through accessing the services or information on this site, of a computer virus, or other computer code or programming device that might be used to access, delete, damage, disable, disrupt or otherwise impede in any manner, the operation of the site or of any user’s software, hardware, data or property.
The post Monday 3rd November 2025: Technical Outlook and Review first appeared on IC Markets | Official Blog.
Trade the Aussie on the Reserve Bank of Australia’s Interest Rate Decision
423016 November 3, 2025 15:39 ICMarkets Market News
Australian dollar traders are bracing for some volatility tomorrow as the Reserve Bank of Australia delivers its latest rate decision. The timing, as always, adds a little drama: the announcement lands just 30 minutes before the Melbourne Cup, with the press conference following shortly after, keeping market participants glued to screens while the rest of the country tunes in for the race.
The futures market is pricing in an 85% chance that the RBA will leave rates on hold at 3.60%, despite last week’s inflation data coming in hotter than expected. Attention will now turn to the forward guidance in both the statement and the press conference—any shift from previous indications, particularly in the context of the recent CPI print, could trigger meaningful moves in the Aussie.
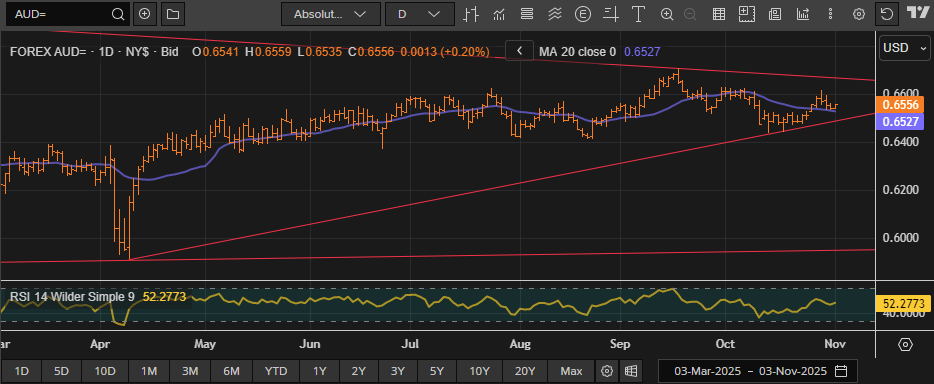
Technically, the AUD has been range-bound between 0.6400 and 0.6600 in recent months and is trading near the midpoint of that band. With longer-term support and resistance levels tightening, traders are looking for a decisive break. The upside looks favoured if the RBA maintains a more hawkish tone into year-end and the start of next year.
Resistance 2: 0.6688 – September High
Resistance 1: 0.6663 – Trendline Resistance
Support 1: 0.6486 – Trendline Support
Support 2: 0.6438 – October Low
The post Trade the Aussie on the Reserve Bank of Australia’s Interest Rate Decision first appeared on IC Markets | Official Blog.

Monday 3rd November 2025: Asian Stocks Gain on U.S.–China Tariff Truce; Australian Market Slightly Lower
423015 November 3, 2025 15:39 ICMarkets Market News
Global Markets:
- Asian Stock Markets : Nikkei up 2.12%, Shanghai Composite up 0.05%, Hang Seng up 0.53% ASX down -0.04%
- Commodities : Gold at $4,022.90 (0.66%), Silver at $48.585 (0.88%), Brent Oil at $65.08 (0.48%), WTI Oil at $61.24 (0.43%)
- Rates : US 10-year yield at 4.101, UK 10-year yield at 4.4080, Germany 10-year yield at 2.6369
News & Data:
- (CAD) GDP m/m -0.3%% to 0.0% expected
Markets Update:
Asian stock markets are trading mostly higher on Monday, tracking the positive cues from Wall Street on Friday after a temporary tariff truce between the U.S. and China. The deal, which includes China’s agreement to purchase more U.S. energy and lift export controls on rare earths, has boosted optimism about improved trade ties between the two largest oil consumers. Both U.S. President Donald Trump and Chinese President Xi Jinping agreed to extend the truce during their meeting in South Korea, lowering overall U.S. tariffs on Chinese imports to 47% from 57%.
The Australian market is slightly lower, extending losses from the previous four sessions. The S&P/ASX 200 Index slipped 0.06% to 8,876.80, weighed by weakness in mining and gold stocks, though gains in energy, financial, and tech sectors limited the decline. Among miners, BHP, Fortescue, and Rio Tinto traded flat to lower, while gold miners such as Evolution and Genesis lost nearly 3%. Energy stocks rose, with Beach Energy and Santos up nearly 1%.
Tech stocks led gains, with Block and Zip advancing over 2%. The big four banks also posted solid gains, led by Westpac, up nearly 3%.
Economic data showed Australia’s manufacturing sector contracting in October, with the PMI slipping to 49.7. Building permits, however, surged 12% in September. The Aussie dollar traded at $0.655.
Upcoming Events:
- 03:00 PM GMT – USDD ISM Manufacturing PMI
The post Monday 3rd November 2025: Asian Stocks Gain on U.S.–China Tariff Truce; Australian Market Slightly Lower first appeared on IC Markets | Official Blog.
The Week Ahead – Week Commencing 03 November 2025
423008 November 3, 2025 15:01 ICMarkets Market News
It was another busy week in financial markets last week, with some key updates from major central banks that included a ‘hawkish cut’ from the Fed, another cut from the Bank of Canada, and ‘holds’ from both the European Central Bank and the Bank of Japan.
Stock markets remained strong despite some mixed earnings reports from some of the biggest companies in the world, while the dollar gained ground after the Fed update.
The U.S. government shutdown and consequent data drought continue into another month tomorrow, and traders who would normally be expecting to see key U.S. jobs numbers in the following days are likely to be disappointed as we progress through the week. Some calendars are still pencilling in releases, although this weekend’s updates from Washington don’t look good for those hoping to see the data.
Consequently, we have left the U.S. numbers off the highlights this week; however, if they do start to be released, there is no doubt that the non-farms and inflation numbers will be a huge focus across the market.
Here is our usual day-by-day breakdown of the major risk events this week:

It is a quiet day to kick off the week, with little on the cards to move the market in the Asian session and, so far, nothing major in terms of geopolitical updates over the weekend. Japanese markets are on holiday, which may affect liquidity; however, traders are expecting a relatively quiet start to the day. Swiss markets will be in focus early in the London session with the key CPI numbers due out. The New York session does see some U.S. data, with ISM Manufacturing and Non-Manufacturing numbers due out, and we also hear from Bank of Canada Governor Tiff Macklem, as well as Fed members Daly and Cook during the session.

Australian markets will be in focus in the Asian session as the RBA again spoils traders’ Melbourne Cup fun and games by announcing the latest cash rate move just half an hour before the big race. The London session sees a couple of updates from ECB President Christine Lagarde, and there is the slight possibility that we may get JOLTS Job Openings numbers once New York opens.

It is New Zealand markets that take centre stage early in the Asian session with key employment numbers due out early in the day. There is nothing major due out for the rest of the session and for the London session as well on Wednesday. The New York session may see the release of the ADP Non-Farms data; however, we will definitely get the ISM Services PMI numbers and Weekly Crude Oil Inventory data later in the day.

It is a quiet Asian session on Thursday with little on the calendar; however, all eyes will be on U.K. markets after the London open with the latest rate call from the Bank of England due out midway through the day. U.S. Weekly Unemployment Claims numbers are still pencilled in, and we will get the Canadian Ivey PMI data. There is a raft of Fed members set to speak during the day as well, including Barr, Williams, Hammack, Waller, Paulson, and Musalem.

Is it non-farms day or not! At the moment, traders are leaning strongly towards the ‘not’ camp; however, if we do get the data, expect extreme volatility around the event. There is little scheduled in either the Asian or London session on Friday, and we will have Canadian employment data close to the New York open, followed by the University of Michigan Preliminary data. However, the jury is still out as to whether we do have the big U.S. employment numbers, with the PCE data also pencilled in on some calendars. If we do, then expect a very busy last session of the week.
The post The Week Ahead – Week Commencing 03 November 2025 first appeared on IC Markets | Official Blog.
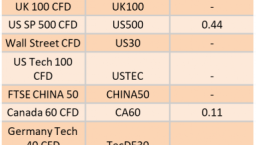
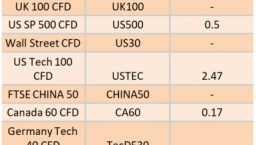
Ex-Dividend 3/11/2025
422976 October 31, 2025 17:39 ICMarkets Market News
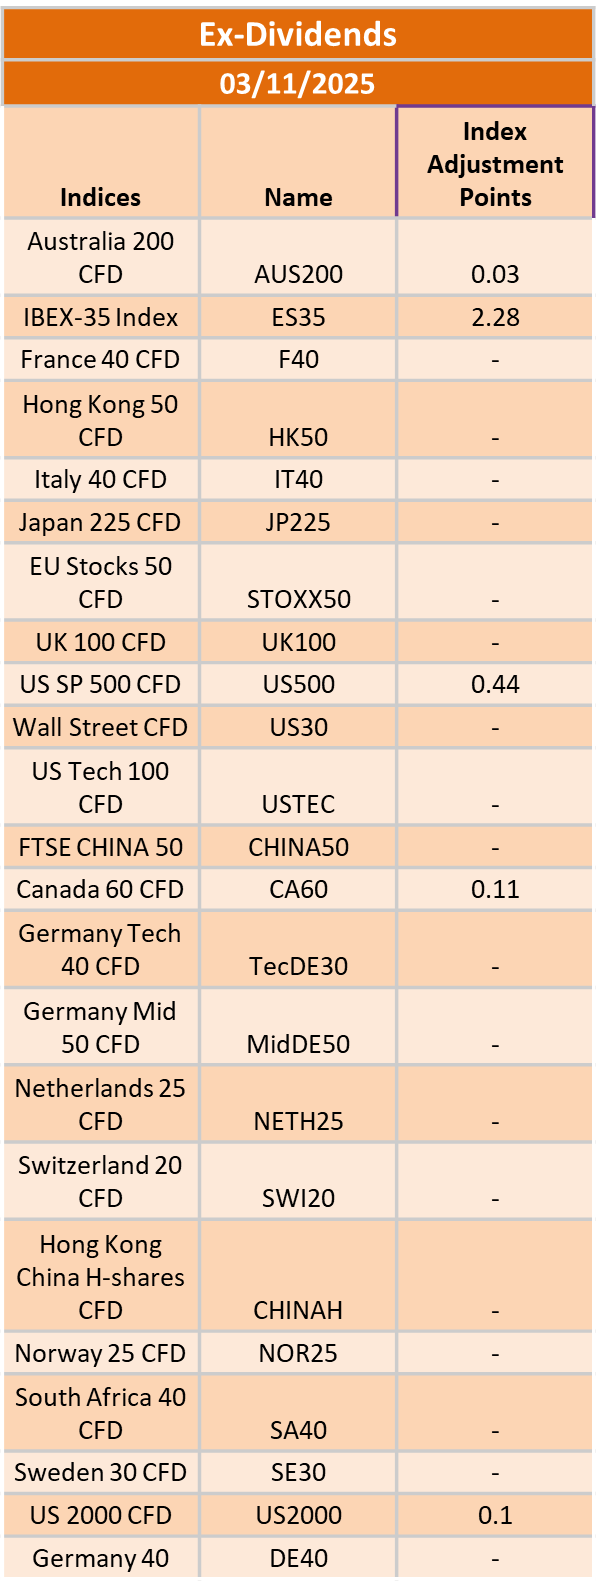
The post Ex-Dividend 3/11/2025 first appeared on IC Markets | Official Blog.
General Market Analysis – 31/10/25
422973 October 31, 2025 16:39 ICMarkets Market News
US Stocks Hit on Mixed Earnings and Fed – Nasdaq Down 1.57%
US stocks took a hit in trading yesterday as mixed earnings reports from big tech players increased concerns about AI spending, and the ‘hawkish cut’ from the Fed continued to weigh. The Dow fell 0.23% to 47,522, but the pain was more pronounced in the S&P, which lost 0.99% to 6,822, and the Nasdaq, which fell 1.57% to 23,581. FX markets continued to digest yesterday’s Fed cut and holds from both the Bank of Japan and the European Central Bank, with the DXY up 0.33% to 99.53. US yields also gained ground again, with the 2-year up 1.1 basis points to 3.609% and the 10-year up 2.1 basis points to 4.097%. Oil markets were relatively steady as traders digested the trade truce between China and the US, with Brent down 0.29% to $64.73 and WTI up 0.15% to $60.57, while gold took off again, jumping 2.4% on the day to close at $4,024.54 an ounce.
USDJPY Back in Focus for Longer-Term FX Players
It has been a busy week again for FX traders, with a raft of major central bank updates hitting the markets for players to digest. Rate moves all went in line with expectations, with both the Bank of Canada and the Fed cutting, and the Bank of Japan and the ECB keeping rates on hold. However, the surprises came in forward guidance from two major banks that now have longer-term interest rate differential players looking for bigger moves in the weeks ahead. The FOMC surprised the market with a much less dovish update on the back of continued inflation issues and a lack of data moving forward (due to the government shutdown), while the Bank of Japan held rates and pulled back on expectations for a rate hike in December, with Governor Kazuo Ueda indicating that he could wait out the impact of new government policy on data for a few months. USDJPY has risen nearly 3% from its low on Wednesday and is now trading near key technical resistance. A break above recent highs just under 154.50 could see the move extend over the next few days and weeks to challenge the annual high of 158.87 set in January this year.
Another Volatile Day Expected for Traders
Traders are expecting to see more moves in the sessions ahead today as the market continues to digest a raft of updates from the past couple of days, as well as some fresh data points. Major central bank moves, trade updates between the US and China, and some big company earnings reports will all be competing in investors’ analysis today, and they should keep traders busy up to the New York 5 p.m. bell. The Asian session sees some key data out of both Japan and China today, with the initial focus on the Tokyo Core CPI data (exp. +2.6% y/y) before focus switches to China for the Manufacturing PMI (exp. 49.6) and Non-Manufacturing PMI (exp. 50.1) numbers. The London session will see the release of the EU’s Flash CPI (exp. +2.1%) and Core Flash CPI (exp. +2.3%) data, with moves expected in the euro around the release. The New York session will see Canadian GDP (exp. 0.0% m/m) data released early in the day before updates from Fed members Logan, Bostic, and Hammack later in the session.
The post General Market Analysis – 31/10/25 first appeared on IC Markets | Official Blog.
IC Markets – Europe Fundamental Forecast | 31 October 2025
422972 October 31, 2025 16:14 ICMarkets Market News
IC Markets – Europe Fundamental Forecast | 31 October 2025
What happened in the Asia session?
The Asia session on October 31, 2025, featured cautious market reactions as investors digested China’s mixed PMI data and steadied Tokyo CPI results, while global sentiment remained tentatively positive following the U.S.-China trade truce. Chinese equities and CNY were the most affected by the data, while Japanese and Australian assets enjoyed mild risk-on interest without major volatility.
What does it mean for the Europe & US sessions?
China’s weak PMI readings signal ongoing economic challenges in the world’s second-largest economy, while the surprise U.S.-China trade breakthrough has injected optimism into risk assets. Central banks have adopted divergent paths—the Fed signals caution on further cuts, the ECB maintains its extended pause, and the BoJ remains dovish despite inflation concerns. Exceptional earnings from tech giants Amazon and Apple have bolstered confidence in the U.S. corporate sector and consumer resilience.
The Dollar Index (DXY)
Key news events today
No major news event
What can we expect from DXY today?
The Dollar is under pressure due to a prolonged U.S. government shutdown, anticipated Federal Reserve rate cuts, and the delayed release of major U.S. economic data. However, some safe-haven flows and Fed commentary have led to temporary spurts of USD strength against select currencies, such as the Peso and ZAR, while the market waits for key inflation and employment figures.
Central Bank Notes:
- The Federal Open Market Committee (FOMC) voted, by majority, to lower the federal funds rate target range by 25 basis points to 3.75%–4.00% at its October 28–29, 2025, meeting, marking the second consecutive cut following the 25 basis points reduction in September.
- The Committee maintained its long-term objectives of maximum employment and 2% inflation, noting that the labor market continues to soften, with modest job creation and an unemployment rate edging higher. In comparison, inflation remains above target at around 3.0%.
- Policymakers highlighted ongoing downside risks to economic growth, tempered by signs of resilient economic activity. September’s consumer price index (CPI) came in slightly lower than expected at 3.0% year-over-year, easing inflation pressure but still warranting vigilance given tariff-driven price effects.
- Economic activity expanded modestly in the third quarter, with GDP growth estimates around 1.0% annualized; however, uncertainty remains elevated amid persistent global trade tensions and the U.S. government shutdown, which is impacting data availability.
- The updated Summary of Economic Projections reflects an anticipated unemployment rate averaging approximately 4.5% for 2025, with headline and core personal consumption expenditures (PCE) inflation projections holding near 3.0%, indicating a slow easing path ahead.
- The Committee emphasized its flexible, data-dependent approach and underscored that future policy adjustments will be guided by incoming labor market and inflation data. As in prior meetings, there was dissent, including one member advocating a more aggressive 50-basis-point cut.
- The FOMC announced the planned conclusion of its balance sheet reduction (quantitative tightening) program, intending to cease runoff in the near term to maintain market stability, with Treasury redemption caps held steady at $5 billion per month and agency mortgage-backed securities caps at $35 billion.
- The next meeting is scheduled for 9 to 10 December 2025.
Next 24 Hours Bias
Weak Bearish
Gold (XAU)
Key news events today
No major news event
What can we expect from Gold today?
Gold prices remain volatile today, Friday, with the market showing heightened sensitivity to central bank actions, macroeconomic signals, and ongoing geopolitical uncertainties. Prices continue to hover around the $4,000 level, reflecting a combination of recent bullish rallies fueled by Federal Reserve rate cuts, but technical signals warn of corrective downward pressure as investors react to mixed data and shifting sentiment.
Next 24 Hours Bias
Medium Bullish
The Euro (EUR)
Key news events today
Core CPI flash estimate y/y (10:00 am GMTT)
CPI flash estimate y/y (10:00 am GMT)
What can we expect from EUR today?
Eurozone inflation is stabilizing near ECB targets, allowing the central bank to hold rates steady.The market is digesting modest economic growth and new policy signals, with volatility persisting in major euro currency pairs.Major policy discussions include advancing plans for the digital euro and maintaining fiscal and structural reforms to reinforce competitiveness amid a slow global recovery.
Central Bank Notes:
- The Governing Council of the ECB kept the three key interest rates unchanged at its meeting on 30 October 2025. The main refinancing rate remains at 2.15%, the marginal lending facility at 2.40%, and the deposit facility at 2.00%. This decision reflects policymakers’ assessment that the current monetary stance remains consistent with medium-term price stability, while incoming data confirm a gradual return of inflation towards the target.
- Recent indicators point to stable price dynamics. Headline inflation remains near the 2% mark, with energy prices contained and food inflation easing slightly after earlier supply bottlenecks. Wage growth continues to moderate, contributing to the slowdown in domestic cost pressures. The ECB reiterated its commitment to a data-driven, meeting-by-meeting approach and emphasized flexibility in the face of uncertain global financial conditions.
- Eurosystem staff projections have not been materially altered since September. Headline inflation averages remain at 2.0% for 2025, 1.8% for 2026, and 2.0% for 2027. Recent softening in producer prices and subdued pipeline pressures suggest limited upside risks to inflation, though geopolitical tensions and potential commodity shocks continue to pose uncertainties to the outlook.
- Euro area GDP growth remains on track with earlier forecasts, projected at 1.1% for 2025, 1.1% for 2026, and 1.4% for 2027. Forward-looking indicators, including PMIs and industrial sentiment surveys, signal some stabilization in activity following weakness in the third quarter. Public investment and recovering export activity are expected to offset softer private sector demand in the near term.
- The labor market remains resilient, with unemployment rates at multi-decade lows and participation rates strong. Real income growth continues to support household spending, even as consumption growth normalizes from earlier highs. Financing conditions remain favorable, aided by stable banking sector liquidity and improved credit demand among small and medium-sized firms.
- Business sentiment remains mixed, reflecting lingering uncertainty over global trade policy and the path of US tariffs. However, easing supply chain costs and improved export competitiveness due to softer exchange rates are providing some relief to manufacturing and external-oriented sectors.
- The Governing Council reaffirmed that future decisions will depend on an integrated assessment of incoming data—covering inflation trends, financial conditions, and the state of policy transmission. The Council emphasized that no pre-set path for rates exists; keeping all options open should the economic outlook shift markedly.
- Balance sheet reduction continues smoothly, with holdings under the APP and PEPP declining as reinvestments have ceased. The ECB confirmed that the pace of portfolio runoff remains in line with its previously communicated normalization plan, supporting a gradual withdrawal of monetary accommodation in a predictable manner.
- The next meeting is on 17 to 18 December 2025
Next 24 Hours Bias
Weak Bearish
The Swiss Franc (CHF)
Key news events today
No major news event
What can we expect from CHF today?
The Swiss Franc (CHF) is seeing modest downward movement as of Friday, following recent strength throughout October. The most current data shows the CHF trading at 1.077 per euro as of October 30, which represents a very minor decrease of 0.03% from the previous day, but a 1.21% appreciation compared to one year ago. Against the US dollar, the USD/CHF pair has seen some volatility, trading at about 0.8022 with technical forecasts suggesting short-term bearish momentum but hints at a possible bullish correction before likely continuation of the downtrend.
Central Bank Notes:
- The SNB maintained its key policy rate at 0% during its meeting on 25 September 2025, pausing a sequence of six consecutive rate cuts as inflation stabilized and the Swiss franc remained firm.
- Recent data showed a modest rebound in inflation, with Swiss consumer prices rising 0.2% year-on-year in August after staying above zero for three consecutive months; this helped alleviate fears of deflation that were mounting earlier in the year.
- The conditional inflation forecast remains broadly unchanged from June: headline inflation is expected to average 0.2% in 2025, 0.5% in 2026, and 0.7% in 2027. The risk of a negative rate move has diminished for now, but the SNB retains flexibility should inflationary pressures weaken again.
- The global economic outlook has deteriorated further, weighed down by heightened trade tensions—especially with the U.S.—and ongoing uncertainty in key Swiss export markets.
- Swiss GDP growth moderated in Q2 after a strong Q1 boosted by front-loaded U.S. exports. The SNB expects growth to slow and remain subdued, with forecasted GDP expansion between 1% and 1.5% in both 2025 and 2026.
- Labor market sentiment in the Swiss industrial sector has softened on concerns over export competitiveness and potential adjustments to production, but the overall growth outlook stays broadly unchanged
- The SNB reiterated its readiness to respond as needed if deflation risks re-emerge, emphasizing its commitment to medium-term price stability and a robust, transparent communication policy, with the introduction of more detailed monetary policy minutes beginning in October.
- The next meeting is on 11 December 2025.
Next 24 Hours Bias
Weak Bullish
The Pound (GBP)
Key news events today
No major event
What can we expect from GBP today?
The British Pound remains under pressure as UK fiscal and monetary policy uncertainty, combined with a strong US Dollar, drives short-term downward momentum. While some technical forecasts suggest the possibility of a rebound if support levels hold, the overall environment currently favors further GBP/USD weakness. The GBP/USD currency pair is currently in a strong downtrend and trading within a descending channel, with immediate support identified near 1.3100 and resistance around 1.3245.
Central Bank Notes:
- The Bank of England’s Monetary Policy Committee (MPC) voted on 18 September 2025 by a majority (expected split likely 7–2 or 6–3) to hold the Bank Rate steady at 4.00%, following the rate cut in August. Most members cited persistent inflation and mixed indicators on growth and employment, while a minority favored further easing due to the cooling labor market and subdued GDP growth.
- The Committee decided to decrease the pace of quantitative tightening, planning to reduce the stock of UK government bond purchases by £67.5 billion over the next 12 months, instead of the prior £100 billion pace, with the gilt balance now standing at nearly £558 billion. This reflects increased volatility in bond markets and a shift to a more gradual approach.
- Headline inflation rose unexpectedly to 3.8% in July and is projected at 4% for September, above the Bank’s 2% target. Price pressures are driven by regulated energy costs and ongoing food price increases. While previous disinflation has been substantial, core inflation remains elevated and sticky.
- The MPC expects headline inflation to remain above target through Q4, with a resumption of the downward trend projected for early 2026 as energy and regulated price pressures abate. The Committee remains watchful for signs of persistent inflation despite previous policy tightening.
- UK GDP growth is stagnant, with business and consumer activity subdued. Recent labor market data show rising unemployment rates (now at 4.7%) and stabilizing wage growth (holding near 5%), indicating slack but continued wage price pressure. The Committee remains cautious amid lackluster demand and soft survey sentiment.
- Pay growth and employment indicators have moderated further, alongside confirmation from business surveys that pay settlements are slowing. The Committee expects wage growth to decelerate significantly through Q4 and the rest of 2025.
- Global uncertainty persists due to volatile energy prices, supply chain disruptions linked to Middle East conflicts, and renewed trade tensions. The MPC remains vigilant in tracking transmission of external cost/wage shocks to UK inflation.
- Risks to inflation are considered two-sided. While subdued domestic growth and softening labor activity suggest scope for easing, persistent inflation requires caution. The MPC anticipates a slow, gradual reduction path in rates, continuing its data-dependent approach with careful adjustment as warranted by economic developments.
- The Committee’s bias remains toward maintaining a restrictive monetary policy stance until firmer evidence emerges that inflation will return sustainably to the 2% target. All future decisions will remain highly data dependent, with a strong emphasis on evolving demand, inflation expectations, costs, and labor market conditions.
- The next meeting is on 6 November 2025.
Next 24 Hours Bias
Medium Bearish
The Canadian Dollar (CAD)
Key news events today
GDP m/m (12:30 pm GMT)
What can we expect from CAD today?
The Canadian Dollar remains weak as October ends, pressured by stalled GDP growth, risk-averse global sentiment, and lackluster domestic data. The focus today is on Canada’s monthly GDP report, expected at 12:30 pm GMT, which could further influence CAD direction. The USD/CAD pair climbed to 1.3988, with the US Dollar gaining 0.32% against the CAD yesterday, snapping a three-session losing streak. The CAD continues to trade near its 12-week low, and the greenback remains up 3% from its June lows.
Central Bank Notes:
- The Council noted that U.S. tariff tensions have eased slightly following early progress in bilateral discussions, though the external trade environment remains fragile. Businesses continue to hold back on long-term investment, with the Bank highlighting that sustained clarity on U.S. trade policy is needed to restore confidence.
- The Bank acknowledged that uncertainty persists despite the softer U.S. tone, as incoming data show limited improvement in export orders. The manufacturing sector has stabilized but remains below pre-2024 output levels, reflecting weak global demand and cautious corporate spending.
- Canada’s economy showed tentative signs of recovery in early Q4, with GDP estimated to expand by 0.3% in October after two quarters of contraction. Mining and energy activity strengthened modestly, aided by steady crude demand, while goods exports posted a fractional gain.
- Service sector growth remained uneven, supported mainly by tourism-related and technology services. However, retail spending and household consumption were subdued, constrained by slower job creation and lingering consumer caution. The Bank judged overall momentum as fragile but improving marginally.
- Housing activity showed modest reacceleration in major urban markets as mortgage rates stabilized near record lows. Nonetheless, affordability pressures and stricter lending standards continue to cap overall resale volumes, leading to only a gradual recovery in the housing sector.
- Headline CPI inflation rose to 2.1% in October, reaching the Bank’s target for the first time in six months. The increase was driven by higher energy prices and a modest uptick in food and shelter costs. Core inflation measures remained stable, suggesting underlying price pressures are contained.
- The Governing Council reiterated its data-dependent stance, indicating that the current policy rate remains appropriate amid tentative growth and balanced inflation risks. Officials noted that while additional stimulus is not ruled out, the emphasis has shifted toward monitoring the sustainability of the recovery rather than immediate rate adjustments.
- The next meeting is on 17 to 18 December 2025.
Next 24 Hours Bias
Weak Bearish
Oil
Key news events today
No major new event
What can we expect from Oil today?
The oil market today is pausing its decline amid tight inventories and headline-driven rebounds, but it remains fundamentally weighed down by oversupply and macroeconomic caution. Analysts expect continued volatility, with oversupply predicted to persist into late 2025 and 2026. While sanctions and unexpected drawdowns support prices temporarily, structural headwinds such as weak demand growth and surplus production, especially from OPEC+ and the U.S., are likely to keep oil prices under downward pressure in the coming months.
Next 24 Hours Bias
Medium Bearish
The post IC Markets – Europe Fundamental Forecast | 31 October 2025 first appeared on IC Markets | Official Blog.
IC Markets – Asia Fundamental Forecast | 31 October 2025
422971 October 31, 2025 16:14 ICMarkets Market News
IC Markets – Asia Fundamental Forecast | 31 October 2025
What happened in the U.S. session?
The U.S. trading session was characterized by significant volatility driven by three major catalysts: the Federal Reserve’s hawkish rate cut, mixed Big Tech earnings revealing surging AI costs, and a tentative U.S.-China trade truce. Chair Powell’s cautious stance on future rate cuts triggered a repricing across asset classes, with Treasury yields surging, the dollar strengthening, and rate-cut probabilities declining sharply. The U.S.-China trade agreement provided some relief but lacked concrete details, leaving markets cautious about its durability.
What does it mean for the Asia Session?
Friday presents a data-heavy session for Asian traders with several market-moving releases. The combination of China’s PMI data showing continued manufacturing weakness, Japan’s inflation readings supporting potential BOJ rate hikes, and Australia’s credit growth metrics will provide crucial insights into regional economic health. The backdrop of evolving U.S.-China trade relations, recent central bank decisions, and global inflation trends creates a complex trading environment requiring careful attention to both domestic fundamentals and international policy developments.
The Dollar Index (DXY)
Key news events today
No major news event
What can we expect from DXY today?
The dollar’s strength heading into the weekend reflects several competing forces. Fed Chair Powell’s hawkish messaging and emphasis on policy uncertainty provided immediate support, as markets recalibrated expectations for further rate cuts. The US-China trade agreement removed a significant geopolitical risk, though questions remain about implementation and longer-term sustainability. The government shutdown continues to damage economic activity, with the CBO estimating permanent GDP losses. Labor market weakness is evident in alternative data despite the absence of official reports.
Central Bank Notes:
- The Federal Open Market Committee (FOMC) voted, by majority, to lower the federal funds rate target range by 25 basis points to 3.75%–4.00% at its October 28–29, 2025, meeting, marking the second consecutive cut following the 25 basis points reduction in September.
- The Committee maintained its long-term objectives of maximum employment and 2% inflation, noting that the labor market continues to soften, with modest job creation and an unemployment rate edging higher. In comparison, inflation remains above target at around 3.0%.
- Policymakers highlighted ongoing downside risks to economic growth, tempered by signs of resilient economic activity. September’s consumer price index (CPI) came in slightly lower than expected at 3.0% year-over-year, easing inflation pressure but still warranting vigilance given tariff-driven price effects.
- Economic activity expanded modestly in the third quarter, with GDP growth estimates around 1.0% annualized; however, uncertainty remains elevated amid persistent global trade tensions and the U.S. government shutdown, which is impacting data availability.
- The updated Summary of Economic Projections reflects an anticipated unemployment rate averaging approximately 4.5% for 2025, with headline and core personal consumption expenditures (PCE) inflation projections holding near 3.0%, indicating a slow easing path ahead.
- The Committee emphasized its flexible, data-dependent approach and underscored that future policy adjustments will be guided by incoming labor market and inflation data. As in prior meetings, there was dissent, including one member advocating a more aggressive 50-basis-point cut.
- The FOMC announced the planned conclusion of its balance sheet reduction (quantitative tightening) program, intending to cease runoff in the near term to maintain market stability, with Treasury redemption caps held steady at $5 billion per month and agency mortgage-backed securities caps at $35 billion.
- The next meeting is scheduled for 9 to 10 December 2025.
Next 24 Hours Bias
Medium Bearish
Gold (XAU)
Key news events today
No major news event
What can we expect from Gold today?
Gold markets reflect a complex interplay of supportive fundamentals and near-term technical pressures. Record-breaking Q3 demand totaling 1,313 tonnes, sustained central bank buying approaching 900 tonnes annually, and surging ETF inflows demonstrate robust institutional and retail appetite for the precious metal. However, the Federal Reserve’s cautious rate-cut outlook, progress in U.S.-China trade negotiations, and profit-taking following the 50% year-to-date rally have triggered a healthy correction from October’s record highs.
Next 24 Hours Bias
Medium Bullish
The Australian Dollar (AUD)
Key news events today
No major news event
What can we expect from AUD today?
Trump-Xi meeting at APEC summit yielded agreements to reduce tariffs from 57% to 47%, suspend rare earth restrictions, and resume agricultural purchases—reducing regional uncertainty and supporting commodity currencies. As expected, the Fed delivered a 25bp cut to 3.75-4.00%, but Powell’s hawkish tone, warning against assuming a December cut, sent the dollar higher and pressured AUD/USD despite strong Australian inflation
Central Bank Notes:
- The RBA held its cash rate steady at 3.60% at its October meeting on 29–30 September 2025, marking a second consecutive pause after August’s 25 basis point cut. The move affirms the Bank’s data-dependent approach as inflation trends within the target range.
- Inflation indicators remained stable through September, with headline CPI likely anchoring near 2.2%—comfortably within the 2–3% band. Insurance and housing costs remain sticky but are increasingly offset by moderation in discretionary goods.
- Trimmed mean inflation is estimated at around 2.8%, signaling underlying pressures remain contained. The Board continues to flag food and energy price volatility as short-term risks, though the broader disinflation narrative holds.
- Global conditions remain a source of uncertainty. U.S. policy expectations and uneven growth in China continue to weigh on commodities, even as trade disruptions have eased marginally since mid-year.
- Domestic growth shows resilience in the housing and services sectors, though manufacturing remains subdued. Household incomes have stabilized, but consumption remains only modest, capped by high borrowing costs.
- The labor market maintains relative tightness, though job growth has slowed notably since the first half of the year. Underutilization has ticked higher, but overall employment conditions remain supportive.
- Wage growth is plateauing, reflecting softer labor demand. Weak productivity continues to keep unit labor costs elevated, underscoring a medium-term concern highlighted repeatedly by the RBA.
- Household consumption prospects remain fragile. The combination of high rents and weak discretionary appetite suggests risks of a consumer-led slowdown in Q4 if confidence fails to rebound.
- The Board reiterated that subdued household spending poses risks to business sentiment and may dampen investment and job creation in the coming quarters.
- Monetary policy remains mildly restrictive. The RBA balanced confidence in inflation progress with caution around global and domestic demand risks, keeping further adjustments conditional on incoming data.
- The Bank reaffirmed its dual commitment to price stability and full employment, noting its readiness to act should conditions shift markedly.
- The next meeting is on 5 to 6 November 2025.
Next 24 Hours Bias
Medium Bullish
The Kiwi Dollar (NZD)
Key news events today
No major news event
What can we expect from NZD today?
The New Zealand Dollar faces a challenging environment as it closes out October 2025. While improving business confidence and the US-China trade truce provide some positive underpinnings, several factors are weighing on the currency. Negative Pressures: Renewed US Dollar strength following hawkish Fed commentary, declining dairy prices in consecutive GDT auctions, weak consumer confidence, and expectations of further RBNZ rate cuts are limiting NZD upside.
Central Bank Notes:
- The Monetary Policy Committee (MPC) agreed to cut the Official Cash Rate (OCR) by 50 basis points to 2.50% on 8 October 2025, exceeding market expectations for a smaller 25-basis-point reduction and signaling a stronger commitment to reviving growth.
- The decision was reached by consensus, marking a shift from previous split votes, and reflected policymakers’ shared view that sustained economic weakness and persistent disinflationary pressures required a more front-loaded policy response.
- Annual consumer price inflation stood at 2.7% in the June quarter and is seen nearing 3% for the September quarter—above the 2% midpoint but within the 1–3% target range. Despite high near-term readings, the MPC projects inflation will return toward 2% by the first half of 2026 as spare capacity and moderating tradables curb price momentum.
- Policymakers acknowledged that domestic demand remains weak, with household spending, business investment, and construction activity under pressure. While still elevated, services inflation is expected to ease gradually as wage growth slows and unemployment edges higher.
- Financial conditions have eased with expectations as wholesale and retail borrowing rates adjust to lower policy settings. Bank lending data indicate a modest uptick in mortgage approvals, though broader credit demand remains subdued.
- GDP growth stalled in the middle of 2025, with high-frequency indicators showing continued weakness into the third quarter. A combination of elevated costs for essentials and falling savings continues to restrain household consumption, while global trade frictions weigh on business sentiment.
- The MPC noted that global uncertainty—particularly from US trade regulation changes and soft Chinese demand—continues to pose downside risks to export sectors, though these are partly offset by a weaker New Zealand dollar improving competitiveness.
- Subject to data confirming a sustained soft patch in activity and moderating inflation pressures, the MPC signaled further scope to reduce the OCR toward 2.25% at its next meeting on 26 November 2025, consistent with current market and Westpac forecasts.
- The next meeting is on 26 November 2025.
Next 24 Hours Bias
Weak Bullish
The Japanese Yen (JPY)
Key news events today
No major news events
What can we expect from JPY today?
The Japanese yen faces significant headwinds entering the weekend, pressured by the BOJ’s dovish hold on rates, widening monetary policy divergence with the Fed, improved U.S.-China trade relations that reduce safe-haven demand, and Governor Ueda’s cautious stance on near-term tightening. While inflation remains above the BOJ’s 2% target and manufacturing data shows continued contraction, policymakers appear willing to maintain accommodative policy until wage growth solidifies and global economic uncertainties—particularly around U.S. trade policies—diminish.
Central Bank Notes:
- The Policy Board of the Bank of Japan met on 30–31 October and by a clear majority vote, decided to maintain its key monetary policy approach for the upcoming period.
- The BOJ will continue to encourage the uncollateralized overnight call rate to remain at around 0.5%, in line with the prior stance.
- The gradual quarterly reduction in monthly outright purchases of Japanese Government Bonds (JGBs) remains intact, with amounts unchanged from the previous schedule. Purchases are set to decrease by about ¥400 billion per quarter through March 2026, shifting to about ¥200 billion per quarter from April to June 2026, and targeting a ¥2 trillion purchase level for Q1 2027. The bank reaffirmed its intention to maintain flexibility, with readiness to respond if market conditions warrant an adjustment.
- Japan’s economy continues to show moderate recovery, primarily led by solid capital expenditures, although export growth and corporate activity remain restrained by external demand uncertainty and the ongoing effects of U.S. trade policies.
- Annual headline inflation (excluding fresh food) accelerated to 2.9% year-on-year in September, marking the first uptick in four months and staying above the BOJ’s 2% target. Broad-based inflation persists, with food and energy cost pressures, but wage growth continues to support household consumption. Input cost pressures from the earlier surge in imports eased slightly.
- Short-term inflation momentum could moderate as food-price hikes ease, though rent, healthcare, and service-sector price increases tied to labor shortages provide support. Firms and households maintain a gradual upward drift in inflation expectations.
- For the near term, BOJ projects growth below trend as external demand stays subdued and corporate investment plans remain cautious. Still, accommodative financial conditions and steady gains in real labor income will underpin domestic consumption.
- Over the medium term, as overseas economies recover and trade conditions normalize, Japan’s growth potential should improve. Persistent labor market tightness, higher wage settlements, and rising medium- to long-term inflation expectations are expected to keep core inflation on a gradual upward trajectory, converging toward the 2% price stability target later in the forecast horizon.
- The next meeting is scheduled for 18 to 19 December 2025.
Next 24 Hours Bias
weak Bearish
Oil
Key news events today
No major news event
What can we expect from Oil today?
Crude oil prices remain under pressure, driven by record global output, continued oversupply, and tepid demand. Brent hovers under $65/barrel, and WTI sits below $60/barrel, with additional supply from OPEC+ anticipated next month. Despite a sharp draw in US inventories and some bright spots (e.g., jet fuel demand, BP’s Brazil discovery), the outlook is bearish as fears of a large global surplus persist. Key upcoming events—the Trump–Xi summit and OPEC+ supply review—could trigger short-term volatility, but unless demand picks up, the multi-month downtrend in oil prices is likely to continue into November.
Next 24 Hours Bias
Medium Bearish
The post IC Markets – Asia Fundamental Forecast | 31 October 2025 first appeared on IC Markets | Official Blog.
Friday 31st October 2025: Asian Markets Mixed Amid Fed Uncertainty and U.S.–China Trade Optimism
422970 October 31, 2025 16:00 ICMarkets Market News
Global Markets:
- Asian Stock Markets : Nikkei up 1.66%, Shanghai Composite down -0.63%, Hang Seng down -0.83% ASX up 0.28%
- Commodities : Gold at $4,010.60 (-0.13%), Silver at $48.390 (-0.46%), Brent Oil at $63.94 (-0.67%), WTI Oil at $60.15 (-0.69%)
- Rates : US 10-year yield at 4.104, UK 10-year yield at 4.4280, Germany 10-year yield at 2.6375
News & Data:
- (EUR) Main Refinancing Rate 2.15% to 2.15% expected
Markets Update:
Asian stock markets traded mixed on Friday, tracking weak cues from Wall Street as investors reassessed the outlook for U.S. interest rates after Fed Chair Jerome Powell said another rate cut in December is “not a foregone conclusion.” Positive updates from U.S.–China talks, including tariff and trade relaxations, helped limit downside pressure.
The CME FedWatch Tool shows a 72.8% chance of a December rate cut, down from 91% a week earlier. The U.S. agreed to lower tariffs on China-linked fentanyl goods, while China will resume soybean purchases and suspend rare-earth export controls.
In Australia, the S&P/ASX 200 gained 0.21% to 8,903.80, supported by strong gold miners but capped by weakness in tech and energy shares. Gold miners like Northern Star and Evolution Mining surged over 4%. However, Steadfast shares plunged nearly 10% following an internal probe into its CEO, while Mayne Pharma plummeted 32% amid takeover concerns. Producer prices rose 1% in Q3, the fastest since late 2024.
Japan’s Nikkei 225 jumped 1.21% to a record 51,948.26, driven by strong tech and exporter gains. Advantest, Renesas, and Hitachi rallied sharply, though Panasonic and automakers declined. Economic data showed higher retail sales and industrial output in September, while inflation in Tokyo accelerated to 2.8%.
Elsewhere, China, Hong Kong, and Singapore slipped, while New Zealand and South Korea advanced.
Upcoming Events:
- 12:30 PM GMT – CAD GDP m/m
The post Friday 31st October 2025: Asian Markets Mixed Amid Fed Uncertainty and U.S.–China Trade Optimism first appeared on IC Markets | Official Blog.
Friday 31st October 2025: Technical Outlook and Review
422959 October 31, 2025 16:00 ICMarkets Market News
DXY (U.S. Dollar Index):
Potential Direction: Bullish
Overall momentum of the chart: Bearish
The price could fall toward the pivot and could make a short-term pullback toward this level before rising again toward the 1st resistance.
Pivot: 99.2
Supporting reasons: Identified as a pullback support, where renewed buying pressure could emerge to push the price higher.
1st support: 98.55
Supporting reasons: Identified as an overlap support that aligns closely with the 50% Fibonacci, indicating a potential area where the price could again stabilize.
1st resistance: 9100.10
Supporting reasons: Identified as an overlap resistance, indicating a potential area that could halt any further upward movement
EUR/USD:
Potential Direction: Bearish
Overall momentum of the chart: Bullish
The price could see a short-term pullback toward the pivot before continuing its bearish move down toward the 1st support.
Pivot: 1.1620
Supporting reasons: Identified as a pullback resistance, where selling pressures could intensify and potentially cap any upward retracement.
1st support: 1.1542
Supporting reasons: Identified as a swing low support that aligns with the 127.2% Fibonacci extension, indicating a potential level where the price could stabilize once again.
1st resistance: 1.1666
Supporting reasons: Identified as a pullback resistance that aligns closely with the 61.8% Fibonacci retracement, indicating a potential level that could cap further upward movement.
EUR/JPY:
Potential Direction: Bullish
Overall momentum of the chart: Bullish
The price could see a short-term pullback toward the pivot before continuing its bearish move down toward the 1st support.
Pivot: 177.75
Supporting reasons: Identified as a pullback resistance, where selling pressures could intensify and potentially cap any upward retracement.
1st support: 176.45
Supporting reasons: Identified as a pullback support, indicating a potential area where the price could again stabilize.
1st resistance: 178.77
Supporting reasons: Identified as a swing high resistance that is supported by the 161.8% Fibonacci extension, indicating a potential level that could cap further upward movement.
EUR/GBP:
Potential Direction: Bullish
Overall momentum of the chart: Bullish
The price could see a short-term pullback toward the pivot before rising again toward the 1st resistance.
Pivot: 0.8749
Supporting reasons: Identified as a pullback support, where renewed buying pressure could emerge to push the price higher.
1st support: 0.8718
Supporting reasons: Identified as overlap support, indicating a potential area where the price could stabilize once more.
1st resistance: 0.8809
Supporting reasons: Identified as a resistance that is supported by the 161.8% Fibonacci extension, indicating a potential level that could cap further upward movement.
GBP/USD:
Potential Direction: Bearish
Overall momentum of the chart: Bullish
The price could see a short-term pullback toward the pivot before continuing its bearish move down toward the 1st support.
Pivot: 1.3260
Supporting reasons: Identified as a pullback resistance, where selling pressures could intensify and potentially cap any upward retracement.
1st support: 1.3115
Supporting reasons: Identified as a support that is supported by the 161.8% Fibonacci extension, indicating a potential area where the price could stabilize once more.
1st resistance: 1.3355
Supporting reasons: Identified as an overlap resistance, indicating a potential level that could halt further upward movement.
GBP/JPY:
Potential Direction: Bearish
Overall momentum of the chart: Bullish
The price has already reacted off the pivot and may continue its bearish move toward the 1st support
Pivot: 203,200
Supporting reasons: Identified as an overlap resistance, where selling pressures could intensify and potentially cap any upward retracement
1st support: 201,71
Supporting reasons: Identified as a pullback support, indicating a potential level where the price could stabilize once more.
1st resistance: 204.03
Supporting reasons: Identified as a swing high resistance, indicating a potential level that could halt further upward movement.
USD/CHF:
Potential Direction: Bullish
Overall momentum of the chart: Bearish
The price could see a short-term pullback toward the pivot before rising again toward the 1st resistance.
Pivot: 0.7980
Supporting reasons: Identified as an overlap support, where renewed buying pressure could emerge to push the price higher.
1st support: 0.7932
Supporting reasons: Identified as an overlap support, indicating a potential level where the price could stabilize once again.
1st resistance: 0.8028
Supporting reasons: Identified as an overlap resistance, indicating a potential level that could cap further upward movement.
USD/JPY:
Potential Direction: Bullish
Overall momentum of the chart: Bullish
The price could see a short-term pullback toward the pivot before rising again toward the 1st resistance.
Pivot: 153.25
Supporting reasons: Identified as a pullback support, where renewed buying pressure could emerge to push the price higher.
1st support: 151.18
Supporting reasons: Identified as a pullback support, indicating a strong area where buyers might return, and the price could stabilize once again.
1st resistance: 154.30
Supporting reasons: Identified as a resistance that is supported by the 161.8% Fibonacci extension. This level represents the next key area where upward movement could be capped amid increased selling pressure
USD/CAD:
Potential Direction: Bullish
Overall momentum of the chart: Bearish
The price could see a short-term pullback toward the pivot before rising again toward the 1st resistance.
Pivot: 1.3969
Supporting reasons: Identified as a pullback support, where renewed buying pressure could emerge to push the price higher.
1st support: 1.3890
Supporting reasons: Identified as an overlap support that aligns with the 50% Fibonacci retracement, indicating a key level where the price could stabilize once more.
1st resistance: 1.4029
Supporting reasons: Identified as an overlap resistance, making it a possible target for bullish advances and a level where some sellers could return to cap gains
AUD/USD:
Potential Direction: Bullish
Overall momentum of the chart: Bullish
The price could make a short-term pullback toward the pivot before rising again toward the 1st resistance
Pivot: 0.6524
Supporting reasons: Identified as a pullback support, where renewed buying pressure could emerge to push the price higher.
1st support: 0.6484
Supporting reasons: Identified as a swing low support, this area has provided strong support historically and may attract buying interest for a potential short-term bounce
1st resistance: 0.6590
Supporting reasons: Identified as a pullback resistance, indicating a potential area that could halt any further upward movement.
NZD/USD
Potential Direction: Bearish
Overall momentum of the chart: Bullish
The price could see a short-term pullback toward the pivot before continuing its bearish move down toward the 1st support.
Pivot: 0.5755
Supporting reasons: Identified as a pullback resistance, where selling pressures could intensify and potentially cap any upward retracement.
1st support: 0.5686
Supporting reasons: Identified as aa swing low support, this area has provided strong support historically and may attract buying interest for a potential short-term bounce
1st resistance: 0.5809
Supporting reasons: Identified as a pullback resistance that aligns with the 78.6% Fibonacci retracement, indicating a potential area that could halt any further upward movement.
US30 (DJIA):
Potential Direction: Bullish
Overall momentum of the chart: Bullish
The price could see a short-term pullback toward the pivot before rising again toward the 1st resistance.
Pivot: 47,059.94
Supporting reasons: Identified as a pullback support, indicating a potential area where buying interest could pick up
1st support: 46,447.27
Supporting reasons: Identified as a pullback support, suggesting a potential area where the price could stabilize once again.
1st resistance: 48,184.09
Supporting reasons: Identified as a resistance that is supported by the 161.8% Fibonacci extension and the 100% Fibonacci projection, indicating a potential area that could halt any further upward movement.
DE40 (DAX):
Potential Direction: Bearish
Overall momentum of the chart: Bullish
The price could see a short-term pullback toward the pivot before continuing its bearish move down toward the 1st support.
Pivot: 24,175.32
Supporting reasons: Identified as a pullback resistance that aligns with the 78.6% Fibonacci retracement, where selling pressures could intensify and potentially cap any upward retracement.
1st support: 23,935.25
Supporting reasons: Identified as an overlap support that aligns with the 61.8% Fibonacci retracement, indicating a key level where the price could stabilize once more.
1st resistance: 24,340.30
Supporting reasons: Identified as an overlap resistance, indicating a potential area that could halt any further upward movement.
US500 (S&P 500):
Potential Direction: Bullish
Overall momentum of the chart: Bullish
The price is falling toward the pivot and could make a short-term pullback toward this level before rising again toward the 1st resistance.
Pivot: 6,760.21
Supporting reasons: Identified as a pullback support, indicating a potential area where buying interest could pick up
1st support: 6,696.60
Supporting reasons: Identified as a pullback support, indicating a potential level where the price could stabilize once again.
1st resistance: 6,922.99
Supporting reasons: Identified as a swing high resistance that is supported by the 161.8% Fibonacci extension, indicating a potential area that could halt any further upward movement.
BTC/USD (Bitcoin):
Potential Direction: Bearish
Overall momentum of the chart: Bullish
The price has already reacted off the pivot and may continue its bearish move toward the 1st support
Pivot: 111,191.38
Supporting reasons: Identified as an overlap resistance, where selling pressures could intensify and potentially cap any upward retracement
1st support: 104,980.51
Supporting reasons: Identified as a swing low support, indicating a potential level where the price could stabilize once more.
1st resistance: 115,531.59
Supporting reasons: Identified as a multi swing high resistance, indicating a potential area that could halt any further upward movement.
ETH/USD (Ethereum):
Potential Direction: Bearish
Overall momentum of the chart: Bullish
The price could see a short-term pullback toward the pivot before continuing its bearish move down toward the 1st support.
Pivot: 3,937.06
Supporting reasons: Identified as a pullback resistance, where selling pressures could intensify and potentially cap any upward retracement.
1st support: 3,694.07
Supporting reasons: Identified as a swing low support, indicating a potential level where the price could stabilize once more.
1st resistance: 4,051.57
Supporting reasons: Identified as a pullback resistance, indicating a potential area that could halt any further upward movement.
WTI/USD (Oil):
Potential Direction: Bullish
Overall momentum of the chart: Bullish
The price has already bounced off the pivot and may continue its bullish move toward the 1st resistance
Pivot: 60.18
Supporting reasons: Identified as an overlap support that aligns with the 38.2% Fibonacci retracement, where renewed buying pressure could emerge to push the price higher.
1st support: 57.72
Supporting reasons: Identified as a pullback support that aligns with the 78.6% Fibonacci retracement, indicating a key level where the price could stabilize once more.
1st resistance: 63.15
Supporting reasons: Identified as an overlap resistance that aligns with the 61.8% Fibonacci retracement, indicating a potential area that could halt any further upward movement.
XAU/USD (GOLD):
Potential Direction: Bearish
Overall momentum of the chart: Bullish
The price could see a short-term pullback toward the pivot before continuing its bearish move down toward the 1st support.
Pivot: 4,053.83
Supporting reasons: Identified as a pullback resistance, where selling pressures could intensify and potentially cap any upward retracement.
1st support: 3,891.10
Supporting reasons: Identified as an overlap support that aligns closely with the 78.6% Fibonacci projection, indicating a key level where the price could stabilize once more.
1st resistance: 4,177.54
Supporting reasons: Identified as a pullback resistance, indicating a potential area that could halt any further upward movement.
The accuracy, completeness and timeliness of the information contained on this site cannot be guaranteed. IC Markets does not warranty, guarantee or make any representations, or assume any liability regarding financial results based on the use of the information in the site.
News, views, opinions, recommendations and other information obtained from sources outside of www.icmarkets.com, used in this site are believed to be reliable, but we cannot guarantee their accuracy or completeness. All such information is subject to change at any time without notice. IC Markets assumes no responsibility for the content of any linked site.
The fact that such links may exist does not indicate approval or endorsement of any material contained on any linked site. IC Markets is not liable for any harm caused by the transmission, through accessing the services or information on this site, of a computer virus, or other computer code or programming device that might be used to access, delete, damage, disable, disrupt or otherwise impede in any manner, the operation of the site or of any user’s software, hardware, data or property.
The post Friday 31st October 2025: Technical Outlook and Review first appeared on IC Markets | Official Blog.
Ex-Dividend 31/10/2025
422924 October 30, 2025 18:00 ICMarkets Market News
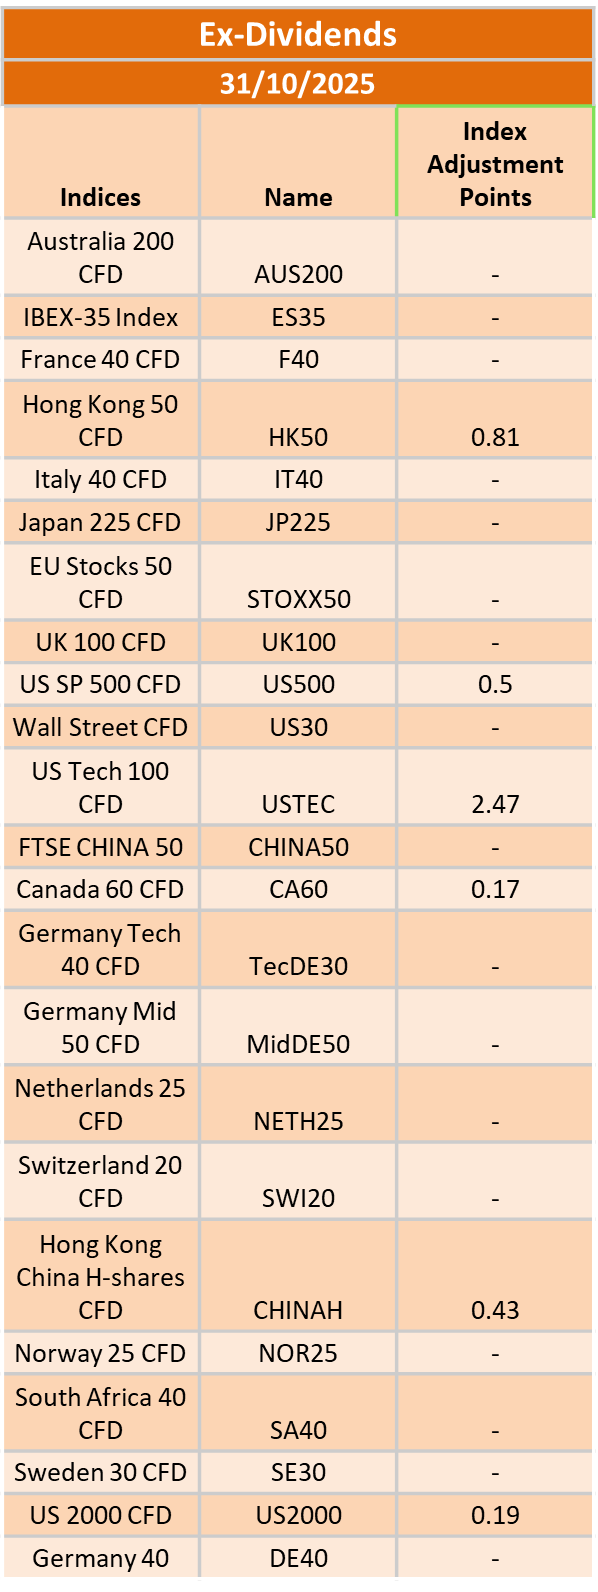
The post Ex-Dividend 31/10/2025 first appeared on IC Markets | Official Blog.
General Market Analysis – 30/10/25
422919 October 30, 2025 16:15 ICMarkets Market News
Fed Cut Overshadowed by Hawkish Tone – Dow Down 0.15%
Markets moved sharply overnight after the Federal Reserve delivered a 25-basis-point rate cut, but the move was largely overshadowed by a more hawkish tone in both the accompanying statement and Chair Powell’s press conference. The mixed message unsettled investors, leaving U.S. equities without clear direction by the close. The Dow dipped 0.16% to close at 47,632, while the S&P 500 held near 6,890. Tech stocks fared better, helping the Nasdaq gain 0.55% to 23,958. The U.S. Dollar Index strengthened 0.56% to 99.22, while U.S. Treasury yields surged, with the 2-year rising 10.8 basis points to 3.602% and the 10-year up 8.6 basis points to 4.070%. Oil prices edged higher, with Brent crude up 0.36% to $64.63 and WTI gaining 0.56% to $60.48. Gold, meanwhile, endured a volatile session before ultimately falling 0.56% to $3,929.36, pressured by the stronger dollar and rising yields.
Dollar Pushes Higher After Fed Meeting
The dollar gained ground across the majors yesterday after the Federal Reserve Bank cut rates by 25 basis points as expected but was much more hawkish on its forward guidance than the market expected. Fed Chair Jerome Powell advised that another rate cut in December was by no means a foregone conclusion, and market pricing dropped from around 90% to 60% for a cut at the next meeting. Treasury yields and the dollar both jumped higher, and FX traders are now set for interest rate differential trades that traditionally take longer-term trends to exert more pressure over the next few days. The Bank of Japan is the next cab off the rank today, and if they pull back significantly on their previous hawkish outlook, USD/JPY could push much higher in the coming sessions.
Another Busy Day for Traders Ahead
It promises to be another busy day on the data and central bank front. In Asia, focus will be firmly on Japan, where the Bank of Japan is set to announce its latest interest rate decision, followed by a press conference that could shed light on the outlook for policy normalization and yen intervention risks. We are also set to hear from President Trump when he updates the markets on the China–U.S. trade situation. In the London session, attention will turn to a series of key inflation and growth releases. Germany will publish its preliminary CPI figures throughout the day, while Spain’s flash CPI data is due out shortly after. Later in the session, German GDP numbers will provide further insight into the health of Europe’s largest economy. The spotlight will then shift to the European Central Bank, with its interest rate decision scheduled midway through the day, followed by President Lagarde’s press conference. Markets will be watching closely for any shift in tone regarding inflation persistence and potential easing in the months ahead. The New York session is relatively quiet, with little on the cards; however, expect more fallout from the Fed’s latest update and any further geopolitical news.
The post General Market Analysis – 30/10/25 first appeared on IC Markets | Official Blog.