Articles

IC Markets Global – Europe Fundamental Forecast | 12 December 2025
424501 December 12, 2025 16:00 ICMarkets Market News
IC Markets Global – Europe Fundamental Forecast | 12 December 2025
What happened in the Asia session?
Markets continued to digest a Fed cut that was accompanied by cautious guidance, leaving the U.S. dollar weaker but risk sentiment mixed rather than decisively positive. A firmer‑than‑expected Australian unemployment print and lingering disinflation signals from U.S. wage data added nuance, supporting AUD domestically but not enough to prevent it from underperforming in a risk‑off FX mix dominated by stronger EUR and JPY, softer equities, and a powerful silver rally to fresh record highs.
What does it mean for the Europe & US sessions?
As European and U.S. trading get underway, the focus is on eurozone flash November CPI, U.K. growth and production data, and Canadian releases, all arriving against a backdrop of a dovish Fed cut that has weakened the dollar and buoyed risk appetite. With the SNB having just held rates at 0% and investors already looking ahead to late‑December ECB and BoE meetings, today’s numbers will be scrutinised for confirmation that inflation is converging on targets without a sharp growth hit.
The Dollar Index (DXY)
Key news events today
President Trump Speaks (11:15 am GMT)
What can we expect from DXY today?
The US dollar is trading weak today, hovering near multi‑week lows against major currencies as markets continue to react to this week’s Federal Reserve rate cut and dovish outlook, with the dollar index (DXY) around the high‑98 area and down notably over the past month and year.
Central Bank Notes:
- The Federal Open Market Committee (FOMC) is widely expected to lower the federal funds rate target range by 25 basis points to 3.50%–3.75% at its December 9–10, 2025, meeting, marking the third consecutive cut after the October reduction to 3.75%–4.00%
- The Committee continues to pursue maximum employment and 2% inflation goals, with the labor market showing further softening as the unemployment rate rose to 4.4% in September 2025 amid modest job gains.
- Officials note persistent downside risks to growth alongside resilient activity, with inflation easing to 3.0% year-over-year CPI in September but remaining elevated due to tariff effects; core PCE stands at around 2.8% as of October.
- Economic activity grew at a 3.8% annualized pace in Q2 2025 per revised estimates, though Q3 and Q4 face headwinds from trade tensions, fiscal restraint, and data disruptions like the government shutdown.
- September’s Summary of Economic Projections forecasts 2025 unemployment at a median 4.5%, with PCE inflation near 3.0% and core PCE at 3.1%, signaling a gradual disinflation path; updates expected on December 10 may adjust for higher unemployment and lower growth.
- The Committee maintained its data-dependent approach, noting a softening labor market and inflation above the 2% target, while deciding to lower the federal funds rate target range by 25 basis points to 3.50%-3.75%. Dissent persisted, with multiple members opposing the cut or advocating for a hold, reflecting divisions similar to recent meetings.
- The FOMC confirmed the conclusion of its quantitative tightening program effective December 1, 2025, with Treasury rolloff caps at $5 billion per month and agency MBS caps at $35 billion per month to ensure ample reserves and market stability.
- The next meeting is scheduled for 27 to 28 January 2026.
Next 24 Hours Bias
Medium bearish
Gold (XAU)
Key news events today
President Trump Speaks (11:15 am GMT)
What can we expect from Gold today?
Gold remains close to record territory today around the mid‑4,200 USD per ounce level, supported by expectations of further U.S. rate cuts, subdued real yields, and a softer dollar, even as short‑term traders occasionally take profits. Retail prices in key markets like India and U.S.-linked benchmarks (quoted in rupees) are slightly higher than yesterday, confirming the strength of the underlying trend.
Next 24 Hours Bias
Strong Bullish
The Euro (EUR)
Key news events today
No major news event
What can we expect from EUR today?
The euro is trading near a seven‑week high against the US dollar, hovering close to 1.17 after steadily strengthening from early December and November lows. This advance reflects a combination of broad dollar softness following the Federal Reserve’s latest rate cut and relatively stable expectations for European Central Bank policy, with officials signaling resilience in the eurozone economy and little urgency to change rates.
Central Bank Notes:
- The Governing Council of the ECB kept the three key interest rates unchanged at its 30 October 2025 meeting. The main refinancing rate remains at 2.15%, the marginal lending facility at 2.40%, and the deposit facility at 2.00%. This decision reflects policymakers’ assessment that the current monetary stance remains consistent with medium-term price stability, while incoming data confirm a gradual return of inflation towards the target.
- Recent indicators point to stable price dynamics. Headline inflation remains near the 2% mark, with energy prices contained and food inflation easing slightly after earlier supply bottlenecks. Wage growth continues to moderate, contributing to the slowdown in domestic cost pressures. The ECB reiterated its commitment to a data-driven, meeting-by-meeting approach and emphasized flexibility amid uncertain global financial conditions.
- Eurosystem staff projections have not been materially altered since September. Headline inflation averages remain at 2.0% for 2025, 1.8% for 2026, and 2.0% for 2027. Recent softening in producer prices and subdued pipeline pressures suggest limited upside risks to inflation, though geopolitical tensions and potential commodity shocks continue to pose uncertainties to the outlook.
- Euro area GDP growth remains on track with earlier forecasts, projected at 1.1% for 2025, 1.1% for 2026, and 1.4% for 2027. Forward-looking indicators, including PMIs and industrial sentiment surveys, signal some stabilization in activity following weakness in the third quarter. Public investment and recovering export activity are expected to offset softer private sector demand in the near term.
- The labor market remains resilient, with unemployment rates at multi-decade lows and participation rates strong. Real income growth continues to support household spending, even as consumption growth normalizes from earlier highs. Financing conditions remain favorable, supported by stable banking-sector liquidity and improved credit demand among small and medium-sized firms.
- Business sentiment remains mixed, reflecting lingering uncertainty over global trade policy and the path of US tariffs. However, easing supply chain costs and improved export competitiveness due to softer exchange rates are providing some relief to manufacturing and external-oriented sectors.
- The Governing Council reaffirmed that future decisions will depend on an integrated assessment of incoming data—covering inflation trends, financial conditions, and the state of policy transmission. The Council emphasized that no pre-set path for rates exists; keeping all options open should the economic outlook shift markedly.
- Balance sheet reduction continues smoothly, with holdings under the APP and PEPP declining as reinvestments have ceased. The ECB confirmed that the pace of portfolio runoff remains in line with its previously communicated normalization plan, supporting a gradual withdrawal of monetary accommodation in a predictable manner.
- The next meeting is on 17 to 18 December 2025
Next 24 Hours Bias
Medium Bullish
The Swiss Franc (CHF)
Key news events today
No major news event
What can we expect from CHF today?
The Swiss franc is trading strongly today, holding near multi‑year highs against the US dollar and remaining firm versus the euro, supported by a steady Swiss National Bank (SNB) policy rate at 0% and a softer US dollar following the latest Federal Reserve meeting.
Central Bank Notes:
- At its 11 December 2025 monetary policy assessment, the Swiss National Bank (SNB) is widely expected to leave the policy rate unchanged at 0%, extending the pause that began in September as the Governing Board judges that current settings are sufficient to keep inflation near, but still below, its target while avoiding an unnecessary move into negative rates.
- Recent data show that the tentative rebound in Swiss inflation has stalled, with headline CPI easing from 0.1% year‑on‑year in October to 0.0% in November and core inflation slipping to about 0.4%, reinforcing the view that underlying price pressures remain very weak and that deflation risks, while contained, have not fully disappeared.
- The SNB’s conditional inflation forecast is likely to remain close to the September projections, with inflation still seen averaging roughly 0.2% in 2025, 0.5% in 2026, and 0.7% in 2027 under an unchanged policy rate path, though the latest CPI prints argue for a slightly lower near‑term profile and keep open the option of renewed easing if activity or prices weaken further.
- The global backdrop has deteriorated further, as continuing U.S. tariff actions and softer external demand weigh on world trade, while uncertainty in key European and U.S. markets for Swiss exports persists, leaving the SNB cautious about the growth outlook despite Switzerland’s relatively resilient domestic demand.
- Business and labor‑market sentiment in export‑oriented manufacturing remains subdued, with firms reporting pressure on margins from the still‑strong franc and softer foreign orders, although the broader economy is still expected to grow at around 1–1.5% in 2025 and unemployment only drifting up gradually from low levels.
- The SNB continues to stress its willingness to act if deflation risks re‑emerge, reiterating that it can ease policy through renewed rate cuts or targeted foreign‑exchange intervention if necessary, while also highlighting its commitment to transparent communication, including the publication of detailed minutes from recent assessments and ongoing dialogue with international partners on FX policy
The next meeting is on 19 March 2026.
Next 24 Hours Bias
Medium Bullish
The Pound (GBP)
Key news events today
GDP m/m (7:00 am GMT)
What can we expect from GBP today?
The Pound is consolidating near recent multi‑week highs against the dollar around the mid‑1.33 to 1.34 region, supported by a weaker dollar after the latest Federal Reserve rate cut and expectations that US policy will continue to ease. However, sterling’s momentum has cooled slightly, particularly versus the euro, as traders turn their attention to a busy run of UK data starting with monthly GDP on Friday and then labour and inflation figures, all feeding into a Bank of England meeting where markets almost fully price in another small rate cut.
Central Bank Notes:
- The Bank of England’s Monetary Policy Committee (MPC) met on 6 November 2025 and voted 7–2 to keep the Bank Rate unchanged at 4.00 percent for a second consecutive meeting. The decision reflects the Committee’s cautious approach as inflation remains above target, but underlying economic momentum continues to weaken. Two members maintained their votes for a 25-basis-point cut, citing further signs of labor-market softening and weak business sentiment.
- The BOE adjusted its guidance on quantitative tightening (QT), maintaining the reduced pace established in September. The planned reduction of UK government bond holdings remains at £67.5 billion over the next 12 months, leaving the current gilt balance near £550 billion. Policymakers described the recalibrated QT path as “appropriate for current market conditions,” emphasizing the importance of liquidity management amid heightened volatility.
- Headline inflation moderated slightly to 3.6 percent in October from 3.8 percent previously, driven by easing food and transport prices. However, core inflation has shown only gradual progress, holding near 3.9 percent. The MPC noted that services inflation and administered energy costs continue to exert pressure, highlighting the challenge of achieving the 2 percent target sustainably. The Committee’s latest projections see inflation falling toward 3 percent by mid-2026, with further downside expected if energy and wage dynamics continue to normalize.
- Economic activity remains subdued. Estimates place Q3 GDP growth close to zero, with both business output and consumer spending restrained. The unemployment rate has edged up to 4.8 percent, while pay growth cooled to just under 5 percent year-on-year. MPC members acknowledged that pay settlements are weakening further, signaling an easing in labor cost pressures as demand softens. Surveys from the manufacturing and services sectors suggest muted hiring intentions through year-end.
- International factors continue to complicate the policy outlook. Fluctuating oil prices—partly linked to renewed Middle East tensions—alongside fragile global demand have contributed to higher market volatility. The MPC reiterated that external shocks, including global food and energy disruptions, could temporarily slow the disinflation path but remain unlikely to derail the medium-term moderation in prices.
- The Committee assessed risks around inflation as balanced. Downside risks arise from sluggish domestic growth and declining real income momentum, while upside risks remain tied to elevated inflation expectations and stubborn services inflation. Policymakers emphasized the need for patience, maintaining that any rate cuts ahead of clear inflation progress could undermine confidence in policy credibility.
- The MPC’s overall stance remains restrictive but increasingly balanced, with future moves expected to follow a cautious, data-driven trajectory. The Committee reaffirmed that monetary policy will stay tight until there is compelling evidence that inflation is returning to the 2 percent target on a durable basis.
- The next meeting is on 18 December 2025.
Next 24 Hours Bias
Medium Bullish
The Canadian Dollar (CAD)
Key news events today
No major news event
What can we expect from CAD today?
The Pound is consolidating near recent multi‑week highs against the dollar around the mid‑1.33 to 1.34 region, supported by a weaker dollar after the latest Federal Reserve rate cut and expectations that US policy will continue to ease. However, sterling’s momentum has cooled slightly, particularly versus the euro, as traders turn their attention to a busy run of UK data starting with monthly GDP on Friday and then labour and inflation figures, all feeding into a Bank of England meeting where markets almost fully price in another small rate cut.
Central Bank Notes:
- The Council noted that U.S. tariff tensions have eased slightly following early progress in bilateral discussions, though the external trade environment remains fragile. Businesses continue to hold back on long-term investment, with the Bank highlighting that sustained clarity on U.S. trade policy is needed to restore confidence.
- The Bank acknowledged that uncertainty persists despite the softer U.S. tone, as incoming data show limited improvement in export orders. The manufacturing sector has stabilized but remains below pre-2024 output levels, reflecting weak global demand and cautious corporate spending.
- Canada’s economy showed tentative signs of recovery in early Q4, with GDP estimated to expand by 0.3% in October after two quarters of contraction. Mining and energy activity strengthened modestly, aided by steady crude demand, while goods exports posted a fractional gain.
- Service sector growth remained uneven, supported mainly by tourism-related and technology services. However, retail spending and household consumption were subdued, constrained by slower job creation and lingering consumer caution. The Bank judged overall momentum as fragile but improving marginally.
- Housing activity showed modest reacceleration in major urban markets as mortgage rates stabilized near record lows. Nonetheless, affordability pressures and stricter lending standards continue to limit overall resale volumes, resulting in only a gradual recovery in the housing sector.
- Headline CPI inflation rose to 2.1% in October, reaching the Bank’s target for the first time in six months. Higher energy prices and a modest uptick in food and shelter costs drove the increase. Core inflation measures remained stable, suggesting underlying price pressures are contained.
- The Governing Council reiterated its data-dependent stance, indicating that the current policy rate remains appropriate amid tentative growth and balanced inflation risks. Officials noted that while additional stimulus is not ruled out, the emphasis has shifted toward monitoring the sustainability of the recovery rather than immediate rate adjustments.
- The next meeting is on 17 to 18 December 2025.
Next 24 Hours Bias
Medium Bullish
Oil
Key news events today
No major news event
What can we expect from Oil today?
Oil markets are trading slightly lower, with WTI in the high‑50s and Brent a little above 62 USD per barrel, extending a recent downtrend that has left both benchmarks well below year‑ago levels. OPEC and OPEC+ have left their 2025–2026 demand growth forecasts unchanged while production from core members and US producers stays high, reinforcing fears of a mild surplus. Geopolitical tensions from US actions against sanctioned Venezuelan barrels to disruptions involving Russian‑linked tankers have injected brief support, but risk‑off sentiment in broader markets and concerns about oversupply continue to outweigh these factors, keeping crude under pressure.
Next 24 Hours Bias
Medium Bearish
The post IC Markets Global – Europe Fundamental Forecast | 12 December 2025 first appeared on IC Markets | Official Blog.
IC Markets Global – Asia Fundamental Forecast | 12 December 2025
424500 December 12, 2025 16:00 ICMarkets Market News
IC Markets Global – Asia Fundamental Forecast | 12 December 2025
What happened in the U.S. session?
markets largely traded the aftershocks of the Federal Reserve’s 25 bp rate cut and cautious guidance, alongside a better‑than‑expected narrowing in the U.S. trade deficit. Equities led the risk rally, with the Dow and S&P 500 at or near record territory, while Treasuries rallied and the dollar softened as investors leaned into a lower‑for‑longer rate profile. Precious metals, particularly silver, stayed firm on the back of weaker yields and a softer dollar, whereas crude oil eased as growth and demand concerns offset supply‑side tension.
What does it mean for the Asia Session?
Asian traders face a session shaped by a fresh US equity record and a dovish Fed cut, which have lifted regional futures and weakened the dollar, but with some caution emerging around expensive tech names and the durability of the risk rally. Focus in Asia will fall on Japan’s industrial output and utilisation data, China’s November credit and money statistics, and any Fed commentary that could refine market pricing for 2026 cuts, all set against ongoing concerns about Chinese growth, property‑sector strains, and uneven global expansion.
The Dollar Index (DXY)
Key news events today
President Trump Speaks (11:15 am GMT)
What can we expect from DXY today?
Friday opens with a softer U.S. dollar, as the Dollar Index hovers in the high‑98s after sliding on a dovish Fed rate cut and the announcement of new Treasury‑bill purchases that pulled U.S. yields down. Major counterparts such as the euro and pound have benefited from this shift, while dollar gains against the yen have paused near resistance as investors look ahead to potential Bank of Japan tightening. With the dollar down about 8–9% over the past year and analysts expecting further gradual slippage as yield gaps narrow, markets are treating the current weakness as part of a broader late‑cycle downtrend rather than a one‑day move.
Central Bank Notes:
- The Federal Open Market Committee (FOMC) is widely expected to lower the federal funds rate target range by 25 basis points to 3.50%–3.75% at its December 9–10, 2025, meeting, marking the third consecutive cut after the October reduction to 3.75%–4.00%
- The Committee continues to pursue maximum employment and 2% inflation goals, with the labor market showing further softening as the unemployment rate rose to 4.4% in September 2025 amid modest job gains.
- Officials note persistent downside risks to growth alongside resilient activity, with inflation easing to 3.0% year-over-year CPI in September but remaining elevated due to tariff effects; core PCE stands at around 2.8% as of October.
- Economic activity grew at a 3.8% annualized pace in Q2 2025 per revised estimates, though Q3 and Q4 face headwinds from trade tensions, fiscal restraint, and data disruptions like the government shutdown.
- September’s Summary of Economic Projections forecasts 2025 unemployment at a median 4.5%, with PCE inflation near 3.0% and core PCE at 3.1%, signaling a gradual disinflation path; updates expected on December 10 may adjust for higher unemployment and lower growth.
- The Committee maintained its data-dependent approach, noting a softening labor market and inflation above the 2% target, while deciding to lower the federal funds rate target range by 25 basis points to 3.50%-3.75%. Dissent persisted, with multiple members opposing the cut or advocating for a hold, reflecting divisions similar to recent meetings.
- The FOMC confirmed the conclusion of its quantitative tightening program effective December 1, 2025, with Treasury rolloff caps at $5 billion per month and agency MBS caps at $35 billion per month to ensure ample reserves and market stability.
- The next meeting is scheduled for 27 to 28 January 2026.
Next 24 Hours Bias
Medium Bearish
Gold (XAU)
Key news events today
President Trump Speaks (11:15 am GMT)
What can we expect from Gold today?
Gold is trading just below record territory today, consolidating in the low‑$4,200s per ounce after a powerful rally fueled by expectations of a December U.S. rate cut, a weaker dollar, and persistent safe‑haven demand. Analysts describe the broader trend as bullish but stretched, with some calling for a short‑term correction toward lower support before any renewed push to fresh highs. Local retail prices in major markets such as India and rupee‑quoted U.S. rates continue to edge higher in line with international benchmarks, highlighting that gold remains a favored hedge as investors navigate uncertain monetary policy and geopolitical risks.
Next 24 Hours Bias
Strong Bullish
The Australian Dollar (AUD)
Key news events today
No major news event
What can we expect from AUD today?
Today, the Australian dollar is consolidating near the mid‑0.66 level against the US dollar, slightly below a recent three‑month high but still notably stronger than at the start of December. Support comes from a hawkish RBA that has kept rates at 3.60% and signalled ongoing concern about inflation, while a softer US dollar and improved risk appetite also underpin the currency. However, weaker Australian employment data and lingering worries about global growth, particularly in China, are tempering upside momentum and leaving AUD/USD sensitive to incoming economic news.
Central Bank Notes:
- The Reserve Bank of Australia held its cash rate steady at 3.60% at the November 2025 policy meeting, adopting a cautious tone amid a surprise uptick in inflation data for the September quarter. This marks the fourth consecutive pause since the 25 basis point cut in August. The Board attributed some of the inflation rise to temporary factors like higher petrol prices and council rates, but noted signs of more persistent pressures from consumer demand.
- Policymakers emphasized vigilance on inflation, with trimmed mean inflation expected to remain elevated in the near term before nearing the 2–3% target midpoint by mid-2027. Recent data showed underlying inflation staying above target until at least the second half of 2026, prompting upward revisions to forecasts. Capacity pressures are seen as slightly more pronounced than previously assessed, delaying any easing.
- Headline CPI for the September quarter exceeded expectations, driven partly by temporary items, while underlying measures signal ongoing stickiness. The shift to monthly CPI reporting, with the first full edition in November 2025, will enhance real-time inflation monitoring. Housing and services remain resilient contributors to price pressures.
- Domestic demand shows firmness in services alongside below-trend growth elsewhere, with capacity pressures not expected to ease significantly. The labor market is gradually softening, with unemployment projected to stabilize around 4.4%, though wage growth and productivity dynamics keep unit labor costs a concern. Household spending faces headwinds from high borrowing costs.
- Global risks include geopolitical tensions and commodity volatility, set against modestly revised-up world growth outlooks. The Board describes its policy as mildly restrictive and data-dependent, balancing inflation control with employment goals. No rate hike was considered despite the inflation surprise.
- Monetary policy remains mildly restrictive to address lingering price stability risks amid household and global vulnerabilities. Communications reaffirm the dual mandate of 2–3% inflation and full employment, with readiness to adjust based on incoming data.
- Market expectations point to the cash rate holding through early 2026, with a possible modest cut to 3.3% mid-year if inflation eases as forecast. The new monthly CPI data will be key for timely insights.
- Monetary policy remains mildly restrictive, balancing progress on price stability against vulnerabilities in household demand and global outlook. Board communications reaffirm a dual mandate: price stability and full employment, while underscoring readiness to respond should risks materialize sharply.
- Analysts generally expect the cash rate to remain at current levels through early 2026, with only modest cuts possible later in the year if inflation moderates. The new monthly CPI release (first full edition Nov 2025) will be watched closely for timely signals on price trends.
- The next meeting is on 2 to 3 February 2026.
Next 24 Hours Bias
Medium Bullish
The Kiwi Dollar (NZD)
Key news events today
No major news event
What can we expect from NZD today?
The New Zealand dollar is trading close to 0.58–0.5830 against the US dollar, near its highest levels in several weeks, as recent Fed easing and a softer US dollar combine with expectations that the RBNZ is nearing the end of its rate‑cutting cycle. Technical analysts view the 0.58 area as a key resistance and inflection zone, with the kiwi having gained around 2–2.5% over the past month and holding firm despite periods of risk‑off sentiment. Attention today is on New Zealand’s Q3 GDP release and whether NZD/USD can consolidate above the 0.58 mark, as the data and price action will shape expectations for both domestic monetary policy and the near‑term trajectory of the currency.
Central Bank Notes:
- The Monetary Policy Committee (MPC) left the Official Cash Rate (OCR) unchanged at 2.25% at its 26 November 2025 meeting, following the widely anticipated 25-basis-point reduction from 2.50%, and signaled that policy is now firmly in stimulatory territory while keeping the option of further easing on the table if needed.
- The decision was again reached by consensus, with members judging that the cumulative 325 basis points of easing over the past year warranted a period of assessment, even as several emphasized a willingness to cut further should incoming data point to a more protracted downturn or renewed disinflationary pressures.
- Headline consumer price inflation is projected to hover near 3% in late 2025 before gradually easing toward the 2% midpoint of the 1–3% target band through 2026, supported by contained inflation expectations around 2.3% over the two-year horizon and an expected pickup in spare capacity.
- The MPC noted that domestic demand remains subdued but shows tentative signs of stabilisation, with softer household spending and construction only partially offset by improving services activity; nevertheless, policymakers still expect services inflation to ease as wage growth moderates and the labour market loosens further over the coming year.
- Financial conditions continue to ease as wholesale and retail borrowing rates reprice to the lower OCR, contributing to gradually rising mortgage approvals and improving housing-related sentiment, although broader business credit growth remains patchy and sensitive to uncertainty about the durability of the recovery.
- Recent data confirm that GDP momentum is weak but not deteriorating as sharply as earlier in 2025, with high-frequency indicators pointing to a shallow recovery from a low base and ongoing headwinds from elevated living costs and fragile confidence weighing on discretionary consumption and investment.
- The MPC reiterated that external risks remain skewed to the downside, particularly from softer Chinese demand and uncertainty around United States trade policy, but noted that a lower New Zealand dollar continues to provide some offset via improved export competitiveness and support for tradables inflation.
- Looking ahead to early 2026, the Committee maintained a mild easing bias, indicating that a further cut toward 2.00–2.10% cannot be ruled out if activity fails to gain traction or if inflation undershoots projections, but current forecasts envisage the OCR remaining near 2.25% for an extended period provided inflation converges toward target and the recovery proceeds broadly as expected.
- The next meeting is on 18 February 2026.
Next 24 Hours Bias
Medium Bullish
The Japanese Yen (JPY)
Key news events today
No major news event
What can we expect from JPY today?
The Japanese yen is slightly stronger on the day, with USD/JPY hovering in the mid‑155s as the dollar retreats after Fed rate cuts and traders increasingly price in a BoJ hike to 0.75% next week. However, the currency remains structurally weak by historical standards due to Japan’s low interest rates, fiscal concerns, and earlier depreciation, even as record softness against the yuan and persistent above‑target domestic inflation keep attention on how far and how fast the BoJ will tighten from here.
Central Bank Notes:
- The Policy Board of the Bank of Japan met on 30–31 October and, by a clear majority vote, decided to maintain its key monetary policy approach for the upcoming period.
- The BOJ will continue to encourage the uncollateralized overnight call rate to remain at around 0.5%, in line with the prior stance.
- The gradual quarterly reduction in monthly outright purchases of Japanese Government Bonds (JGBs) remains intact, with amounts unchanged from the previous schedule. Purchases are set to decrease by about ¥400 billion per quarter through March 2026, shifting to about ¥200 billion per quarter from April to June 2026, and targeting a ¥2 trillion purchase level for Q1 2027. The bank reaffirmed its intention to maintain flexibility, with readiness to respond if market conditions warrant an adjustment.
- Japan’s economy continues to show moderate recovery, primarily led by solid capital expenditures, although export growth and corporate activity remain restrained by external demand uncertainty and the ongoing effects of U.S. trade policies.
- Annual headline inflation (excluding fresh food) accelerated to 2.9% year-on-year in September, marking the first uptick in four months and staying above the BOJ’s 2% target. Broad-based inflation persists, with food and energy cost pressures, but wage growth continues to support household consumption. Input cost pressures from the earlier surge in imports eased slightly.
- Short-term inflation momentum could moderate as food-price hikes ease, though rent, healthcare, and service-sector price increases tied to labor shortages provide support. Firms and households maintain a gradual upward drift in inflation expectations.
- For the near term, BOJ projects growth below trend as external demand stays subdued and corporate investment plans remain cautious. Still, accommodative financial conditions and steady gains in real labor income will underpin domestic consumption.
- Over the medium term, as overseas economies recover and trade conditions normalize, Japan’s growth potential should improve. Persistent labor market tightness, higher wage settlements, and rising medium- to long-term inflation expectations are expected to keep core inflation on a gradual upward trajectory, converging toward the 2% price stability target later in the forecast horizon.
- The next meeting is scheduled for 18 to 19 December 2025.
Next 24 Hours Bias
Medium Bearish
Oil
Key news events today
No major news event
What can we expect from Oil today?
Oil is trading in the high‑$50s to low‑$60s per barrel range on Friday with a slightly firmer tone after recent declines, as traders weigh strong non‑OPEC production and fears of a 2026 glut against OPEC+’s steady demand outlook and ongoing supply risks linked to Venezuela, Russia, and Ukraine‑related tensions.
Next 24 Hours Bias
Medium Bearish
The post IC Markets Global – Asia Fundamental Forecast | 12 December 2025 first appeared on IC Markets | Official Blog.
Friday 12th December 2025: Asian Markets Gain Momentum Following Fed Rate Cut and Wall Street Signals
424499 December 12, 2025 15:39 ICMarkets Market News
Global Markets:
- Asian Stock Markets : Nikkei up 0.97%, Shanghai Composite down -0.04%, Hang Seng up 1.26% ASX up 1.18%
- Commodities : Gold at $4,301.45 (-0.26%), Silver at $63.950 (-0.99%), Brent Oil at $61.68 (0.65%), WTI Oil at $58.01 (0.71%)
- Rates : US 10-year yield at 4.153, UK 10-year yield at 4.4870, Germany 10-year yield at 2.8456
News & Data:
- (USD) Unemployment Claims 236K to 220K expected
Markets Update:
Asian stock markets are trading mostly higher on Friday, supported by mixed cues from Wall Street and ongoing reactions to the US Federal Reserve’s widely expected third consecutive rate cut. The Fed’s softer-than-anticipated outlook on future policy also lifted sentiment, although Asian markets had ended mostly lower on Thursday.
Australian shares are sharply higher, extending Thursday’s strong gains. The S&P/ASX 200 has climbed well past 8,650, led by notable strength in mining stocks, particularly gold miners amid soaring bullion prices. Major miners such as BHP Group, Fortescue and Rio Tinto are advancing nearly 2 percent each. Tech stocks are modestly higher, while oil stocks are mostly weaker. Australia’s currency is trading at $0.666.
Japan’s Nikkei 225 is also trading significantly higher, reversing losses from the previous two sessions. The index has moved above 50,600, supported by index heavyweights and exporter stocks, though technology names remain under pressure. SoftBank and Fast Retailing are posting strong gains, while major automakers and financial stocks are also advancing.
Across the region, markets in New Zealand, Hong Kong, Singapore, South Korea, Malaysia and Taiwan are higher, while China and Indonesia are slightly lower.
On Wall Street, trading was mixed, with the Dow surging to a record close while the Nasdaq pulled back. European markets moved broadly higher. Meanwhile, crude oil prices declined on Thursday, with WTI settling at $57.58 amid oversupply concerns.
Upcoming Events:
- 01:30 PM GMT – CAD Building Permits m/m
The post Friday 12th December 2025: Asian Markets Gain Momentum Following Fed Rate Cut and Wall Street Signals first appeared on IC Markets | Official Blog.
Friday 12th December 2025: Technical Outlook and Review
424483 December 12, 2025 15:39 ICMarkets Market News
DXY (U.S. Dollar Index):
Potential Direction: Bearish
Overall momentum of the chart: Bearish
The price could see a short-term pullback toward the pivot before continuing its bearish move down toward the 1st support.
Pivot: 98.77
Supporting reasons: Identified as a pullback resistance, where selling pressures could intensify and potentially cap any upward retracement.
1st support: 97.97
Supporting reasons: Identified as an overlap support that aligns with the 161.8% Fibonacci extension, indicating a potential area where the price could again stabilize.
1st resistance: 99.06
Supporting reasons: Identified as a pullback resistance, indicating a potential area that could halt any further upward movement
EUR/USD:
Potential Direction: Bullish
Overall momentum of the chart: Bearish
The price could see a short-term pullback toward the pivot before rising again toward the 1st resistance.
Pivot: 1.1710
Supporting reasons: Identified as a pullback support, where renewed buying pressure could emerge to push the price higher.
1st support: 1.1644
Supporting reasons: Identified as a pullback support, indicating a potential level where the price could stabilize once again.
1st resistance: 1.1778
Supporting reasons: Identified as a swing high resistance, indicating a potential level that could cap further upward movement.
EUR/JPY:
Potential Direction: Bullish
Overall momentum of the chart: Bullish
The price could see a short-term pullback toward the pivot before rising again toward the 1st resistance.
Pivot: 181.69
Supporting reasons: Identified as an overlap support, where renewed buying pressure could emerge to push the price higher.
1st support: 179.92
Supporting reasons: Identified as a pullback support that aligns with the 50% Fibonacci retracement, indicating a potential area where the price could again stabilize.
1st resistance: 183.43
Supporting reasons: Identified as a resistance that is supported by the 161.8% Fibonacci extension, indicating a potential level that could cap further upward movement.
EUR/GBP:
Potential Direction: Bullish
Overall momentum of the chart: Bullish
The price could see a short-term pullback toward the pivot before rising again toward the 1st resistance.
Pivot: 0.8749
Supporting reasons: Identified as a pullback support, where renewed buying pressure could emerge to push the price higher.
1st support: 0.8722
Supporting reasons: Identified as a multi-swing low support, indicating a potential area where the price could stabilize once more.
1st resistance: 0.8799
Supporting reasons: Identified as a pullback resistance, indicating a potential level that could cap further upward movement.
GBP/USD:
Potential Direction: Bullish
Overall momentum of the chart: Bullish
The price could see a short-term pullback toward the pivot before rising again toward the 1st resistance.
Pivot: 1.3353
Supporting reasons: Identified as a pullback support, where renewed buying pressure could emerge to push the price higher.
1st support: 1.3287
Supporting reasons: Identified as an overlap support, indicating a potential area where the price could stabilize once more.
1st resistance: 1.3452
Supporting reasons: Identified as a swing high resistance that aligns with the 78.6% Fibonacci retracement, indicating a potential level that could halt further upward movement.
GBP/JPY:
Potential Direction: Bullish
Overall momentum of the chart: Bullish
The price could see a short-term pullback toward the pivot before rising again toward the 1st resistance.
Pivot: 207.17
Supporting reasons: Identified as an overlap resistance, where selling pressures could intensify and potentially cap any upward retracement
1st support: 205.32
Supporting reasons: Identified as an overlap support, indicating a potential level where the price could stabilize once more.
1st resistance: 209.23
Supporting reasons: Identified as a resistance that is supported by the 127.2% Fibonacci projection, indicating a potential level that could halt further upward movement.
USD/CHF:
Potential Direction: Bearish
Overall momentum of the chart: Bearish
The price could see a short-term pullback toward the pivot before continuing its bearish move down toward the 1st support.
Pivot: 0.7987
Supporting reasons: Identified as a pullback resistance, where selling pressures could intensify and potentially cap any upward retracement.
1st support: 0.7926
Supporting reasons: Identified as a pullback support that aligns with the 78.6% Fibonacci retracement, indicating a potential level where the price could stabilize once again.
1st resistance: 0.8028
Supporting reasons: Identified as a pullback resistance, indicating a potential level that could cap further upward movement.
USD/JPY:
Potential Direction: Bullish
Overall momentum of the chart: Bullish
The price could see a short-term pullback toward the pivot before rising again toward the 1st resistance.
Pivot: 155.34
Supporting reasons: Identified as a pullback support that aligns with the 61.8% Fibonacci retracement, where renewed buying pressure could emerge to push the price higher.
1st support: 153.26
Supporting reasons: Identified as an overlap support, indicating a strong area where buyers might return, and the price could stabilize once again.
1st resistance: 157.61
Supporting reasons: Identified as a swing high resistance. This level represents the next key area where upward movement could be capped amid increased selling pressure
USD/CAD:
Potential Direction: Bearish
Overall momentum of the chart: Bearish
The price could see a short-term pullback toward the pivot before continuing its bearish move down toward the 1st support.
Pivot: 1.3890
Supporting reasons: Identified as a pullback resistance, where selling pressures could intensify and potentially cap any upward retracement.
1st support: 1.3768
Supporting reasons: Identified as a swing low support, indicating a key level where the price could stabilize once more.
1st resistance: 1.3960
Supporting reasons: Identified as an overlap resistance, making it a possible target for bullish advances and a level where some sellers could return to cap gains
AUD/USD:
Potential Direction: Bullish
Overall momentum of the chart: Bullish
The price could see a short-term pullback toward the pivot before rising again toward the 1st resistance.
Pivot: 0.6628
Supporting reasons: Identified as a pullback support, where renewed buying pressure could emerge to push the price higher.
1st support: 0.6572
Supporting reasons: Identified as a pullback support, this area has provided strong support historically and may attract buying interest for a potential short-term bounce
1st resistance: 0.6684
Supporting reasons: Identified as an overlap resistance that aligns with the 161.8% Fibonacci extension, indicating a potential area that could halt any further upward movement.
NZD/USD
Potential Direction: Bullish
Overall momentum of the chart: Bullish
The price could see a short-term pullback toward the pivot before rising again toward the 1st resistance.
Pivot: 0.5796
Supporting reasons: Identified as a pullback support, where renewed buying pressure could emerge to push the price higher.
1st support: 0.5761
Supporting reasons: Identified as an overlap support, this area has provided strong support historically and may attract buying interest for a potential short-term bounce
1st resistance: 0.5869
Supporting reasons: Identified as an overlap resistance that aligns with the 127.2% Fibonacci extension, indicating a potential area that could halt any further upward movement.
US30 (DJIA):
Potential Direction: Bullish
Overall momentum of the chart: Bullish
The price could see a short-term pullback toward the pivot before rising again toward the 1st resistance.
Pivot: 48,422.44
Supporting reasons: Identified as a pullback support, where renewed buying pressure could emerge to push the price higher.
1st support: 47,994.03
Supporting reasons: Identified as a pullback support, suggesting a potential area where the price could stabilize once again.
1st resistance: 49,168.48
Supporting reasons: Identified as a resistance that is supported by the 127.2% Fibonacci extension, indicating a potential area that could halt any further upward movement.
DE40 (DAX):
Potential Direction: Bullish
Overall momentum of the chart: Bullish
The price could see a short-term pullback toward the pivot before rising again toward the 1st resistance.
Pivot: 23,945.80
Supporting reasons: Identified as a pullback support, where renewed buying pressure could emerge to push the price higher.
1st support: 23,488.00
Supporting reasons: Identified as a pullback support, indicating a key level where the price could stabilize once more.
1st resistance: 24,444.50
Supporting reasons: Identified as a swing high resistance that aligns with the 100% Fibonacci projection, indicating a potential area that could halt any further upward movement.
US500 (S&P 500):
Potential Direction: Bullish
Overall momentum of the chart: Bullish
The price could see a short-term pullback toward the pivot before rising again toward the 1st resistance.
Pivot: 6,773.23
Supporting reasons: Identified as a pullback support, where renewed buying pressure could emerge to push the price higher.
1st support: 6,673.25
Supporting reasons: Identified as an overlap support, indicating a potential level where the price could stabilize once again.
1st resistance: 6,920.20
Supporting reasons: Identified as a swing high resistance, indicating a potential area that could halt any further upward movement.
BTC/USD (Bitcoin):
Potential Direction: Bearish
Overall momentum of the chart: Bearish
The price has already reacted off the pivot and may continue its bearish move toward the 1st support.
Pivot: 94,626.34
Supporting reasons: Identified as an overlap resistance that aligns with the 50% Fibonacci retracement, where selling pressures could intensify and potentially cap any upward retracement.
1st support: 88,893.73
Supporting reasons: Identified as an overlap support, indicating a potential level where the price could stabilize once more.
1st resistance: 100,094.87
Supporting reasons: Identified as a pullback resistance, indicating a potential area that could halt any further upward movement.
ETH/USD (Ethereum):
Potential Direction: Bullish
Overall momentum of the chart: Bullish
The price could see a short-term pullback toward the pivot before rising again toward the 1st resistance.
Pivot: 3,180.10
Supporting reasons: Identified as an overlap support, where renewed buying pressure could emerge to push the price higher.
1st support: 2,904.01
Supporting reasons: Identified as a pullback support, indicating a potential level where the price could stabilize once more.
1st resistance: 3,675.59
Supporting reasons: Identified as an overlap resistance, indicating a potential area that could halt any further upward movement.
WTI/USD (Oil):
Potential Direction: Bearish
Overall momentum of the chart: Bullish
The price could see a short-term pullback toward the pivot before continuing its bearish move down toward the 1st support.
Pivot: 58.51
Supporting reasons: Identified as a pullback resistance that aligns with the 61.8% Fibonacci retracement, where selling pressures could intensify and potentially cap any upward retracement.
1st support: 56.79
Supporting reasons: Identified as a swing low support, indicating a key level where the price could stabilize once more.
1st resistance: 59.50
Supporting reasons: Identified as a pullback resistance, indicating a potential area that could halt any further upward movement.
XAU/USD (GOLD):
Potential Direction: Bullish
Overall momentum of the chart: Bullish
The price could see a short-term pullback toward the pivot before rising again toward the 1st resistance.
Pivot: 4,255.04
Supporting reasons: Identified as a pullback support, where renewed buying pressure could emerge to push the price higher.
1st support: 4,145.75
Supporting reasons: Identified as a pullback support, indicating a key level where the price could stabilize once more.
1st resistance: 4,366.45
Supporting reasons: Identified as a swing high resistance that aligns with the 161.8% Fibonacci extension, indicating a potential area that could halt any further upward movement.
The accuracy, completeness and timeliness of the information contained on this site cannot be guaranteed. IC Markets Global does not warranty, guarantee or make any representations, or assume any liability regarding financial results based on the use of the information in the site.
News, views, opinions, recommendations and other information obtained from sources outside of www.icmarkets.com, used in this site are believed to be reliable, but we cannot guarantee their accuracy or completeness. All such information is subject to change at any time without notice. IC Markets Global assumes no responsibility for the content of any linked site.
The fact that such links may exist does not indicate approval or endorsement of any material contained on any linked site. IC Markets Global is not liable for any harm caused by the transmission, through accessing the services or information on this site, of a computer virus, or other computer code or programming device that might be used to access, delete, damage, disable, disrupt or otherwise impede in any manner, the operation of the site or of any user’s software, hardware, data or property.
The post Friday 12th December 2025: Technical Outlook and Review first appeared on IC Markets | Official Blog.
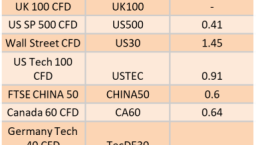
Ex-Dividend 12/12/2025
424466 December 11, 2025 17:14 ICMarkets Market News
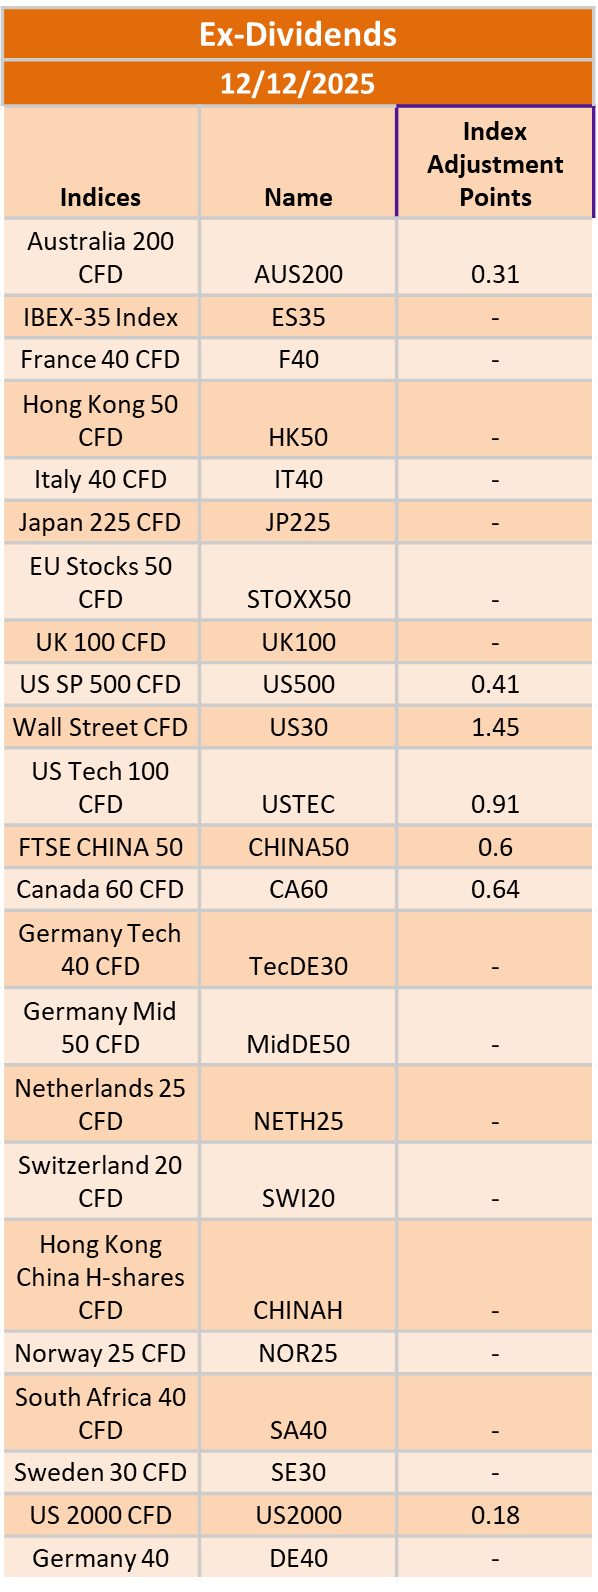
The post Ex-Dividend 12/12/2025 first appeared on IC Markets | Official Blog.
IC Markets Global – Europe Fundamental Forecast | 11 December 2025
424465 December 11, 2025 16:00 ICMarkets Market News
IC Markets Global – Europe Fundamental Forecast | 11 December 2025
What happened in the Asia session?
Markets reacted to the Fed’s third rate cut and hawkish outlook alongside Oracle’s weak AI-driven earnings, with no fresh macro data but Hong Kong’s mirroring rate reduction providing support; tech-heavy instruments like SoftBank and Nasdaq futures bore the brunt of declines, while Hang Seng and silver advanced amid dollar weakness.
What does it mean for the Europe & US sessions?
Traders prioritize delayed U.S. September trade balance and inventories data at 8:30-10:00 AM ET, plus jobless claims, against yesterday’s Fed acknowledgment of moderate growth, rising unemployment, and sticky inflation—potentially amplifying dollar weakness and equity volatility seen in Oracle’s drop and euro gains. European focus remains on November CPI echoes at 2.2% and labor metrics, with no blockbuster prints but Fed/ECB policy ripples in play.
The Dollar Index (DXY)
Key news events today
Unemployment Claims (1:30 pm GMT)
What can we expect from DXY today?
The dollar index dropped to its lowest since October 21, reaching 98.543 against a broader currency basket, as investors sold off amid Fed Chair Jerome Powell’s comments signaling dovish tones. Gains in rival currencies like the euro (above $1.17), yen (to 155.66), Australian dollar, and others pressured the USD further.
Central Bank Notes:
- The Federal Open Market Committee (FOMC) is widely expected to lower the federal funds rate target range by 25 basis points to 3.50%–3.75% at its December 9–10, 2025, meeting, marking the third consecutive cut after the October reduction to 3.75%–4.00%
- The Committee continues to pursue maximum employment and 2% inflation goals, with the labor market showing further softening as the unemployment rate rose to 4.4% in September 2025 amid modest job gains.
- Officials note persistent downside risks to growth alongside resilient activity, with inflation easing to 3.0% year-over-year CPI in September but remaining elevated due to tariff effects; core PCE stands at around 2.8% as of October.
- Economic activity grew at a 3.8% annualized pace in Q2 2025 per revised estimates, though Q3 and Q4 face headwinds from trade tensions, fiscal restraint, and data disruptions like the government shutdown.
- September’s Summary of Economic Projections forecasts 2025 unemployment at a median 4.5%, with PCE inflation near 3.0% and core PCE at 3.1%, signaling a gradual disinflation path; updates expected on December 10 may adjust for higher unemployment and lower growth.
- The Committee maintained its data-dependent approach, noting a softening labor market and inflation above the 2% target, while deciding to lower the federal funds rate target range by 25 basis points to 3.50%-3.75%. Dissent persisted, with multiple members opposing the cut or advocating for a hold, reflecting divisions similar to recent meetings.
- The FOMC confirmed the conclusion of its quantitative tightening program effective December 1, 2025, with Treasury rolloff caps at $5 billion per month and agency MBS caps at $35 billion per month to ensure ample reserves and market stability.
- The next meeting is scheduled for 27 to 28 January 2026.
Next 24 Hours Bias
Medium bearish
Gold (XAU)
Key news events today
Unemployment Claims (1:30 pm GMT)
What can we expect from Gold today?
Gold is trading near 4,215 USD per ounce today and remains in a broadly bullish trend, but price action is more cautious after strong gains in recent weeks. Market participants link the elevated price to expectations of upcoming US rate cuts and ongoing macro uncertainty, while technical analyses emphasize that the uptrend stays intact above support around 4,000–4,050 USD/oz, with scope for further upside toward the mid‑4,000s if sentiment and data remain supportive.
Next 24 Hours Bias
Strong Bullish
The Euro (EUR)
Key news events today
No major news event
What can we expect from EUR today?
Trading in the Euro is shaped more by global dollar weakness and Fed rate‑cut expectations than by any single euro‑area data release, leaving the currency edging up but still capped below the 1.17 resistance zone. In this environment, investors view the Euro as benefiting from relatively stable ECB policy and a slowly improving growth outlook, while remaining sensitive to any surprise in US rates, euro‑area data, or geopolitical developments affecting Europe.
Central Bank Notes:
- The Governing Council of the ECB kept the three key interest rates unchanged at its 30 October 2025 meeting. The main refinancing rate remains at 2.15%, the marginal lending facility at 2.40%, and the deposit facility at 2.00%. This decision reflects policymakers’ assessment that the current monetary stance remains consistent with medium-term price stability, while incoming data confirm a gradual return of inflation towards the target.
- Recent indicators point to stable price dynamics. Headline inflation remains near the 2% mark, with energy prices contained and food inflation easing slightly after earlier supply bottlenecks. Wage growth continues to moderate, contributing to the slowdown in domestic cost pressures. The ECB reiterated its commitment to a data-driven, meeting-by-meeting approach and emphasized flexibility amid uncertain global financial conditions.
- Eurosystem staff projections have not been materially altered since September. Headline inflation averages remain at 2.0% for 2025, 1.8% for 2026, and 2.0% for 2027. Recent softening in producer prices and subdued pipeline pressures suggest limited upside risks to inflation, though geopolitical tensions and potential commodity shocks continue to pose uncertainties to the outlook.
- Euro area GDP growth remains on track with earlier forecasts, projected at 1.1% for 2025, 1.1% for 2026, and 1.4% for 2027. Forward-looking indicators, including PMIs and industrial sentiment surveys, signal some stabilization in activity following weakness in the third quarter. Public investment and recovering export activity are expected to offset softer private sector demand in the near term.
- The labor market remains resilient, with unemployment rates at multi-decade lows and participation rates strong. Real income growth continues to support household spending, even as consumption growth normalizes from earlier highs. Financing conditions remain favorable, supported by stable banking-sector liquidity and improved credit demand among small and medium-sized firms.
- Business sentiment remains mixed, reflecting lingering uncertainty over global trade policy and the path of US tariffs. However, easing supply chain costs and improved export competitiveness due to softer exchange rates are providing some relief to manufacturing and external-oriented sectors.
- The Governing Council reaffirmed that future decisions will depend on an integrated assessment of incoming data—covering inflation trends, financial conditions, and the state of policy transmission. The Council emphasized that no pre-set path for rates exists; keeping all options open should the economic outlook shift markedly.
- Balance sheet reduction continues smoothly, with holdings under the APP and PEPP declining as reinvestments have ceased. The ECB confirmed that the pace of portfolio runoff remains in line with its previously communicated normalization plan, supporting a gradual withdrawal of monetary accommodation in a predictable manner.
- The next meeting is on 17 to 18 December 2025
Next 24 Hours Bias
Medium Bullish
The Swiss Franc (CHF)
Key news events today
SNB Monetary Policy Assessment (8:30 am GMT)
SNB Policy Rate (8:30 am GMT)
SNB Press Conference (9:00 am GMT)
What can we expect from CHF today?
The Swiss franc is modestly firmer against the U.S. dollar but slightly softer versus the euro as traders focus on the SNB’s December policy meeting, where the bank is expected to keep its key rate at 0% and reiterate a bias toward FX‑market intervention rather than renewed negative rates. With USD/CHF trading near 0.80 after recent dollar weakness and EUR/CHF holding just under 0.94, the franc remains strong in a 12‑month view but has eased off its peaks as global risk appetite improves and markets look ahead to both SNB and Federal Reserve guidance on the 2026 rate path.
Central Bank Notes:
- At its 11 December 2025 monetary policy assessment, the Swiss National Bank (SNB) is widely expected to leave the policy rate unchanged at 0%, extending the pause that began in September as the Governing Board judges that current settings are sufficient to keep inflation near, but still below, its target while avoiding an unnecessary move into negative rates.
- Recent data show that the tentative rebound in Swiss inflation has stalled, with headline CPI easing from 0.1% year‑on‑year in October to 0.0% in November and core inflation slipping to about 0.4%, reinforcing the view that underlying price pressures remain very weak and that deflation risks, while contained, have not fully disappeared.
- The SNB’s conditional inflation forecast is likely to remain close to the September projections, with inflation still seen averaging roughly 0.2% in 2025, 0.5% in 2026, and 0.7% in 2027 under an unchanged policy rate path, though the latest CPI prints argue for a slightly lower near‑term profile and keep open the option of renewed easing if activity or prices weaken further.
- The global backdrop has deteriorated further, as continuing U.S. tariff actions and softer external demand weigh on world trade, while uncertainty in key European and U.S. markets for Swiss exports persists, leaving the SNB cautious about the growth outlook despite Switzerland’s relatively resilient domestic demand.
- Business and labor‑market sentiment in export‑oriented manufacturing remains subdued, with firms reporting pressure on margins from the still‑strong franc and softer foreign orders, although the broader economy is still expected to grow at around 1–1.5% in 2025 and unemployment only drifting up gradually from low levels.
- The SNB continues to stress its willingness to act if deflation risks re‑emerge, reiterating that it can ease policy through renewed rate cuts or targeted foreign‑exchange intervention if necessary, while also highlighting its commitment to transparent communication, including the publication of detailed minutes from recent assessments and ongoing dialogue with international partners on FX policy
The next meeting is on 19 March 2026.
Next 24 Hours Bias
Medium Bullish
The Pound (GBP)
Key news events today
BOE Gov Bailey Speaks (Tentative)
BOE Gov Bailey Speaks (10:00 am GMT)
What can we expect from GBP today?
The pound is trading slightly on the back foot but still within a broader uptrend, with GBP/USD hovering around the mid‑1.33 region as traders anticipate a possible Bank of England rate cut on 18 December and weigh recent signs of UK economic softness. Market commentary points to cautious sentiment, with central‑bank divisions over the pace of easing and nearby resistance levels capping sterling’s gains while support around 1.33 helps prevent a sharper sell‑off.
Central Bank Notes:
- The Bank of England’s Monetary Policy Committee (MPC) met on 6 November 2025 and voted 7–2 to keep the Bank Rate unchanged at 4.00 percent for a second consecutive meeting. The decision reflects the Committee’s cautious approach as inflation remains above target, but underlying economic momentum continues to weaken. Two members maintained their votes for a 25-basis-point cut, citing further signs of labor-market softening and weak business sentiment.
- The BOE adjusted its guidance on quantitative tightening (QT), maintaining the reduced pace established in September. The planned reduction of UK government bond holdings remains at £67.5 billion over the next 12 months, leaving the current gilt balance near £550 billion. Policymakers described the recalibrated QT path as “appropriate for current market conditions,” emphasizing the importance of liquidity management amid heightened volatility.
- Headline inflation moderated slightly to 3.6 percent in October from 3.8 percent previously, driven by easing food and transport prices. However, core inflation has shown only gradual progress, holding near 3.9 percent. The MPC noted that services inflation and administered energy costs continue to exert pressure, highlighting the challenge of achieving the 2 percent target sustainably. The Committee’s latest projections see inflation falling toward 3 percent by mid-2026, with further downside expected if energy and wage dynamics continue to normalize.
- Economic activity remains subdued. Estimates place Q3 GDP growth close to zero, with both business output and consumer spending restrained. The unemployment rate has edged up to 4.8 percent, while pay growth cooled to just under 5 percent year-on-year. MPC members acknowledged that pay settlements are weakening further, signaling an easing in labor cost pressures as demand softens. Surveys from the manufacturing and services sectors suggest muted hiring intentions through year-end.
- International factors continue to complicate the policy outlook. Fluctuating oil prices—partly linked to renewed Middle East tensions—alongside fragile global demand have contributed to higher market volatility. The MPC reiterated that external shocks, including global food and energy disruptions, could temporarily slow the disinflation path but remain unlikely to derail the medium-term moderation in prices.
- The Committee assessed risks around inflation as balanced. Downside risks arise from sluggish domestic growth and declining real income momentum, while upside risks remain tied to elevated inflation expectations and stubborn services inflation. Policymakers emphasized the need for patience, maintaining that any rate cuts ahead of clear inflation progress could undermine confidence in policy credibility.
- The MPC’s overall stance remains restrictive but increasingly balanced, with future moves expected to follow a cautious, data-driven trajectory. The Committee reaffirmed that monetary policy will stay tight until there is compelling evidence that inflation is returning to the 2 percent target on a durable basis.
- The next meeting is on 18 December 2025.
Next 24 Hours Bias
Medium Bullish
The Canadian Dollar (CAD)
Key news events today
No major news event
What can we expect from CAD today?
The Canadian dollar is holding a slight advantage against the U.S. dollar, with USD/CAD trading just below 1.38 after the Bank of Canada kept its key rate at 2.25% and signalled a pause in its easing cycle. The loonie has firmed over the past month as markets respond to a softer U.S. dollar, expectations of steady Canadian policy, and support from commodities and generally resilient domestic data. Overall, traders see CAD in a relatively stable, mildly constructive trend unless upcoming North American data or central‑bank communication shifts the interest‑rate outlook materially.
Central Bank Notes:
- The Council noted that U.S. tariff tensions have eased slightly following early progress in bilateral discussions, though the external trade environment remains fragile. Businesses continue to hold back on long-term investment, with the Bank highlighting that sustained clarity on U.S. trade policy is needed to restore confidence.
- The Bank acknowledged that uncertainty persists despite the softer U.S. tone, as incoming data show limited improvement in export orders. The manufacturing sector has stabilized but remains below pre-2024 output levels, reflecting weak global demand and cautious corporate spending.
- Canada’s economy showed tentative signs of recovery in early Q4, with GDP estimated to expand by 0.3% in October after two quarters of contraction. Mining and energy activity strengthened modestly, aided by steady crude demand, while goods exports posted a fractional gain.
- Service sector growth remained uneven, supported mainly by tourism-related and technology services. However, retail spending and household consumption were subdued, constrained by slower job creation and lingering consumer caution. The Bank judged overall momentum as fragile but improving marginally.
- Housing activity showed modest reacceleration in major urban markets as mortgage rates stabilized near record lows. Nonetheless, affordability pressures and stricter lending standards continue to limit overall resale volumes, resulting in only a gradual recovery in the housing sector.
- Headline CPI inflation rose to 2.1% in October, reaching the Bank’s target for the first time in six months. Higher energy prices and a modest uptick in food and shelter costs drove the increase. Core inflation measures remained stable, suggesting underlying price pressures are contained.
- The Governing Council reiterated its data-dependent stance, indicating that the current policy rate remains appropriate amid tentative growth and balanced inflation risks. Officials noted that while additional stimulus is not ruled out, the emphasis has shifted toward monitoring the sustainability of the recovery rather than immediate rate adjustments.
- The next meeting is on 17 to 18 December 2025.
Next 24 Hours Bias
Medium Bullish
Oil
Key news events today
No major news event
What can we expect from Oil today?
Oil is trading weak, with WTI around the upper‑50s and Brent near 62 USD per barrel as traders focus on a looming supply glut highlighted by recent OPEC and IEA outlooks and record U.S. production forecasts. Despite a modest boost from a recent U.S. rate cut, the market tone remains cautious, and technical indicators continue to signal a prevailing downtrend with risks of further tests of support around the mid‑50s if demand data disappoints.
Next 24 Hours Bias
Medium Bearish
The post IC Markets Global – Europe Fundamental Forecast | 11 December 2025 first appeared on IC Markets | Official Blog.
Thursday 11th December 2025: Technical Outlook and Review
424450 December 11, 2025 15:39 ICMarkets Market News
DXY (U.S. Dollar Index):
Potential Direction: Bearish
Overall momentum of the chart: Bearish
The price could see a short-term pullback toward the pivot before continuing its bearish move down toward the 1st support.
Pivot: 98.77
Supporting reasons: Identified as a pullback resistance, where selling pressures could intensify and potentially cap any upward retracement.
1st support: 97.97
Supporting reasons: Identified as an overlap support that aligns with the 161.8% Fibonacci extension, indicating a potential area where the price could again stabilize.
1st resistance: 99.06
Supporting reasons: Identified as a pullback resistance, indicating a potential area that could halt any further upward movement
EUR/USD:
Potential Direction: Bullish
Overall momentum of the chart: Bearish
The price could see a short-term pullback toward the pivot before rising again toward the 1st resistance.
Pivot: 1.1679
Supporting reasons: Identified as a pullback support, where renewed buying pressure could emerge to push the price higher.
1st support: 1.1644
Supporting reasons: Identified as a pullback support, indicating a potential level where the price could stabilize once again.
1st resistance: 1.1727
Supporting reasons: Identified as a swing high resistance that aligns with the 161.8% Fibonacci extension, indicating a potential level that could cap further upward movement.
EUR/JPY:
Potential Direction: Bullish
Overall momentum of the chart: Bullish
The price could see a short-term pullback toward the pivot before rising again toward the 1st resistance.
Pivot: 181.69
Supporting reasons: Identified as an overlap support, where renewed buying pressure could emerge to push the price higher.
1st support: 179.92
Supporting reasons: Identified as a pullback support that aligns with the 50% Fibonacci retracement, indicating a potential area where the price could again stabilize.
1st resistance: 183.43
Supporting reasons: Identified as a resistance that is supported by the 161.8% Fibonacci extension, indicating a potential level that could cap further upward movement.
EUR/GBP:
Potential Direction: Bearish
Overall momentum of the chart: Bullish
The price has already reacted off the pivot and may continue its bearish move toward the 1st support.
Pivot: 0.8749
Supporting reasons: Identified as an overlap resistance that aligns with the 38.2% Fibonacci retracement, where selling pressures could intensify and potentially cap any upward retracement.
1st support: 0.8708
Supporting reasons: Identified as a pullback support that aligns closely with the 161.8% Fibonacci extension, indicating a potential area where the price could stabilize once more.
1st resistance: 0.8779
Supporting reasons: Identified as a pullback resistance, indicating a potential level that could cap further upward movement.
GBP/USD:
Potential Direction: Bullish
Overall momentum of the chart: Bullish
The price could see a short-term pullback toward the pivot before rising again toward the 1st resistance.
Pivot: 1.3353
Supporting reasons: Identified as a pullback support, where renewed buying pressure could emerge to push the price higher.
1st support: 1.3287
Supporting reasons: Identified as an overlap support, indicating a potential area where the price could stabilize once more.
1st resistance: 1.3452
Supporting reasons: Identified as a swing high resistance that aligns with the 78.6% Fibonacci retracement, indicating a potential level that could halt further upward movement.
GBP/JPY:
Potential Direction: Bullish
Overall momentum of the chart: Bullish
The price could see a short-term pullback toward the pivot before rising again toward the 1st resistance.
Pivot: 207.17
Supporting reasons: Identified as an overlap resistance, where selling pressures could intensify and potentially cap any upward retracement
1st support: 205.32
Supporting reasons: Identified as an overlap support, indicating a potential level where the price could stabilize once more.
1st resistance: 209.23
Supporting reasons: Identified as a resistance that is supported by the 127.2% Fibonacci projection, indicating a potential level that could halt further upward movement.
USD/CHF:
Potential Direction: Bearish
Overall momentum of the chart: Bearish
The price could see a short-term pullback toward the pivot before continuing its bearish move down toward the 1st support.
Pivot: 0.8029
Supporting reasons: Identified as a pullback resistance, where selling pressures could intensify and potentially cap any upward retracement.
1st support: 0.7987
Supporting reasons: Identified as a pullback support that aligns with the 50% Fibonacci retracement, indicating a potential level where the price could stabilize once again.
1st resistance: 0.8098
Supporting reasons: Identified as a swing high resistance, indicating a potential level that could cap further upward movement.
USD/JPY:
Potential Direction: Bullish
Overall momentum of the chart: Bullish
The price could see a short-term pullback toward the pivot before rising again toward the 1st resistance.
Pivot: 155.34
Supporting reasons: Identified as a pullback support that aligns with the 61.8% Fibonacci retracement, where renewed buying pressure could emerge to push the price higher.
1st support: 153.26
Supporting reasons: Identified as an overlap support, indicating a strong area where buyers might return, and the price could stabilize once again.
1st resistance: 157.61
Supporting reasons: Identified as a swing high resistance. This level represents the next key area where upward movement could be capped amid increased selling pressure
USD/CAD:
Potential Direction: Bearish
Overall momentum of the chart: Bearish
The price could see a short-term pullback toward the pivot before continuing its bearish move down toward the 1st support.
Pivot: 1.3890
Supporting reasons: Identified as a pullback resistance, where selling pressures could intensify and potentially cap any upward retracement.
1st support: 1.3768
Supporting reasons: Identified as a swing low support, indicating a key level where the price could stabilize once more.
1st resistance: 1.3960
Supporting reasons: Identified as an overlap resistance, making it a possible target for bullish advances and a level where some sellers could return to cap gains
AUD/USD:
Potential Direction: Bullish
Overall momentum of the chart: Bullish
The price could see a short-term pullback toward the pivot before rising again toward the 1st resistance.
Pivot: 0.6628
Supporting reasons: Identified as a pullback support, where renewed buying pressure could emerge to push the price higher.
1st support: 0.6572
Supporting reasons: Identified as a pullback support, this area has provided strong support historically and may attract buying interest for a potential short-term bounce
1st resistance: 0.6684
Supporting reasons: Identified as an overlap resistance that aligns with the 161.8% Fibonacci extension, indicating a potential area that could halt any further upward movement.
NZD/USD
Potential Direction: Bullish
Overall momentum of the chart: Bullish
The price could see a short-term pullback toward the pivot before rising again toward the 1st resistance.
Pivot: 0.5796
Supporting reasons: Identified as a pullback support, where renewed buying pressure could emerge to push the price higher.
1st support: 0.5761
Supporting reasons: Identified as an overlap support, this area has provided strong support historically and may attract buying interest for a potential short-term bounce
1st resistance: 0.5842
Supporting reasons: Identified as a swing high resistance, indicating a potential area that could halt any further upward movement.
US30 (DJIA):
Potential Direction: Bullish
Overall momentum of the chart: Bullish
The price could see a short-term pullback toward the pivot before rising again toward the 1st resistance.
Pivot: 47,892.80
Supporting reasons: Identified as a pullback support, where renewed buying pressure could emerge to push the price higher.
1st support: 47,462.40
Supporting reasons: Identified as an overlap support, suggesting a potential area where the price could stabilize once again.
1st resistance: 48,411.44
Supporting reasons: Identified as a swing high resistance, indicating a potential area that could halt any further upward movement.
DE40 (DAX):
Potential Direction: Bullish
Overall momentum of the chart: Bullish
The price could see a short-term pullback toward the pivot before rising again toward the 1st resistance.
Pivot: 23,945.80
Supporting reasons: Identified as a pullback support, where renewed buying pressure could emerge to push the price higher.
1st support: 23,488.00
Supporting reasons: Identified as a pullback support, indicating a key level where the price could stabilize once more.
1st resistance: 24,444.50
Supporting reasons: Identified as a swing high resistance that aligns with the 100% Fibonacci projection, indicating a potential area that could halt any further upward movement.
US500 (S&P 500):
Potential Direction: Bullish
Overall momentum of the chart: Bullish
The price could see a short-term pullback toward the pivot before rising again toward the 1st resistance.
Pivot: 6,773.23
Supporting reasons: Identified as a pullback support, where renewed buying pressure could emerge to push the price higher.
1st support: 6,673.25
Supporting reasons: Identified as an overlap support, indicating a potential level where the price could stabilize once again.
1st resistance: 6,920.20
Supporting reasons: Identified as a swing high resistance, indicating a potential area that could halt any further upward movement.
BTC/USD (Bitcoin):
Potential Direction: Bearish
Overall momentum of the chart: Bearish
The price has already reacted off the pivot and may continue its bearish move toward the 1st support.
Pivot: 94,626.34
Supporting reasons: Identified as an overlap resistance that aligns with the 50% Fibonacci retracement, where selling pressures could intensify and potentially cap any upward retracement.
1st support: 88,893.73
Supporting reasons: Identified as an overlap support, indicating a potential level where the price could stabilize once more.
1st resistance: 100,094.87
Supporting reasons: Identified as a pullback resistance, indicating a potential area that could halt any further upward movement.
ETH/USD (Ethereum):
Potential Direction: Bullish
Overall momentum of the chart: Bullish
The price could see a short-term pullback toward the pivot before rising again toward the 1st resistance.
Pivot: 3,230.74
Supporting reasons: Identified as an overlap support, where renewed buying pressure could emerge to push the price higher.
1st support: 2,904.01
Supporting reasons: Identified as a pullback support, indicating a potential level where the price could stabilize once more.
1st resistance: 3,675.59
Supporting reasons: Identified as an overlap resistance, indicating a potential area that could halt any further upward movement.
WTI/USD (Oil):
Potential Direction: Bearish
Overall momentum of the chart: Bullish
The price could see a short-term pullback toward the pivot before continuing its bearish move down toward the 1st support.
Pivot: 59.47
Supporting reasons: Identified as a pullback resistance that aligns with the 61.8% Fibonacci retracement, where selling pressures could intensify and potentially cap any upward retracement.
1st support: 57.63
Supporting reasons: Identified as an overlap support, indicating a key level where the price could stabilize once more.
1st resistance: 61.09
Supporting reasons: Identified as an overlap resistance, indicating a potential area that could halt any further upward movement.

XAU/USD (GOLD):
Potential Direction: Bullish
Overall momentum of the chart: Bullish
The price could see a short-term pullback toward the pivot before rising again toward the 1st resistance.
Pivot: 4,149.19
Supporting reasons: Identified as an overlap support that aligns with the 50% Fibonacci retracement, where renewed buying pressure could emerge to push the price higher.
1st support: 4,083.34
Supporting reasons: Identified as a pullback support, indicating a key level where the price could stabilize once more.
1st resistance: 4,255.34
Supporting reasons: Identified as a swing high resistance, indicating a potential area that could halt any further upward movement.
The accuracy, completeness and timeliness of the information contained on this site cannot be guaranteed. IC Markets Global does not warranty, guarantee or make any representations, or assume any liability regarding financial results based on the use of the information in the site.
News, views, opinions, recommendations and other information obtained from sources outside of www.icmarkets.com, used in this site are believed to be reliable, but we cannot guarantee their accuracy or completeness. All such information is subject to change at any time without notice. IC Markets Global assumes no responsibility for the content of any linked site.
The fact that such links may exist does not indicate approval or endorsement of any material contained on any linked site. IC Markets Global is not liable for any harm caused by the transmission, through accessing the services or information on this site, of a computer virus, or other computer code or programming device that might be used to access, delete, damage, disable, disrupt or otherwise impede in any manner, the operation of the site or of any user’s software, hardware, data or property.
The post Thursday 11th December 2025: Technical Outlook and Review first appeared on IC Markets | Official Blog.
Thursday 11th December 2025: Asian Markets Mixed as Fed Signals Limited Rate Cuts Ahead
424449 December 11, 2025 15:39 ICMarkets Market News
Global Markets:
- Asian Stock Markets : Nikkei down -1.10%, Shanghai Composite down -0.46%, Hang Seng down -0.15% ASX up 0.17%
- Commodities : Gold at $4,242.75 (0.42%), Silver at $62.307 (2.06%), Brent Oil at $62.16 (-0.08%), WTI Oil at $58.44 (0.03%)
- Rates : US 10-year yield at 4.128, UK 10-year yield at 4.5070, Germany 10-year yield at 2.8563
News & Data:
- (CAD) Overnight Rate 2.25% to 2.25% expected
- (USD) Employment Cost Index q/q 0.8% to 0.9% expected
Markets Update:
Asian markets traded mixed on Thursday, despite broadly positive cues from Wall Street, after the US Federal Reserve cut interest rates for the third straight meeting by a quarter point and signaled only one rate cut in 2026. While most Fed officials supported the move, three dissented, highlighting divisions over the future rate path. Asian markets had ended mostly lower on Wednesday.
Australian shares were modestly higher, breaking a three-session losing streak, supported by strength in mining and technology stocks. The S&P/ASX 200 moved above 8,600, while major miners like Rio Tinto, Fortescue and BHP advanced. Oil stocks were mostly firm, though tech names saw mixed moves. Big banks were slightly higher, and gold miners posted solid gains. Flight Centre shares jumped on news of a UK acquisition, while Fenix Resources surged after unveiling a major production plan. Economic data showed Australia’s unemployment rate steady at 4.3 percent, while job numbers declined.
Japan’s Nikkei 225 traded sharply lower, dragged by weakness in SoftBank, Fast Retailing, automakers and several major industrial names, despite some strength in select technology and manufacturing stocks. The index dropped toward 50,300. The Japanese yen traded in the high 155-per-dollar range.
Across the region, Hong Kong, Singapore, Malaysia and Indonesia posted small gains, while China, Taiwan, South Korea and New Zealand edged lower. On Wall Street, major US indexes closed higher following the Fed decision, while European markets ended mixed. Crude oil prices inched up after a larger-than-expected drop in US inventories.
Upcoming Events:
- 01:30 PM GMT – USD Unemployment Claims
The post Thursday 11th December 2025: Asian Markets Mixed as Fed Signals Limited Rate Cuts Ahead first appeared on IC Markets | Official Blog.
General Market Analysis – 11/12/25
424448 December 11, 2025 15:14 ICMarkets Market News
US Stocks Rally After Fed Cut – Dow up 1%
US markets pushed higher overnight as the Federal Reserve cut rates by 25 basis points and signalled the potential for another reduction in 2026. The move helped lift equities across the board, with the Dow jumping 1.05% to 48,057, the S&P 500 rising 0.67% to 6,886, and the Nasdaq adding 0.33% to 23,651. Treasury yields dropped after the decision, with the 2-year slipping 7.6 bps to 3.538% and the 10-year down 4.1 bps to 4.147%, while the US dollar weakened sharply, the DXY falling 0.58% to 98.66. The softer greenback provided a tailwind for commodities. Brent crude climbed 1.21% to $62.29, while WTI gained 0.36% to $58.46 following reports that the US had seized an oil tanker near Venezuela. Gold also extended its recent strength, rising 0.49% to $4,228.79 as lower yields and a weaker dollar improved demand.
Fed Cuts 25 – But What Now?
It has been a relatively muted reaction in markets to last night’s Fed rate cut as investors digest the 25-basis-point cut and the dot plot that predicts just one cut in 2026. Market commentators are split on guidance from Jerome Powell and the FOMC, with the statement, dot plot and press conference all giving a bit of fuel to both doves and hawks. That is probably a fair call given the issues the Fed are facing, as we still see sticky inflation competing with a falling (but not by too much) jobs market. The initial reaction has been a lean towards a dovish conclusion, with stocks rallying and the dollar and yields falling; however, the next couple of trading sessions will probably give us a more conclusive answer on what investors really think the Fed’s path will be in 2026. Most market participants are expecting to see some choppy trading in the days ahead as the market continues to adjust and we start to hear from individual Fed members after they are released from their meeting-talks shutdown.
Another Busy Day Ahead for Traders
With investors still digesting the Fed’s outlook, attention now shifts to a packed schedule today. There are further data and central bank updates due across the trading sessions, and investors are expecting more volatility. The Asian session will see a big focus on Australian markets with key employment data due out. The monthly Employment Change number is expected to show a 20k increase, and the Unemployment Rate is expected to increase to 4.4%, and any deviations will likely see some big moves for the Aussie. The London session will see the latest update on interest rates from the Swiss National Bank, with expectations that they will keep rates on hold at 0% despite continuing low-inflation conditions. Again, traders are expecting moves in the franc on updates from the statement and press conference. It is a quieter day in the US session today with just the weekly unemployment claims (exp. 220K) on the calendar; however, investors are expecting to see more reaction from last night’s Fed update to keep markets moving.
The post General Market Analysis – 11/12/25 first appeared on IC Markets | Official Blog.
IC Markets Global – Asia Fundamental Forecast | 11 December 2025
424447 December 11, 2025 15:14 ICMarkets Market News
IC Markets Global – Asia Fundamental Forecast | 11 December 2025
What happened in the U.S. session?
Markets traded in classic pre‑Fed mode: equity indices were broadly flat to slightly weaker, longer‑dated Treasury yields lingered near recent highs, and the dollar eased modestly as traders largely priced in a 25 bp cut but braced for potentially hawkish forward guidance. With only minor U.S. macro releases on the day (weekly mortgage data) and no major surprises, positioning and options flows around the Fed dominated, pushing implied volatility up from low levels while keeping realized moves relatively contained.
What does it mean for the Asia Session?
Asian traders will be trading in the shadow of the Federal Reserve’s rate decision and guidance, with attention on how U.S. yields and the dollar react, while watching key regional data such as Australian labour figures and Japanese bond auctions alongside lingering concerns over China’s growth mix and sector-specific stories like steel exports. Broadly, the backdrop is one of cautious risk appetite: Asian equities have been mixed, commodities and AI-related themes remain active, and geopolitical and policy risks continue to inject potential volatility.
The Dollar Index (DXY)
Key news events today
Unemployment Claims (1:30 pm GMT)
What can we expect from DXY today?
The dollar is trading on the back foot, with the Dollar Index around the high‑90s, down on the month, and significantly weaker over the past year as markets lean toward a December Fed rate cut. The euro is holding above 1.16, the yen sits in the mid‑150s per dollar, and several other major and emerging‑market currencies are either steady or modestly firmer against the U.S. currency, underscoring a broad but measured easing in dollar strength rather than a sharp sell‑off.
Central Bank Notes:
- The Federal Open Market Committee (FOMC) is widely expected to lower the federal funds rate target range by 25 basis points to 3.50%–3.75% at its December 9–10, 2025, meeting, marking the third consecutive cut after the October reduction to 3.75%–4.00%
- The Committee continues to pursue maximum employment and 2% inflation goals, with the labor market showing further softening as the unemployment rate rose to 4.4% in September 2025 amid modest job gains.
- Officials note persistent downside risks to growth alongside resilient activity, with inflation easing to 3.0% year-over-year CPI in September but remaining elevated due to tariff effects; core PCE stands at around 2.8% as of October.
- Economic activity grew at a 3.8% annualized pace in Q2 2025 per revised estimates, though Q3 and Q4 face headwinds from trade tensions, fiscal restraint, and data disruptions like the government shutdown.
- September’s Summary of Economic Projections forecasts 2025 unemployment at a median 4.5%, with PCE inflation near 3.0% and core PCE at 3.1%, signaling a gradual disinflation path; updates expected on December 10 may adjust for higher unemployment and lower growth.
- The Committee maintained its data-dependent approach, noting a softening labor market and inflation above the 2% target, while deciding to lower the federal funds rate target range by 25 basis points to 3.50%-3.75%. Dissent persisted, with multiple members opposing the cut or advocating for a hold, reflecting divisions similar to recent meetings.
- The FOMC confirmed the conclusion of its quantitative tightening program effective December 1, 2025, with Treasury rolloff caps at $5 billion per month and agency MBS caps at $35 billion per month to ensure ample reserves and market stability.
- The next meeting is scheduled for 27 to 28 January 2026.
Next 24 Hours Bias
Medium Bearish
Gold (XAU)
Key news events today
Unemployment Claims (1:30 pm GMT)
What can we expect from Gold today?
Gold is trading just above 4,190–4,200 USD per ounce, close to recent highs and more than 50% higher than a year ago, as investors balance firm structural support against near‑term event risk. The market is anchored by expectations of a U.S. rate cut, a softer dollar, and heavy central‑bank and ETF buying, while geopolitical and financial uncertainty continue to underpin its role as a hedge.
Next 24 Hours Bias
Medium Bullish
The Australian Dollar (AUD)
Key news events today
Employment Change (12:30 am GMT)
Unemployment Rate (12:30 am GMT)
What can we expect from AUD today?
The Australian dollar is modestly firmer, trading near recent highs against the US dollar, underpinned by a hawkish RBA, softer US dollar expectations, and better Chinese trade data, while markets wait on upcoming Australian releases and the Fed decision for the next major directional cue.
Central Bank Notes:
- The Reserve Bank of Australia held its cash rate steady at 3.60% at the November 2025 policy meeting, adopting a cautious tone amid a surprise uptick in inflation data for the September quarter. This marks the fourth consecutive pause since the 25 basis point cut in August. The Board attributed some of the inflation rise to temporary factors like higher petrol prices and council rates, but noted signs of more persistent pressures from consumer demand.
- Policymakers emphasized vigilance on inflation, with trimmed mean inflation expected to remain elevated in the near term before nearing the 2–3% target midpoint by mid-2027. Recent data showed underlying inflation staying above target until at least the second half of 2026, prompting upward revisions to forecasts. Capacity pressures are seen as slightly more pronounced than previously assessed, delaying any easing.
- Headline CPI for the September quarter exceeded expectations, driven partly by temporary items, while underlying measures signal ongoing stickiness. The shift to monthly CPI reporting, with the first full edition in November 2025, will enhance real-time inflation monitoring. Housing and services remain resilient contributors to price pressures.
- Domestic demand shows firmness in services alongside below-trend growth elsewhere, with capacity pressures not expected to ease significantly. The labor market is gradually softening, with unemployment projected to stabilize around 4.4%, though wage growth and productivity dynamics keep unit labor costs a concern. Household spending faces headwinds from high borrowing costs.
- Global risks include geopolitical tensions and commodity volatility, set against modestly revised-up world growth outlooks. The Board describes its policy as mildly restrictive and data-dependent, balancing inflation control with employment goals. No rate hike was considered despite the inflation surprise.
- Monetary policy remains mildly restrictive to address lingering price stability risks amid household and global vulnerabilities. Communications reaffirm the dual mandate of 2–3% inflation and full employment, with readiness to adjust based on incoming data.
- Market expectations point to the cash rate holding through early 2026, with a possible modest cut to 3.3% mid-year if inflation eases as forecast. The new monthly CPI data will be key for timely insights.
- Monetary policy remains mildly restrictive, balancing progress on price stability against vulnerabilities in household demand and global outlook. Board communications reaffirm a dual mandate: price stability and full employment, while underscoring readiness to respond should risks materialize sharply.
- Analysts generally expect the cash rate to remain at current levels through early 2026, with only modest cuts possible later in the year if inflation moderates. The new monthly CPI release (first full edition Nov 2025) will be watched closely for timely signals on price trends.
- The next meeting is on 2 to 3 February 2026.
Next 24 Hours Bias
Medium Bullish
The Kiwi Dollar (NZD)
Key news events today
No major news event
What can we expect from NZD today?
Today the New Zealand dollar is trading in a narrow range near 0.578 against the US dollar, extending a month‑long mild recovery but still sitting close to multi‑month lows on a one‑year view. The main story remains macro rather than headline news: soft New Zealand data and earlier RBNZ rate cuts have created a low‑yield environment that dampens demand for the currency, even as the central bank hints that the easing cycle may be nearing its end. At the same time, a relatively resilient US dollar and cautious expectations for Federal Reserve rate reductions are keeping NZD/USD locked in a sideways, consolidating pattern, with analysts expecting only modest moves into year‑end barring a surprise in global risk sentiment or key New Zealand data.
Central Bank Notes:
- The Monetary Policy Committee (MPC) left the Official Cash Rate (OCR) unchanged at 2.25% at its 26 November 2025 meeting, following the widely anticipated 25-basis-point reduction from 2.50%, and signaled that policy is now firmly in stimulatory territory while keeping the option of further easing on the table if needed.
- The decision was again reached by consensus, with members judging that the cumulative 325 basis points of easing over the past year warranted a period of assessment, even as several emphasized a willingness to cut further should incoming data point to a more protracted downturn or renewed disinflationary pressures.
- Headline consumer price inflation is projected to hover near 3% in late 2025 before gradually easing toward the 2% midpoint of the 1–3% target band through 2026, supported by contained inflation expectations around 2.3% over the two-year horizon and an expected pickup in spare capacity.
- The MPC noted that domestic demand remains subdued but shows tentative signs of stabilisation, with softer household spending and construction only partially offset by improving services activity; nevertheless, policymakers still expect services inflation to ease as wage growth moderates and the labour market loosens further over the coming year.
- Financial conditions continue to ease as wholesale and retail borrowing rates reprice to the lower OCR, contributing to gradually rising mortgage approvals and improving housing-related sentiment, although broader business credit growth remains patchy and sensitive to uncertainty about the durability of the recovery.
- Recent data confirm that GDP momentum is weak but not deteriorating as sharply as earlier in 2025, with high-frequency indicators pointing to a shallow recovery from a low base and ongoing headwinds from elevated living costs and fragile confidence weighing on discretionary consumption and investment.
- The MPC reiterated that external risks remain skewed to the downside, particularly from softer Chinese demand and uncertainty around United States trade policy, but noted that a lower New Zealand dollar continues to provide some offset via improved export competitiveness and support for tradables inflation.
- Looking ahead to early 2026, the Committee maintained a mild easing bias, indicating that a further cut toward 2.00–2.10% cannot be ruled out if activity fails to gain traction or if inflation undershoots projections, but current forecasts envisage the OCR remaining near 2.25% for an extended period provided inflation converges toward target and the recovery proceeds broadly as expected.
- The next meeting is on 18 February 2026.
Next 24 Hours Bias
Medium Bullish
The Japanese Yen (JPY)
Key news events today
No major news event
What can we expect from JPY today?
The Japanese yen is trading weaker near recent lows as markets wait for fresh confirmation of a Bank of Japan rate hike later in December, with USD/JPY around the mid‑156 area and volatility driven mainly by shifting expectations for U.S.–Japan yield differentials. USD/JPY has edged higher toward about 156.9 as of December 9–10, reflecting renewed dollar strength and modest selling of the yen after its brief recovery earlier this month.
Central Bank Notes:
- The Policy Board of the Bank of Japan met on 30–31 October and, by a clear majority vote, decided to maintain its key monetary policy approach for the upcoming period.
- The BOJ will continue to encourage the uncollateralized overnight call rate to remain at around 0.5%, in line with the prior stance.
- The gradual quarterly reduction in monthly outright purchases of Japanese Government Bonds (JGBs) remains intact, with amounts unchanged from the previous schedule. Purchases are set to decrease by about ¥400 billion per quarter through March 2026, shifting to about ¥200 billion per quarter from April to June 2026, and targeting a ¥2 trillion purchase level for Q1 2027. The bank reaffirmed its intention to maintain flexibility, with readiness to respond if market conditions warrant an adjustment.
- Japan’s economy continues to show moderate recovery, primarily led by solid capital expenditures, although export growth and corporate activity remain restrained by external demand uncertainty and the ongoing effects of U.S. trade policies.
- Annual headline inflation (excluding fresh food) accelerated to 2.9% year-on-year in September, marking the first uptick in four months and staying above the BOJ’s 2% target. Broad-based inflation persists, with food and energy cost pressures, but wage growth continues to support household consumption. Input cost pressures from the earlier surge in imports eased slightly.
- Short-term inflation momentum could moderate as food-price hikes ease, though rent, healthcare, and service-sector price increases tied to labor shortages provide support. Firms and households maintain a gradual upward drift in inflation expectations.
- For the near term, BOJ projects growth below trend as external demand stays subdued and corporate investment plans remain cautious. Still, accommodative financial conditions and steady gains in real labor income will underpin domestic consumption.
- Over the medium term, as overseas economies recover and trade conditions normalize, Japan’s growth potential should improve. Persistent labor market tightness, higher wage settlements, and rising medium- to long-term inflation expectations are expected to keep core inflation on a gradual upward trajectory, converging toward the 2% price stability target later in the forecast horizon.
- The next meeting is scheduled for 18 to 19 December 2025.
Next 24 Hours Bias
Medium Bearish
Oil
Key news events today
No major news event
What can we expect from Oil today?
Oil is trading slightly lower to steady around the high‑50s to low‑60s per barrel region on Wednesday, 10 December 2025, with markets focused on a mix of soft demand expectations, recovering supply, and major central‑bank decisions that could affect future energy consumption. Geopolitical risk from the Ukraine conflict and tensions involving Russia and Venezuela is providing a floor under prices, as traders weigh the chance of further disruptions to Russian exports or sanctions changes.
Next 24 Hours Bias
Medium Bullish
The post IC Markets Global – Asia Fundamental Forecast | 11 December 2025 first appeared on IC Markets | Official Blog.
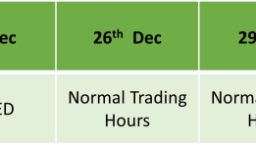
Holiday Trading Schedule Dec 2025– Jan 2026
424415 December 10, 2025 20:39 ICMarkets Market News
Dear Trader,
Please find our updated trading schedule for the Christmas, Boxing Day and New Year’s Day holidays below.
Liquidity over the holidays is expected to be particularly thin so please take the necessary precautions to ensure you are not affected by increased volatility, spreads and intermittent pricing.
We will have staff to assist you throughout the holiday period whenever the market is open. Please be aware that deposits and withdrawals will be delayed when there is a bank holiday. Online funding methods such as credit/debit card, PayPal, Neteller, Skrill etc. will still be processed instantly.
We would like to take this opportunity to thank you for your business over the last year. 2025 has been a year of growth and change for IC Markets as we endeavor to bring you the best trading conditions and client experience possible.
We wish for an enjoyable holiday season and a prosperous 2026 for you and your family.
MT4/5:
All times mentioned below are Platform time( GMT +2)
Forex :

Precious Metals:

Spot Energies:
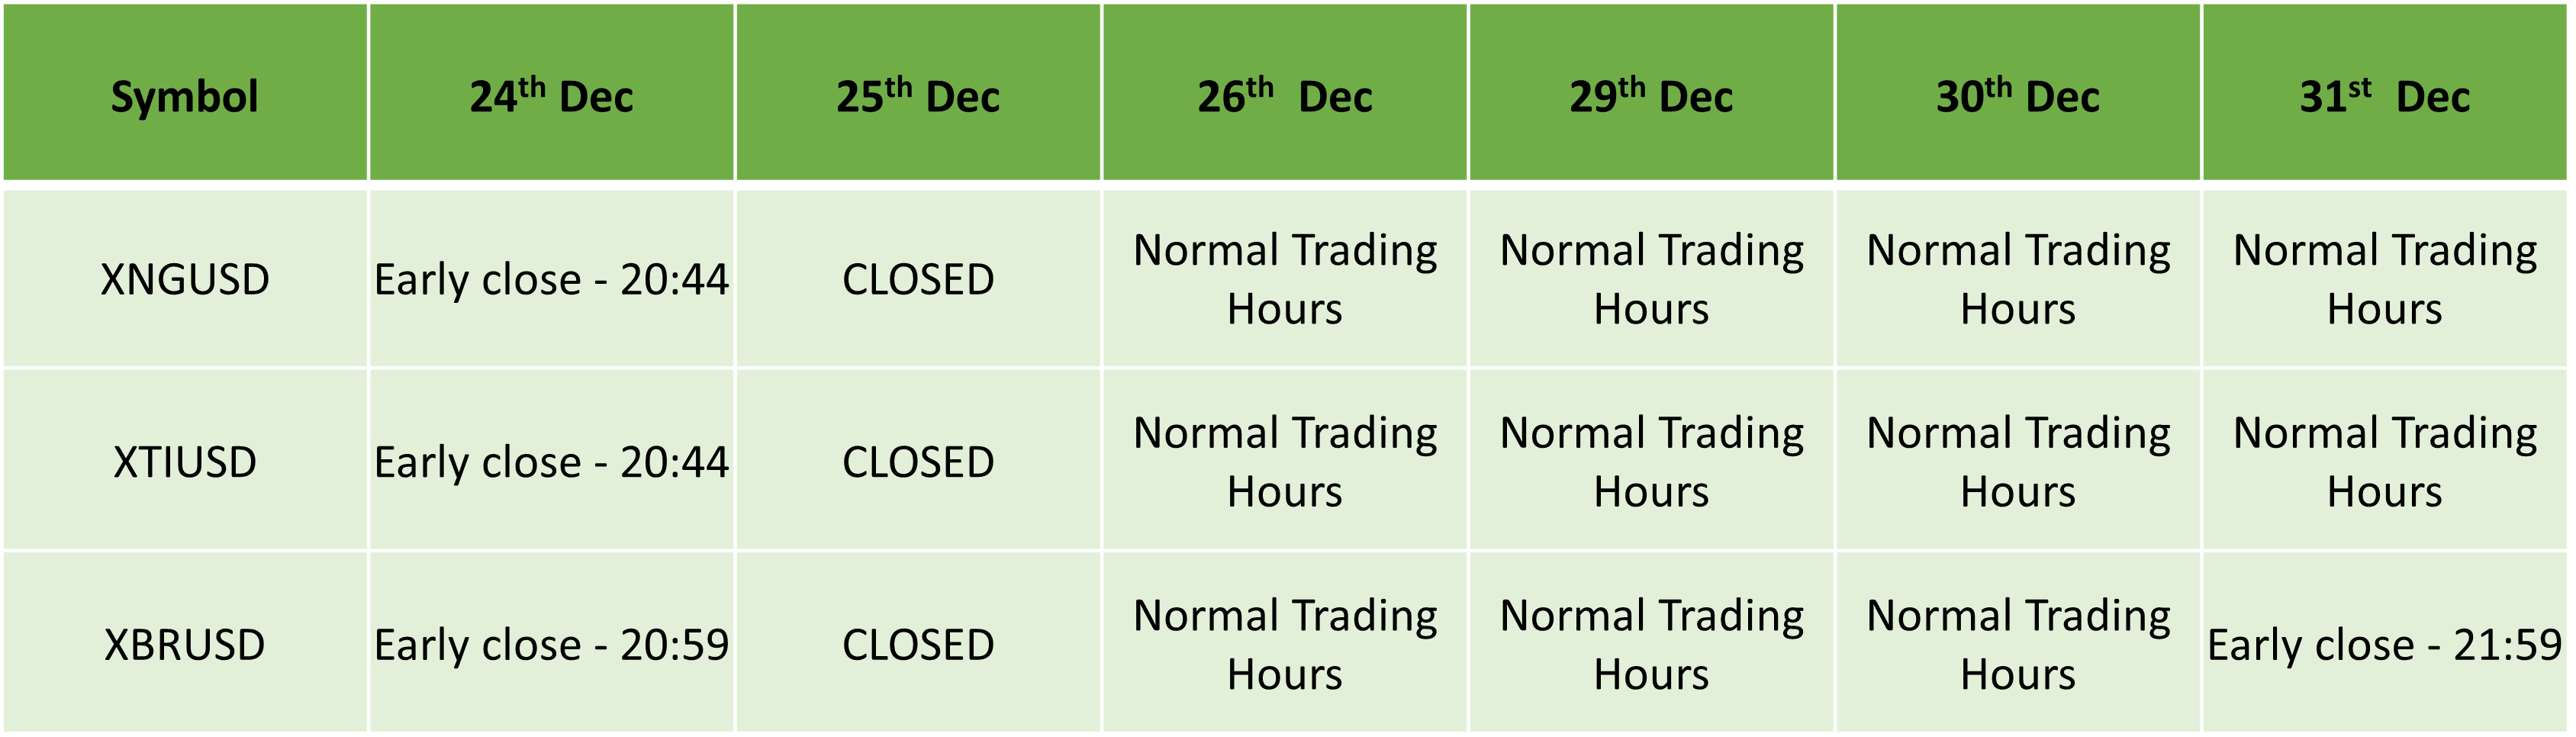
Indices:
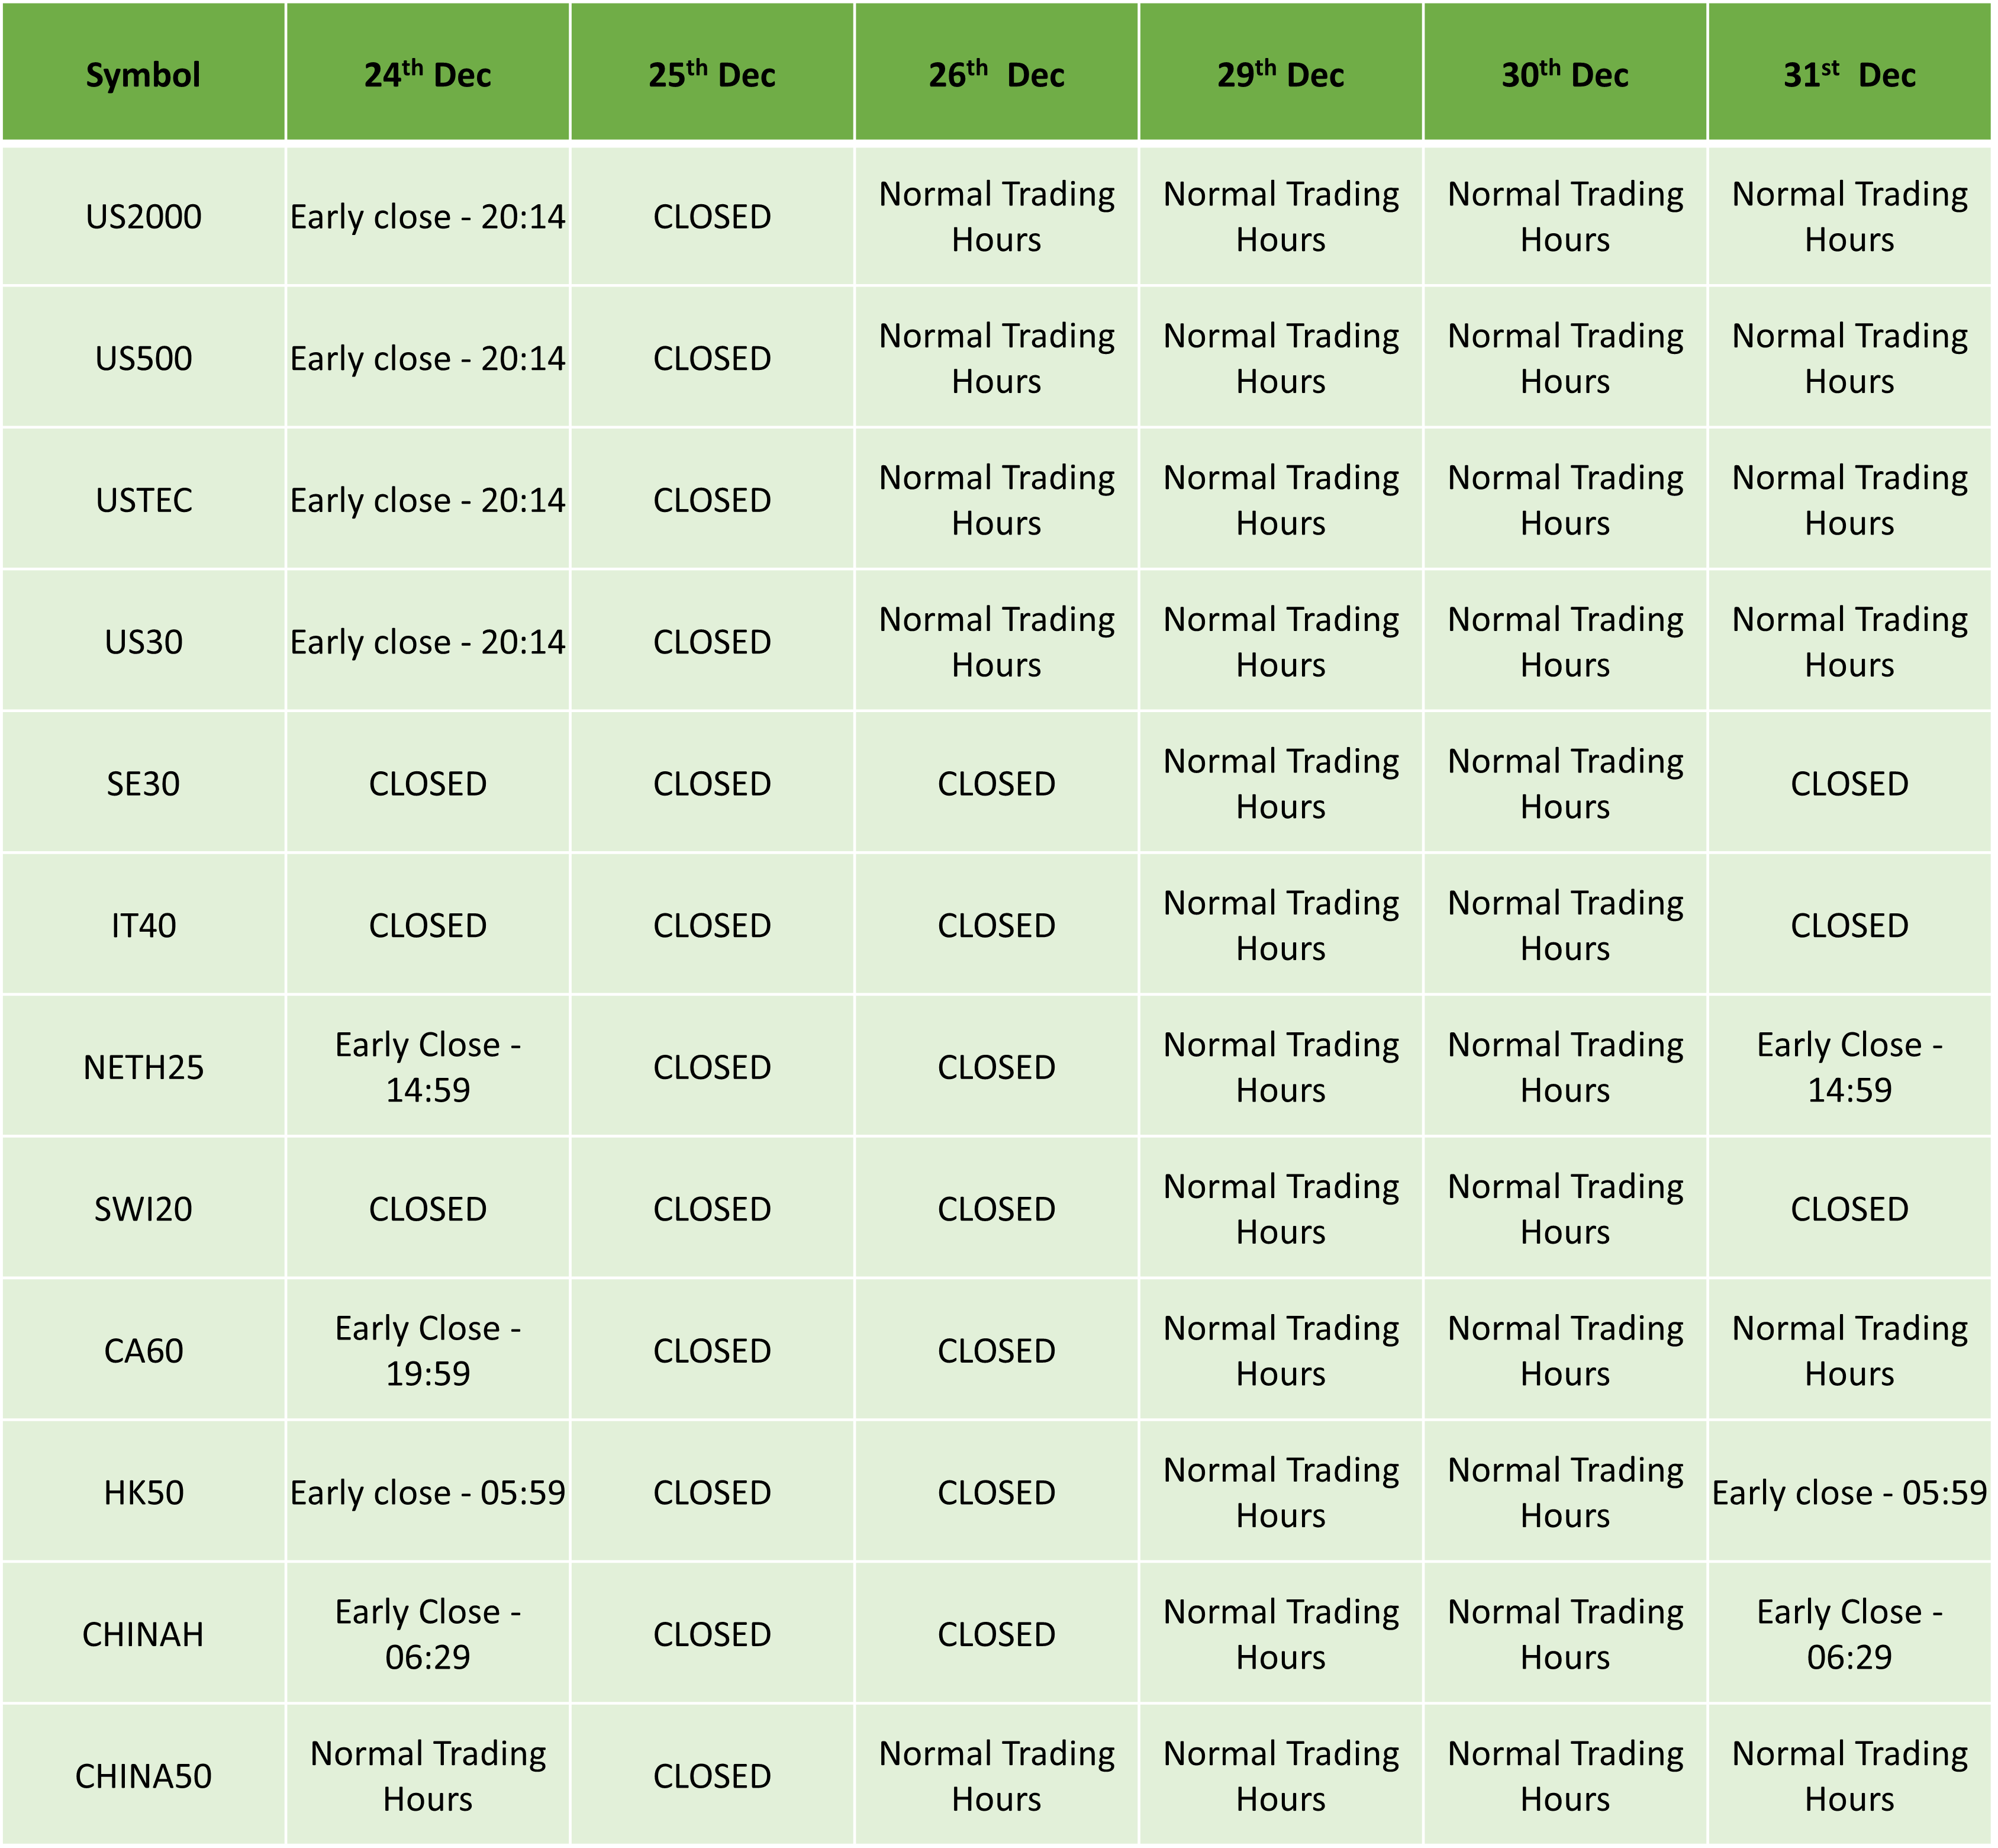
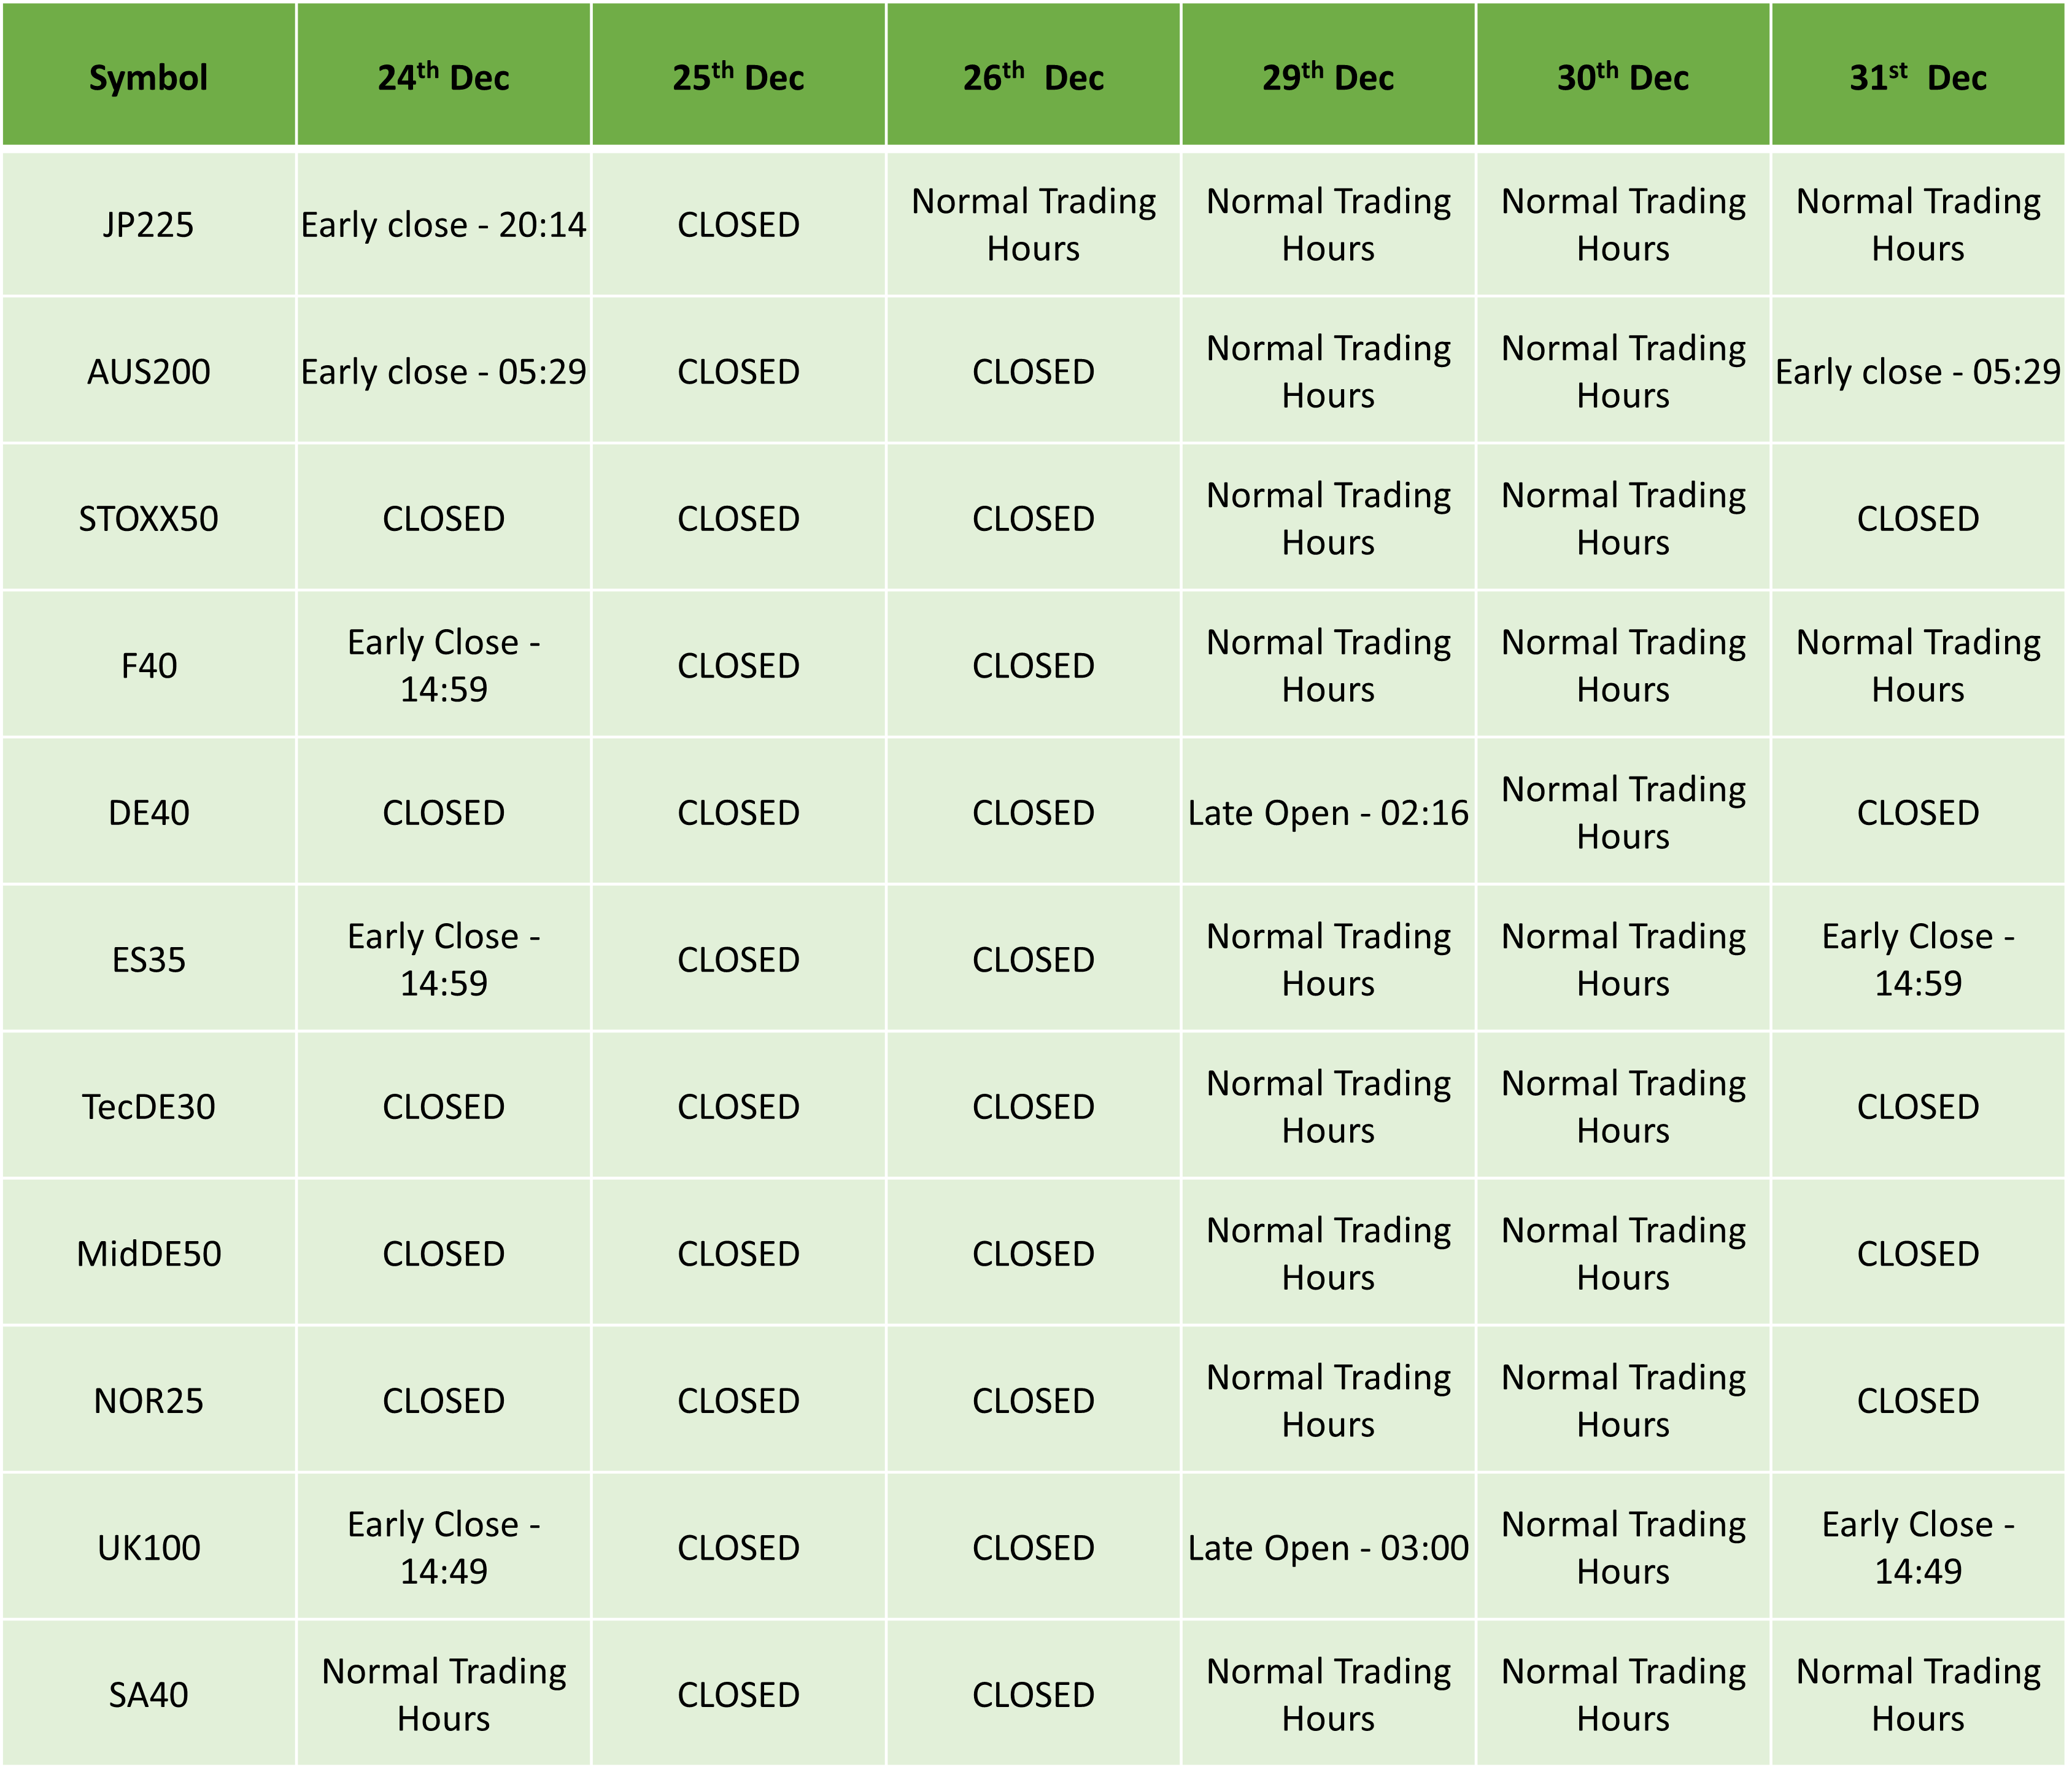
Energy Futures :
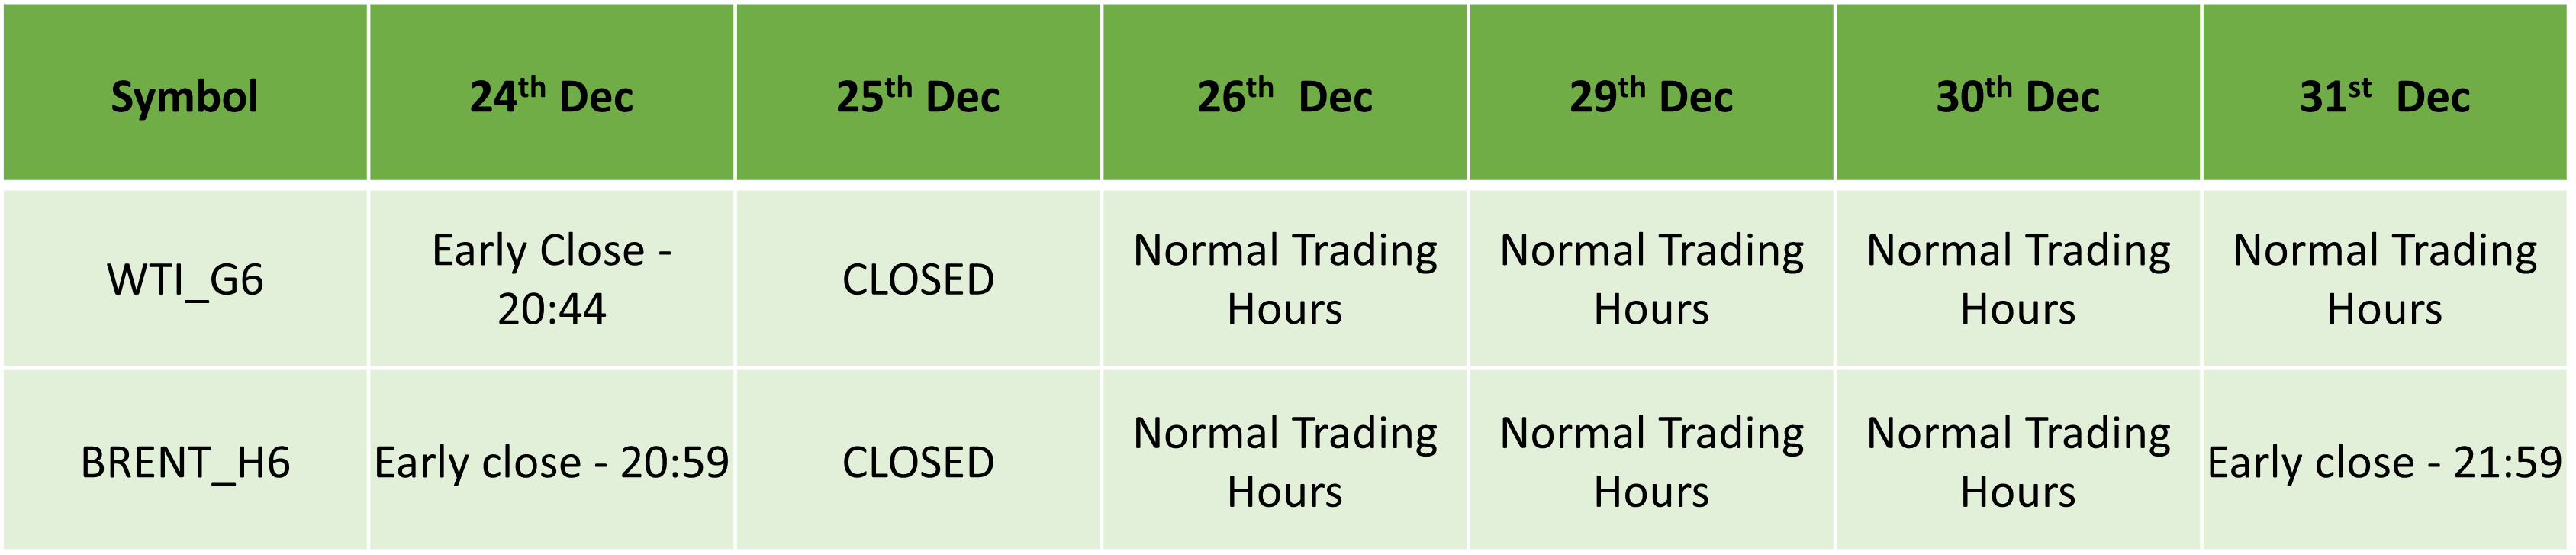
Soft Commodities Futures:
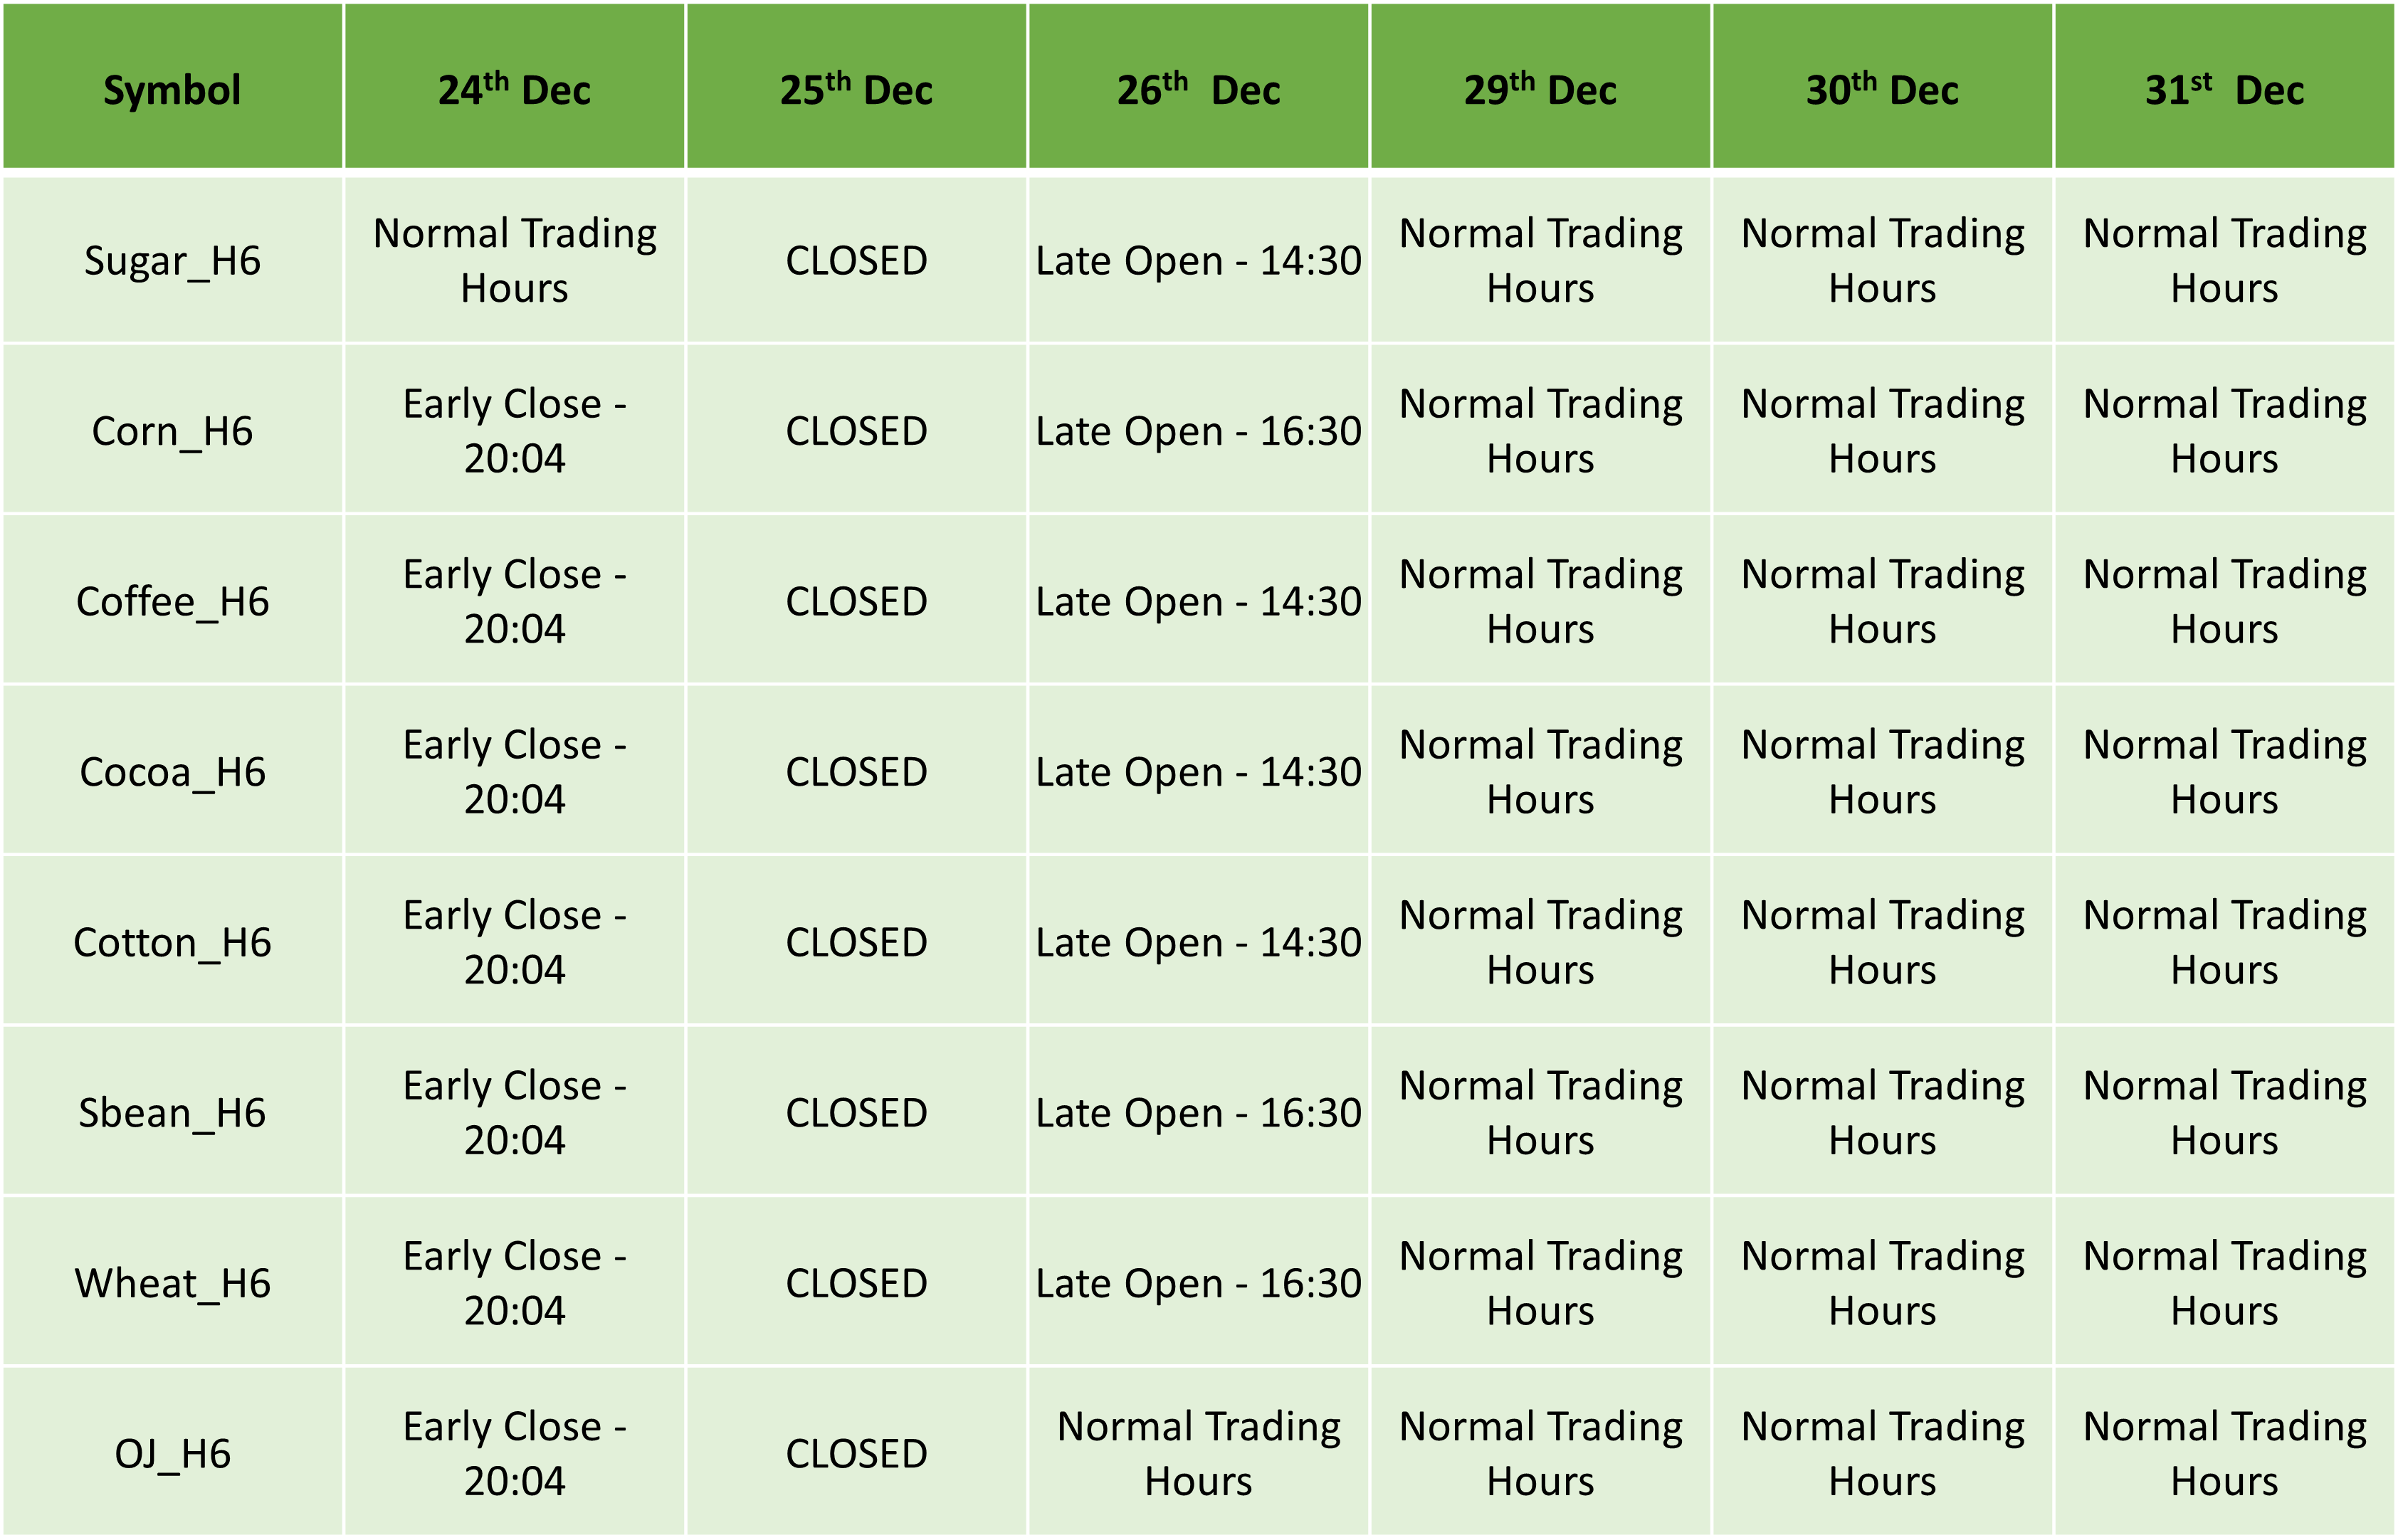
Indices Futures:
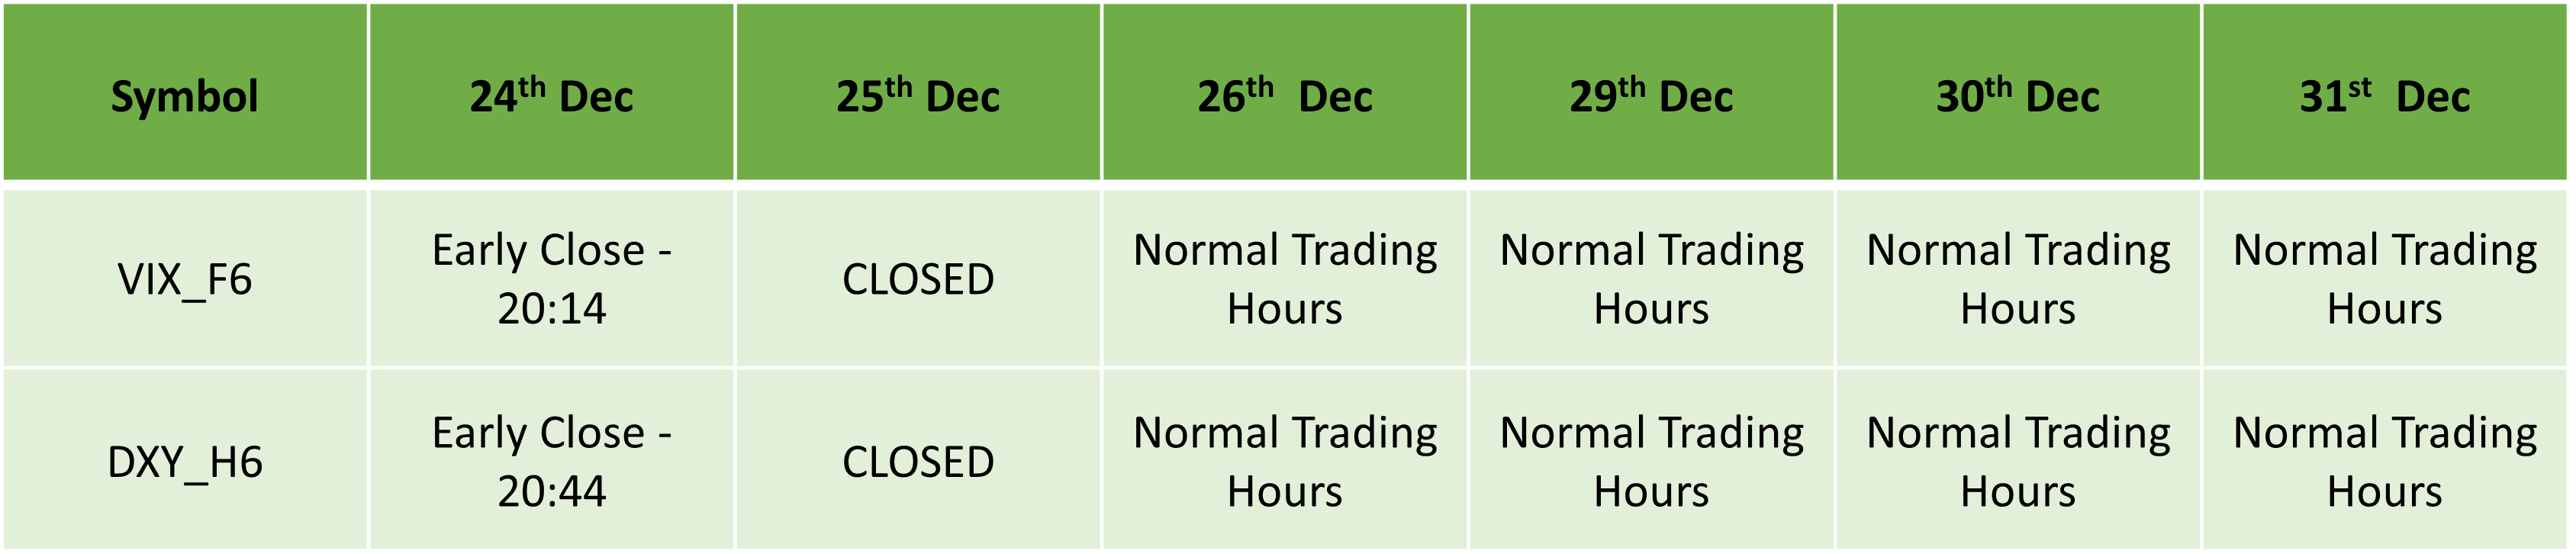
Bonds Futures:
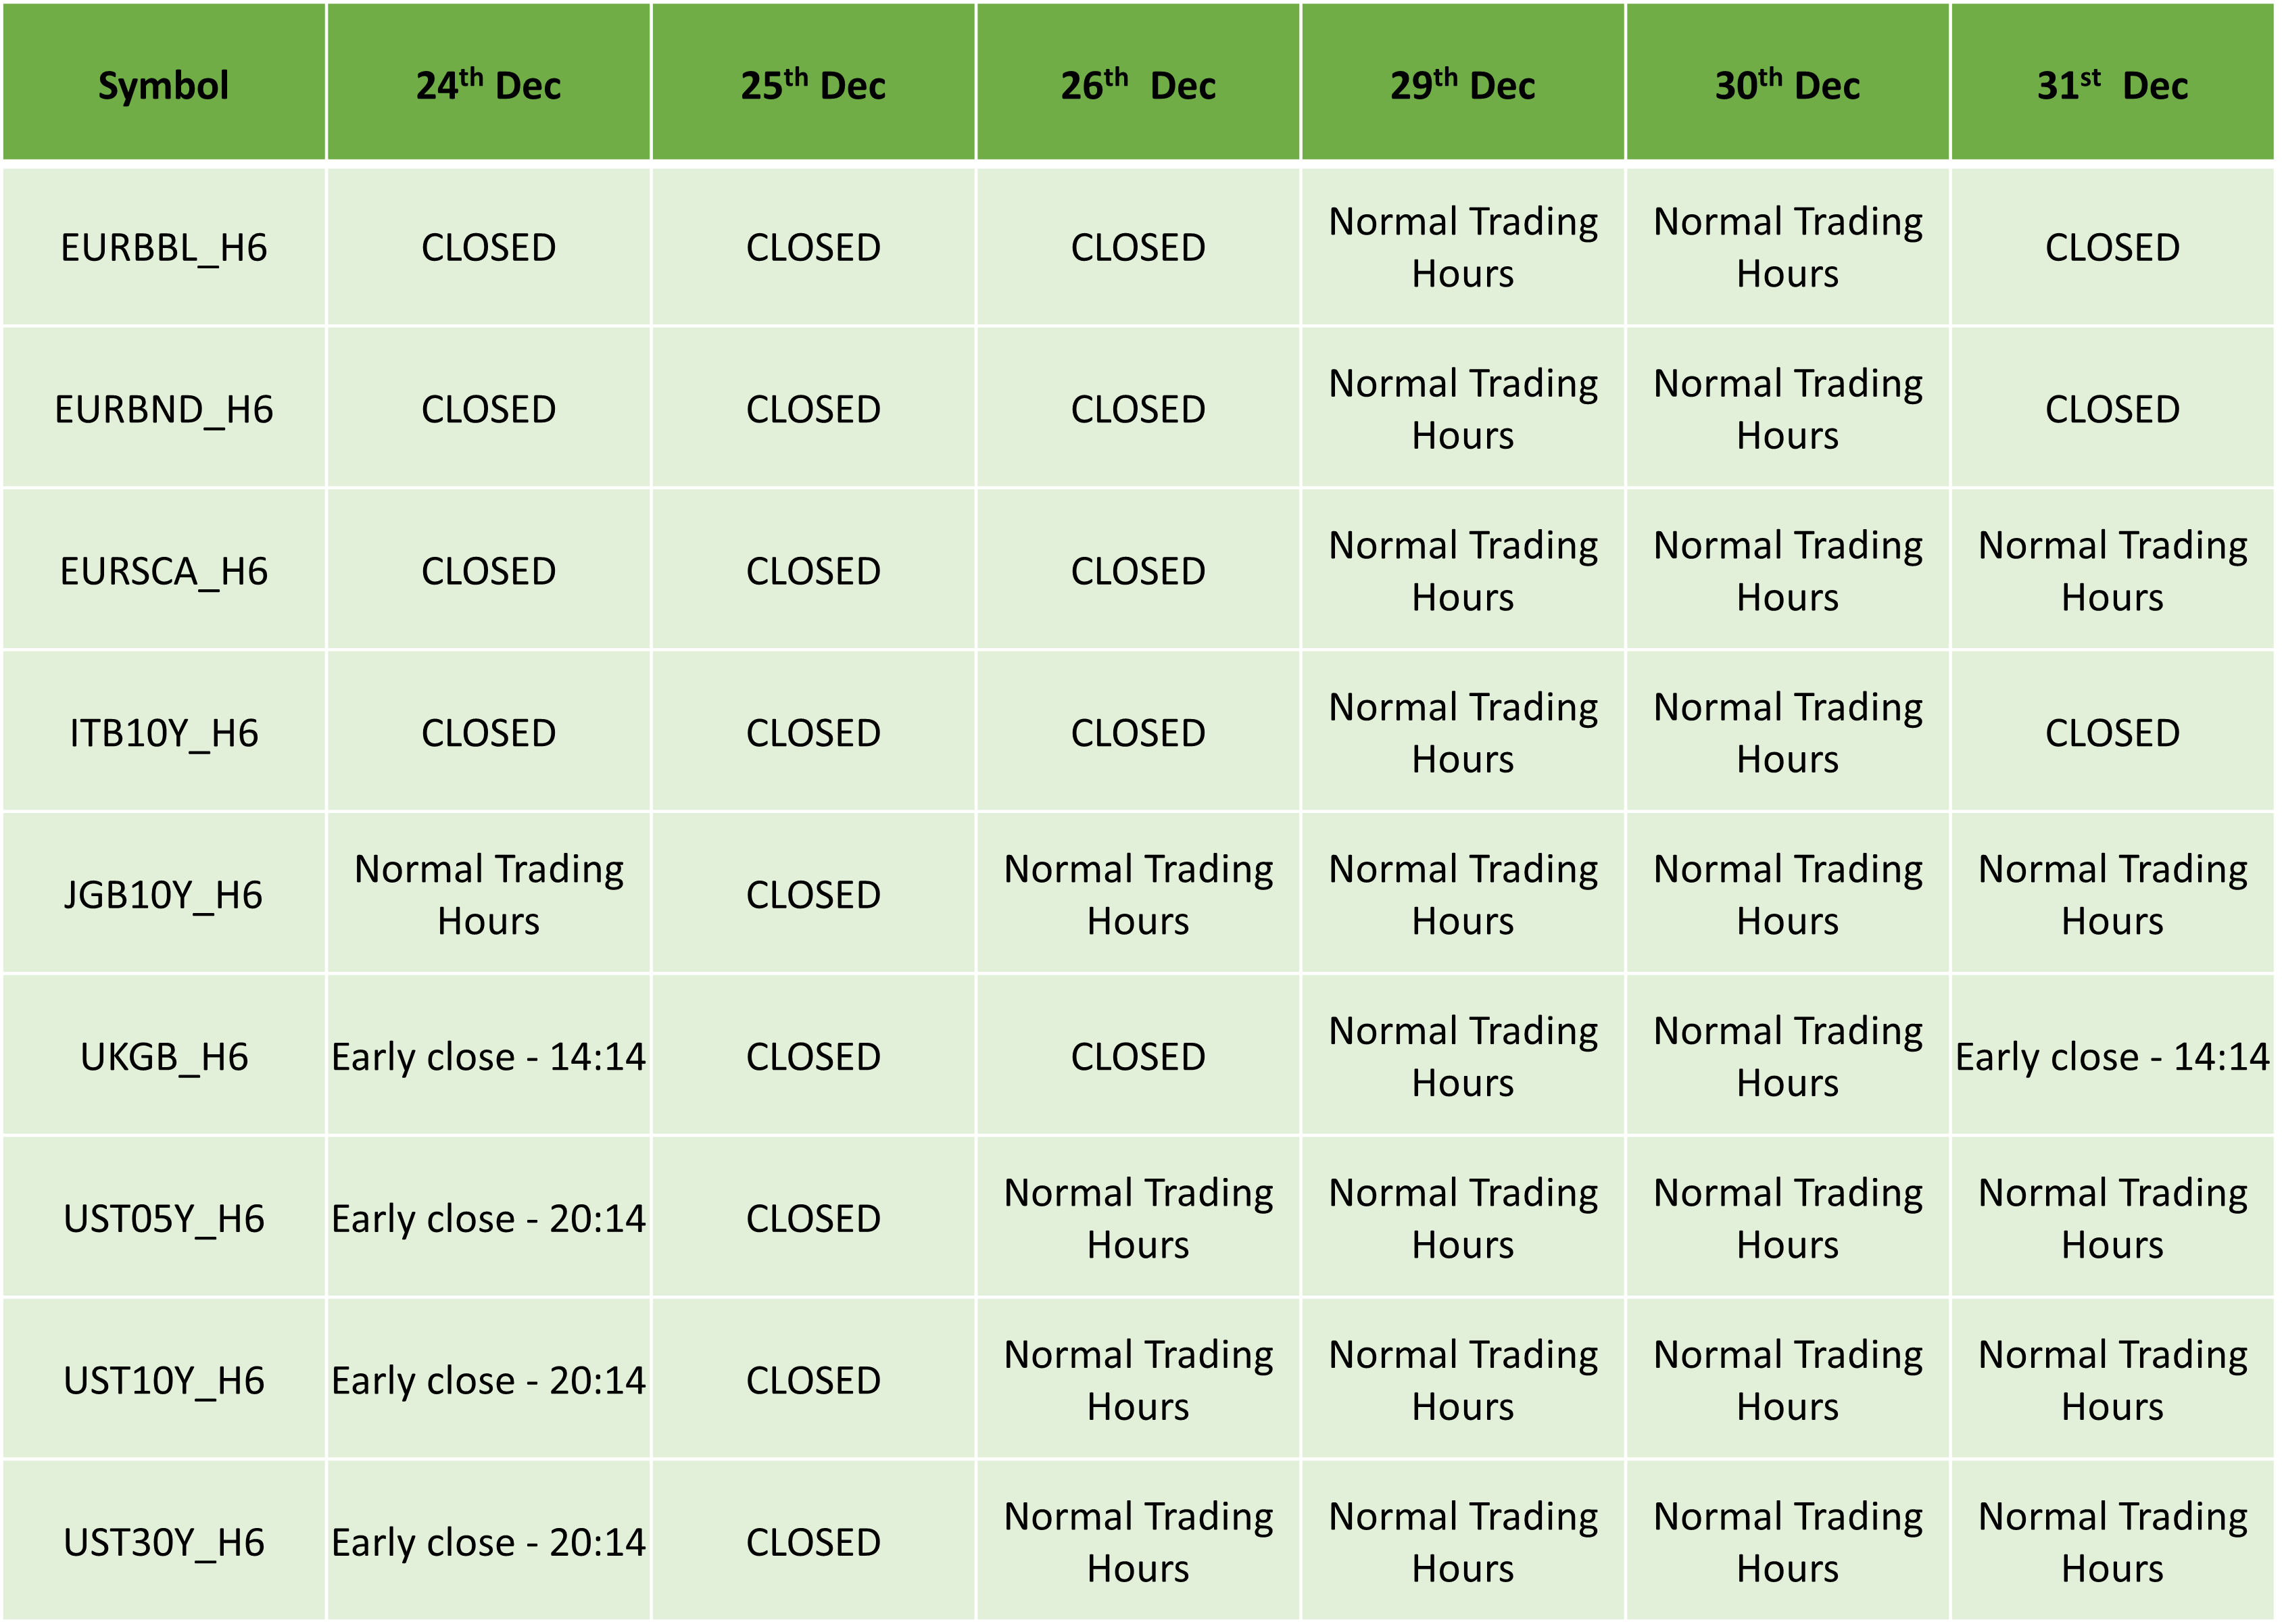
Equities:
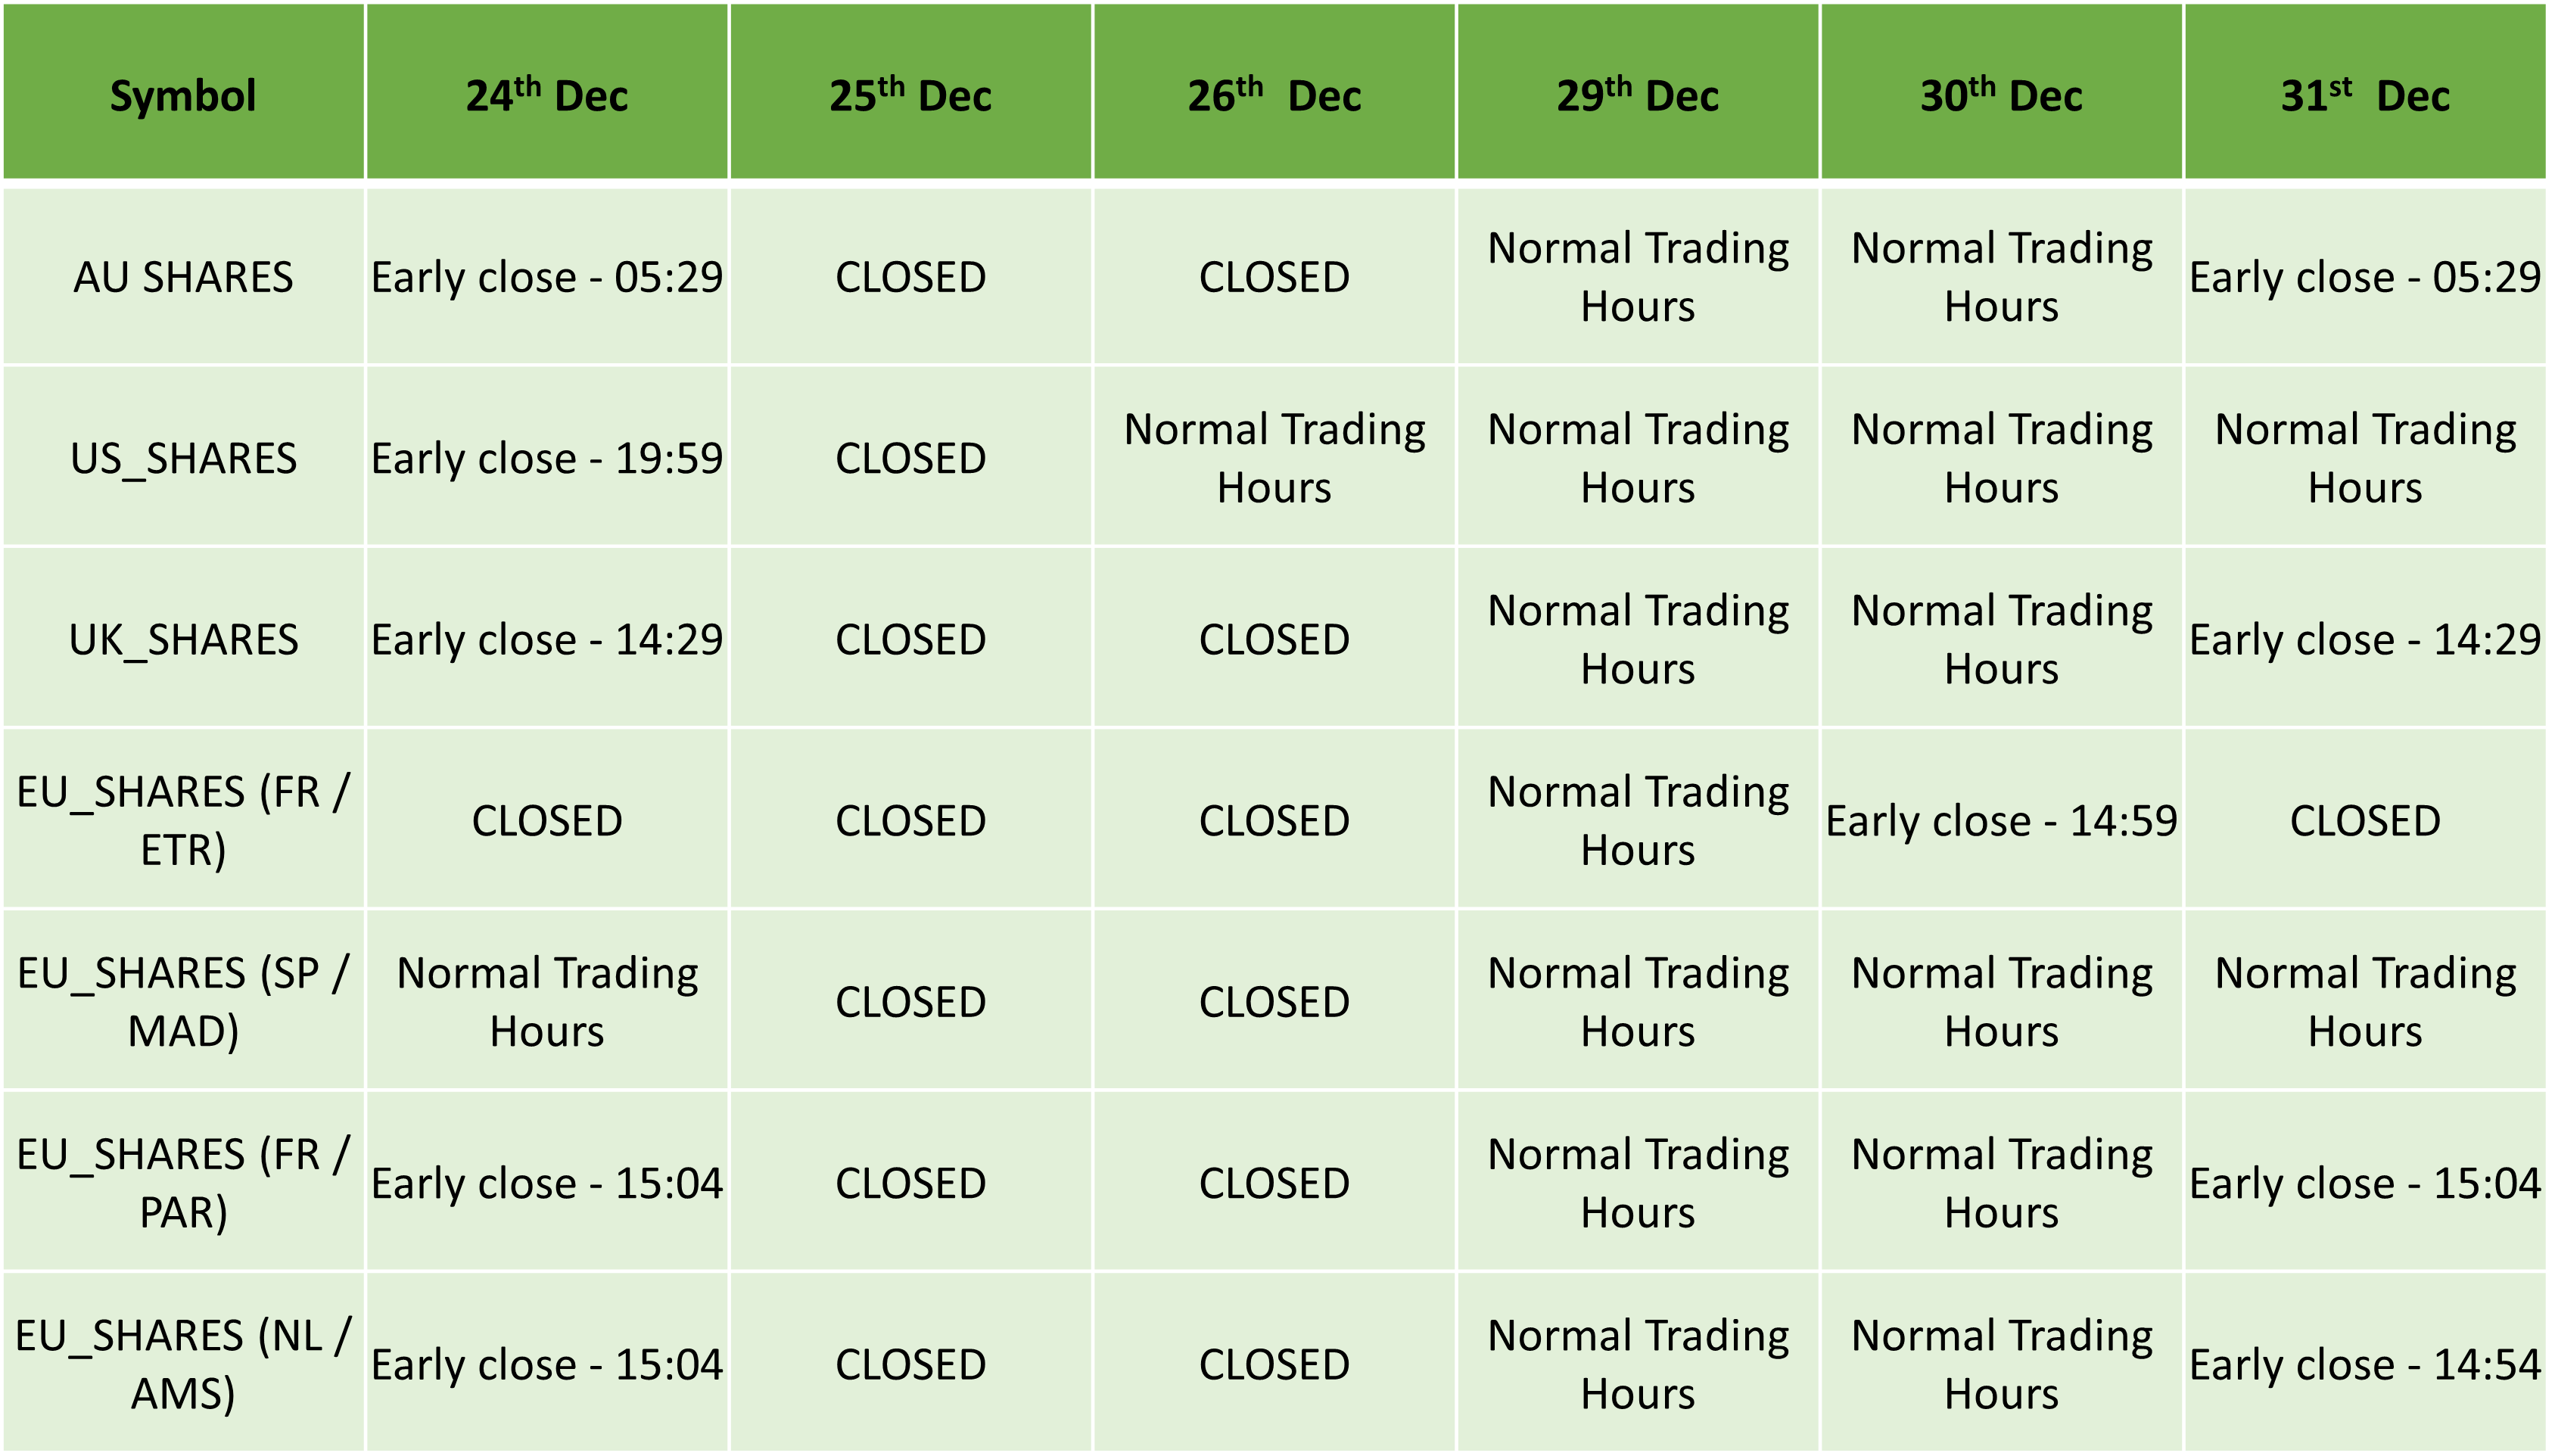
Metal Futures:
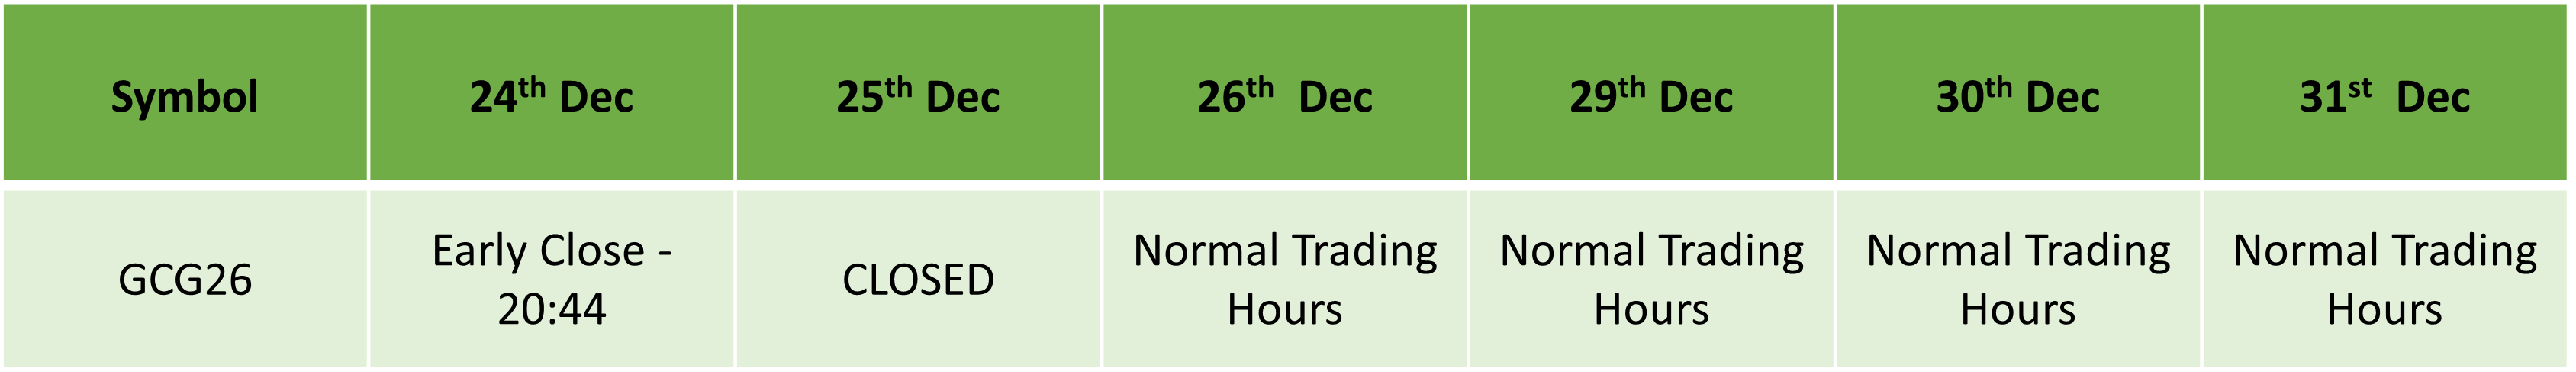
cTrader:
All times mentioned below are Platform time( GMT +0)
Forex :
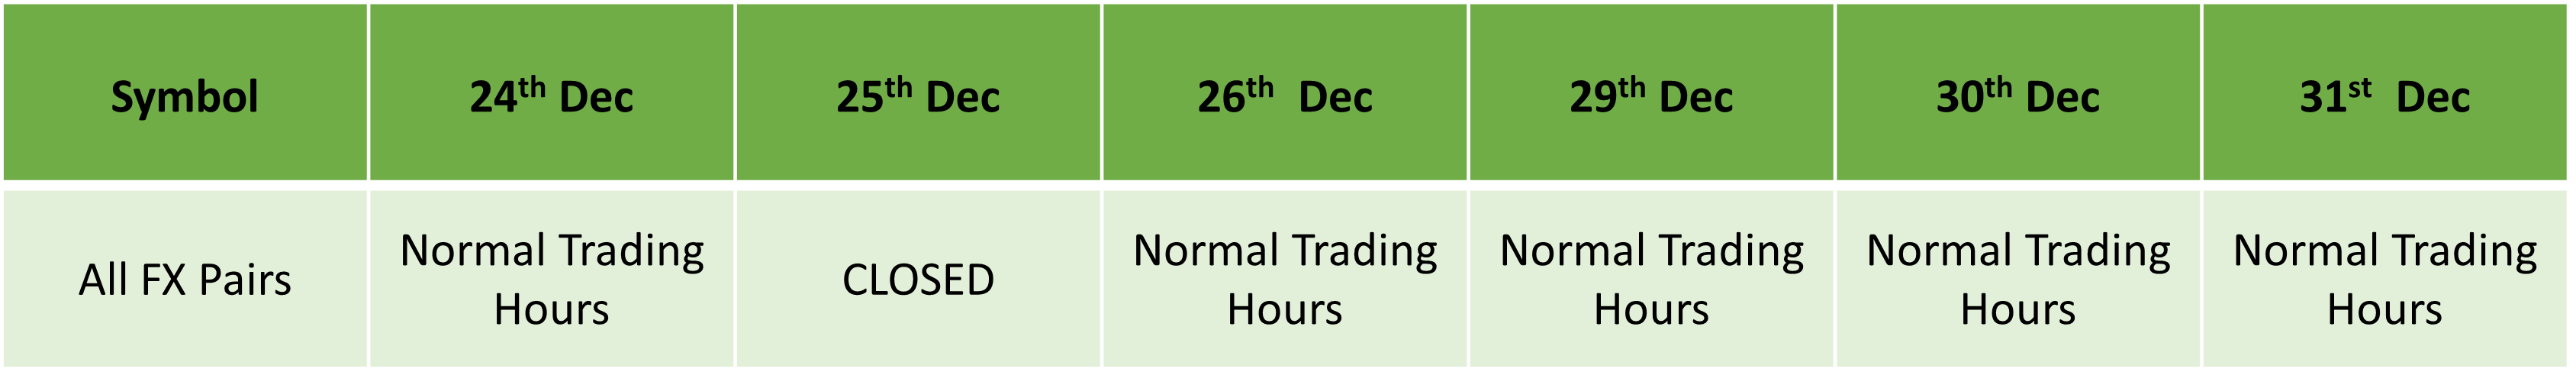
Precious Metals:
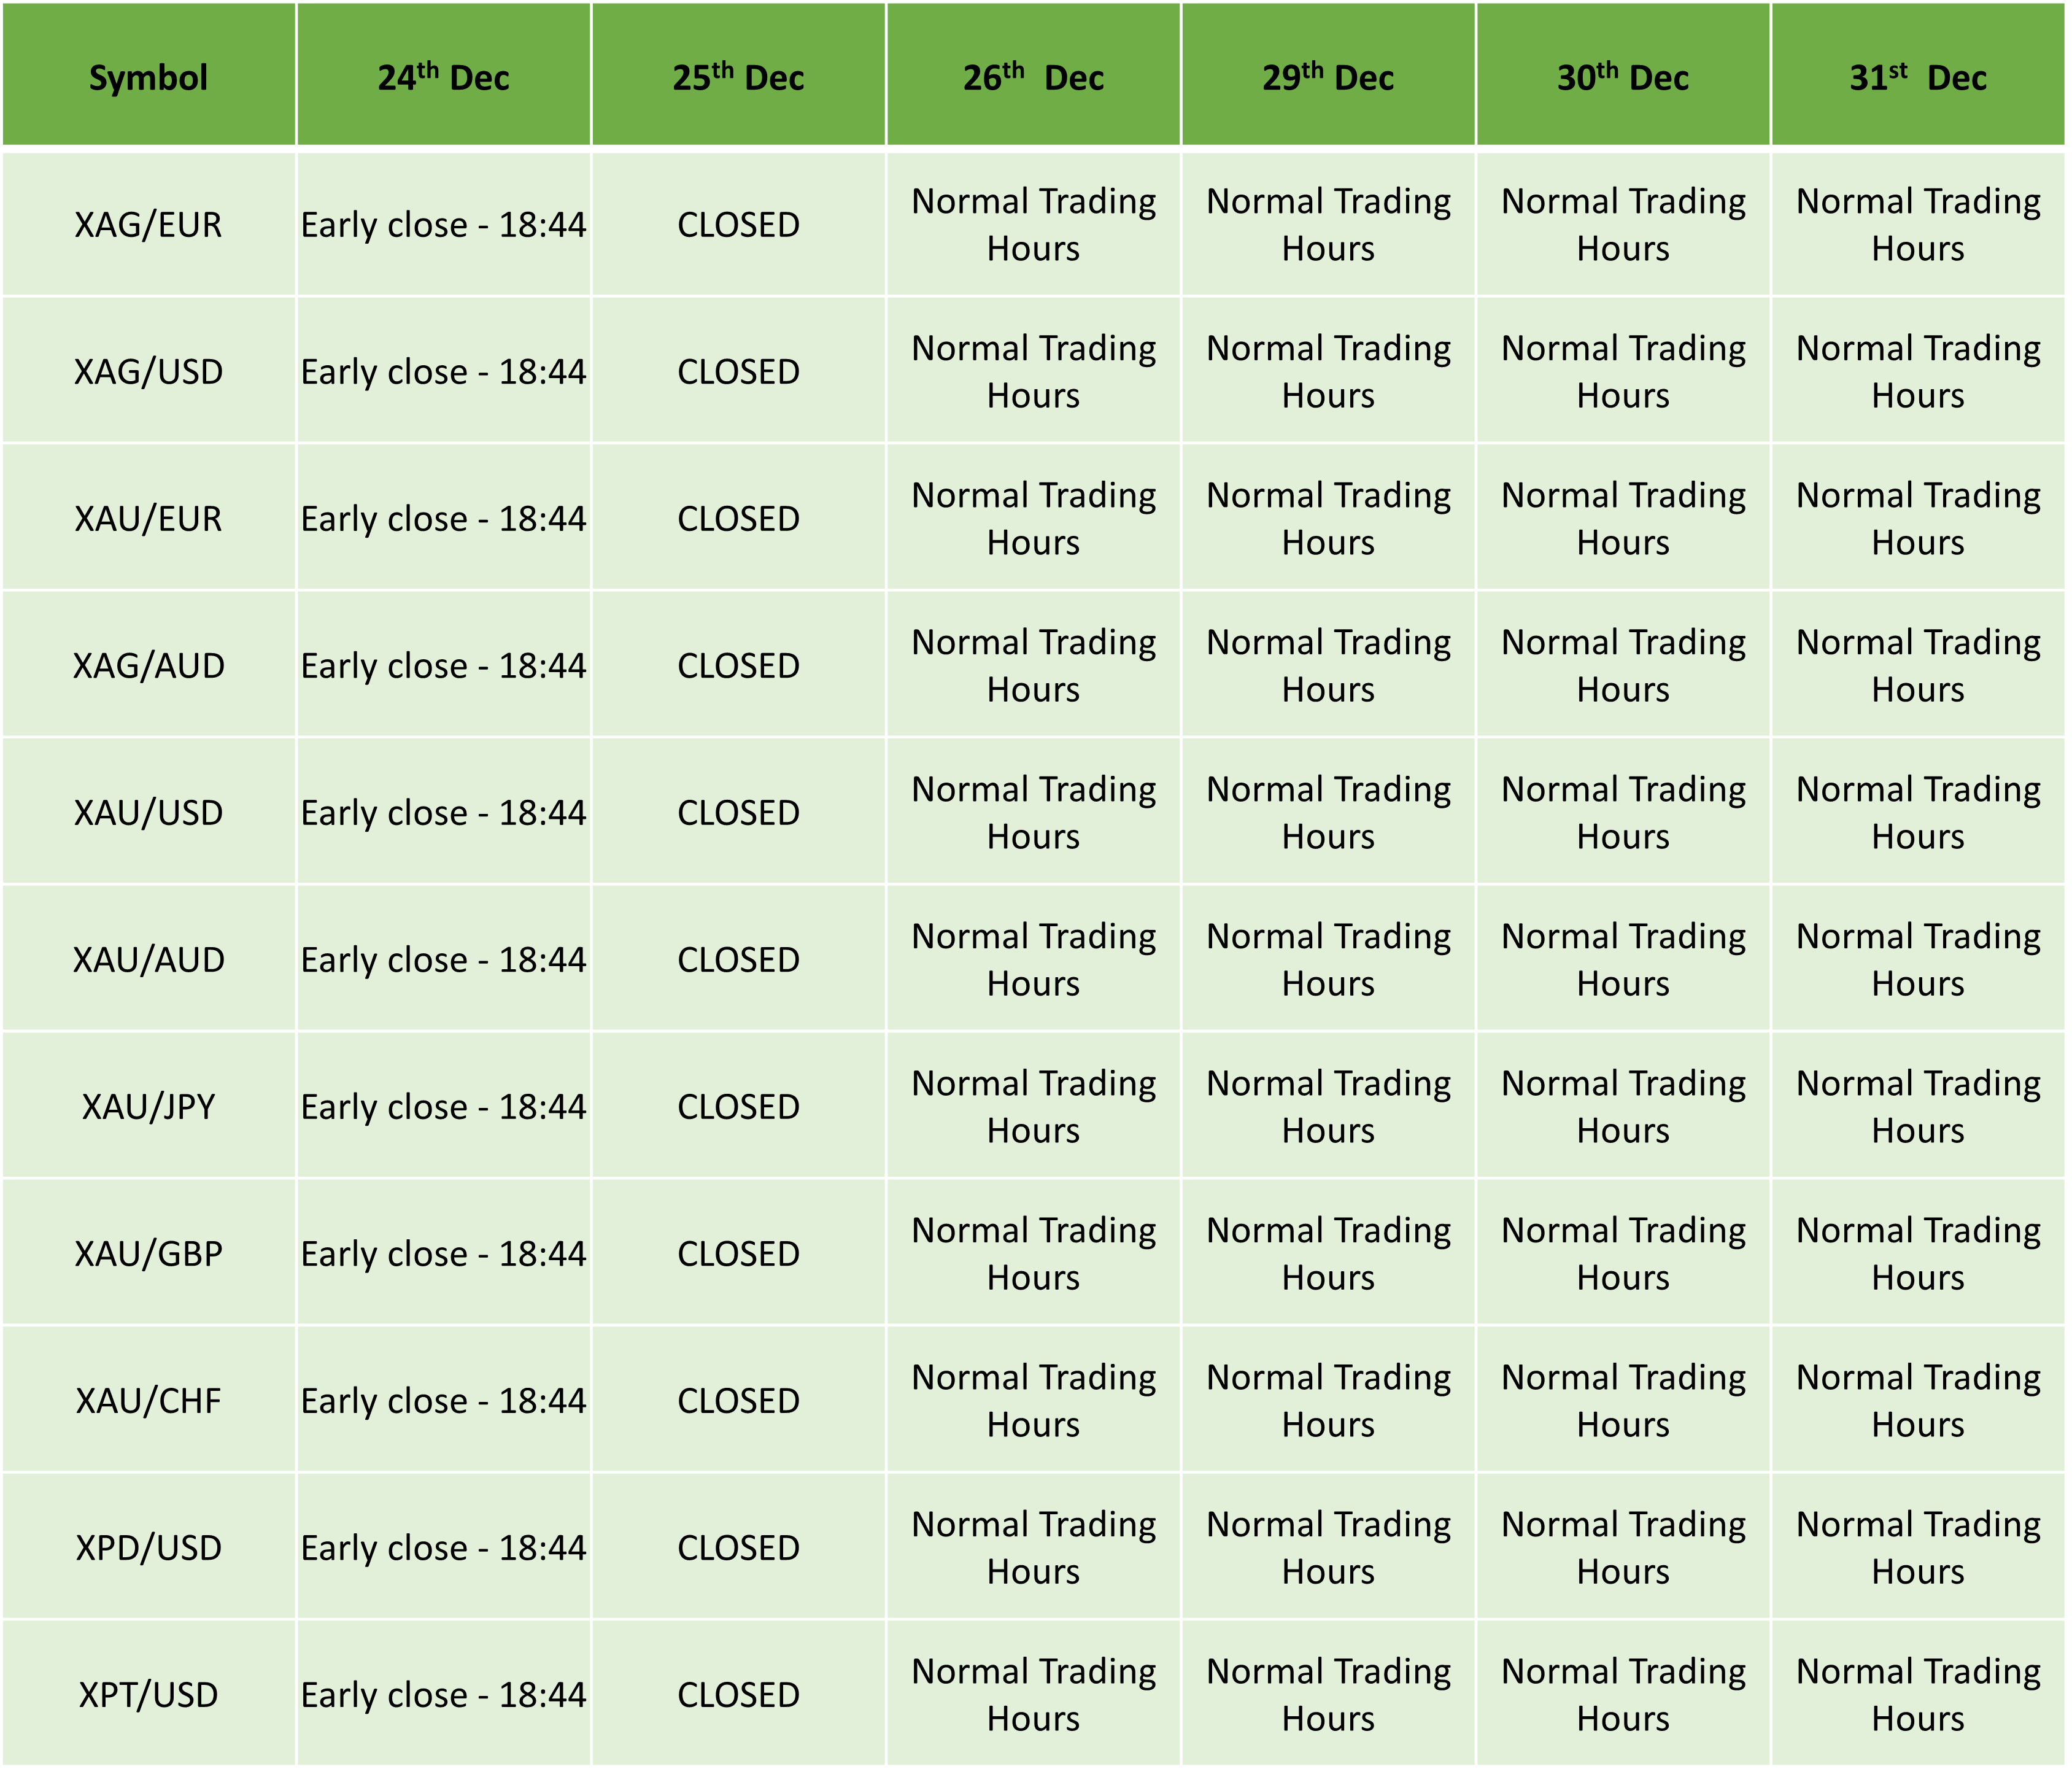
Spot Energies:
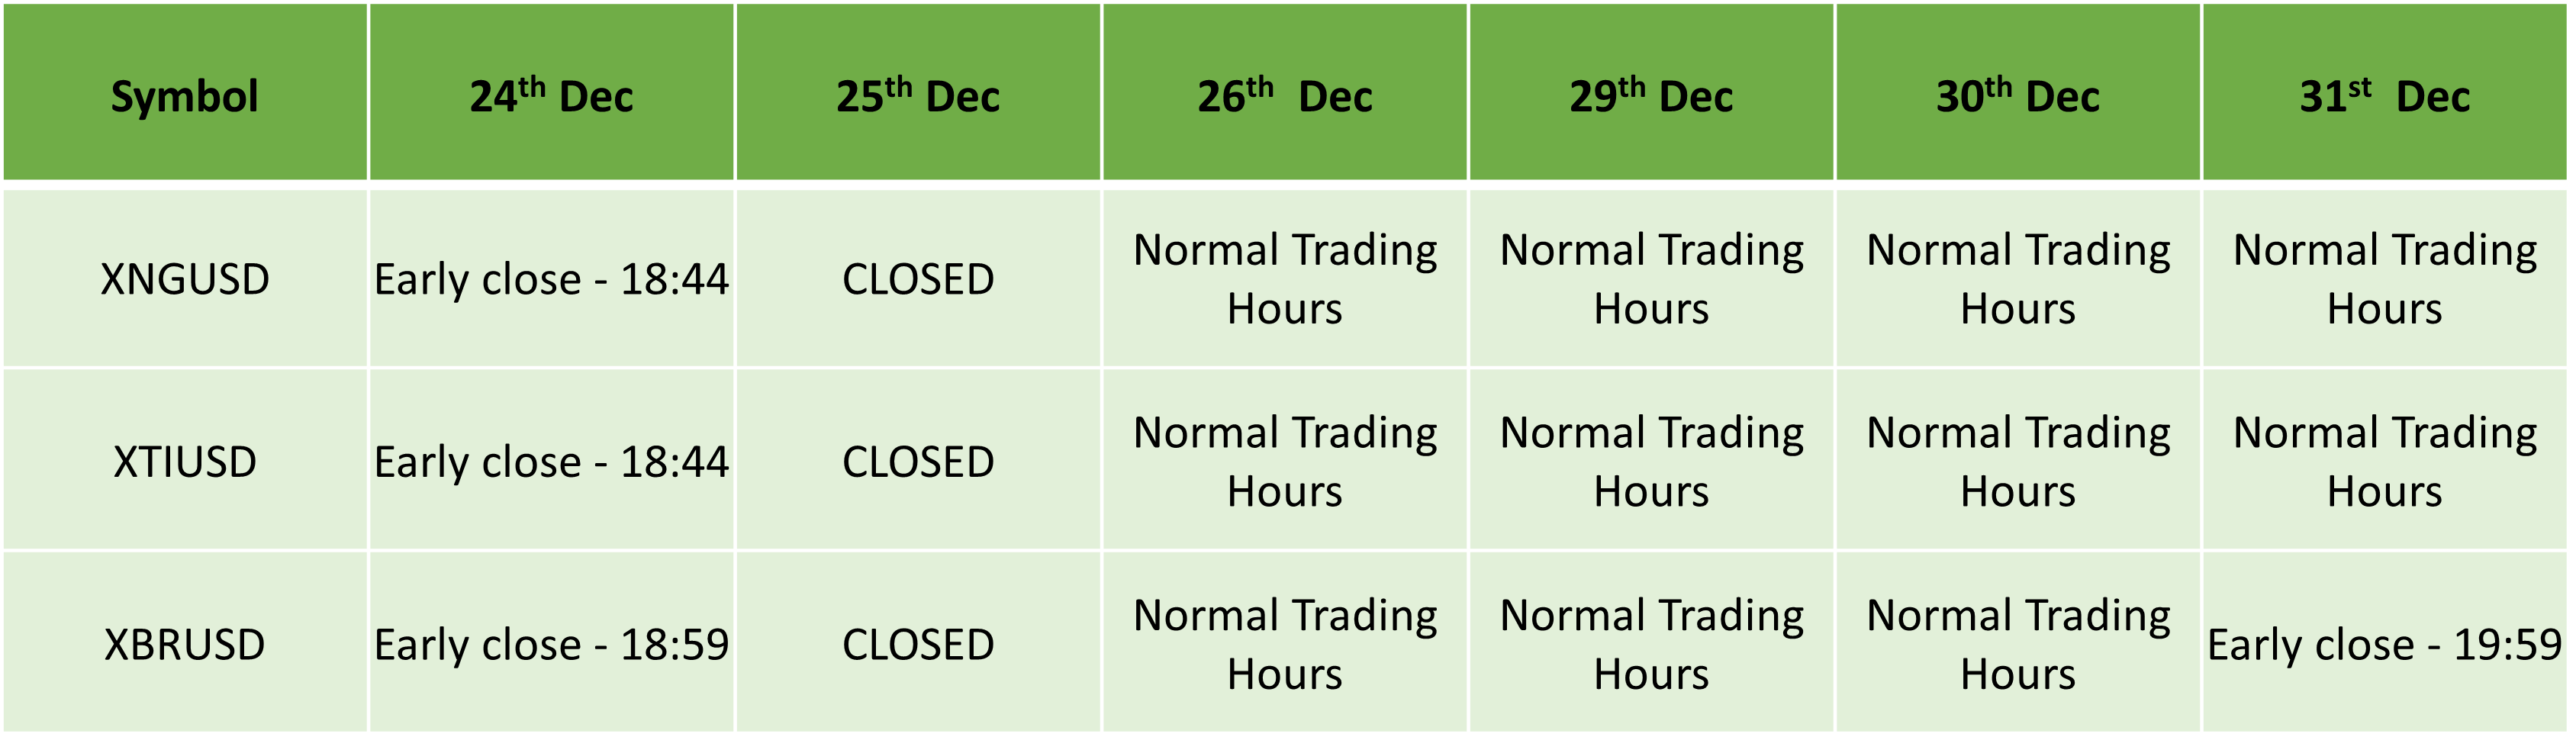
Indices:

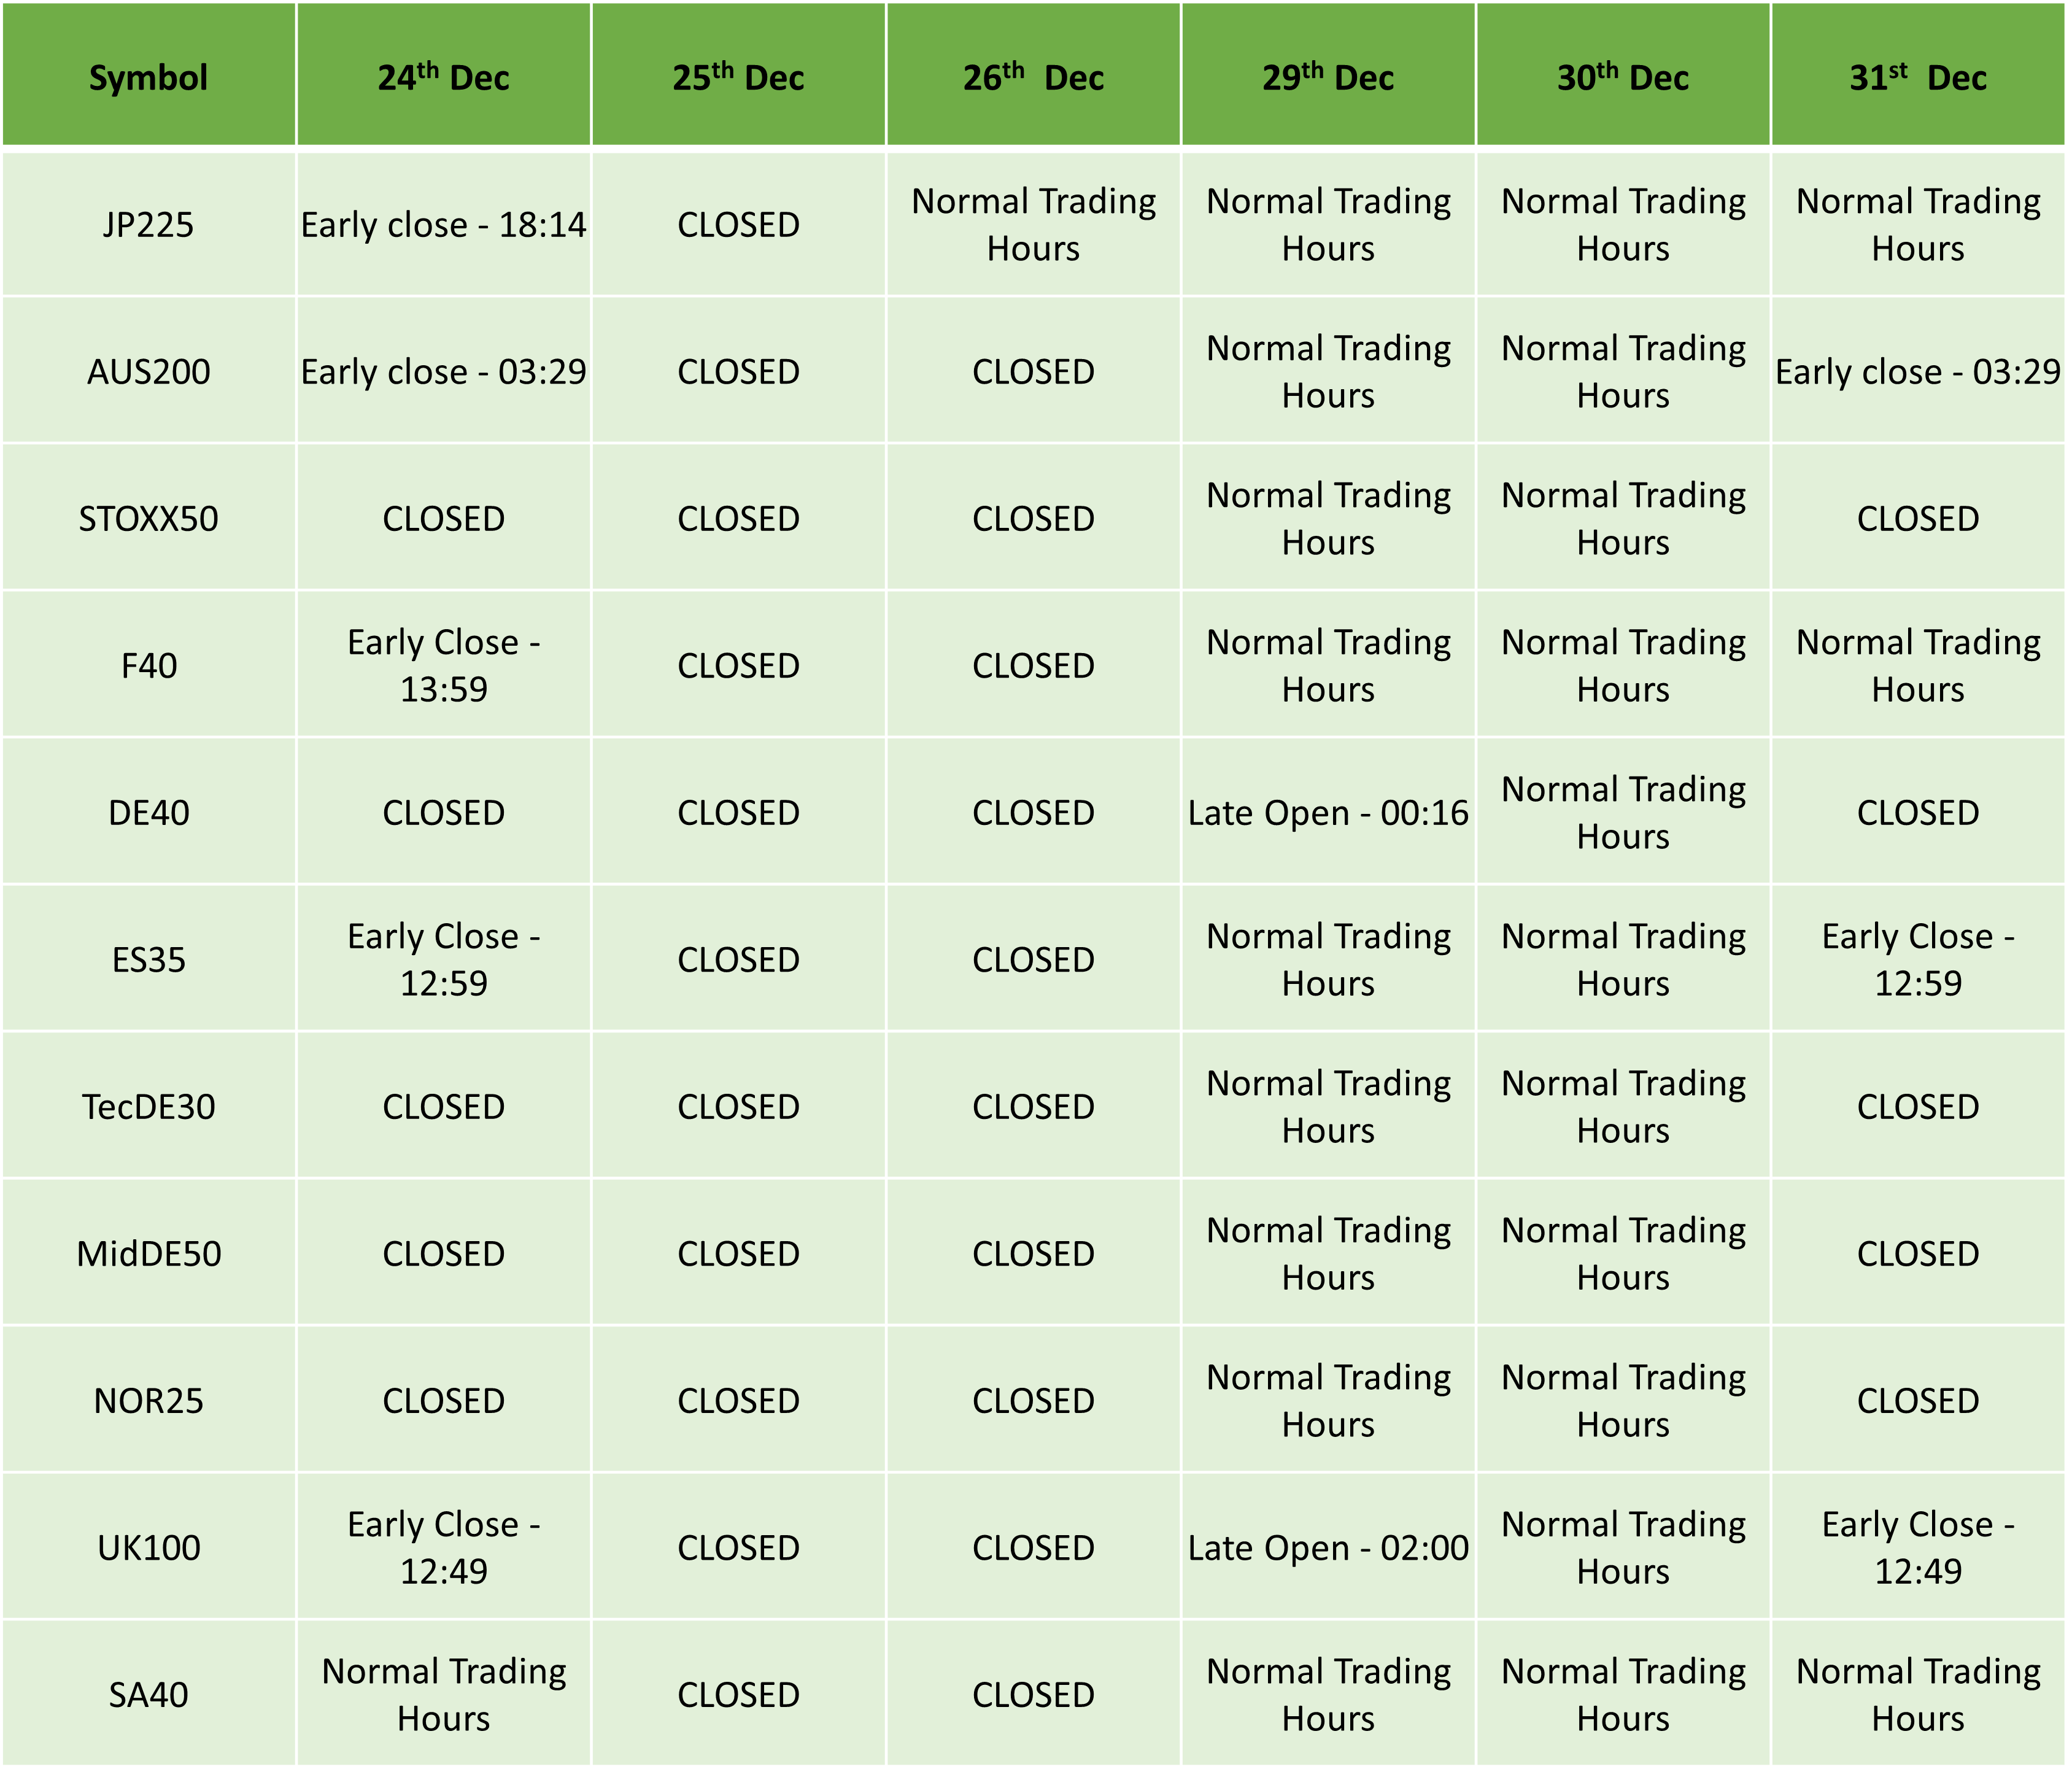
Metal Futures:

Kind regards,
IC Markets Global.
The post Holiday Trading Schedule Dec 2025– Jan 2026 first appeared on IC Markets | Official Blog.
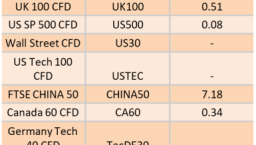
Ex-Dividend 11/12/2025
424412 December 10, 2025 17:39 ICMarkets Market News
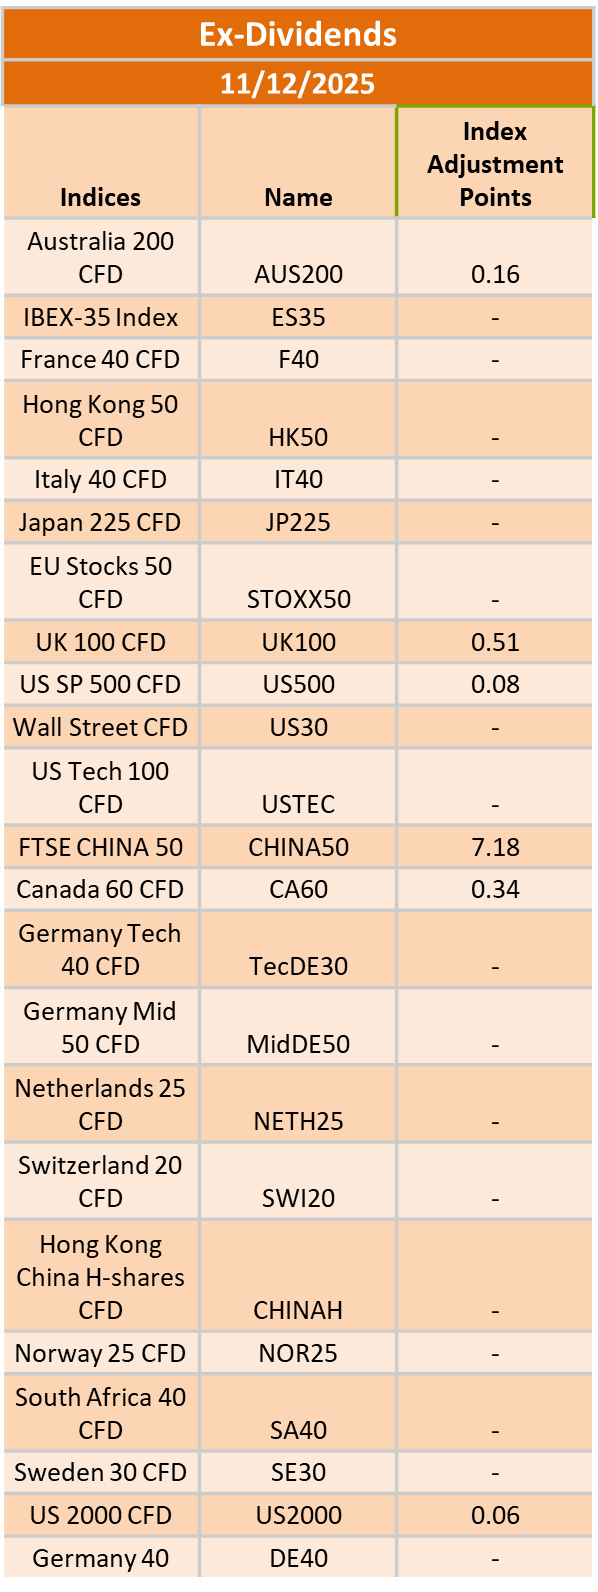
The post Ex-Dividend 11/12/2025 first appeared on IC Markets | Official Blog.