Articles

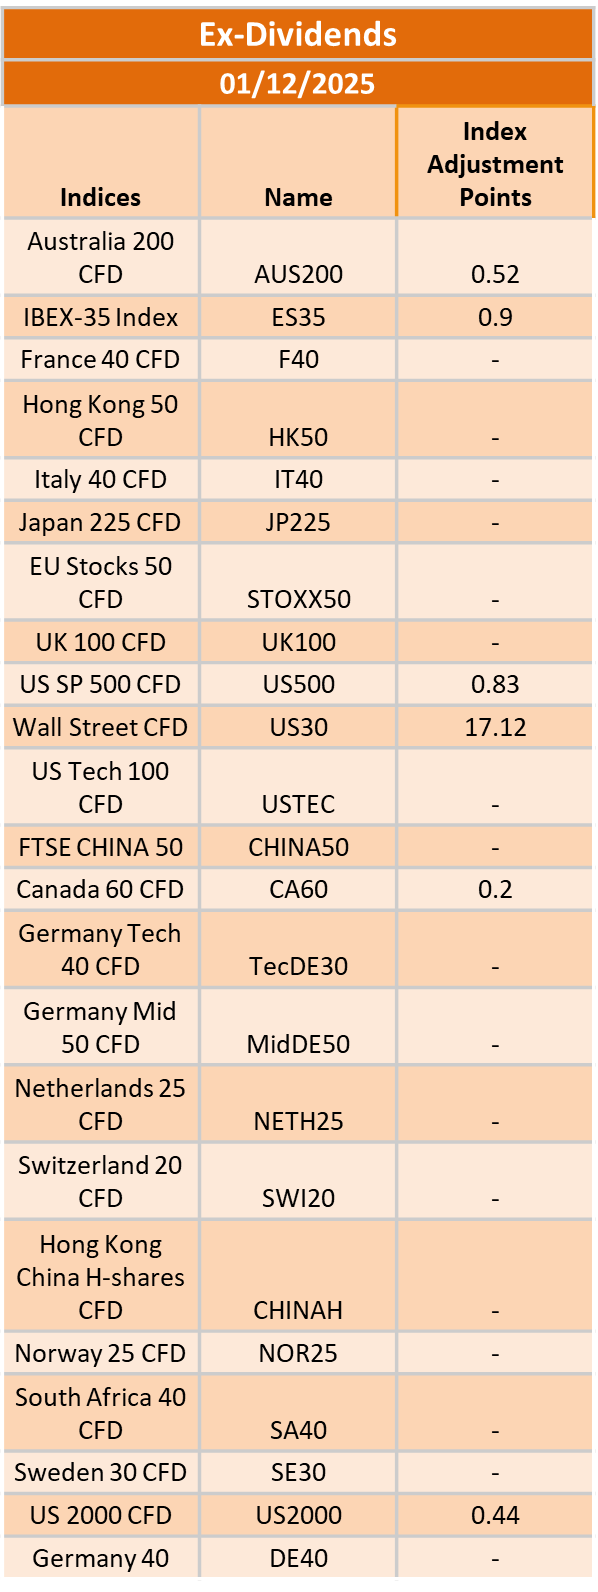
Ex-Dividend 3/12/2025
424095 December 2, 2025 16:14 ICMarkets Market News
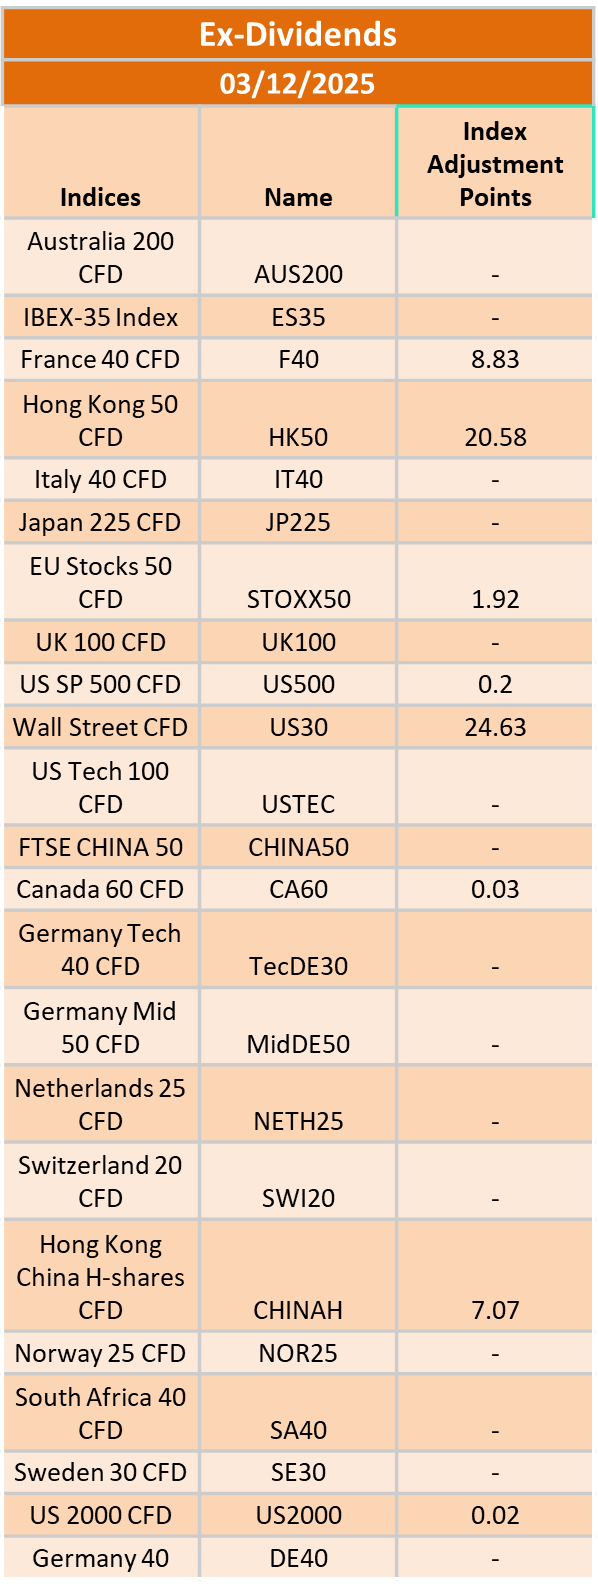
The post Ex-Dividend 3/12/2025 first appeared on IC Markets | Official Blog.

Tuesday 2nd December 2025: Asian Stocks Rise on Rate Cut Hopes Despite Weak Wall Street Lead
424094 December 2, 2025 16:14 ICMarkets Market News
Global Markets:
- Asian Stock Markets : Nikkei up 0.41%, Shanghai Composite down -0.55%, Hang Seng up 0.01% ASX up 0.13%
- Commodities : Gold at $4,250.70 (-0.59%), Silver at $57.798 (-2.29%), Brent Oil at $63.17 (0.00%), WTI Oil at $59.37(0.08%)
- Rates : US 10-year yield at 4.090, UK 10-year yield at 4.4830, Germany 10-year yield at 2.7492
News & Data:
- (USD) ISM Manufacturing PMI 48.2 to 49.0 expected
Markets Update:
Asian stocks traded mostly higher on Tuesday, shrugging off negative cues from Wall Street as traders remained optimistic about interest rate cuts following dovish comments from U.S. Fed officials and weak manufacturing data. Markets are also awaiting key U.S. economic releases later in the week, which could influence policy expectations. According to CME Group’s FedWatch Tool, there is an 87.6% chance of a quarter-point rate cut next week.
In Australia, stocks recovered from Monday’s losses, supported by mining, financial and energy gains, while tech shares lagged. The S&P/ASX 200 climbed to around 8,589, with BHP and Rio Tinto advancing, and Block and Zip among notable decliners. Economic data showed building permits fell 6.4% in October, missing forecasts, while the country reported a Q3 current account deficit of A$16.6 billion. The Australian dollar traded at $0.654.
Japan’s Nikkei rebounded, trading above 49,450, lifted by financial and tech shares but pressured by automakers and exporters. SoftBank dropped over 2%, while Fanuc surged more than 8%. The monetary base fell 8.5% year-on-year in November, broadly in line with estimates. The U.S. dollar traded in the upper 155-yen range.
Elsewhere in Asia, South Korea and Taiwan led gains, while China traded lower. On Wall Street, major indexes finished sharply lower, and European shares also declined. Crude oil prices rose as the dollar weakened, with WTI settling at $59.30.
Upcoming Events:
- 10:00 AM GMT – EUR Core CPI Flash Estimate y/y
- 10:00 AM GMT – EUR CPI Flash Estimate y/y
The post Tuesday 2nd December 2025: Asian Stocks Rise on Rate Cut Hopes Despite Weak Wall Street Lead first appeared on IC Markets | Official Blog.
Ex-Dividend 2/12/2025
424092 December 2, 2025 16:00 ICMarkets Market News
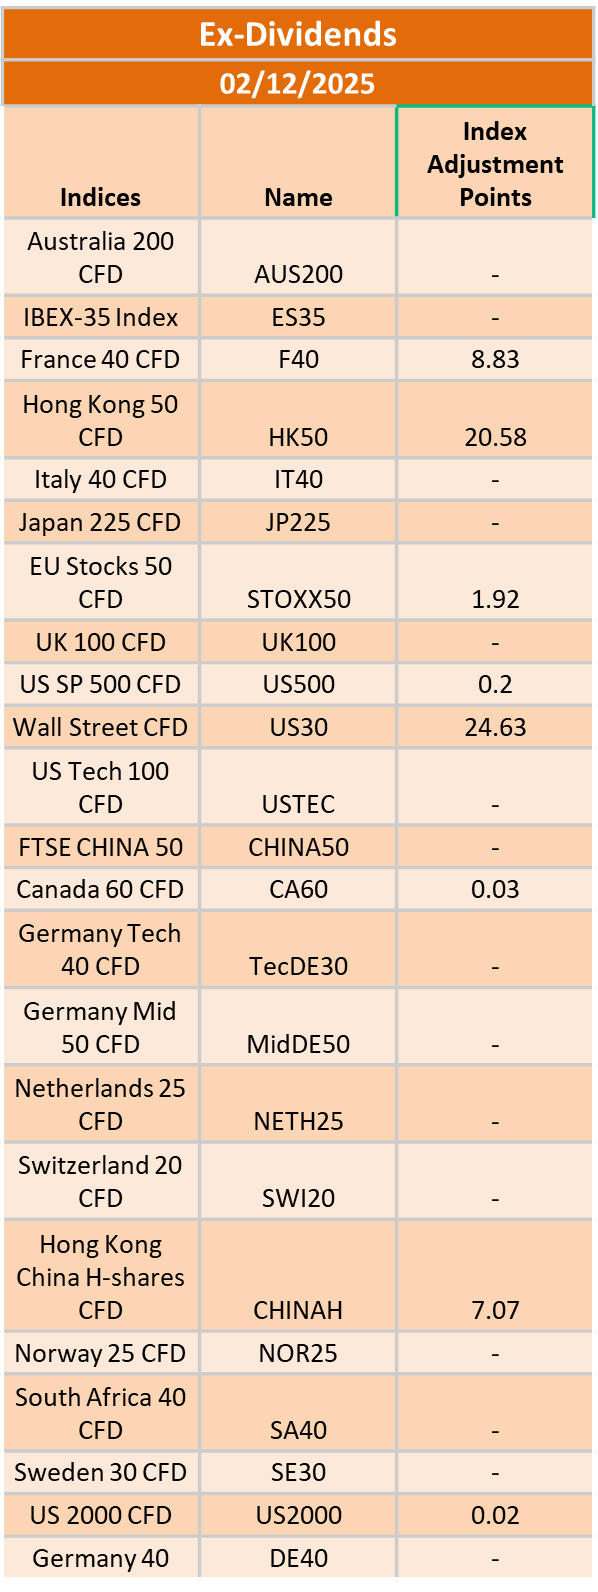
The post Ex-Dividend 2/12/2025 first appeared on IC Markets | Official Blog.
IC Markets Global – Europe Fundamental Forecast | 01 December 2025
424091 December 2, 2025 16:00 ICMarkets Market News
IC Markets Global – Europe Fundamental Forecast | 01 December 2025
What happened in the Asia session?
During today’s Asia session, the main themes were a firmer Japanese yen on rising Bank of Japan (BOJ) tightening expectations, mixed but generally steady Asian equities, and markets positioning ahead of key China PMI and global manufacturing data later in the day. The instruments most directly impacted were JPY pairs (especially USD/JPY), Asian stock indices such as the Nikkei 225 and Hang Seng Index, industrial and precious metals, and, to a lesser extent, regional bond yields and oil.
What does it mean for the Europe & US sessions?
Today marks a pivotal trading day with several high-impact events scheduled. BOJ Governor Ueda delivered hawkish remarks signaling a potential December rate hike, sending the yen higher, while markets are pricing in an 87% probability of a Fed rate cut on December 10. Key releases today include the US ISM Manufacturing PMI (forecast 49.0 vs. previous 48.7) and ISM Manufacturing Prices (forecast 59.5 vs. previous 58.0), which will provide fresh signals on US economic conditions and inflation pressures.
The Dollar Index (DXY)
Key news events today
ISM Manufacturing PMI (3:00 pm GMT)
ISM Manufacturing Prices (3:00 pm GMT)
What can we expect from DXY today?
The dollar enters December under significant pressure as traders focus on the high likelihood of a Fed rate cut, uncertainty around Fed leadership succession, and diverging monetary policy from Japan. The key near-term catalyst is today’s ISM Manufacturing data, which could either reinforce or challenge the current dovish narrative. A sustained break below 99.00 on the DXY would signal further dollar weakness, while any upside surprises in economic data could provide temporary support.
Central Bank Notes:
- The Federal Open Market Committee (FOMC) voted, by majority, to lower the federal funds rate target range by 25 basis points to 3.75% — 4.00% at its October 28–29, 2025, meeting, marking the second consecutive cut following the 25 basis points reduction in September.
- The Committee maintained its long-term objectives of maximum employment and 2% inflation, noting that the labor market continues to soften, with modest job creation and an unemployment rate edging higher. In comparison, inflation remains above target at around 3.0%.
- Policymakers highlighted ongoing downside risks to economic growth, tempered by signs of resilient economic activity. September’s consumer price index (CPI) came in slightly lower than expected at 3.0% year-over-year, easing inflation pressure but still warranting vigilance given tariff-driven price effects.
- Economic activity expanded modestly in the third quarter, with GDP growth estimates around 1.0% annualized; however, uncertainty remains elevated amid persistent global trade tensions and the U.S. government shutdown, which is impacting data availability.
- The updated Summary of Economic Projections anticipates an unemployment rate averaging approximately 4.5% for 2025, with headline and core personal consumption expenditures (PCE) inflation projections remaining near 3.0%, indicating a slow easing path ahead.
- The Committee emphasized its flexible, data-dependent approach and underscored that future policy adjustments will be guided by incoming labor market and inflation data. As in prior meetings, there was dissent, including one member advocating a more aggressive 50-basis-point cut.
- The FOMC announced the planned conclusion of its balance sheet reduction (quantitative tightening) program, intending to cease runoff in the near term to maintain market stability. Treasury redemption caps will remain steady at $5 billion per month, and agency mortgage-backed securities caps will remain at $35 billion.
- The next meeting is scheduled for 9 to 10 December 2025.
Next 24 Hours Bias
Medium bearish
Gold (XAU)
Key news events today
ISM Manufacturing PMI (3:00 pm GMT)
ISM Manufacturing Prices (3:00 pm GMT)
What can we expect from Gold today?
Gold is trading near six-week highs above $4,250 per ounce to start December, positioning for a potential fourth consecutive monthly gain and what could be its strongest annual performance since 1979, with prices up approximately 60% year-to-date. The rally is underpinned by growing expectations of a Federal Reserve rate cut at the December 9-10 meeting, broad U.S. dollar weakness, persistent central bank buying, and ongoing geopolitical uncertainties.
Next 24 Hours Bias
Medium Bullish
The Euro (EUR)
Key news events today
No major key news event
What can we expect from EUR today?
The Euro opens in December 2025 with cautious optimism, trading above the 1.1600 level against the US Dollar amid broad USD weakness driven by dovish Federal Reserve expectations. Key themes shaping the Euro today include the ECB’s firm stance on holding rates at 2.00%, tomorrow’s crucial Eurozone flash inflation data (expected at 2.1%), and today’s release of final Eurozone Manufacturing PMI figures. The short-term EUR/USD trend has shifted from downtrend to sideways, with the pair flirting with its 200-day SMA, a technically significant level.
Central Bank Notes:
- The Governing Council of the ECB kept the three key interest rates unchanged at its 30 October 2025 meeting. The main refinancing rate remains at 2.15%, the marginal lending facility at 2.40%, and the deposit facility at 2.00%. This decision reflects policymakers’ assessment that the current monetary stance remains consistent with medium-term price stability, while incoming data confirm a gradual return of inflation towards the target.
- Recent indicators point to stable price dynamics. Headline inflation remains near the 2% mark, with energy prices contained and food inflation easing slightly after earlier supply bottlenecks. Wage growth continues to moderate, contributing to the slowdown in domestic cost pressures. The ECB reiterated its commitment to a data-driven, meeting-by-meeting approach and emphasized flexibility amid uncertain global financial conditions.
- Eurosystem staff projections have not been materially altered since September. Headline inflation averages remain at 2.0% for 2025, 1.8% for 2026, and 2.0% for 2027. Recent softening in producer prices and subdued pipeline pressures suggest limited upside risks to inflation, though geopolitical tensions and potential commodity shocks continue to pose uncertainties to the outlook.
- Euro area GDP growth remains on track with earlier forecasts, projected at 1.1% for 2025, 1.1% for 2026, and 1.4% for 2027. Forward-looking indicators, including PMIs and industrial sentiment surveys, signal some stabilization in activity following weakness in the third quarter. Public investment and recovering export activity are expected to offset softer private sector demand in the near term.
- The labor market remains resilient, with unemployment rates at multi-decade lows and participation rates strong. Real income growth continues to support household spending, even as consumption growth normalizes from earlier highs. Financing conditions remain favorable, supported by stable banking-sector liquidity and improved credit demand among small and medium-sized firms.
- Business sentiment remains mixed, reflecting lingering uncertainty over global trade policy and the path of US tariffs. However, easing supply chain costs and improved export competitiveness due to softer exchange rates are providing some relief to manufacturing and external-oriented sectors.
- The Governing Council reaffirmed that future decisions will depend on an integrated assessment of incoming data—covering inflation trends, financial conditions, and the state of policy transmission. The Council emphasized that no pre-set path for rates exists; keeping all options open should the economic outlook shift markedly.
- Balance sheet reduction continues smoothly, with holdings under the APP and PEPP declining as reinvestments have ceased. The ECB confirmed that the pace of portfolio runoff remains in line with its previously communicated normalization plan, supporting a gradual withdrawal of monetary accommodation in a predictable manner.
- The next meeting is on 17 to 18 December 2025
Next 24 Hours Bias
Medium Bearish
The Swiss Franc (CHF)
Key news events today
No major news event
What can we expect from CHF today?
The Swiss franc remains well-supported by its safe-haven status, low inflation, and the positive impact of the US tariff reduction. While the economy contracted in Q3, the outlook is improving with the tariff relief now in place. Traders should watch the December 11 SNB meeting for any policy signals, though rate changes appear unlikely in the near term.
Central Bank Notes:
- The SNB maintained its key policy rate at 0% during its meeting on 25 September 2025, pausing a sequence of six consecutive rate cuts as inflation stabilized and the Swiss franc remained firm.
- Recent data showed a modest rebound in inflation, with Swiss consumer prices rising 0.2% year-on-year in August after staying above zero for three consecutive months; this helped alleviate fears of deflation that were mounting earlier in the year.
- The conditional inflation forecast remains broadly unchanged from June: headline inflation is expected to average 0.2% in 2025, 0.5% in 2026, and 0.7% in 2027. The risk of a negative rate move has diminished for now, but the SNB retains flexibility should inflationary pressures weaken again.
- The global economic outlook has deteriorated further, weighed down by heightened trade tensions—especially with the U.S.—and ongoing uncertainty in key Swiss export markets.
- Swiss GDP growth moderated in Q2 after a strong Q1 boosted by front-loaded U.S. exports. The SNB expects growth to slow and remain subdued, with forecasted GDP expansion between 1% and 1.5% in both 2025 and 2026.
- Labor market sentiment in the Swiss industrial sector has softened on concerns over export competitiveness and potential adjustments to production, but the overall growth outlook stays broadly unchanged
- The SNB reiterated its readiness to respond as needed if deflation risks re-emerge, emphasizing its commitment to medium-term price stability and a robust, transparent communication policy, with the introduction of more detailed monetary policy minutes beginning in October.
- The next meeting is on 11 December 2025.
Next 24 Hours Bias
medium Bearish
The Pound (GBP)
Key news events today
No major news event
What can we expect from GBP today?
The Pound enters December on firmer footing after its strongest weekly performance in four months, supported by post-Budget relief and growing expectations of divergent central bank policies favoring GBP. However, upside may be limited as the BoE’s own rate cut expectations and concerns about UK productivity and growth weigh on the outlook. The immediate focus is on US manufacturing data today and the December 18 BoE rate decision. Key technical levels to watch are 1.3200 support and 1.3300 resistance (200-day SMA).
Central Bank Notes:
- The Bank of England’s Monetary Policy Committee (MPC) met on 6 November 2025 and voted 7–2 to keep the Bank Rate unchanged at 4.00 percent for a second consecutive meeting. The decision reflects the Committee’s cautious approach as inflation remains above target, but underlying economic momentum continues to weaken. Two members maintained their votes for a 25-basis-point cut, citing further signs of labor-market softening and weak business sentiment.
- The BOE adjusted its guidance on quantitative tightening (QT), maintaining the reduced pace established in September. The planned reduction of UK government bond holdings remains at £67.5 billion over the next 12 months, leaving the current gilt balance near £550 billion. Policymakers described the recalibrated QT path as “appropriate for current market conditions,” emphasizing the importance of liquidity management amid heightened volatility.
- Headline inflation moderated slightly to 3.6 percent in October from 3.8 percent previously, driven by easing food and transport prices. However, core inflation has shown only gradual progress, holding near 3.9 percent. The MPC noted that services inflation and administered energy costs continue to exert pressure, highlighting the challenge of achieving the 2 percent target sustainably. The Committee’s latest projections see inflation falling toward 3 percent by mid-2026, with further downside expected if energy and wage dynamics continue to normalize.
- Economic activity remains subdued. Estimates place Q3 GDP growth close to zero, with both business output and consumer spending restrained. The unemployment rate has edged up to 4.8 percent, while pay growth cooled to just under 5 percent year-on-year. MPC members acknowledged that pay settlements are weakening further, signaling an easing in labor cost pressures as demand softens. Surveys from the manufacturing and services sectors suggest muted hiring intentions through year-end.
- International factors continue to complicate the policy outlook. Fluctuating oil prices—partly linked to renewed Middle East tensions—alongside fragile global demand have contributed to higher market volatility. The MPC reiterated that external shocks, including global food and energy disruptions, could temporarily slow the disinflation path but remain unlikely to derail the medium-term moderation in prices.
- The Committee assessed risks around inflation as balanced. Downside risks arise from sluggish domestic growth and declining real income momentum, while upside risks remain tied to elevated inflation expectations and stubborn services inflation. Policymakers emphasized the need for patience, maintaining that any rate cuts ahead of clear inflation progress could undermine confidence in policy credibility.
- The MPC’s overall stance remains restrictive but increasingly balanced, with future moves expected to follow a cautious, data-driven trajectory. The Committee reaffirmed that monetary policy will stay tight until there is compelling evidence that inflation is returning to the 2 percent target on a durable basis.
- The next meeting is on 18 December 2025.
Next 24 Hours Bias
Medium Bullish
The Canadian Dollar (CAD)
Key news events today
No major news event
What can we expect from CAD today?
CAD strength may continue in the near term if the Fed cuts rates in December while the BoC holds steady, narrowing the rate differential. Watch Friday’s employment report and December 10’s BoC decision for potential volatility. The loonie remains structurally undervalued above 1.40 according to analysts, but requires trade stabilization or USMCA clarity to narrow the valuation gap. Risk factors include weak Q4 GDP indications (preliminary October GDP may decline 0.3%) and ongoing tariff uncertainty
Central Bank Notes:
- The Council noted that U.S. tariff tensions have eased slightly following early progress in bilateral discussions, though the external trade environment remains fragile. Businesses continue to hold back on long-term investment, with the Bank highlighting that sustained clarity on U.S. trade policy is needed to restore confidence.
- The Bank acknowledged that uncertainty persists despite the softer U.S. tone, as incoming data show limited improvement in export orders. The manufacturing sector has stabilized but remains below pre-2024 output levels, reflecting weak global demand and cautious corporate spending.
- Canada’s economy showed tentative signs of recovery in early Q4, with GDP estimated to expand by 0.3% in October after two quarters of contraction. Mining and energy activity strengthened modestly, aided by steady crude demand, while goods exports posted a fractional gain.
- Service sector growth remained uneven, supported mainly by tourism-related and technology services. However, retail spending and household consumption were subdued, constrained by slower job creation and lingering consumer caution. The Bank judged overall momentum as fragile but improving marginally.
- Housing activity showed modest reacceleration in major urban markets as mortgage rates stabilized near record lows. Nonetheless, affordability pressures and stricter lending standards continue to limit overall resale volumes, resulting in only a gradual recovery in the housing sector.
- Headline CPI inflation rose to 2.1% in October, reaching the Bank’s target for the first time in six months. Higher energy prices and a modest uptick in food and shelter costs drove the increase. Core inflation measures remained stable, suggesting underlying price pressures are contained.
- The Governing Council reiterated its data-dependent stance, indicating that the current policy rate remains appropriate amid tentative growth and balanced inflation risks. Officials noted that while additional stimulus is not ruled out, the emphasis has shifted toward monitoring the sustainability of the recovery rather than immediate rate adjustments.
- The next meeting is on 17 to 18 December 2025.
Next 24 Hours Bias
Weak Bearish
Oil
Key news events today
No major news event
What can we expect from Oil today?
Oil prices opened the week higher, with WTI crude trading around $59.45/barrel and Brent at approximately $63.20/barrel, rising over 1% following OPEC+’s confirmation on Sunday that it will pause production increases through Q1 2026. However, significant headwinds remain from an anticipated global supply surplus of 2-4 million barrels per day in 2026, geopolitical tensions around Venezuela, and potential easing of Russian oil sanctions amid Ukraine peace negotiations.
Next 24 Hours Bias
Medium Bullish
The post IC Markets Global – Europe Fundamental Forecast | 01 December 2025 first appeared on IC Markets | Official Blog.
The Week Ahead – Week Commencing 01 December 2025
424085 December 2, 2025 15:00 ICMarkets Market News
It was the expected disjointed trading week last week due to the Thanksgiving Day holiday, and it was made even more disjointed by a major tech and liquidity failure on Friday. However, markets pushed higher across the majority of the sessions, and investor sentiment seems positive as we enter the last month of the year.
US data continues to return to the market in the days ahead, but investors will still have a bit of a wait until things return to normal. They would usually be expecting key US jobs numbers in the first week of the month, but they have been delayed due to the government shutdown. However, we do have some services, consumer sentiment, and manufacturing numbers out that will help to shape views on the economy.
Chinese PMI data over the weekend has come in largely on expectations, and geopolitical updates are unlikely to hit markets, and so traders are expecting a relatively quiet start to the trading week on the Monday open in Asia.
Here is our usual day-by-day breakdown of the major risk events this week:

It looks set for a relatively quiet start to the trading week on Monday with only a couple of major risk events scheduled on the calendar. The Asian session will see a strong focus on Japanese markets, with Bank of Japan Governor Kazuo Ueda speaking midway through the day. There is nothing of note due out in the London session, but we do have the first major US data of the week released in the New York session, with the ISM Manufacturing PMI and Manufacturing Prices numbers due out.

Tuesday kicks off with a strong central bank focus in the Asian session. Early in the day, we hear from the RBNZ’s new Governor Anna Breman on her first day when she speaks in Wellington before the Finance and Expenditure Committee, then Fed Chair Jerome Powell speaks at an event at Stanford University midway through the session. The London session will see a focus on the EU, with key Flash CPI data due out, and we look set for a relatively quiet New York session with no major events scheduled.

Wednesday looks busy on the calendar, with tier-1 data due out in all three sessions. Australian markets will be in focus in the Asian session with GDP data due out early in the day. The London session sees the release of key Swiss CPI data and ECB President Christine Lagarde testifying before the European Parliament. The New York session sees the release of more key US data, with both the ADP Non-Farm Employment and ISM Services PMI numbers due out.

The first two sessions of the day look relatively quiet on Thursday; however, the New York session has a couple of key updates that could move markets. The weekly US unemployment claims numbers are due out early in the day before Canadian Ivey PMI data is released north of the border.

It’s a quiet first two sessions of the day again on Friday; however, the New York session promises to be another busy one to close out the week. We would normally be expecting the big US Non-Farms numbers at this time of the week; however, they have been delayed until December 16 due to the recent shutdown. We do have Canadian employment numbers due out, which should see some moves in the Loonie, and the rescheduled US Core PCE Price Index numbers will be released alongside the University of Michigan Consumer Sentiment and Inflation Expectations numbers.
The post The Week Ahead – Week Commencing 01 December 2025 first appeared on IC Markets | Official Blog.
IC Markets Global – Asia Fundamental Forecast | 01 December 2025
424084 December 2, 2025 14:39 ICMarkets Market News
IC Markets Global – Asia Fundamental Forecast | 01 December 2025
What happened in the U.S. session?
The overnight U.S. session on November 28-29 concluded a volatile but ultimately positive month for equities, with the S&P 500 and Dow extending their monthly winning streaks to seven months while the Nasdaq snapped its seven-month run. The most impacted instruments included Intel (rallying on Apple partnership speculation), crypto-related stocks (rising with Bitcoin), natural gas producers like EQT (benefiting from cold weather), and AI stocks (under continued pressure despite sector-wide strong fundamentals).
What does it mean for the Asia Session?
Governor Ueda’s tone will be pivotal; any hawkish hints about December rate hike timing could strengthen the yen significantly. The BOJ has maintained rates at 0.5% since January, and markets are increasingly expecting the next hike in December or January. ISM data will either validate or challenge the current 86% probability of a December Fed cut.
Stronger-than-expected readings could support the dollar; weaker data would reinforce rate cut expectations.The late-November rally in global markets suggests risk appetite has recovered, but AI valuation concerns and the upcoming Fed decision remain key swing factors.
The Dollar Index (DXY)
Key news events today
ISM Manufacturing PMI (3:00 pm GMT)
ISM Manufacturing Prices (3:00 pm GMT)
What can we expect from DXY today?
The US dollar is starting Monday, 1 December 2025, on the back foot, with traders focused on the upcoming US manufacturing data and growing expectations of a December Federal Reserve rate cut, which together keep the Dollar Index under mild pressure near recent lows. Market attention today is centered on the ISM Manufacturing PMI and related manufacturing indicators, which are key for confirming whether US growth is slowing enough to justify that cut.
Central Bank Notes:
- The Federal Open Market Committee (FOMC) voted, by majority, to lower the federal funds rate target range by 25 basis points to 3.75% — 4.00% at its October 28–29, 2025, meeting, marking the second consecutive cut following the 25 basis points reduction in September.
- The Committee maintained its long-term objectives of maximum employment and 2% inflation, noting that the labor market continues to soften, with modest job creation and an unemployment rate edging higher. In comparison, inflation remains above target at around 3.0%.
- Policymakers highlighted ongoing downside risks to economic growth, tempered by signs of resilient economic activity. September’s consumer price index (CPI) came in slightly below expectations at 3.0% year-over-year, easing inflationary pressure but still warranting vigilance amid tariff-driven price effects.
- Economic activity expanded modestly in the third quarter, with GDP growth estimates around 1.0% annualized; however, uncertainty remains elevated amid persistent global trade tensions and the U.S. government shutdown, which is impacting data availability.
- The updated Summary of Economic Projections anticipates an unemployment rate averaging approximately 4.5% for 2025, with headline and core personal consumption expenditures (PCE) inflation projections remaining near 3.0%, indicating a slow easing path ahead.
- The Committee emphasized its flexible, data-dependent approach and underscored that future policy adjustments will be guided by incoming labor market and inflation data. As in prior meetings, there was dissent, including one member advocating a more aggressive 50-basis-point cut.
- The FOMC announced the planned conclusion of its balance sheet reduction (quantitative tightening) program, intending to cease runoff in the near term to maintain market stability. Treasury redemption caps will remain steady at $5 billion per month, and agency mortgage-backed securities caps will remain at $35 billion.
- The next meeting is scheduled for 9 to 10 December 2025.
Next 24 Hours Bias
Medium Bearish
Gold (XAU)
Key news events today
ISM Manufacturing PMI (3:00 pm GMT)
ISM Manufacturing Prices (3:00 pm GMT)
What can we expect from Gold today?
Gold enters Monday’s session extended but still bid after a powerful 2025 rally, trading around 4,200 USD/oz with nearby resistance just above and first meaningful supports below 4,000. The market tone is “buy‑the‑dip” as long as expectations for Fed easing, heavy central‑bank buying, and elevated geopolitical risk remain intact, but a deeper correction is possible if US data or policy guidance push yields higher in the near term.
Next 24 Hours Bias
Medium Bullish
The Australian Dollar (AUD)
Key news events today
No major news event
What can we expect from AUD today?
Mildly constructive, with AUD supported on dips by firm domestic inflation and reduced RBA‑cut expectations, but capped by event risk from upcoming US data and December FOMC. Shifts in Fed‑cut pricing, US ISM and labour data, and any surprises in Australian data or RBA communication; sustained trade above the mid‑0.65s would keep the upside correction alive, while a break back below the low‑0.64s would reopen the downside toward 0.63.
Central Bank Notes:
- The Reserve Bank of Australia held its cash rate steady at 3.60% at the November policy meeting, citing persistent inflationary pressures and lingering uncertainties in both domestic and global outlooks. This is the third consecutive pause following the cut in August.
- Policymakers remain alert to renewed inflation momentum. After a temporary uptick in September’s CPI, trimmed mean inflation for Q3 stands at 3.0%, above the intended 2–3% band. The RBA now anticipates that core inflation will stay above target until at least mid-2026, delaying any hopes of further easing.
- Headline CPI climbed by 3.2% in the year to September 2025, driven by resilient housing (+2.5%) and insurance costs, while discretionary goods inflation is subdued. The transition to monthly CPI reporting from November will improve the accuracy of inflation tracking.
- Domestic demand remains firm, particularly in services and housing, while manufacturing and discretionary retail continue to lag. Household incomes have stabilized, but high borrowing costs and elevated rents are constraining consumption and risking a slowdown in Q1 2026.
- Labor market tightness persists, though job growth has moderated. Underutilization edged higher. Wage growth is plateauing, but weak productivity is keeping unit labor costs elevated—a medium-term risk that remains central to the Board’s narrative.
- The RBA highlights geopolitical tensions and volatile commodity markets as primary global risks, against a backdrop of modest upward revisions to world growth forecasts. The Board stresses that its stance remains “cautious and data-dependent,” with ongoing vigilance on inflation, labor, and spending trends.
- Monetary policy remains mildly restrictive, balancing progress on price stability against vulnerabilities in household demand and global outlook. Board communications reaffirm a dual mandate: price stability and full employment, while underscoring readiness to respond should risks materialize sharply.
- Analysts generally expect the cash rate to remain at current levels through early 2026, with only modest cuts possible later in the year if inflation moderates. The new monthly CPI release (first full edition Nov 2025) will be watched closely for timely signals on price trends.
- The next meeting is on 9 December 2025.
Next 24 Hours Bias
Medium Bullish
The Kiwi Dollar (NZD)
Key news events today
RBNZ Gov Breman Speaks (9:00 pm GMT)
What can we expect from NZD today?
The New Zealand Dollar (NZD) is trading with a cautious tone today, with markets focused on the start of Anna Breman’s term as the new Reserve Bank of New Zealand (RBNZ) Governor on 1 December 2025 and on broader risk sentiment rather than any major local data releases.
Central Bank Notes:
- The Monetary Policy Committee (MPC) left the Official Cash Rate (OCR) unchanged at 2.25% at its 26 November 2025 meeting, following the widely anticipated 25-basis-point reduction from 2.50%, and signaled that policy is now firmly in stimulatory territory while keeping the option of further easing on the table if needed.
- The decision was again reached by consensus, with members judging that the cumulative 325 basis points of easing over the past year warranted a period of assessment, even as several emphasized a willingness to cut further should incoming data point to a more protracted downturn or renewed disinflationary pressures.
- Headline consumer price inflation is projected to hover near 3% in late 2025 before gradually easing toward the 2% midpoint of the 1–3% target band through 2026, supported by contained inflation expectations around 2.3% over the two-year horizon and an expected pickup in spare capacity.
- The MPC noted that domestic demand remains subdued but shows tentative signs of stabilisation, with softer household spending and construction only partially offset by improving services activity; nevertheless, policymakers still expect services inflation to ease as wage growth moderates and the labour market loosens further over the coming year.
- Financial conditions continue to ease as wholesale and retail borrowing rates reprice to the lower OCR, contributing to gradually rising mortgage approvals and improving housing-related sentiment, although broader business credit growth remains patchy and sensitive to uncertainty about the durability of the recovery.
- Recent data confirm that GDP momentum is weak but not deteriorating as sharply as earlier in 2025, with high-frequency indicators pointing to a shallow recovery from a low base and ongoing headwinds from elevated living costs and fragile confidence weighing on discretionary consumption and investment.
- The MPC reiterated that external risks remain skewed to the downside, particularly from softer Chinese demand and uncertainty around United States trade policy, but noted that a lower New Zealand dollar continues to provide some offset via improved export competitiveness and support for tradables inflation.
- Looking ahead to early 2026, the Committee maintained a mild easing bias, indicating that a further cut toward 2.00–2.10% cannot be ruled out if activity fails to gain traction or if inflation undershoots projections, but current forecasts envisage the OCR remaining near 2.25% for an extended period provided inflation converges toward target and the recovery proceeds broadly as expected.
- The next meeting is on 18 February 2026.
Next 24 Hours Bias
Medium Bearish
The Japanese Yen (JPY)
Key news events today
BOJ Gov Ueda Speaks (1:05 am GMT)
What can we expect from JPY today?
The dominant theme is that the yen’s medium‑term path hinges on how strongly Ueda leans hawkish in today’s speech and whether the BOJ delivers another rate hike in December; a clear signal toward tightening would likely support a stronger yen, while a cautious tone would keep carry trades and yen weakness in play. Beyond today, markets expect BOJ normalization to stay very gradual, with only limited hikes priced over 2026, so unless global risk sentiment sours or U.S. rate‑cut expectations accelerate, the yen is still seen as relatively weak compared with other majors on a multi‑month horizon.
Central Bank Notes:
- The Policy Board of the Bank of Japan met on 30–31 October and, by a clear majority vote, decided to maintain its key monetary policy approach for the upcoming period.
- The BOJ will continue to encourage the uncollateralized overnight call rate to remain at around 0.5%, in line with the prior stance.
- The gradual quarterly reduction in monthly outright purchases of Japanese Government Bonds (JGBs) remains intact, with amounts unchanged from the previous schedule. Purchases are set to decrease by about ¥400 billion per quarter through March 2026, shifting to about ¥200 billion per quarter from April to June 2026, and targeting a ¥2 trillion purchase level for Q1 2027. The bank reaffirmed its intention to maintain flexibility, with readiness to respond if market conditions warrant an adjustment.
- Japan’s economy continues to show moderate recovery, primarily led by solid capital expenditures, although export growth and corporate activity remain restrained by external demand uncertainty and the ongoing effects of U.S. trade policies.
- Annual headline inflation (excluding fresh food) accelerated to 2.9% year-on-year in September, marking the first uptick in four months and staying above the BOJ’s 2% target. Broad-based inflation persists, with food and energy cost pressures, but wage growth continues to support household consumption. Input cost pressures from the earlier surge in imports eased slightly.
- Short-term inflation momentum could moderate as food-price hikes ease, though rent, healthcare, and service-sector price increases tied to labor shortages provide support. Firms and households maintain a gradual upward drift in inflation expectations.
- For the near term, BOJ projects growth below trend as external demand stays subdued and corporate investment plans remain cautious. Still, accommodative financial conditions and steady gains in real labor income will underpin domestic consumption.
- Over the medium term, as overseas economies recover and trade conditions normalize, Japan’s growth potential should improve. Persistent labor market tightness, higher wage settlements, and rising medium- to long-term inflation expectations are expected to keep core inflation on a gradual upward trajectory, converging toward the 2% price stability target later in the forecast horizon.
- The next meeting is scheduled for 18 to 19 December 2025.
Next 24 Hours Bias
Medium Bearish
Oil
Key news events today
No major news event
What can we expect from Oil today?
Oil is trading in the high‑50s to low‑60s per barrel range, with both Brent and WTI hovering just below recent highs and still locked in a broader downtrend driven by oversupply concerns and cautious demand. OPEC+ is expected to keep its output policy broadly unchanged after a year of gradual supply increases, reinforcing expectations of a loose market into early 2026.
Next 24 Hours Bias
Weak Bearish
The post IC Markets Global – Asia Fundamental Forecast | 01 December 2025 first appeared on IC Markets | Official Blog.
General Market Analysis – 1/12/25
424083 December 2, 2025 14:39 ICMarkets Market News
US Markets Close Out the Week on Front Foot – Dow up 0.6%
US markets extended their post-holiday momentum on Friday, with all three major indices finishing the session in positive territory and securing weekly gains. Trading activity remained relatively subdued following Thanksgiving, and although a pricing outage from the CME Group caused temporary disruption, it ultimately had minimal effect on overall market direction. The Dow rose 0.61% to 47,716, the S&P 500 added 0.54% to close at 6,849, and the Nasdaq advanced 0.65% to 23,365. The US dollar drifted lower again, slipping 0.12% to 99.48, cementing its weakest weekly performance since July. Treasury yields firmed slightly, with the 2-year yield up 1.4 basis points to 3.489% and the 10-year rising 1.9 basis points to 4.013%, though both remain near recent lows. In commodities, oil prices edged lower once more as ongoing Russia–Ukraine peace discussions failed to deliver fresh progress. Brent eased 0.78% to $62.38, while WTI dipped 0.17% to $58.55. Gold was the standout mover on the day, breaking out of its recent range with a strong rally of 1.97%, finishing at $4,239.44.
More US Data in the Days Ahead – PCE in Focus
Investors and traders alike will be paying close attention to US data this week, as we have more updates in the coming days which should give a better picture of the state of the US economy after the recent government shutdown. We have key updates due on manufacturing, services, and employment in the coming days, although the highlight of the week is likely to be the Federal Reserve’s favourite inflation number, the Core PCE Price Index, which is due out on Friday. We would normally be expecting to see the key Non-Farm Payroll numbers at the end of the first trading week of the month, but they have been delayed until December 16. Market pricing is still strongly in favour of a 25-basis-point rate cut from the Fed (87% chance on CME FedWatch); however, this week’s data could go a long way to changing those expectations if data surprises, one way or the other.
Markets to Kick Off Month in Positive Mode
Market sentiment remains constructive heading into the first sessions of the new month, with Friday’s upbeat close on Wall Street setting the tone for a positive start to December. It is a relatively quiet calendar day ahead for investors today, although there are a couple of risk events that could move markets. There is little in the way of tier 1 data in the Asian session today; however, we are scheduled to hear from Bank of Japan Governor Kazuo Ueda midway through the day, and anything new from him could see some strong moves in the yen. The London session sees mainly lower-tier data released; however, we do have our first tier 1 data out of the US shortly after the New York open, which should have traders on their toes. The ISM Manufacturing PMI (exp. 49.0) and ISM Manufacturing Prices (exp. 59.5) data sets are due out, and any significant deviations from expectations should see moves in the market.
The post General Market Analysis – 1/12/25 first appeared on IC Markets | Official Blog.
Monday 1st December 2025: Asian Markets Mixed Amid Rate-Cut Optimism and Tech Valuation Concerns
424081 December 2, 2025 14:15 ICMarkets Market News
Global Markets:
- Asian Stock Markets : Nikkei down -1.75%, Shanghai Composite up 0.42%, Hang Seng up 0.84% ASX down -0.51%
- Commodities : Gold at $4,277.35 (0.52%), Silver at $57.010 (1.00%), Brent Oil at $63.44 (1.70%), WTI Oil at $59.60(1.84%)
- Rates : US 10-year yield at 4.040, UK 10-year yield at 4.4420, Germany 10-year yield at 2.6913
News & Data:
- (CAD) GDP m/m 0.2% to 0.2% expected
Markets Update:
Asian stock markets traded mixed on Monday, following the positive cues from Wall Street on Friday, as optimism about US interest rate cuts continued to support sentiment. However, concerns over high valuations, especially in technology stocks, kept gains in check. CME Group’s FedWatch Tool indicates an 87.4% probability of a quarter-point rate cut in December.
In Australia, the S&P/ASX 200 slipped below 8,600, pressured by weakness in financials and tech, though mining and energy stocks provided some support. The session was also impacted by an ASX outage that delayed around 50 company announcements. Major miners such as BHP and Rio Tinto gained around 1%, while Mineral Resources fell more than 4%. Oil stocks were mostly higher, but tech names like Appen and Zip declined. Among banks, Westpac and ANZ dropped over 1%. AUB Group plunged more than 17% after ending takeover talks. Economic data showed flat company profits in Q3 and a return to expansion in manufacturing PMI at 51.6. The Australian dollar traded at $0.654.
Japan’s Nikkei 225 dropped sharply to near 49,400, with broad declines led by tech and exporters. SoftBank fell nearly 4%, while major banks rose over 2%. Japan’s manufacturing PMI improved slightly to 48.7 but remained in contraction. The yen traded in the high 155 range.
Elsewhere in Asia, China, Hong Kong, Singapore, Malaysia, and Indonesia were modestly higher, while New Zealand, South Korea, and Taiwan edged lower. Wall Street ended Friday higher for the fifth straight session, and European markets also advanced. Crude oil inched up to $58.83 per barrel.
Upcoming Events:
- 03:00 PM GMT – USD ISM Manufacturing PMI
The post Monday 1st December 2025: Asian Markets Mixed Amid Rate-Cut Optimism and Tech Valuation Concerns first appeared on IC Markets | Official Blog.
Monday 1st December 2025: Technical Outlook and Review
424064 December 2, 2025 14:14 ICMarkets Market News
DXY (U.S. Dollar Index):
Potential Direction: Bullish
Overall momentum of the chart: Bearish
The price could make a short-term pullback toward the pivot before rising again toward the 1st resistance
Pivot: 99.41
Supporting reasons: Identified as an overlap support, where renewed buying pressure could emerge to push the price higher.
1st support: 96.64
Supporting reasons: Identified as a swing low support, indicating a potential area where the price could again stabilize.
1st resistance: 101.83
Supporting reasons: Identified as an overlap resistance that aligns closely with the 38.2% Fibonacci retracement and the 100% Fibonacci projection, indicating a potential area that could halt any further upward movement

EUR/USD:
Potential Direction: Bearish
Overall momentum of the chart: Bullish
The price has already reacted off the pivot and may continue its bearish move toward the 1st support. Additionally, the price has broken below the Ichimoku cloud, giving a bearish signal that indicates the prevailing short-to-medium-term trend is down
Pivot: 1.1654
Supporting reasons: Identified as an overlap resistance, where selling pressures could intensify and potentially cap any upward retracement
1st support: 1.1403
Supporting reasons: Identified as a swing low support, indicating a potential level where the price could stabilize once again.
1st resistance: 1.1807
Supporting reasons: Identified as a swing high resistance, indicating a potential level that could cap further upward movement.
EUR/JPY:
Potential Direction: Bullish
Overall momentum of the chart: Bullish
The price could make a short-term pullback toward the pivot before rising again toward the 1st resistance. Also, the price is moving within a bullish channel
Pivot: 166.55
Supporting reasons: Identified as a pullback support, where renewed buying pressure could emerge to push the price higher.
1st support: 173.94
Supporting reasons: Identified as a pullback support, indicating a potential area where the price could again stabilize.
1st resistance: 182.48
Supporting reasons: Identified as a resistance that is supported by the 100% Fibonacci projection, indicating a potential level that could cap further upward movement.

EUR/GBP:
Potential Direction: Bullish
Overall momentum of the chart: Bullish
The price could make a short-term pullback toward the pivot before rising again toward the 1st resistance. Also, the price is moving within a bullish channel
Pivot: 0.8744
Supporting reasons: Identified as a pullback support, where renewed buying pressure could emerge to push the price higher.
1st support: 0.8607
Supporting reasons: Identified as an overlap support, indicating a potential area where the price could stabilize once more.
1st resistance: 0.8867
Supporting reasons: Identified as a swing high resistance, indicating a potential level that could cap further upward movement.
GBP/USD:
Potential Direction: Bearish
Overall momentum of the chart: Bullish
The price could see a short-term pullback toward the pivot before continuing its bearish move down toward the 1st support. Additionally, the price has broken below the Ichimoku cloud, giving a bearish signal that indicates the prevailing short-to-medium-term trend is down
Pivot: 1.3290
Supporting reasons: Identified as a pullback resistance, where selling pressures could intensify and potentially cap any upward retracement.
1st support: 1.3002
Supporting reasons: Identified as a pullback support that aligns with the 100% Fibonacci projection, indicating a potential area where the price could stabilize once more.
1st resistance: 1.3459
Supporting reasons: Identified as an overlap resistance, indicating a potential level that could halt further upward movement.
GBP/JPY:
Potential Direction: Bullish
Overall momentum of the chart: Bullish
The price has already bounced off the pivot and may continue its bullish move toward the 1st resistance
Pivot: 204,58
Supporting reasons: Identified as an overlap support, where renewed buying pressure could emerge to push the price higher.
1st support: 200.61
Supporting reasons: Identified as an overlap support, indicating a potential level where the price could stabilize once more.
1st resistance: 209.14
Supporting reasons: Identified as a resistance that aligns with the 161.8% Fibonacci extension, indicating a potential level that could halt further upward movement.
USD/CHF:
Potential Direction: Bullish
Overall momentum of the chart: Bearish
The price has already bounced off the pivot and may continue its bullish move toward the 1st resistance
Pivot: 0.7875
Supporting reasons: Identified as an overlap support, where renewed buying pressure could emerge to push the price higher.
1st support: 0.7720
Supporting reasons: Identified as a support that is supported by the 161.8% Fibonacci extension, indicating a potential level where the price could stabilize once again.
1st resistance: 0.8164
Supporting reasons: Identified as an overlap resistance, indicating a potential level that could cap further upward movement.
USD/JPY:
Potential Direction: Bullish
Overall momentum of the chart: Bullish
The price could make a short-term pullback toward the pivot before rising again toward the 1st resistance
Pivot: 154.41
Supporting reasons: Identified as a pullback support, where renewed buying pressure could emerge to push the price higher.
1st support: 151.03
Supporting reasons: Identified as a pullback support, indicating a strong area where buyers might return, and the price could stabilize once again.
1st resistance: 158.33
Supporting reasons: Identified as an overlap resistance. This level represents the next key area where upward movement could be capped amid increased selling pressure

USD/CAD:
Potential Direction: Bullish
Overall momentum of the chart: Bearish
The price could make a short-term pullback toward the pivot before rising again toward the 1st resistance
Pivot: 1.3916
Supporting reasons: Identified as an overlap support, where renewed buying pressure could emerge to push the price higher.
1st support: 1.3761
Supporting reasons: Identified as an overlap support, indicating a key level where the price could stabilize once more.
1st resistance: 1.4264
Supporting reasons: Identified as a pullback resistance that aligns with the 161.8% Fibonacci extension, making it a possible target for bullish advances and a level where some sellers could return to cap gains
AUD/USD:
Potential Direction: Bullish
Overall momentum of the chart: Bullish
The price could make a short-term pullback toward the pivot before rising again toward the 1st resistance
Pivot: 0.6474
Supporting reasons: Identified as a pullback support, where renewed buying pressure could emerge to push the price higher.
1st support: 0.6328
Supporting reasons: Identified as a pullback support, this area has provided strong support historically and may attract buying interest for a potential short-term bounce
1st resistance: 0.6681
Supporting reasons: Identified as a swing high resistance, indicating a potential area that could halt any further upward movement.
NZD/USD
Potential Direction: Bullish
Overall momentum of the chart: Bearish
The price could make a short-term pullback toward the pivot before rising again toward the 1st resistance
Pivot: 0.5682
Supporting reasons: Identified as a pullback support, where renewed buying pressure could emerge to push the price higher.
1st support: 0.5584
Supporting reasons: Identified as a swing low support, this area has provided strong support historically and may attract buying interest for a potential short-term bounce
1st resistance: 0.5838
Supporting reasons: Identified as an overlap resistance, indicating a potential area that could halt any further upward movement.
US30 (DJIA):
Potential Direction: Bullish
Overall momentum of the chart: Bullish
The price could make a short-term pullback toward the pivot before rising again toward the 1st resistance
Pivot: 46,841.88
Supporting reasons: Identified as a pullback support, where renewed buying pressure could emerge to push the price higher.
1st support: 45,063.30
Supporting reasons: Identified as a pullback support, suggesting a potential area where the price could stabilize once again.
1st resistance: 48,377.15
Supporting reasons: Identified as a swing high resistance, indicating a potential area that could halt any further upward movement.
DE40 (DAX):
Potential Direction: Bullish
Overall momentum of the chart: Bullish
The price could make a short-term pullback toward the pivot before rising again toward the 1st resistance
Pivot: 23,352.00
Supporting reasons: Identified as a pullback support, where renewed buying pressure could emerge to push the price higher.
1st support: 22,437.89
Supporting reasons: Identified as a pullback support, indicating a key level where the price could stabilize once more.
1st resistance: 24,635.40
Supporting reasons: Identified as a multi-swing high resistance, indicating a potential area that could halt any further upward movement.
US500 (S&P 500):
Potential Direction: Bullish
Overall momentum of the chart: Bullish
The price could make a short-term pullback toward the pivot before rising again toward the 1st resistance
Pivot: 6,505.98
Supporting reasons: Identified as an overlap support, where renewed buying pressure could emerge to push the price higher.
1st support: 6,141.15
Supporting reasons: Identified as a pullback support that aligns with the 38.2% Fibonacci retracement, indicating a potential level where the price could stabilize once again.
1st resistance: 6,900.95
Supporting reasons: Identified as a swing high resistance, indicating a potential area that could halt any further upward movement.
BTC/USD (Bitcoin):
Potential Direction: Bearish
Overall momentum of the chart: Bullish
The price could see a short-term pullback toward the pivot before continuing its bearish move down toward the 1st support.
Pivot: 94,255.27
Supporting reasons: Identified as a pullback resistance that aligns with the 50% Fibonacci retracement, where selling pressures could intensify and potentially cap any upward retracement.
1st support: 80,712.26
Supporting reasons: Identified as an overlap support, indicating a potential level where the price could stabilize once more.
1st resistance: 106,846.29
Supporting reasons: Identified as an overlap resistance, indicating a potential area that could halt any further upward movement.
ETH/USD (Ethereum):
Potential Direction: Bearish
Overall momentum of the chart: Bullish
The price could see a short-term pullback toward the pivot before continuing its bearish move down toward the 1st support.
Pivot: 3,203.88
Supporting reasons: Identified as a pullback resistance that aligns closely with the 61.8% Fibonacci retracement, where selling pressures could intensify and potentially cap any upward retracement.
1st support: 2,725.92
Supporting reasons: Identified as an overlap support, indicating a potential level where the price could stabilize once more.
1st resistance: 3,681.97
Supporting reasons: Identified as an overlap resistance, indicating a potential area that could halt any further upward movement.

WTI/USD (Oil):
Potential Direction: Bullish
Overall momentum of the chart: Bullish
The price could make a short-term pullback toward the pivot before rising again toward the 1st resistance
Pivot: 62.24
Supporting reasons: Identified as an overlap support that aligns with the 61.8% Fibonacci retracement, where renewed buying pressure could emerge to push the price higher.
1st support: 56.51
Supporting reasons: Identified as a swing low support, indicating a key level where the price could stabilize once more.
1st resistance: 65.75
Supporting reasons: Identified as an overlap resistance that aligns with the 61.8% Fibonacci retracement, indicating a potential area that could halt any further upward movement.

XAU/USD (GOLD):
Potential Direction: Bearish
Overall momentum of the chart: Bullish
The price has already reacted off the pivot and may continue its bearish move toward the 1st support
Pivot: 4,220.43
Supporting reasons: Identified as an overlap resistance that aligns closely with the 78.6% Fibonacci retracement, where selling pressures could intensify and potentially cap any upward retracement.
1st support: 4,026.26
Supporting reasons: Identified as an overlap support, indicating a key level where the price could stabilize once more.
1st resistance: 4,379.38
Supporting reasons: Identified as a swing resistance, indicating a potential area that could halt any further upward movement.
The accuracy, completeness and timeliness of the information contained on this site cannot be guaranteed. IC Markets Global does not warranty, guarantee or make any representations, or assume any liability regarding financial results based on the use of the information in the site.
News, views, opinions, recommendations and other information obtained from sources outside of www.icmarkets.com, used in this site are believed to be reliable, but we cannot guarantee their accuracy or completeness. All such information is subject to change at any time without notice. IC Markets Global assumes no responsibility for the content of any linked site.
The fact that such links may exist does not indicate approval or endorsement of any material contained on any linked site. IC Markets Global is not liable for any harm caused by the transmission, through accessing the services or information on this site, of a computer virus, or other computer code or programming device that might be used to access, delete, damage, disable, disrupt or otherwise impede in any manner, the operation of the site or of any user’s software, hardware, data or property.
The post Monday 1st December 2025: Technical Outlook and Review first appeared on IC Markets | Official Blog.
Ex-Dividend 1/12/2025
424009 November 28, 2025 17:00 ICMarkets Market News
The post Ex-Dividend 1/12/2025 first appeared on IC Markets | Official Blog.
General Market Analysis – 28/11/25
424008 November 28, 2025 17:00 ICMarkets Market News
Quiet Day for Markets on US Holiday
Global sentiment stayed upbeat overnight, with major equity markets edging higher in what proved to be another subdued session due to the US Thanksgiving holiday. Trading activity across asset classes remained light, and most instruments stayed locked within recent ranges as investors used the quieter backdrop to reassess the latest run of data and geopolitical developments. Currency markets were restrained, with the majors all trading in tight ranges, the DXY ultimately slipping just 0.03% on the day to close at 99.55. Commodities saw a touch more movement in thinning liquidity. Brent rose 0.33% to $63.34, while WTI gained 0.77%, settling at $59.10 a barrel, supported by ongoing concerns surrounding the Russia–Ukraine conflict. Gold eased slightly, slipping 0.10% to 4,156.93 dollars, though it continued to hold just under key resistance levels.
Yen Remains in Focus for FX Traders
The Yen remains in focus for FX market participants into the end of this week, with some key data due out of Japan and the threat of intervention still sitting at the forefront of traders’ minds. Tokyo Core CPI data is expected to print at +2.7% year-on-year, and anything significantly off that will see big moves in the currency; however, the potential for intervention, with the Yen still trading at low levels against the dollar and on the crosses, remains high. USDJPY is about 1.5% off its recent highs, but it is widely known in the market that Japanese authorities are uncomfortable with it above 155.00, and thinner liquidity conditions into the weekend could provide the perfect environment to knock the pair back under that level. Support on the daily chart comes in around 155.50 at the moment, and a break under this – with a bit of help from the MOF – could see the pair much lower in short order.
Markets to Pick Up into the Weekend
Traders are expecting global markets to pick up again today after yesterday’s Thanksgiving Day breather, with key data due out across all three trading sessions and US markets returning later on. The Asian session will see an early focus on Japan with the key Tokyo Core CPI data (exp. 2.7% y/y) due out; Yen traders are expecting plenty of volatility around the event. The London session will see German inflation data in focus, with numbers coming through the course of the day as each state reports individually, the average expected to show the CPI decreasing by 0.2% month-on-month. The New York open will see the return of US markets, although the initial focus will be north of the border for key Canadian GDP (exp. +0.2% m/m); however, liquidity is still expected to remain thin later on, with many US trading desks operating with skeleton staffing heading into the long weekend.
The post General Market Analysis – 28/11/25 first appeared on IC Markets | Official Blog.
IC Markets Global – Europe Fundamental Forecast | 28 November 2025
424007 November 28, 2025 16:39 ICMarkets Market News
IC Markets Global – Europe Fundamental Forecast | 28 November 2025
What happened in the Asia session?
Japan’s Tokyo CPI data reinforced BOJ tightening talks without major surprises, New Zealand’s confidence jump indicated recovery momentum post-RBNZ moves, and China’s profits highlighted manufacturing resilience amid upgrades. Markets broadly recovered on global rate cut optimism, with limited volatility from lighter data ahead of US Thanksgiving liquidity thinness. Overall, positive sentiment dominated, lifting regional equities and select currencies while commodities like gold benefited from dollar softening.
What does it mean for the Europe & US sessions?
Traders should focus on Eurozone sentiment and money supply data releases today, as they provide fresh insights on regional economic momentum. The U.S. market is quiet due to the holiday, but attention remains on strong labor market signals and Fed rate cut expectations. European equities are starting on a cautiously optimistic note amid mixed macroeconomic signals and ongoing trade-related uncertainties.
The Dollar Index (DXY)
Key news events today
No major news event
What can we expect from DXY today?
The US Dollar Index (DXY) hovered around 99.5-99.6 on November 27, 2025, marking a slight decline of about 0.01-0.04% from the prior session amid thin holiday trading volumes due to Thanksgiving. Expectations for a Federal Reserve 25 basis point rate cut in December surged to roughly 85%, up sharply from 30% a week earlier, pressuring the dollar lower.
Central Bank Notes:
- The Federal Open Market Committee (FOMC) voted, by majority, to lower the federal funds rate target range by 25 basis points to 3.75% — 4.00% at its October 28–29, 2025, meeting, marking the second consecutive cut following the 25 basis points reduction in September.
- The Committee maintained its long-term objectives of maximum employment and 2% inflation, noting that the labor market continues to soften, with modest job creation and an unemployment rate edging higher. In comparison, inflation remains above target at around 3.0%.
- Policymakers highlighted ongoing downside risks to economic growth, tempered by signs of resilient economic activity. September’s consumer price index (CPI) came in slightly lower than expected at 3.0% year-over-year, easing inflation pressure but still warranting vigilance given tariff-driven price effects.
- Economic activity expanded modestly in the third quarter, with GDP growth estimates around 1.0% annualized; however, uncertainty remains elevated amid persistent global trade tensions and the U.S. government shutdown, which is impacting data availability.
- The updated Summary of Economic Projections anticipates an unemployment rate averaging approximately 4.5% for 2025, with headline and core personal consumption expenditures (PCE) inflation projections remaining near 3.0%, indicating a slow easing path ahead.
- The Committee emphasized its flexible, data-dependent approach and underscored that future policy adjustments will be guided by incoming labor market and inflation data. As in prior meetings, there was dissent, including one member advocating a more aggressive 50-basis-point cut.
- The FOMC announced the planned conclusion of its balance sheet reduction (quantitative tightening) program, intending to cease runoff in the near term to maintain market stability. Treasury redemption caps will remain steady at $5 billion per month, and agency mortgage-backed securities caps will remain at $35 billion.
- The next meeting is scheduled for 9 to 10 December 2025.
Next 24 Hours Bias
Medium bearish
Gold (XAU)
Key news events today
No major news event
What can we expect from Gold today?
Gold prices pulled back slightly with spot gold hovering just above $4,157 per ounce for 24-carat purity as of early IST trading, down nearly 0.15% from the prior close amid profit-booking after recent surges. December gold futures on India’s MCX closed the previous day at Rs 125,507 per 10 grams, reflecting a 0.21% dip, while US gold futures settled around $4,190.90, down $11.40. Physical gold in India stood at Rs 126,057 per 10 grams of 999 purity on November 27, also marginally lower.
Next 24 Hours Bias
Medium Bullish
The Euro (EUR)
Key news events today
German Prelim CPI m/m (All Day)
What can we expect from EUR today?
The Euro showed modest gains versus the USD near 1.16, driven by US data weakness and holiday-thinned liquidity, but faces resistance amid neutral technicals and steady ECB policy. The EUR/USD pair traded around 1.1600, marking a slight 0.03% increase from the prior session amid thin holiday trading volumes. It hovered near its strongest level since mid-November, supported by weaker US data boosting expectations for Federal Reserve rate cuts. Over the past month, the pair weakened by about 0.63%, though it remains up 9.69% year-over-year, with recent 30-day highs near 1.1657 and lows at 1.1485.
Central Bank Notes:
- The Governing Council of the ECB kept the three key interest rates unchanged at its 30 October 2025 meeting. The main refinancing rate remains at 2.15%, the marginal lending facility at 2.40%, and the deposit facility at 2.00%. This decision reflects policymakers’ assessment that the current monetary stance remains consistent with medium-term price stability, while incoming data confirm a gradual return of inflation towards the target.
- Recent indicators point to stable price dynamics. Headline inflation remains near the 2% mark, with energy prices contained and food inflation easing slightly after earlier supply bottlenecks. Wage growth continues to moderate, contributing to the slowdown in domestic cost pressures. The ECB reiterated its commitment to a data-driven, meeting-by-meeting approach and emphasized flexibility amid uncertain global financial conditions.
- Eurosystem staff projections have not been materially altered since September. Headline inflation averages remain at 2.0% for 2025, 1.8% for 2026, and 2.0% for 2027. Recent softening in producer prices and subdued pipeline pressures suggest limited upside risks to inflation, though geopolitical tensions and potential commodity shocks continue to pose uncertainties to the outlook.
- Euro area GDP growth remains on track with earlier forecasts, projected at 1.1% for 2025, 1.1% for 2026, and 1.4% for 2027. Forward-looking indicators, including PMIs and industrial sentiment surveys, signal some stabilization in activity following weakness in the third quarter. Public investment and recovering export activity are expected to offset softer private sector demand in the near term.
- The labor market remains resilient, with unemployment rates at multi-decade lows and participation rates strong. Real income growth continues to support household spending, even as consumption growth normalizes from earlier highs. Financing conditions remain favorable, supported by stable banking-sector liquidity and improved credit demand among small and medium-sized firms.
- Business sentiment remains mixed, reflecting lingering uncertainty over global trade policy and the path of US tariffs. However, easing supply chain costs and improved export competitiveness due to softer exchange rates are providing some relief to manufacturing and external-oriented sectors.
- The Governing Council reaffirmed that future decisions will depend on an integrated assessment of incoming data—covering inflation trends, financial conditions, and the state of policy transmission. The Council emphasized that no pre-set path for rates exists; keeping all options open should the economic outlook shift markedly.
- Balance sheet reduction continues smoothly, with holdings under the APP and PEPP declining as reinvestments have ceased. The ECB confirmed that the pace of portfolio runoff remains in line with its previously communicated normalization plan, supporting a gradual withdrawal of monetary accommodation in a predictable manner.
- The next meeting is on 17 to 18 December 2025
Next 24 Hours Bias
Medium Bearish
The Swiss Franc (CHF)
Key news events today
No major news event
What can we expect from CHF today?
The Swiss Franc is supported by a resolution of a key trade dispute, expected inflation dynamics, and cautious investor sentiment amid global economic developments, balancing out safe-haven flows and risk appetite shifts. This combination sustains the franc near its highest levels in over a decade, while recent minor momentum loss suggests some short-term volatility.
Central Bank Notes:
- The SNB maintained its key policy rate at 0% during its meeting on 25 September 2025, pausing a sequence of six consecutive rate cuts as inflation stabilized and the Swiss franc remained firm.
- Recent data showed a modest rebound in inflation, with Swiss consumer prices rising 0.2% year-on-year in August after staying above zero for three consecutive months; this helped alleviate fears of deflation that were mounting earlier in the year.
- The conditional inflation forecast remains broadly unchanged from June: headline inflation is expected to average 0.2% in 2025, 0.5% in 2026, and 0.7% in 2027. The risk of a negative rate move has diminished for now, but the SNB retains flexibility should inflationary pressures weaken again.
- The global economic outlook has deteriorated further, weighed down by heightened trade tensions—especially with the U.S.—and ongoing uncertainty in key Swiss export markets.
- Swiss GDP growth moderated in Q2 after a strong Q1 boosted by front-loaded U.S. exports. The SNB expects growth to slow and remain subdued, with forecasted GDP expansion between 1% and 1.5% in both 2025 and 2026.
- Labor market sentiment in the Swiss industrial sector has softened on concerns over export competitiveness and potential adjustments to production, but the overall growth outlook stays broadly unchanged
- The SNB reiterated its readiness to respond as needed if deflation risks re-emerge, emphasizing its commitment to medium-term price stability and a robust, transparent communication policy, with the introduction of more detailed monetary policy minutes beginning in October.
- The next meeting is on 11 December 2025.
Next 24 Hours Bias
medium Bearish
The Pound (GBP)
Key news events today
No major news event
What can we expect from GBP today?
Sterling snapped a five-day rally on November 27, falling 0.15% to $1.3219 after hitting $1.3269 earlier, as investors shifted focus to economic fundamentals and skepticism over fiscal tightening from Chancellor Rachel Reeves’ budget. The prior day’s volatility stemmed from an accidental early release of Office for Budget Responsibility (OBR) forecasts, revealing a £22 billion fiscal buffer but lower growth projections, initially pressuring the Pound before a rebound. Over the past month, GBP weakened 0.26% but remains up 4.33% year-over-year.
Central Bank Notes:
- The Bank of England’s Monetary Policy Committee (MPC) met on 6 November 2025 and voted by a majority of 7–2 to keep the Bank Rate unchanged at 4.00 percent for a second consecutive meeting. The decision reflects the Committee’s cautious approach as inflation remains above target, but underlying economic momentum continues to weaken. Two members maintained their votes for a 25-basis-point cut, citing further signs of labor-market softening and weak business sentiment.
- The BOE adjusted its guidance on quantitative tightening (QT), maintaining the reduced pace established in September. The planned reduction of UK government bond holdings remains at £67.5 billion over the next 12 months, leaving the current gilt balance near £550 billion. Policymakers described the recalibrated QT path as “appropriate for current market conditions,” emphasizing the importance of liquidity management amid heightened volatility.
- Headline inflation moderated slightly to 3.6 percent in October from 3.8 percent previously, driven by easing food and transport prices. However, core inflation has shown only gradual progress, holding near 3.9 percent. The MPC noted that services inflation and administered energy costs continue to exert pressure, highlighting the challenge of achieving the 2 percent target sustainably. The Committee’s latest projections see inflation falling toward 3 percent by mid-2026, with further downside expected if energy and wage dynamics continue to normalize.
- Economic activity remains subdued. Estimates place Q3 GDP growth close to zero, with both business output and consumer spending restrained. The unemployment rate has edged up to 4.8 percent, while pay growth cooled to just under 5 percent year-on-year. MPC members acknowledged that pay settlements are weakening further, signaling an easing in labor cost pressures as demand softens. Surveys from the manufacturing and services sectors suggest muted hiring intentions through year-end.
- International factors continue to complicate the policy outlook. Fluctuating oil prices—partly linked to renewed Middle East tensions—alongside fragile global demand have contributed to higher market volatility. The MPC reiterated that external shocks, including global food and energy disruptions, could temporarily slow the disinflation path but remain unlikely to derail the medium-term moderation in prices.
- The Committee assessed risks around inflation as balanced. Downside risks arise from sluggish domestic growth and declining real income momentum, while upside risks remain tied to elevated inflation expectations and stubborn services inflation. Policymakers emphasized the need for patience, maintaining that any rate cuts ahead of clear inflation progress could undermine confidence in policy credibility.
- The MPC’s overall stance remains restrictive but increasingly balanced, with future moves expected to follow a cautious, data-driven trajectory. The Committee reaffirmed that monetary policy will stay tight until there is compelling evidence that inflation is returning to the 2 percent target on a durable basis.
- The next meeting is on 18 December 2025.
Next 24 Hours Bias
Medium Bullish
The Canadian Dollar (CAD)
Key news events today
GDP m/m (1:30 pm GMT)
What can we expect from CAD today?
The Canadian Dollar is currently benefiting from a softer US dollar environment due to Fed rate cut expectations, while facing internal economic challenges that have limited its strength. The pair is expected to hover around 1.40–1.41 in the near term with cautious market sentiment. This suggests a delicate balancing act between external support from US policy easing and domestic economic fundamentals shaping the Canadian Dollar’s trajectory.
Central Bank Notes:
- The Council noted that U.S. tariff tensions have eased slightly following early progress in bilateral discussions, though the external trade environment remains fragile. Businesses continue to hold back on long-term investment, with the Bank highlighting that sustained clarity on U.S. trade policy is needed to restore confidence.
- The Bank acknowledged that uncertainty persists despite the softer U.S. tone, as incoming data show limited improvement in export orders. The manufacturing sector has stabilized but remains below pre-2024 output levels, reflecting weak global demand and cautious corporate spending.
- Canada’s economy showed tentative signs of recovery in early Q4, with GDP estimated to expand by 0.3% in October after two quarters of contraction. Mining and energy activity strengthened modestly, aided by steady crude demand, while goods exports posted a fractional gain.
- Service sector growth remained uneven, supported mainly by tourism-related and technology services. However, retail spending and household consumption were subdued, constrained by slower job creation and lingering consumer caution. The Bank judged overall momentum as fragile but improving marginally.
- Housing activity showed modest reacceleration in major urban markets as mortgage rates stabilized near record lows. Nonetheless, affordability pressures and stricter lending standards continue to limit overall resale volumes, resulting in only a gradual recovery in the housing sector.
- Headline CPI inflation rose to 2.1% in October, reaching the Bank’s target for the first time in six months. Higher energy prices and a modest uptick in food and shelter costs drove the increase. Core inflation measures remained stable, suggesting underlying price pressures are contained.
- The Governing Council reiterated its data-dependent stance, indicating that the current policy rate remains appropriate amid tentative growth and balanced inflation risks. Officials noted that while additional stimulus is not ruled out, the emphasis has shifted toward monitoring the sustainability of the recovery rather than immediate rate adjustments.
- The next meeting is on 17 to 18 December 2025.
Next 24 Hours Bias
Weak Bearish
Oil
Key news events today
No major news event
What can we expect from Oil today?
Crude has declined about 3% over the past week and is on track for a fourth straight monthly drop, the longest streak since Q1 2023, driven by production outpacing demand. Recent sessions saw WTI dip to one-month lows around $58 before stabilizing slightly into the Thanksgiving holiday period. Oil faces a bearish near-term outlook from surplus risks and geopolitical de-escalation, though OPEC+ decisions and any supply disruptions could provide support.
Next 24 Hours Bias
Medium Bullish
The post IC Markets Global – Europe Fundamental Forecast | 28 November 2025 first appeared on IC Markets | Official Blog.