Articles
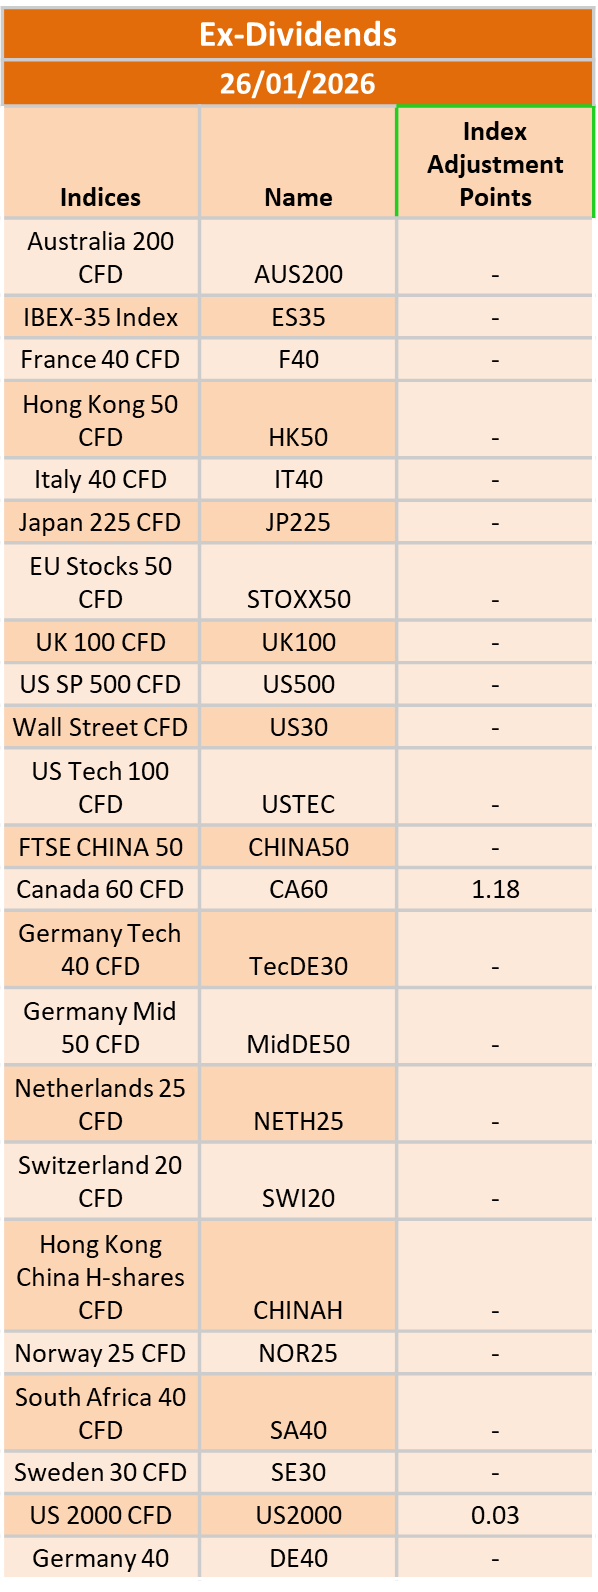
Ex-Dividend 26/01/2026
January 23, 2026 17:14 ICMarkets Market News
The post Ex-Dividend 26/01/2026 first appeared on IC Markets | Official Blog.
UK January flash services PMI 54.3 vs 51.7 expected
January 23, 2026 16:39 Forexlive Latest News Market News
- Prior 51.4
- Manufacturing PMI 51.6 vs 50.6 expected
- Prior 50.6
- Composite PMI 53.9 vs 51.5 expected
- Prior 51.4
- Full report here
Key Findings:
- Strongest upturn in UK private sector business activity since April 2024
Comment:
Chris Williamson, Chief Business Economist at S&P
Global Market Intelligence:
“UK businesses kicked up a gear in January, showing
encouraging resilience in the face of recent geopolitical
tensions. Companies are reporting higher demand, both
from home and export markets, which has driven output
growth to the fastest since April 2024. Firms are also
reporting the greatest optimism about the business
outlook since before the 2024 Autumn Budget.
“The January flash PMI is up to a level indicative of a
robust quarterly GDP growth approaching 0.4%.
While growth continues to be driven by the service
sector, and in particular financial services and tech,
the manufacturing sector is also continuing to report
a gathering recovery aided by resurgent demand, with
goods exports notably rising for the first time in four
years.
“The good news was tempered, however, by the upturn
in order books failing to stem a steep loss of jobs, which
companies commonly blamed on the need to reduce high
costs. These cost pressures were again often linked to
government policies relating to higher National Insurance
contributions and the National Minimum Wage, and led to
an especially steep drop in hospitality jobs.
“High staffing costs were meanwhile again widely
reported as a key cause of higher selling prices, hinting at
an intensification of price pressures at a level above the
Bank of England target.”
This article was written by Giuseppe Dellamotta at investinglive.com.
Eurozone January flash services PMI 51.9 vs 52.6 expected
January 23, 2026 16:15 Forexlive Latest News Market News
- Prior 52.4
- Manufacturing PMI 49.4 vs 49.1 expected
- Prior 48.8
- Composite PMI 51.5 vs 51.8 expected
- Prior 51.5
The end of last year was filled with optimism on the recovery but the start of the year dealt a bit of a reality check. The contrast between France and Germany again is for all to see. The former is facing a stuttering month in terms of business activity while the latter is seen more resilient still. That said, firms reduced their staffing levels for the first time in four months amid marked job cuts in Germany. So, there’s that.
On the inflation front, both input costs and output prices were seen growing faster than in December. So, there are still some things to be mindful about at the balance.
HCOB notes that:
“The recovery still looks rather feeble. In manufacturing, the headline PMI continues to signal weakness, while growth in
services activity is somewhat more moderate than the month before. Overall economic growth remains unchanged. Looking
ahead, the low growth in new orders is certainly no game changer. Instead, the start into the new year points to more of the
same in the months to come.
For the ECB, these results are anything but reassuring. Inflation in the services sector, which the central bank is watching
particularly closely, has increased significantly in terms of sales prices. Input cost inflation remains an issue as well, though it
has accelerated less than sales price inflation. As a result, ECB members are likely to feel validated in holding rates where
they are. Some of the more hawkish members may even argue that the next move should be up rather than down.
Comparing countries, services activity in Germany expanded in January at a fairly robust pace, while in France service
companies slipped into contractionary territory. This may be linked to the political difficulties in finalising the 2026 budget. In
manufacturing, France shows a slightly better performance than Germany, but in both countries output growth is nothing to
write home about. Overall, Germany’s economy started the new year on a growth path, while monthly output in France has
declined.
While the unemployment rate has been roughly stable over the past year, weakening employment figures in services and
ongoing staff cuts in manufacturing point toward a somewhat higher unemployment rate in the coming months. This
suggests that the current weak growth trajectory may not be enough to keep employment steady, especially as companies
continue striving to become leaner, for example by deploying artificial intelligence solutions.”
This article was written by Justin Low at investinglive.com.
Friday 23rd January 2026: Technical Outlook and Review
January 23, 2026 16:14 ICMarkets Market News
DXY (U.S. Dollar Index):
Potential Direction: Bearish
Overall momentum of the chart: Bearish
The price could see a short-term pullback toward the pivot before continuing its bearish move down toward the 1st support.
Pivot: 98.44
Supporting reasons: Identified as a pullback resistance, where selling pressures could intensify and potentially cap any upward retracement.
1st support: 98.10
Supporting reasons: Identified as a pullback support that aligns with the 127.2% Fibonacci extension and the 61.8% Fibonacci projection, indicating a potential area where the price could again stabilize.
1st resistance: 98.85
Supporting reasons: Identified as an overlap resistance, indicating a potential area that could halt any further upward movement
EUR/USD:
Potential Direction: Bullish
Overall momentum of the chart: Bullish
The price could see a short-term pullback toward the pivot before continuing its bullish move toward the 1st resistance
Pivot: 1.1691
Supporting reasons: Identified as an overlap support that aligns with the 38.2% Fibonacci retracement, where renewed buying pressure could emerge to push the price higher.
1st support: 1.1650
Supporting reasons: Identified as a pullback support that aligns with the 61.8% Fibonacci retracement, indicating a potential level where the price could stabilize once again.
1st resistance: 1.1804
Supporting reasons: Identified as a swing high resistance, indicating a potential level that could cap further upward movement.
EUR/JPY:
Potential Direction: Bullish
Overall momentum of the chart: Bullish
The price could see a short-term pullback toward the pivot before continuing its bullish move toward the 1st resistance
Pivot: 185.53
Supporting reasons: Identified as a pullback support, where renewed buying pressure could emerge to push the price higher.
1st support: 182.54
Supporting reasons: Identified as swing low support, indicating a potential area where the price could again stabilize.
1st resistance: 186.35
Supporting reasons: Identified as a resistance that is supported by the 127.2% Fibonacci extension, indicating a potential level that could cap further upward movement.
EUR/GBP:
Potential Direction: Bullish
Overall momentum of the chart: Bullish
The price could see a short-term pullback toward the pivot before rising again toward the 1st resistance.
Pivot: 0.8690
Supporting reasons: Identified as a pullback support that aligns with the 61.8% Fibonacci retracement, where renewed buying pressure could emerge to push the price higher.
1st support: 0.8651
Supporting reasons: Identified as a multi-swing low support, indicating a potential area where the price could stabilize once more.
1st resistance: 0.8745
Supporting reasons: Identified as an overlap resistance, indicating a potential level that could cap further upward movement.
GBP/USD:
Potential Direction: Bullish
Overall momentum of the chart: Bullish
The price could see a short-term pullback toward the pivot before rising again toward the 1st resistance.
Pivot: 1.3453
Supporting reasons: Identified as a pullback support, where renewed buying pressure could emerge to push the price higher.
1st support: 1.3390
Supporting reasons: Identified as a swing low support, indicating a potential area where the price could stabilize once more.
1st resistance: 1.3548
Supporting reasons: Identified as a swing resistance that aligns with the 161.8% Fibonacci extension, indicating a potential level that could halt further upward movement.
GBP/JPY:
Potential Direction: Bullish
Overall momentum of the chart: Bullish
The price could see a short-term pullback toward the pivot before rising again toward the 1st resistance.
Pivot: 212.65
Supporting reasons: Identified as a pullback support, where renewed buying pressure could emerge to push the price higher.
1st support: 211.59
Supporting reasons: Identified as an overlap support, indicating a potential level where the price could stabilize once more.
1st resistance: 214.29
Supporting reasons: Identified as a swing high resistance, indicating a potential level that could halt further upward movement.
USD/CHF:
Potential Direction: Bearish
Overall momentum of the chart: Bearish
The price has already reacted off the pivot and may continue its bearish move toward the 1st support.
Pivot: 0.7966
Supporting reasons: Identified as an overlap resistance, where selling pressures could intensify and potentially cap any upward retracement.
1st support: 0.7861
Supporting reasons: Identified as a swing low support, indicating a potential level where the price could stabilize once again.
1st resistance: 0.8036
Supporting reasons: Identified as a swing high resistance, indicating a potential level that could cap further upward movement.
USD/JPY:
Potential Direction: Bullish
Overall momentum of the chart: Bullish
The price has already bounced off the pivot and may continue its bullish move toward the 1st resistance
Pivot: 157.58
Supporting reasons: Identified as a pullback support that aligns with the 61.8% Fibonacci retracement, where renewed buying pressure could emerge to push the price higher.
1st support: 156.84
Supporting reasons: Identified as an overlap support, indicating a strong area where buyers might return, and the price could stabilize once again.
1st resistance: 159.31
Supporting reasons: Identified as a swing high resistance. This level represents the next key area where upward movement could be capped amid increased selling pressure
USD/CAD:
Potential Direction: Bearish
Overall momentum of the chart: Bearish
The price has already reacted off the pivot and may continue its bearish move toward the 1st support.
Pivot: 1.3838
Supporting reasons: Identified as an overlap resistance, where selling pressures could intensify and potentially cap any upward retracement.
1st support: 1.3747
Supporting reasons: Identified as a pullback support that aligns with the 61.8% Fibonacci retracement, indicating a key level where the price could stabilize once more.
1st resistance: 1.3923
Supporting reasons: Identified as a swing high resistance, making it a possible target for bullish advances and a level where some sellers could return to cap gains
AUD/USD:
Potential Direction: Bullish
Overall momentum of the chart: Bullish
The price could see a short-term pullback toward the pivot before rising again toward the 1st resistance.
Pivot: 0.6766
Supporting reasons: Identified as a pullback support, where renewed buying pressure could emerge to push the price higher.
1st support: 0.6616
Supporting reasons: Identified as a pullback support, this area has provided strong support historically and may attract buying interest for a potential short-term bounce
1st resistance: 0.6882
Supporting reasons: Identified as a swing high resistance, indicating a potential area that could halt any further upward movement.
NZD/USD
Potential Direction: Bullish
Overall momentum of the chart: Bullish
The price could see a short-term pullback toward the pivot before rising again toward the 1st resistance.
Pivot: 0.5853
Supporting reasons: Identified as a pullback support that aligns with the 50% Fibonacci retracement, where renewed buying pressure could emerge to push the price higher.
1st support: 0.5799
Supporting reasons: Identified as a pullback support, this area has provided strong support historically and may attract buying interest for a potential short-term bounce
1st resistance: 0.5940
Supporting reasons: Identified as a resistance that is supported by the 161.8% Fibonacci extension, indicating a potential area that could halt any further upward movement.
US30 (DJIA):
Potential Direction: Bullish
Overall momentum of the chart: Bullish
The price could see a short-term pullback toward the pivot before rising again toward the 1st resistance.
Pivot: 48,844.50
Supporting reasons: Identified as a pullback support that aligns with the 61.8% Fibonacci retracement, where renewed buying pressure could emerge to push the price higher.
1st support: 48,330.52
Supporting reasons: Identified as an overlap support, suggesting a potential area where the price could stabilize once again.
1st resistance: 49,617.45
Supporting reasons: Identified as a multi-swing high resistance, indicating a potential area that could halt any further upward movement.
DE40 (DAX):
Potential Direction: Bullish
Overall momentum of the chart: Bullish
The price has already bounced off the pivot and may continue its bullish move toward the 1st resistance
Pivot: 24,455.54
Supporting reasons: Identified as a pullback support that aligns with the 61.8% Fibonacci retracement, where renewed buying pressure could emerge to push the price higher.
1st support: 23,870.49
Supporting reasons: Identified as an overlap support, indicating a key level where the price could stabilize once more.
1st resistance: 25,036.29
Supporting reasons: Identified as a pullback resistance, indicating a potential area that could halt any further upward movement.
US500 (S&P 500):
Potential Direction: Bullish
Overall momentum of the chart: Bullish
The price could see a short-term pullback toward the pivot before rising again toward the 1st resistance.
Pivot: 6,852.44
Supporting reasons: Identified as a pullback support, where renewed buying pressure could emerge to push the price higher.
1st support: 6,795.90
Supporting reasons: Identified as an overlap support, indicating a potential level where the price could stabilize once again.
1st resistance: 6,997.80
Supporting reasons: Identified as a swing high resistance, indicating a potential area that could halt any further upward movement.
BTC/USD (Bitcoin):
Potential Direction: Bearish
Overall momentum of the chart: Bearish
The price has already reacted off the pivot and may continue its bearish move toward the 1st support.
Pivot: 90.345.63
Supporting reasons: Identified as an overlap resistance, where selling pressures could intensify and potentially cap any upward retracement.
1st support: 86,783
Supporting reasons: Identified as a swing low support, indicating a potential level where the price could stabilize once more.
1st resistance: 92,360
Supporting reasons: Identified as a pullback resistance, indicating a potential area that could halt any further upward movement.
ETH/USD (Ethereum):
Potential Direction: Bearish
Overall momentum of the chart: Bullish
The price has already reacted off the pivot and may continue its bearish move toward the 1st support.
Pivot: 3,051.82
Supporting reasons: Identified as a pullback resistance, where selling pressures could intensify and potentially cap any upward retracement..
1st support: 2,868.18
Supporting reasons: Identified as a swing low support, indicating a potential level where the price could stabilize once more.
1st resistance: 3,280.43
Supporting reasons: Identified as a pullback resistance, indicating a potential area that could halt any further upward movement.
WTI/USD (Oil):
Potential Direction: Bullish
Overall momentum of the chart: Bullish
The price could see a short-term pullback toward the pivot before rising again toward the 1st resistance.
Pivot: 58.72
Supporting reasons: Identified as an overlap support that aligns with the 50% Fibonacci retracement, where renewed buying pressure could emerge to push the price higher.
1st support: 56.92
Supporting reasons: Identified as a pullback support, indicating a key level where the price could stabilize once more.
1st resistance: 60.68
Supporting reasons: Identified as an overlap resistance, indicating a potential area that could halt any further upward movement.
XAU/USD (GOLD):
Potential Direction: Bullish
Overall momentum of the chart: Bullish
The price could see a short-term pullback toward the pivot before rising again toward the 1st resistance.
Pivot: 4,863.75
Supporting reasons: Identified as a pullback support, where renewed buying pressure could emerge to push the price higher.
1st support: 4,690.83
Supporting reasons: Identified as a pullback support, indicating a key level where the price could stabilize once more.
1st resistance: 4,970
Supporting reasons: Identified as a resistance that is supported by the 161.8% Fibonacci extension, indicating a potential area that could halt any further upward movement.
The accuracy, completeness and timeliness of the information contained on this site cannot be guaranteed. IC Markets Global does not warranty, guarantee or make any representations, or assume any liability regarding financial results based on the use of the information in the site.
News, views, opinions, recommendations and other information obtained from sources outside of www.icmarkets.com, used in this site are believed to be reliable, but we cannot guarantee their accuracy or completeness. All such information is subject to change at any time without notice. IC Markets Global assumes no responsibility for the content of any linked site.
The fact that such links may exist does not indicate approval or endorsement of any material contained on any linked site. IC Markets Global is not liable for any harm caused by the transmission, through accessing the services or information on this site, of a computer virus, or other computer code or programming device that might be used to access, delete, damage, disable, disrupt or otherwise impede in any manner, the operation of the site or of any user’s software, hardware, data or property.
The post Friday 23rd January 2026: Technical Outlook and Review first appeared on IC Markets | Official Blog.
IC Markets Global – Europe Fundamental Forecast | 23 January 2026
January 23, 2026 16:00 ICMarkets Market News
IC Markets Global – Europe Fundamental Forecast | 23 January 2026
What happened in the Asia session?
Asia session trading on January 23 reflected cautious optimism, with equities and risk-sensitive currencies like AUD gaining from Trump’s Greenland framework easing tariff fears, while JPY and gold faced pressure ahead of BOJ’s rate call and softer inflation signals; US data spillover amplified moves in USD pairs and indices.
What does it mean for the Europe & US sessions?
Traders prioritise digestion of recent U.S. Q3 GDP revised higher to 4.4% annualized, the strongest since 2023, alongside the IMF’s upbeat 3.3% global growth forecast for the year, with no blockbuster data today but spillover from Japan’s CPI, Euro factory orders, and oil inventories likely driving forex and commodity moves in a resilient yet cautious market environment.
The Dollar Index (DXY)
Key news events today
Flash Manufacturing PMI (2:45 pm GMT)
Flash Services PMI (2:45 pm GMT)
Revised UoM Consumer Sentiment (3:00 pm GMT)
What can we expect from DXY today?
The dollar edged lower toward a 1% weekly drop, its worst since January 2025, after Trump’s Greenland about-face and tariff walk-back reduced safe-haven flows, with the DXY at 98.33 amid gains in the euro, pound, and Aussie dollar, though the yen weakened pre-BOJ.
Central Bank Notes:
- The Federal Open Market Committee (FOMC) is widely expected to lower the federal funds rate target range by 25 basis points to 3.50%–3.75% at its December 9–10, 2025, meeting, marking the third consecutive cut after the October reduction to 3.75%–4.00%
- The Committee continues to pursue maximum employment and 2% inflation goals, with the labour market showing further softening as the unemployment rate rose to 4.4% in September 2025 amid modest job gains.
- Officials note persistent downside risks to growth alongside resilient activity, with inflation easing to 3.0% year-over-year CPI in September but remaining elevated due to tariff effects; core PCE stands at around 2.8% as of October.
- Economic activity grew at a 3.8% annualised pace in Q2 2025, according to revised estimates. However, Q3 and Q4 are expected to face headwinds from trade tensions, fiscal restraint, and data disruptions, such as the government shutdown.
- September’s Summary of Economic Projections forecasts 2025 unemployment at a median of 4.5%, with PCE inflation near 3.0% and core PCE at 3.1%, signalling a gradual disinflation path. Updates expected on December 10 may adjust for higher unemployment and lower growth.
- The Committee maintained its data-dependent approach, noting a softening labour market and inflation above the 2% target, while deciding to lower the federal funds rate target range by 25 basis points to 3.50%-3.75%. Dissent persisted, with multiple members opposing the cut or advocating for a hold, reflecting divisions similar to recent meetings.
- The FOMC confirmed the conclusion of its quantitative tightening program effective December 1, 2025, with Treasury rolloff caps at $5 billion per month and agency MBS caps at $35 billion per month to ensure ample reserves and market stability.
- The next meeting is scheduled for 27 to 28 January 2026.
Next 24 Hours Bias
Medium Bearish
Gold (XAU)
Key news events today
Flash Manufacturing PMI (2:45 pm GMT)
Flash Services PMI (2:45 pm GMT)
Revised UoM Consumer Sentiment (3:00 pm GMT)
What can we expect from Gold today?
Gold prices hit a new all-time high, reaching $4,970 per ounce on Comex before settling around $4,954–$4,956, up about 0.8% from the prior close amid a weaker US dollar and lingering safe-haven demand. Profit-taking emerged after President Trump’s comments easing tensions over Greenland and signalling a potential US-India trade deal, which reduced some geopolitical risk premium.
Next 24 Hours Bias
Strong Bullish
The Euro (EUR)
Key news events today
French Flash Manufacturing PMI (8:15 am GMT)
French Flash Services PMI (8:15 am GMT)
German Flash Manufacturing PMI (8:30 am GMT)
German Flash Services PMI (8:30 am GMT)
ECB President Lagarde Speaks (8:30 am GMT)
What can we expect from EUR today?
Euro developments centre on improving consumer sentiment and EUR/USD trading dynamics amid global trade tensions. Consumer confidence in the euro zone rose to -12.4 in January, up 0.8 points from December’s -13.2, beating economist forecasts of -12.9. The EUR/USD pair hovered near 1.1750, supported by a softer US Dollar and easing EU-US trade frictions linked to President Trump’s remarks on tariffs and Greenland.
Central Bank Notes:
- The Governing Council of the ECB kept the three key interest rates unchanged at its 4–5 January 2026 meeting, maintaining the main refinancing rate at 2.15%, the marginal lending facility at 2.40% and the deposit facility at 2.00%. This decision aligns with the assessment that the current stance supports medium-term price stability, as inflation edges below the 2% target while growth shows resilience amid balanced risks. Markets and commentary indicate value in holding steady, with no fixed path ahead given uncertainties in data.
- Price dynamics remain stable near target levels. Headline HICP inflation stood at 2.1% in November 2025, with projections for 1.9% in 2026 driven by base effects from energy and easing non-energy components. Services inflation persists somewhat elevated but trends toward moderation, alongside contained food pressures.
- December 2025 Eurosystem staff projections confirm headline inflation at 2.1% for 2025, declining to 1.9% in 2026 and 1.8% in 2027 before nearing 2% in 2028. Downside risks from soft producer prices and anchored expectations offset potential upsides from geopolitics or fiscal measures.
- Euro area GDP growth remains resilient at subdued levels, with Q3 2025 at 0.3% qoq and forecasts around 1.2-1.4% for 2025-2027. Surveys signal stabilization, bolstered by public investment and external demand against softer private spending.
- The labour market stays tight overall, with unemployment steady at 6.4% through October 2025, near historic lows and solid participation. Real incomes support consumption as inflation eases, with credit conditions aiding gradual household and firm expansion.
- Business sentiment reflects caution over US policy, trade tensions, and tariffs, tempered by easing supply chains and a competitive euro. Export sectors gain a modest lift, while domestic drivers like investment build momentum.
- The Governing Council will continue to make data-dependent decisions meeting by meeting, assessing inflation outlook, underlying trends, and transmission. Both hikes and cuts remain possible based on data, avoiding preset paths amid uncertainties.
- Balance sheet normalisation proceeds steadily, with APP and PEPP portfolios shrinking post-reinvestment halts, at a pace deemed suitable without market strain.
The next meeting is on 4 to 5 February 2026
Next 24 Hours Bias
Medium Bullish
The Swiss Franc (CHF)
Key news events today
No major news event
What can we expect from CHF today?
The Swiss Franc holds firm as the ultimate safe-haven asset amid Trump’s tariff flare-up over Greenland, which has squeezed USD longs and erased USD/CHF’s monthly gains to around 0.7950; SNB’s unchanged 0% policy and low inflation bolster its resilience, with traders eyeing Trump’s Davos speech for de-escalation cues and upcoming US data like ADP jobs.
Central Bank Notes:
- At its 11 December 2025 monetary policy assessment, the Swiss National Bank (SNB) is widely expected to leave the policy rate unchanged at 0%, extending the pause that began in September as the Governing Board judges that current settings are sufficient to keep inflation near, but still below, its target while avoiding an unnecessary move into negative rates.
- Recent data show that the tentative rebound in Swiss inflation has stalled, with headline CPI easing from 0.1% year‑on‑year in October to 0.0% in November and core inflation slipping to about 0.4%, reinforcing the view that underlying price pressures remain very weak and that deflation risks, while contained, have not fully disappeared.
- The SNB’s conditional inflation forecast is likely to remain close to the September projections, with inflation still seen averaging roughly 0.2% in 2025, 0.5% in 2026, and 0.7% in 2027 under an unchanged policy rate path, though the latest CPI prints argue for a slightly lower near‑term profile and keep open the option of renewed easing if activity or prices weaken further.
- The global backdrop has deteriorated further, as continuing U.S. tariff actions and softer external demand weigh on world trade, while uncertainty in key European and U.S. markets for Swiss exports persists, leaving the SNB cautious about the growth outlook despite Switzerland’s relatively resilient domestic demand.
- Business and labour-market sentiment in export‑oriented manufacturing remains subdued, with firms reporting pressure on margins from the still‑strong franc and softer foreign orders, although the broader economy is still expected to grow at around 1–1.5% in 2025 and unemployment only drifting up gradually from low levels.
- The SNB continues to stress its willingness to act if deflation risks re‑emerge, reiterating that it can ease policy through renewed rate cuts or targeted foreign‑exchange intervention if necessary, while also highlighting its commitment to transparent communication, including the publication of detailed minutes from recent assessments and ongoing dialogue with international partners on FX policy
The next meeting is on 19 March 2026.
Next 24 Hours Bias
Medium Bullish
The Pound (GBP)
Key news events today
Retail Sales m/m (7:00 am GMT)
Flash Manufacturing PMI (9:30 am GMT)
Flash Services PMI (9:30 am GMT)
What can we expect from GBP today?
The British Pound (GBP) experienced mild downward pressure, trading around 1.3498 against the USD, reflecting a 0.01% daily dip amid ongoing divergence in monetary policies between the Bank of England (BoE) and the US Federal Reserve. Easing US-EU trade tensions and President Trump’s retreat from aggressive stances reduced safe-haven support for the Pound.
Central Bank Notes:
- The Bank of England’s Monetary Policy Committee (MPC) will meet on 18 December 2025, with the current Bank Rate standing at 4.00 per cent after being held in a close 5–4 vote at the 5 November meeting. Market pricing and analyst commentary point to a high risk of a 25‑basis‑point cut to 3.75 per cent, but this remains conditional on incoming inflation and labour‑market data, so the December note should be treated as pre‑decision guidance rather than an ex‑post summary.
- The BoE is expected to leave its quantitative tightening (QT) framework broadly unchanged through year‑end, maintaining the lower reduction pace in gilt holdings that was set earlier in 2025. Official communications still characterise the existing QT path as consistent with a restrictive stance, with policymakers stressing that balance‑sheet reduction will remain gradual and sensitive to market‑liquidity conditions.
- Headline CPI inflation eased to 3.6 per cent year‑on‑year in October 2025, down from 3.8 per cent in September, helped by softer energy and goods prices, though it remains almost twice the 2 per cent target. Underlying inflation pressures, particularly in services, have continued to moderate only slowly, so the MPC’s central projection still envisages inflation moving closer to, but not yet reaching, 3 per cent over the course of 2026, contingent on further normalisation in energy and wage dynamics.
- UK economic activity remains weak heading into the December meeting, with the labour market showing further signs of slackening. The unemployment rate has risen toward just above 5 per cent on the latest three‑month figures to October, while overall regular pay growth has slowed to around the mid‑4 per cent range, reinforcing the view that domestic cost pressures are gradually easing.
- External conditions continue to cloud the outlook, with fragile global growth and fluctuating commodity prices contributing to bouts of financial‑market volatility. The MPC has highlighted that renewed global energy or food price shocks could temporarily slow the pace of disinflation, but such risks are currently judged unlikely to derail the medium‑term downward trajectory for inflation if domestic demand stays subdued.
- The balance of risks around the inflation outlook remains finely poised. Downside risks are linked to persistently weak domestic demand and rising unemployment, while upside risks come from still‑elevated inflation expectations, sticky services inflation, and the possibility that structural changes in the labour market leave less slack than conventional indicators suggest.
- Overall, the MPC’s stance going into December is restrictive but increasingly open to a gradual easing cycle, with any rate cuts expected to be measured and data‑dependent. Policymakers have reiterated that the Bank Rate will need to stay in restrictive territory until they are confident inflation is on a sustainable path back to the 2 per cent target, and they have signalled that the profile of cuts, once started, is likely to be shallow rather than rapid.
- The next meeting is on 5 February 2026.
Next 24 Hours Bias
Medium Bearish
The Canadian Dollar (CAD)
Key news events today
Core Retail Sales m/m (1:30 pm GMT)
Retail Sales m/m (1:30 pm GMT)
What can we expect from CAD today?
The Canadian Dollar strengthened modestly to around 1.37835-1.3790 per USD, marking a two-week high and continuing a USD downtrend over four sessions amid U.S. policy flux and in-line inflation data; supportive Canadian factors include strong labour markets.
Central Bank Notes:
- The Governing Council left the target for the overnight rate unchanged at 2.25% at its 10 December 2025 meeting, in line with market expectations and signalling that the earlier easing cycle has likely concluded. The Bank noted that while global tariff tensions and trade uncertainty persist, the external backdrop has stabilised somewhat, reducing the need for additional insurance cuts even as world trade remains fragile.
- The Council acknowledged that uncertainty around U.S. trade policy and tariffs continues to weigh on business sentiment, but recent data show Canadian manufacturing and goods exports holding up better than anticipated. Surveys cited by the Bank suggest export order books have stopped deteriorating, with firms reporting some rebuilding of backlogs despite still‑cautious capital spending plans.
- Canada’s economy rebounded more strongly than expected in the third quarter, with real GDP expanding at an annualised pace of about 2.6% after a 1.8% contraction in Q2, largely on the back of higher crude exports and government spending. Monthly data show output rising 0.2% in September, though flash estimates point to a softer start to Q4 as some sectors give back earlier gains.
- Service sector activity has firmed, with indicators showing the services PMI back above the 50 threshold and broadening gains in business and professional services. However, consumer-facing categories remain mixed, as still‑elevated price levels and only modest real income growth keep a lid on discretionary spending even as tourism and technology‑related services expand.
- Housing markets have continued to stabilise, with national resale activity and prices edging higher through the autumn alongside the earlier decline in borrowing costs. The Bank noted that while some major urban centres are seeing renewed price pressures, tighter underwriting standards and still‑high affordability constraints are expected to cap the pace of any rebound.
- Headline CPI inflation eased to 2.2% year over year in October and is estimated to have remained near that rate in November, keeping it slightly above the 2% target but comfortably within the 1%–3% control range. Core measures have drifted lower, with CPI‑median and CPI‑trim around 3% or below, reinforcing the assessment that underlying price pressures are gradually moderating even as gasoline and some shelter components remain volatile.
- The Governing Council reiterated that the current policy rate is “about the right level” to keep inflation close to target while supporting the economy through a period of structural adjustment, and it signalled a shift away from near‑term easing expectations. While the Bank did not rule out future adjustments, officials stressed that, barring a material downside surprise to growth or inflation, further rate cuts are unlikely before 2026. Attention is now focused on the durability of the recovery and the evolution of core inflation.
- The next meeting is on 28 January 2026.
Next 24 Hours Bias
Medium Bullish
Oil
Key news events today
No major news event
What can we expect from Oil today?
Oil markets steadied with slight upticks driven by US-Iran tensions and supply disruptions in Kazakhstan, though ample inventories and a projected surplus tempered gains. Brent neared $65 and WTI $60, poised for weekly advances amid mixed geopolitical signals.
Next 24 Hours Bias
Weak Bullish
The post IC Markets Global – Europe Fundamental Forecast | 23 January 2026 first appeared on IC Markets | Official Blog.
Friday 23rd January 2026: Global Optimism Lifts Markets, But Gift Nifty Signals Muted Start for Indian Equities
January 23, 2026 16:00 ICMarkets Market News
Global Markets:
- Asian Stock Markets : Nikkei up 0.26%, Shanghai Composite up 0.27%, Hang Seng up 0.29% ASX up 0.06%
- Commodities : Gold at $4952.61 (0.79%) Silver at $98.605 (2.32%), Brent Oil at $64.58 (0.81%), WTI Oil at $59.87 (0.86%)
- Rates : US 10-year yield at 4.244, UK 10-year yield at 4.4740, Germany 10-year yield at 2.8833
News & Data:
- (USD) Final GDP q/q 4.4% to 4.3% expected
Markets Update:
Gift Nifty futures point to a muted opening for Indian equity markets, even as global cues remain supportive following strong U.S. economic data that highlighted the resilience of the world’s largest economy. On Thursday, benchmark indices Sensex and Nifty gained around 0.5 percent each, snapping a three-day losing streak, helped by easing tensions between the European Union and the United States over Greenland.
The Indian rupee recovered slightly from record low levels, ending 3 paise higher at 91.62 against the U.S. dollar, reportedly aided by intervention from the Reserve Bank of India. Foreign institutional investors continued to offload equities, selling shares worth ₹2,550 crore, while domestic institutional investors provided support with net purchases of ₹4,223 crore, according to provisional exchange data.
Asian markets traded higher on Friday after U.S. stocks extended gains for a second straight session amid reduced geopolitical and trade-related concerns between the U.S. and Europe. The Japanese yen hovered near one-week lows ahead of the Bank of Japan’s policy decision, where rates are expected to remain unchanged with a cautious outlook.
Gold prices stayed firm above $4,950 per ounce, hitting a record high as the dollar index weakened sharply. Oil prices edged up modestly in early Asian trade after sharp losses in the previous session on hopes of a Ukraine peace deal and ongoing oversupply worries.
Overnight, U.S. markets advanced on optimism around economic data and easing policy tensions. The Dow Jones and S&P 500 rose 0.6 percent each, while the Nasdaq gained 0.9 percent. European markets also rebounded, with the Stoxx 600 climbing 1 percent, led by gains in Germany and France.
Upcoming Events:
- 01.30 PM GMT – CAD Core Retail Sales m/m
The post Friday 23rd January 2026: Global Optimism Lifts Markets, But Gift Nifty Signals Muted Start for Indian Equities first appeared on IC Markets | Official Blog.
Germany January flash manufacturing PMI 48.7 vs 47.8 expected
January 23, 2026 15:39 Forexlive Latest News Market News
- Prior 47.0
- Services PMI 53.3 vs 52.5 expected
- Prior 52.7
- Composite PMI 52.5 vs 51.6 expected
- Prior 51.3
- Full report here
Key Points:
- Business activity growth quickens in January, but labour market
conditions deteriorate
Comment:
Commenting on the flash PMI data, Dr. Cyrus de la Rubia, Chief Economist at Hamburg Commercial Bank, said:
“The data show a good start to the new year, overall. Output in the manufacturing sector returned to – albeit meagre –
growth, and so did new orders. Even more encouraging is the stronger pickup in activity in the services sector. Looking
ahead, confidence has risen noticeably in the services sector and has held at a solid level in manufacturing.
“While there are signs of a modest recovery, services companies have trimmed their workforce significantly in January,
which might point more to efficiency measures than to concerns about demand. In manufacturing, the process of cutting jobs
has continued unabated. Since this has been ongoing since mid-2023, there’s now a lot of debate about whether this is a
structural issue, one that would require structural answers in the form of reforms that are anything but easy to implement.
“In the services sector, the situation has brightened quite a bit. Pricing power seems to have increased significantly as sales
price inflation has moved up. While that partly reflects higher input costs, the rise in sales price inflation has been even
stronger. With new business growing more robustly than last month, service providers are becoming more self-confident –
something that also shows up in their much higher optimism for future activity.
“Meanwhile, the International Monetary Fund has upgraded its 2026 GDP growth forecast for Germany by 0.2 percentage
points to 1.1%, reinforcing the sense that growth prospects are improving. Still, the recovery remains rather fragile. The
continued drop in inventories and another decline in backlogs of orders in manufacturing are clear examples. Yet, the
unusually large fiscal stimulus through much higher spending on defence and infrastructure should provide a noticeable
boost to the economy.”
This article was written by Giuseppe Dellamotta at investinglive.com.
General Market Analysis – 23/01/26
January 23, 2026 15:39 ICMarkets Market News
US Stocks Push Higher on Improved Risk Sentiment – Nasdaq up 0.9%
US equities pushed higher again in yesterday’s session as risk sentiment continued to improve around Greenland and European tariff concerns. The Dow Jones climbed 0.63% to close at 49,384, while the S&P 500 added 0.55% to finish at 6,913. The Nasdaq outperformed, rising 0.91% to close at 23,436. US Treasury yields edged higher, with the 2-year yield up 2.2 basis points to 3.607% and the benchmark 10-year ticking 0.2 basis points higher to 4.245%. Despite the move in yields, the US dollar was sold hard, with the DXY sliding 0.47% to 98.29. Commodity markets were mixed. Oil prices slipped back as improving risk sentiment weighed on crude, with Brent falling 1.47% to $64.28 a barrel and WTI dropping 1.75% to $59.56. In contrast, precious metals continued their powerful run. Gold defied the broader risk-on backdrop, surging 2.15% to settle at $4,936.02, while silver also pushed to new highs, reinforcing the strong demand for hard assets.
Precious Metal Flow Relentless in 2026
Both gold and silver powered to more fresh record highs in trading yesterday despite an overall ‘risk-on’ sentiment hitting most other parts of the market. In a continuation of the pattern that dominated gold trading in particular, and silver towards the end of 2025, precious metals are driving to higher levels in most market environments. Goldman Sachs recently increased its year-end gold estimate to $5,400 on the back of strong investor demand and central bank buying, but that may prove to be an underestimate in the current environment. Silver’s rally has been even more dramatic in percentage terms. After an extraordinary run in 2025, silver has continued to ascend in 2026, surpassing $95 per ounce overnight as its dual role as both an industrial metal and a safe haven has amplified demand, while constrained supplies have bolstered price performance. Both metals now look to be targeting significant psychological levels at $5,000 and $100 an ounce, and this could be hit in hours or sessions rather than days or weeks if we see similar demand today.
Busy Calendar Day to Close Out the Trading Week
Looking ahead, it shapes as a busy end to the trading week, with a full event calendar across all sessions and the potential for further geopolitical updates to drive volatility. We have already seen a higher-than-expected print for New Zealand CPI data (+0.6% vs exp +0.5%) in the Asian session, but the focus is now squarely on Japanese markets and the Bank of Japan’s interest rate decision and guidance. In Europe, UK retail sales (exp 0.0% m/m) are due early in the day, followed by flash services and manufacturing PMI data from France, Germany, and the UK, before ECB President Christine Lagarde speaks later in the morning. The US session sees Canadian retail sales (exp 1.2% m/m) close to the open, before focus drops back south of the border to the US for its flash services (exp 52.9) and manufacturing (exp 51.9) PMI data later in the day.
The post General Market Analysis – 23/01/26 first appeared on IC Markets | Official Blog.
IC Markets Global – Asia Fundamental Forecast | 23 January 2026
January 23, 2026 15:39 ICMarkets Market News
IC Markets Global – Asia Fundamental Forecast | 23 January 2026
What happened in the U.S. session?
Stronger-than-forecast U.S. GDP and jobless claims data overnight reinforced economic strength, boosting stocks across major indices by over 1% while pressuring bonds via higher yields and commodities mixed amid reduced rate cut bets; lingering relief from de-escalated tariff threats amplified the equity rebound.
What does it mean for the Asia Session?
Asian traders should monitor the Bank of Japan’s policy decision expected today, alongside key inflation data from Japan and New Zealand, amid recent gains in regional stocks and commodities like gold and oil. Oil prices edged higher yesterday on supply disruptions in Kazakhstan and easing US-Europe tensions, while gold surged to near-record highs around $4,900 per ounce.
The Dollar Index (DXY)
Key news events today
Flash Manufacturing PMI (2:45 pm GMT)
Flash Services PMI (2:45 pm GMT)
Revised UoM Consumer Sentiment (3:00 pm GMT)
What can we expect from DXY today?
The U.S. dollar traded sideways with the index at approximately 96.60, buoyed by seasonal tailwinds and robust U.S. economic momentum but pressured by eased Greenland tariff fears and a stronger Australian dollar at 15-month peaks. Investors remain cautious ahead of key data like NFP, balancing Fed cut expectations against Trump’s policy shifts and global risk-on flows.
Central Bank Notes:
- The Federal Open Market Committee (FOMC) is widely expected to lower the federal funds rate target range by 25 basis points to 3.50%–3.75% at its December 9–10, 2025, meeting, marking the third consecutive cut after the October reduction to 3.75%–4.00%
- The Committee continues to pursue maximum employment and 2% inflation goals, with the labor market showing further softening as the unemployment rate rose to 4.4% in September 2025 amid modest job gains.
- Officials note persistent downside risks to growth alongside resilient activity, with inflation easing to 3.0% year-over-year CPI in September but remaining elevated due to tariff effects; core PCE stands at around 2.8% as of October.
- Economic activity grew at a 3.8% annualized pace in Q2 2025 per revised estimates, though Q3 and Q4 face headwinds from trade tensions, fiscal restraint, and data disruptions like the government shutdown.
- September’s Summary of Economic Projections forecasts 2025 unemployment at a median of 4.5%, with PCE inflation near 3.0% and core PCE at 3.1%, signaling a gradual disinflation path. Updates expected on December 10 may adjust for higher unemployment and lower growth.
- The Committee maintained its data-dependent approach, noting a softening labor market and inflation above the 2% target, while deciding to lower the federal funds rate target range by 25 basis points to 3.50%-3.75%. Dissent persisted, with multiple members opposing the cut or advocating for a hold, reflecting divisions similar to recent meetings.
- The FOMC confirmed the conclusion of its quantitative tightening program effective December 1, 2025, with Treasury rolloff caps at $5 billion per month and agency MBS caps at $35 billion per month to ensure ample reserves and market stability.
- The next meeting is scheduled for 27 to 28 January 2026.
Next 24 Hours Bias
Medium Bearish
Gold (XAU)
Key news events today
Flash Manufacturing PMI (2:45 pm GMT)
Flash Services PMI (2:45 pm GMT)
Revised UoM Consumer Sentiment (3:00 pm GMT)
What can we expect from Gold today?
Spot gold climbed 1.54% to $4,904.84 on January 22, marking a 9.38% monthly gain and 78.07% yearly increase, with intraday peaks near $4,915. Analysts note support from global policy easing, debt concerns, and equity risk rallies, boosting hedging demand.
Next 24 Hours Bias
Strong Bullish
The Australian Dollar (AUD)
Key news events today
No major news event
What can we expect from AUD today?
The Australian Dollar advanced firmly, reaching 15-month highs near 0.6842 against a softening USD, fueled by robust December jobs data, diminished trade war risks from Trump’s Greenland policy shift, and stable inflation signals; however, lingering RBA rate hike expectations and geopolitical headlines capped gains.
Central Bank Notes:
- The Reserve Bank of Australia held its cash rate steady at 3.60% at the November 2025 policy meeting, adopting a cautious tone amid a surprise uptick in inflation data for the September quarter. This marks the fourth consecutive pause since the 25 basis point cut in August. The Board attributed some of the inflation rise to temporary factors like higher petrol prices and council rates, but noted signs of more persistent pressures from consumer demand.
- Policymakers emphasized vigilance on inflation, with trimmed mean inflation expected to remain elevated in the near term before nearing the 2–3% target midpoint by mid-2027. Recent data showed underlying inflation staying above target until at least the second half of 2026, prompting upward revisions to forecasts. Capacity pressures are seen as slightly more pronounced than previously assessed, delaying any easing.
- Headline CPI for the September quarter exceeded expectations, driven partly by temporary items, while underlying measures signal ongoing stickiness. The shift to monthly CPI reporting, with the first full edition in November 2025, will enhance real-time inflation monitoring. Housing and services remain resilient contributors to price pressures.
- Domestic demand shows firmness in services alongside below-trend growth elsewhere, with capacity pressures not expected to ease significantly. The labor market is gradually softening, with unemployment projected to stabilize around 4.4%, though wage growth and productivity dynamics keep unit labor costs a concern. Household spending faces headwinds from high borrowing costs.
- Global risks include geopolitical tensions and commodity volatility, set against modestly revised-up world growth outlooks. The Board describes its policy as mildly restrictive and data-dependent, balancing inflation control with employment goals. No rate hike was considered despite the inflation surprise.
- Monetary policy remains mildly restrictive to address lingering price stability risks amid household and global vulnerabilities. Communications reaffirm the dual mandate of 2–3% inflation and full employment, with readiness to adjust based on incoming data.
- Market expectations point to the cash rate holding through early 2026, with a possible modest cut to 3.3% mid-year if inflation eases as forecast. The new monthly CPI data will be key for timely insights.
- Monetary policy remains mildly restrictive, balancing progress on price stability against vulnerabilities in household demand and global outlook. Board communications reaffirm a dual mandate: price stability and full employment, while underscoring readiness to respond should risks materialize sharply.
- Analysts generally expect the cash rate to remain at current levels through early 2026, with only modest cuts possible later in the year if inflation moderates. The new monthly CPI release (first full edition Nov 2025) will be watched closely for timely signals on price trends.
- The next meeting is on 2 to 3 February 2026.
Next 24 Hours Bias
Medium Bullish
The Kiwi Dollar (NZD)
Key news events today
No major news event
What can we expect from NZD today?
The New Zealand Dollar maintains recent momentum from a weaker US Dollar driven by global trade uncertainties, trading around 0.5860 after hitting near four-week highs, though weekly forecasts warn of bearish corrections amid subdued local economic catalysts and persistent RBNZ policy caution.
Central Bank Notes:
- The Monetary Policy Committee (MPC) left the Official Cash Rate (OCR) unchanged at 2.25% at its 26 November 2025 meeting, following the widely anticipated 25-basis-point reduction from 2.50%, and signaled that policy is now firmly in stimulatory territory while keeping the option of further easing on the table if needed.
- The decision was again reached by consensus, with members judging that the cumulative 325 basis points of easing over the past year warranted a period of assessment, even as several emphasized a willingness to cut further should incoming data point to a more protracted downturn or renewed disinflationary pressures.
- Headline consumer price inflation is projected to hover near 3% in late 2025 before gradually easing toward the 2% midpoint of the 1–3% target band through 2026, supported by contained inflation expectations around 2.3% over the two-year horizon and an expected pickup in spare capacity.
- The MPC noted that domestic demand remains subdued but shows tentative signs of stabilisation, with softer household spending and construction only partially offset by improving services activity; nevertheless, policymakers still expect services inflation to ease as wage growth moderates and the labour market loosens further over the coming year.
- Financial conditions continue to ease as wholesale and retail borrowing rates reprice to the lower OCR, contributing to gradually rising mortgage approvals and improving housing-related sentiment, although broader business credit growth remains patchy and sensitive to uncertainty about the durability of the recovery.
- Recent data confirm that GDP momentum is weak but not deteriorating as sharply as earlier in 2025, with high-frequency indicators pointing to a shallow recovery from a low base and ongoing headwinds from elevated living costs and fragile confidence weighing on discretionary consumption and investment.
- The MPC reiterated that external risks remain skewed to the downside, particularly from softer Chinese demand and uncertainty around United States trade policy, but noted that a lower New Zealand dollar continues to provide some offset via improved export competitiveness and support for tradables inflation.
- Looking ahead to early 2026, the Committee maintained a mild easing bias, indicating that a further cut toward 2.00–2.10% cannot be ruled out if activity fails to gain traction or if inflation undershoots projections, but current forecasts envisage the OCR remaining near 2.25% for an extended period, provided inflation converges toward target and the recovery proceeds broadly as expected.
- The next meeting is on 18 February 2026.
Next 24 Hours Bias
Medium Bullish
The Japanese Yen (JPY)
Key news events today
BOJ Policy Rate (Tentative)
Monetary Policy Statement (Tentative)
BOJ Outlook Report (Tentative)
BOJ Press Conference (Tentative)
What can we expect from JPY today?
The Japanese Yen continues its intraday slide against the USD, consolidating losses near multi-week lows as traders await the BoJ’s rate decision and Governor Ueda’s press conference, expected to maintain rates at 0.75% but signal hawkish intent amid inflation risks and yen weakness fueled by fiscal expansion under PM Takaichi.
Central Bank Notes:
- The Policy Board of the Bank of Japan meets on 22–23 January 2026, with markets fully expecting the short-term policy rate to remain at 0.75%, following the December 2025 hike, as the bank assesses the impact of prior tightening while emphasizing gradual, data-dependent adjustments.
- The BOJ will continue targeting the uncollateralized overnight call rate around 0.75% and signal that future rate hikes depend on the effects of recent increases on bank lending, corporate financing, and economic activity, with some policymakers eyeing a possible move as early as April.
- JGB purchase tapering proceeds on schedule, with outright purchases reduced by ¥400 billion per quarter through March 2026, then ¥200 billion per quarter from April to June 2026, aiming for around ¥2 trillion monthly in Q1 2027, with flexibility if market conditions worsen.
- Japan’s economy showed recovery signs after the Q3 2025 contraction, with Q4 2025 GDP growth estimated positively amid export strength, though business sentiment among manufacturers softened to a six-month low of +7 in January 2026 due to weaker overseas demand.
- Core consumer inflation (excluding fresh food) eased to 2.3% year-on-year in December 2025 Tokyo CPI, down from 2.8-3.0% peaks earlier, while core-core (excluding fresh food and energy) stood at 2.6%, both above the 2% target but with moderating cost pressures.
- Near-term input costs continue easing from faded import surges, but services inflation and steady wage gains with early 2026 negotiations targeting 5% hikes sustain price momentum; medium-term inflation expectations remain anchored above 2%, tilting upside risks.
- In the coming quarters, real growth may moderate below potential amid tighter conditions and yen weakness, but accommodative real rates, real wage gains, and fiscal support are poised to bolster private consumption and investment recovery.
- Medium-term, stabilizing overseas demand and tight labor markets should drive wage growth and keep core inflation gradually around or above 2%, allowing cautious rate normalization if financial conditions stay supportive.
- The next meeting is scheduled for April 2026.
Next 24 Hours Bias
Medium Bearish
Oil
Key news events today
No major news event
What can we expect from Oil today?
The Japanese yen consolidates near multi-month lows against the USD at around 159, as markets focus on the Bank of Japan’s policy verdict amid expectations of steady 0.75% rates but hawkish rhetoric on persistent inflation from a weakening currency and Prime Minister Sanae Takaichi’s expansionary fiscal agenda.
Next 24 Hours Bias
Weak Bearish
The post IC Markets Global – Asia Fundamental Forecast | 23 January 2026 first appeared on IC Markets | Official Blog.
France January flash services PMI 47.9 vs 50.5 expected
January 23, 2026 15:30 Forexlive Latest News Market News
- Prior 50.1
- Manufacturing PMI 51.0 vs 50.5 expected
- Prior 50.7
- Composite PMI 48.6 vs 50.0 expected
- Prior 50.0
With a start to the year like this, France is not beating the allegations that it will be the main drag of the euro area for 2026. While political woes are a key issue, the French economy looks to also be stuttering to start the new year.
Of note, services activity falls back into contraction territory and marks a fresh 9-month low. That isn’t enough to offset the better news on the manufacturing side of things with the estimate there being a 43-month high. That comes as the manufacturing output index climbs to 51.9, marking a 47-month high.
Looking at the details, demand conditions continue to be weak and clients are showing hesitancy to place orders amid the ongoing political
deadlock regarding the nation’s fiscal plans. That being said, business optimism was the highest since September 2024 so that may hint that there might be better things to come in the French economy moving forward. But for now, it’s very much a wait and see kind of thing.
HCOB notes that:
“The French private sector entered the new year on a muted note. The HCOB Flash PMIs point to a broad‑based softening
in export conditions, reflecting continued uncertainty on the trade policy front despite prior trade agreements. Renewed tariff
threats from the US, which included the prospect of a 200% duty on French champagne, underscore how fragile the external
environment remains. Although such threats may merely be being used as a tool to gain political leverage, they still add to
the uncertainty faced by export‑orientated firms. A relatively firm euro and intensifying competition from China further weigh
on the outlook for exporters.
“Nonetheless, the HCOB flash PMIs showed a modest improvement in manufacturing, whereas activity in the services
sector weakened notably at the start of the year. The prospect of a resolution over the 2026 national budget offers some
relief, as it reduces the risk of a renewed political crisis in the near term. This has contributed to a marked rise in the future
activity index. However, the new budget is unlikely to deliver sufficient progress on fiscal consolidation.
“Whether the manufacturing industry embarks on a recovery in 2026 remains uncertain. The headline PMI for the sector
signalled a mild uptick in growth, but a more durable improvement would require a clear rebound in new orders, which
remained in contraction in January. The continued decline in output prices and export orders also suggests that a sustained
upswing in growth is not yet in sight.”
This article was written by Justin Low at investinglive.com.
UK December retail sales +0.4% vs -0.1% m/m expected
January 23, 2026 14:14 Forexlive Latest News Market News
- Prior -0.1%
- Retail sales +2.5% vs +1.1% y/y expected
- Prior +0.6%; revised to +1.8%
- Retail sales ex autos, fuel +0.3% vs -0.2% m/m expected
- Prior -0.2%
- Retail sales ex autos, fuel +3.1% vs +1.7% y/y expected
- Prior +1.2%
More to come..
This article was written by Justin Low at investinglive.com.
Heads up: BOJ governor Ueda press conference up next
January 23, 2026 12:39 Forexlive Latest News Market News
The Bank of Japan (BOJ) left monetary policy unchanged earlier today in a 8-1 vote. The only dissenter was Takata once again as he proposed raising the policy rate to 1.00% instead. The details from earlier as covered by Eamonn:
- Bank of Japan leaves short term rate on hold, as expected
- BOJ holds rates at 0.75%, Lifts core inflation outlook. Dissent highlights inflation risk
The language in the policy statement isn’t anything that stands out. The BOJ continues to retain its stance in waiting to see how wage developments will progress next before pushing for the next rate hike. However, the recent sharp decline in the Japanese yen has definitely made things more complicated for the central bank.
For one, Takaichi’s government and fiscal plans are working against the BOJ in wanting to push for further rate hikes. And with the prime minister set to consolidate power via the snap election, it’s again putting pressure on the BOJ to keep playing ball to support her economic and fiscal objectives.
But even so, that is putting heavy downside pressure on the Japanese yen currency. And if verbal intervention isn’t helping, there has to be some course of action next from Tokyo officials.
Actual intervention from the Ministry of Finance would help in the short-term but unless the fundamentals change, it will be tough to convince markets of a material change to the outlook for the currency.
As such, the BOJ might be forced to take action in order to stem the bleeding in the currency instead. For now, they’re not hinting much at that and not really showing the appetite to want to do so. But if Ueda & co. wants to work out a compromise to raise interest rates, this might be the perfect excuse to get it done.
I don’t expect Ueda to be explicit about the situation today and to say that the central bank could step in to raise rates just for the sake of boosting the currency. That would be bad form to do so.
But in any case, market players will be listening carefully to any subtle messaging on that front. So, pay close attention to what Ueda has to say later. He will be speaking at 0630 GMT, just a little less than an hour from now.
This article was written by Justin Low at investinglive.com.