Articles
U.S. Treasury auctions off $39 billion of 10 year notes at a high yield of 4.173%
January 13, 2026 01:14 Forexlive Latest News Market News
The U.S. Treasury auctions off $39 billion of 10 year notes at a high yield of
- High yield 4.173% vs 4.169% last
- WI level at the time of the auction 4.181%
- Tail -0.7 basis points vs 6 month average of 0.1 basis points
- Bid to cover 2.55X vs 6 month average of 2.51X
- Directs 24.5% vs 6 month average of 20.6%
- Indirects 69.6% vs 6 month average of 69.5%
- Dealer 5.9% vs 6 month average of 9.9%
AUCTION GRADE: B+
The $39B 10-year Treasury auction showed solid, stress-free demand, with the issue stopping 0.7 bp through the WI, signaling buyers were willing to accept a lower yield than the market was offering going into the sale. The 2.55 bid-to-cover was slightly above average, confirming broad participation, while direct bidders jumped to 24.5%, highlighting strong domestic real-money demand from pensions and asset managers. Foreign demand was steady, and dealers were left with only 5.9% of the issue, meaning the market absorbed the supply cleanly without forcing the Street to warehouse bonds. Together, it pointed to a healthy, well-supported auction and helps explain why yields struggled to move higher afterward
This article was written by Greg Michalowski at investinglive.com.
U.S. Treasury will auction $39 billion of 10 year notes at the top of the hour
January 13, 2026 01:00 Forexlive Latest News Market News
The U.S. Treasury will auction $39 billion of 10 year note of the top of the hour. The six-month average as of the major components will be compared to the actual results to determine relative strength or weakness of the auction. The 6 month averages shows:
- Tail 0.1 basis points
- Bid to cover 2.51X
- Directs 20.6%
- Indirects 69.5%
- Dealers 9.9%.
Current treasury yields are little changed:
- 2-year yield 3.540%, +0.1 basis points
- 5 year yield 3.057%, unchanged
- 10 year yield 4.177%, +0.6 basis points
- 30 year yield 4.86%, +0.7 basis points.
Understanding US Treasury auction components
-
WI (When-Issued) level – The yield (or price) where the new Treasury security trades in the market before the auction; it reflects real-time investor demand and expectations, and auctions that clear through the WI (lower yield, higher price) signal strong demand, while those that clear above the WI indicate weaker demand.
-
Tail – The difference between the auction’s high yield and the WI yield at the bidding deadline; a positive tail (auction yield higher than WI) shows buyers demanded a discount, signaling soft demand, while a stop-through (negative tail) reflects aggressive buying and strong demand.
-
Bid-to-Cover ratio – Total bids received divided by the amount offered; a higher ratio means more demand relative to supply, while a lower ratio signals weaker investor appetite for that maturity.
-
Direct bidders – Domestic investors (such as U.S. banks, pension funds, insurance companies, and asset managers) that submit bids directly to the Treasury; higher direct participation typically reflects strong real-money demand and longer-term investment interest.
-
Indirect bidders – Foreign central banks, international institutions, and overseas investors bidding through primary dealers; high indirect participation is often read as strong global demand for U.S. Treasuries and support for the dollar-based reserve system.
-
Dealers (primary dealers) – Banks required to bid at every auction and make markets in Treasuries; when dealer take-down is high, it means end-user demand was weaker and dealers had to absorb more supply, while low dealer take-down indicates strong investor demand from directs and indirects.
How traders use Treasury auction data in real time
-
WI vs. auction result is the first reaction trigger – Traders compare the high yield to the WI level within seconds; a stop-through usually sends yields lower and bond prices higher, while a tail pushes yields up and the dollar higher as traders price in weaker demand.
-
Tail size defines the strength of the signal – A 0–0.5 bp tail is noise, 1–2 bps is weak, and 3+ bps is a red flag that demand was meaningfully soft and supply was not absorbed easily.
-
Bid-to-cover tells whether buyers showed up – A rising BTC versus recent auctions confirms improving demand, while a falling BTC warns that investors are stepping back, especially dangerous in longer-dated maturities.
-
Indirect bidders show global appetite for U.S. debt – Strong indirect participation signals foreign central banks and global reserve managers are buying, which is bullish for Treasuries and supportive for risk assets; weak indirects often coincide with rising yields and a firmer dollar.
-
Direct bidders reflect “real money” conviction – High direct take-down means pension funds, insurers, and asset managers are committing capital, which tends to stabilize yields after the auction.
-
Dealers are the shock absorbers – When dealers are stuck with a large share, they typically hedge by selling futures or cash bonds, pushing yields higher after the auction; low dealer take-down means the market absorbed the supply cleanly.
-
Traders watch maturity-specific patterns – Weak 2-year auctions hit Fed-rate expectations, weak 10s hit mortgage rates and equities, and weak 30s hit inflation and fiscal-risk pricing.
-
The post-auction 5-minute window matters most – If yields can’t reverse after a weak auction, it confirms a real supply problem; if a bad print gets bought, it shows hidden demand was waiting.
This article was written by Greg Michalowski at investinglive.com.
investingLive European markets wrap: Dollar slips, precious metals surge on Fed threats
January 12, 2026 20:14 Forexlive Latest News Market News
Headlines:
- Silver rallies to new all-time highs on renewed Fed independence worries
- Gold jumps to a new all-time high as the DOJ seeks a pretext to fire Fed Chair Powell
- Dollar stays on the backfoot amid unease over Fed independence
- The dollar isn’t the only major currency having a bad day
- European stocks pushed lower at the open, US futures a drag on threats to the Fed
- The market is telling Trump to stop interfering with Federal Reserve independence
- Fed rate cut calls get pushed back after the US jobs report on Friday
- Eurozone investor morale clocks in better than expected to kick start the new year
Markets:
- GBP leads, USD lags on the day
- European equities mixed; S&P 500 futures down 0.5%
- US 10-year yields up 3.2 bps to 4.203%
- Gold up 1.8% to $4,588.93
- WTI crude oil down 0.3% to $58.93
- Bitcoin up 0.1% to $90,708
The main headlines to start the week is Trump’s continued attack on Fed independence, as Powell is put under criminal investigation in a bid by the administration to try and bend the central bank to its will. Powell’s press conference was quite something and if you watched it without context, you might even think it was scripted and AI-generated. It was powerful and sends a clear message of the kind of unprecedented situation we’re seeing with the central bank.
In any case, markets are already casting their vote early and quickly. And the bottom line is, the dollar and US stocks do not like it.
The greenback suffered in European morning trade, though the larger moves came during Asia trading. EUR/USD stretched higher to close in on 1.1700 before sitting now around 1.1680, up 0.4% on the day. GBP/USD is also holding higher, up 0.5% to 1.3463 while USD/CHF is down 0.5% to 0.7975 currently.
The one major currency that failed to take advantage of the dollar’s plight is the Japanese yen. USD/JPY dipped a little to 157.60 but quickly climbed back up to near unchanged levels now at 157.88. That clearly shows the lack of appetite towards the yen as well even during a time when the dollar is struggling.
The big winner of all of this? Precious metals. Gold delivered another push to fresh all-time highs and briefly clipped $4,600 while silver jumped up over 5% to keep above $84 on the day. Up, up, and away. No stopping the metals train. 🔥
In the equities space, European indices followed US futures lower to open but investors managed to regain some composure after. The DAX is now trading higher again but there are still some light declines seen in the CAC 40 and IBEX. As for US futures though, the mood music is more pessimistic with S&P 500 futures keeping down 0.5% and Nasdaq futures down 0.7%.
Now, it’s about how Wall Street will take to the news in anticipation of some other key developments coming up later this week. We have the US CPI tomorrow, big banks kicking off earnings season, the potential Supreme Court ruling on tariffs, and of course more geopolitical headlines involving Trump and the likes of Greenland and Iran.
This article was written by Justin Low at investinglive.com.
Supreme Court Tariff Ruling (Opinion Day) Meets Jobs Day
January 12, 2026 19:39 Forexlive Latest News Market News
Important clarification: While markets are watching the US Supreme Court closely, any ruling referenced in this analysis remains potential, not scheduled. The Court does not pre-announce decisions. On a designated “decision day,” it may rule on any case currently before it. For background, see our related update here:
https://investinglive.com/news/no-opinion-today-on-tariffs-from-the-us-supreme-court-20260109/
Before we go into the expected scenarios and what you may consider trading, here’s where you can watch it live when it starts!
Supreme Court & Trump Tariffs: Watch Live
Before it starts, here is a glimpse of the wisdom of the crowd and what the supreme court, in its view, will decide.
Event Risk Window: 8:30 AM ET (NFP) and 10:00 AM ET (Supreme Court opinion release)
Markets are heading into a rare convergence of macro, legal, and positioning risk, with traders navigating both the December US non-farm payrolls report and a potentially market-moving Supreme Court decision on Trump-era tariffs.
While payrolls normally dominate a Friday morning, attention today is clearly split. Many desks are already treating the jobs report as a secondary catalyst, with positioning light and volatility suppressed ahead of the 10:00 AM ET Supreme Court window.
Will the court’s (opinion) be supportive of Trump and tarrifs? What prediction markets are signaling
One of the clearest real-time sentiment gauges is the Polymarket contract asking whether the Supreme Court will rule in favor of Trump’s tariffs.
As of this morning:
-
Implied probability: ~25% that the Court upholds the tariffs
-
Market consensus: ~75% chance the tariffs are struck down or meaningfully limited
-
Trend: A sustained decline in odds since November, likely reflecting post-argument legal interpretation and positioning shifts
In short, the “smart money” in prediction markets is leaning heavily toward a negative ruling for the tariffs.
Why the Court’s Rulling on Trump Tarrifs Matters for Today’s Trading
Because expectations are already skewed, the risk is asymmetric.
Scenario 1: Tariffs Are Struck Down (Consensus Outcome)
If the Court rules against the tariffs, markets are likely to interpret this as the removal of a long-standing inflationary and supply-chain risk.
-
Equities: Supportive, particularly for consumer discretionary and import-sensitive names
-
Broad sentiment: Risk-on, but likely controlled rather than explosive due to expectations already being priced
-
US Dollar: Potential downside pressure as tariff-driven inflation risk fades
In this scenario, the jobs report may act only as a secondary volatility layer, unless payrolls significantly surprise.
Scenario 2: Tariffs Are Upheld (Low-Probability Shock)
This is where volatility could accelerate.
Because markets are not positioned for this outcome, a ruling in favor of the tariffs could trigger rapid repricing:
-
Equities: Sharp downside as cost pressures and policy uncertainty re-enter forecasts
-
Sector rotation: Relative strength in domestic steel and materials, weakness elsewhere
-
Dollar: Potential spike as inflation expectations and rate-path uncertainty reprice higher
Why NFP Still Matters, but Less Than Usual
The December payrolls consensus sits near +60K jobs with a 4.5% unemployment rate, and some analysts see upside risk. However, even a surprise print may struggle to dominate flows if traders are already bracing for the legal headline.
As Adam Button noted earlier, markets appear “locked and loaded” for the Supreme Court release, with both US and Canadian jobs data potentially taking a back seat.
Remember, the above are just for you to consider as you do your own research. And watch the price action, be careful of end of the week volatilty as market makers can stop hunt both bulls and bears, in case you’re trading this.
For deeper context on the legal timing and market implications, see our full breakdown here:👉 InvestingLive.com analysis: The Supreme Court scheduled Friday as an opinion day: what’s the trade?https://investinglive.com/news/the-supreme-court-scheduled-friday-as-an-opinion-day-whats-the-trade-20260106/
Bottom Line for Traders
Prediction markets suggest the tariffs are expected to fall. That means calm is priced in, shock is not.
From a decision-support perspective, today is less about prediction and more about reaction discipline. Watch the sequencing, respect volatility, and remember that when probabilities cluster this tightly, the minority outcome carries the most risk.
We will also be watching the Nasdaq order flow and what it can tell us.
This article was written by Itai Levitan at investinglive.com.
Goldman Sachs sees 10-year Treasury yields rising despite Fed rate cut odds
January 12, 2026 19:30 Forexlive Latest News Market News
In a report on Monday, Goldman Sachs is expecting 10-year Treasury yields to rise to 4.40% by the end of 2026 citing a US economy which will continue to stay underpinned.
The firm anticipates US economic growth to hit 2.3% and that will see it keep above the 2% long-term trend. Adding that more robust growth does tend to “steepen the yield curve because you have growth running above its trend rate and then while we do expect the Fed to be cutting, the objective of rate cuts is actually to stimulate the economy”.
Goldman Sachs goes on to note that it would “self-defeating” for the Fed to keep rates at “an abnormally low level” because that would get markets to just simply “steepen the yield curve”.
As a reminder, the steepening in which they are pointing out here is that long-term yields is outpacing short-term yields i.e. wider gap – which often sends a signal of expectation for stronger economic growth down the road.
Well, rising fiscal risks and Trump’s constant attack on Fed independence are also other factors to consider as that would see a premium in wanting to hold US debt. But more simply put, market expectations are also of the view that incumbent Fed chair Powell has already delivered his final rate cut back in December.
It is now on Trump’s appointed successor to Powell to take over and drive a narrative shift. Otherwise, market players don’t seem to be thinking that rate cuts are coming any time soon just yet. So, there’s that as well.
Still, traders are pricing in at least two rate cuts for the whole of 2026. That being said, it’s still early in the year and these odds tend to move around quickly based on macro developments. So, to say that the rate cuts priced in is a given would be a mistake.
This article was written by Justin Low at investinglive.com.
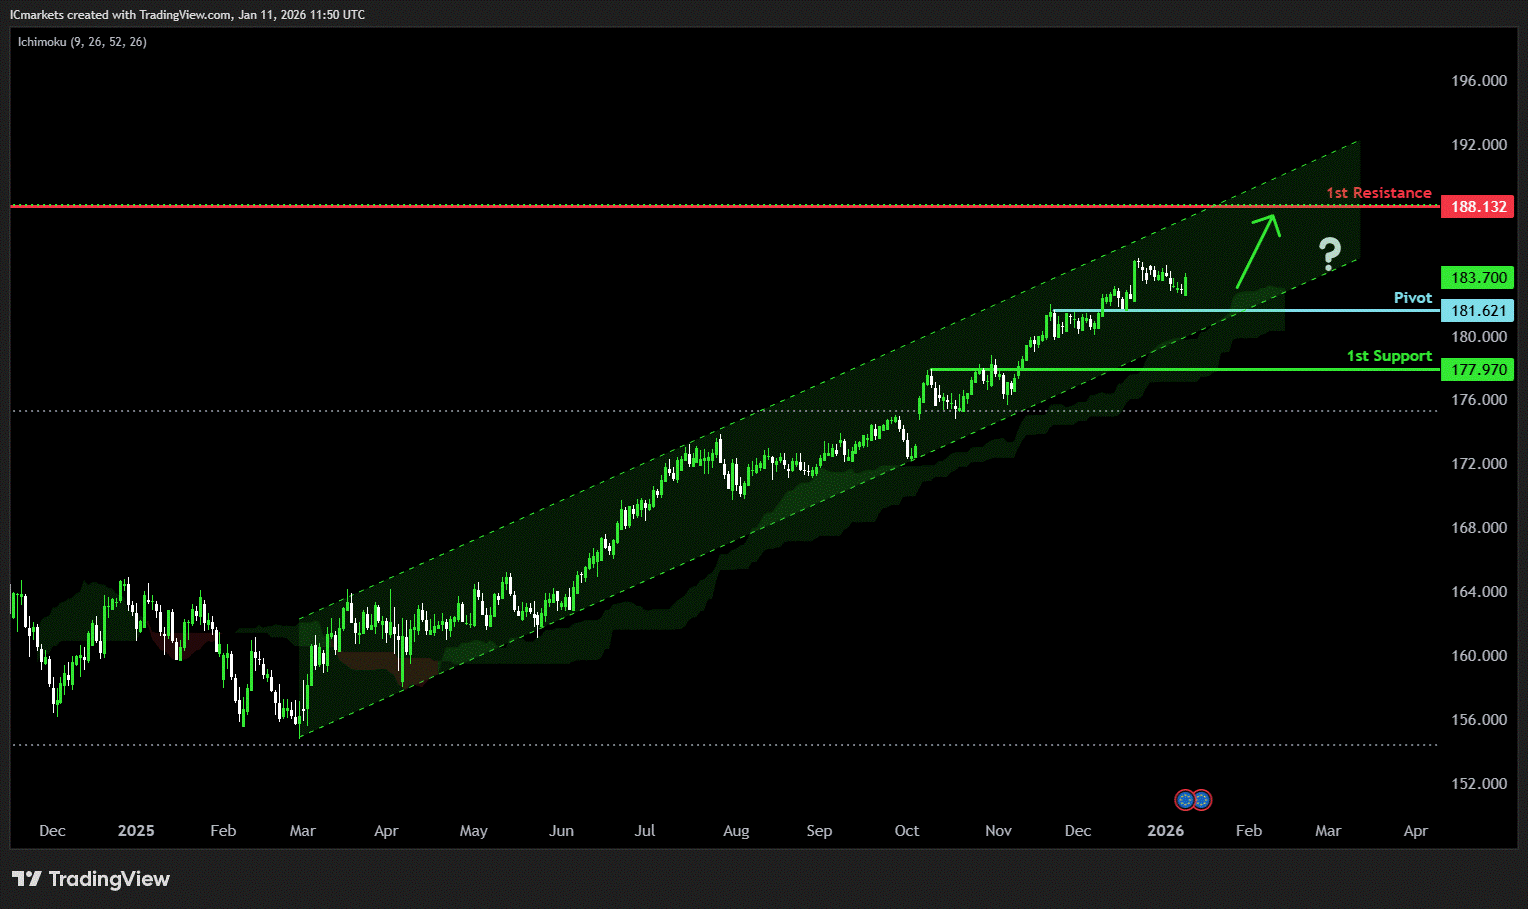
Ex-Dividend 13/01/2026
January 12, 2026 18:14 ICMarkets Market News
The post Ex-Dividend 13/01/2026 first appeared on IC Markets | Official Blog.
Eurozone investor morale clocks in better than expected to kick start the new year
January 12, 2026 16:39 Forexlive Latest News Market News
- Eurozone January Sentix investor confidence -1.8 vs -4.9 expected
- Prior -6.2
More to come..
This article was written by Justin Low at investinglive.com.
The market is telling Trump to stop interfering with Federal Reserve independence
January 12, 2026 16:30 Forexlive Latest News Market News
The main news of the day today is the US Department of Justice
subpoenaing the Federal Reserve in an unprecedented move
that escalates the ongoing conflict between President Trump and Fed Chair
Powell for not lowering interest rates faster.
The official reason is that
the DOJ is focusing on the renovation to see
whether Powell made misleading or false statements to the Senate Banking
Committee regarding the scale, costs and luxury features of the project.
In reality, everybody knows
that this is just a political pretext to intimidate the Fed Chair and force him
to cut interest rates faster. We have already seen this kind of intimidation
with Fed Governor Cook last year when Trump tried to fire her for cause without
success as we continue to await the US Supreme Court decision on that case.
The market reaction to the news was pretty straightforward and a taste of what it could be if the Fed lost independence (I touched on the consequences here).
A potential loss of Fed independence raises the risk of uncontrolled inflation and eventually stagflation. Gold, and precious metals in general, would be the best beneficiaries from such an event, while the US Dollar would be the obvious loser. The stock market would likely go into a bear market on growth fears, while long-term interest rates would increase (the opposite of what Trump wants).
The negative consequences though would stretch to the global economy as a whole. The Federal Reserve is the anchor of the global financial system. The U.S. Treasuries are considered the benchmark “risk-free rate” and almost all global debt is priced as US Treasury rate + risk spread. If long term rates were to increase in the US, they would also influence long-term interest rates of other major economies. The initial reaction would highly likely be chaos and uncertainty in the global financial markets.
The good news is that even if the DOJ were to officially indict Powell for “misleading Congress” or “misuse of funds”, and Trump were to fire Powell “for cause”, the Fed Chair has already signalled that he would fight any removal in court, much like what happened with Fed’s Cook. The ultimate decision would likely rest with the US Supreme Court.
Nevertheless, the initial reaction to the DOJ indictment would be similar to the one we saw today, but bigger in magnitude.
This article was written by Giuseppe Dellamotta at investinglive.com.
Monday 12th January 2026: Technical Outlook and Review
January 12, 2026 16:00 ICMarkets Market News
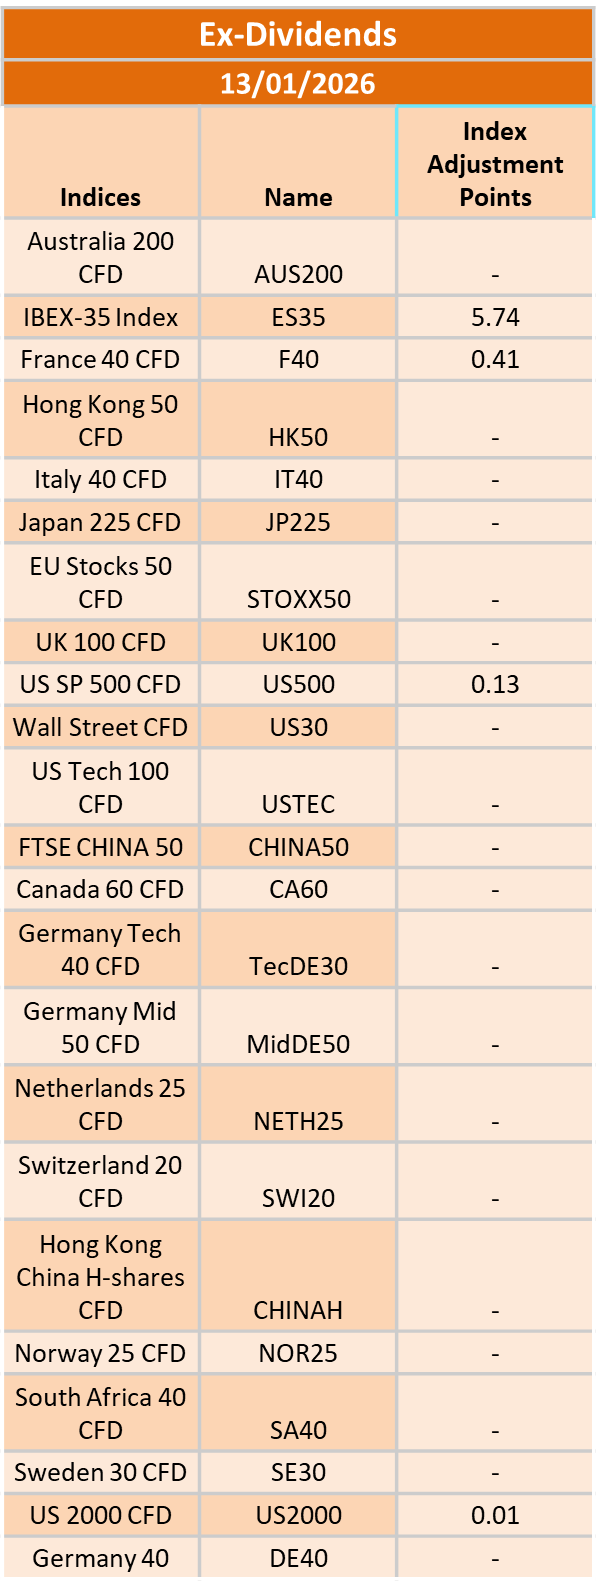
DXY (U.S. Dollar Index):
Potential Direction: Bullish
Overall momentum of the chart: Bearish
The price has already bounced off the pivot and may continue its bullish move toward the 1st resistance
Pivot: 97.74
Supporting reasons: Identified as an overlap support that aligns with the 61.8% Fibonacci retracement, where renewed buying pressure could emerge to push the price higher.
1st support: 96.37
Supporting reasons: Identified as a swing low support, indicating a potential area where the price could again stabilize.
1st resistance: 99.22
Supporting reasons: Identified as an overlap resistance, indicating a potential area that could halt any further upward movement
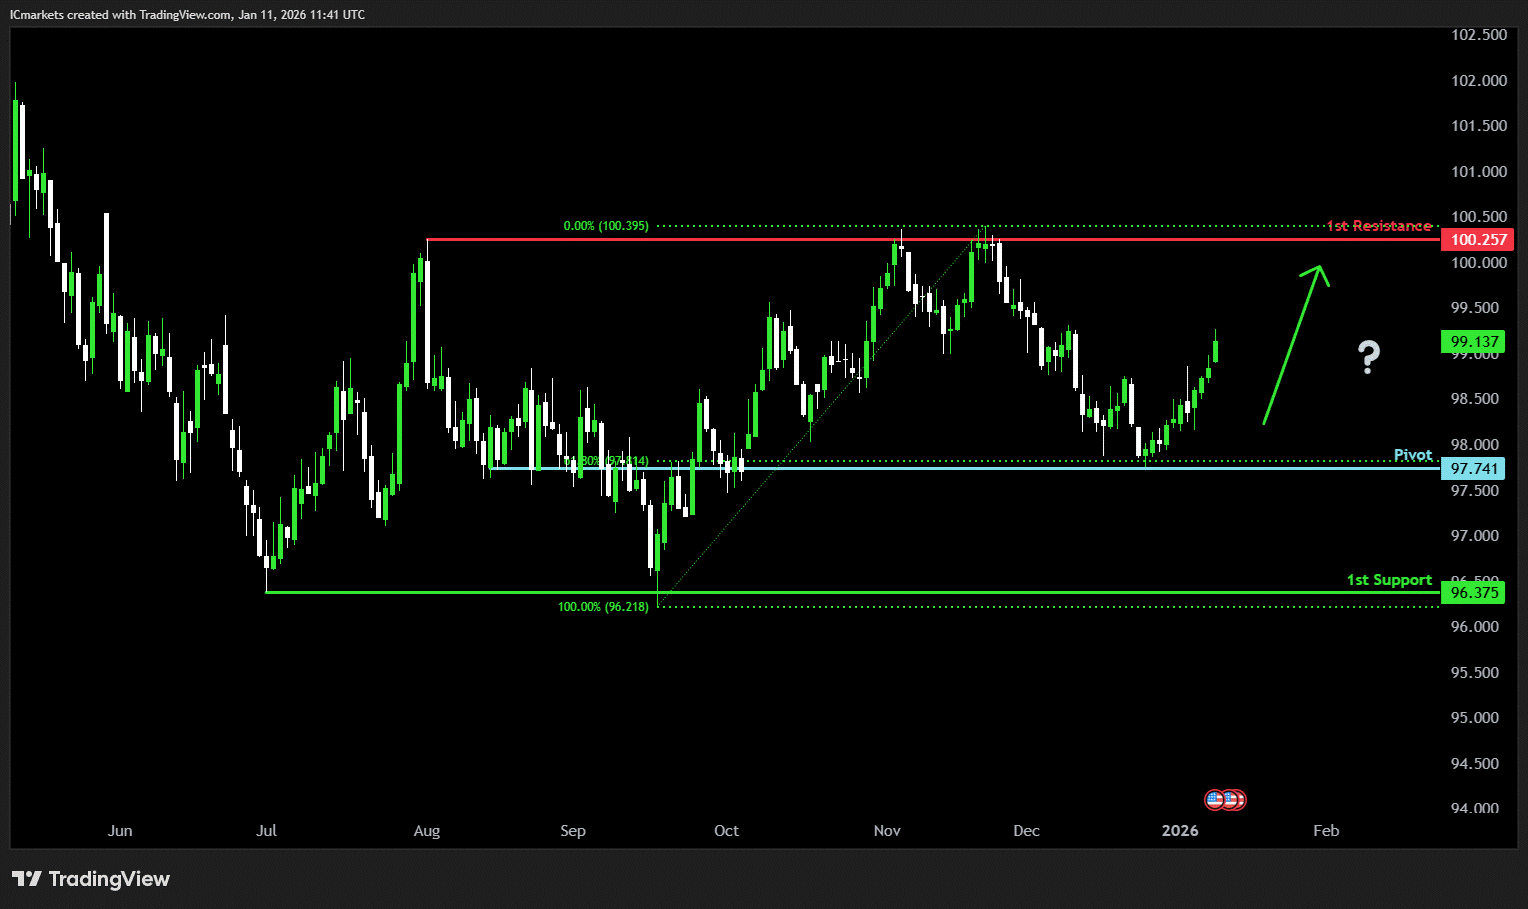
EUR/USD:
Potential Direction: Bearish
Overall momentum of the chart: Bullish
The price has already reacted off the pivot and may continue its bearish move toward the 1st support.
Pivot: 1.1770
Supporting reasons: Identified as an overlap resistance that aligns closely with the 61.8% Fibonacci retracement, where selling pressures could intensify and potentially cap any upward retracement.
1st support: 1.1552
Supporting reasons: Identified as a pullback support that aligns with the 78.6% Fibonacci retracement, indicating a potential level where the price could stabilize once again.
1st resistance: 1.1919
Supporting reasons: Identified as a swing high resistance, indicating a potential level that could cap further upward movement.
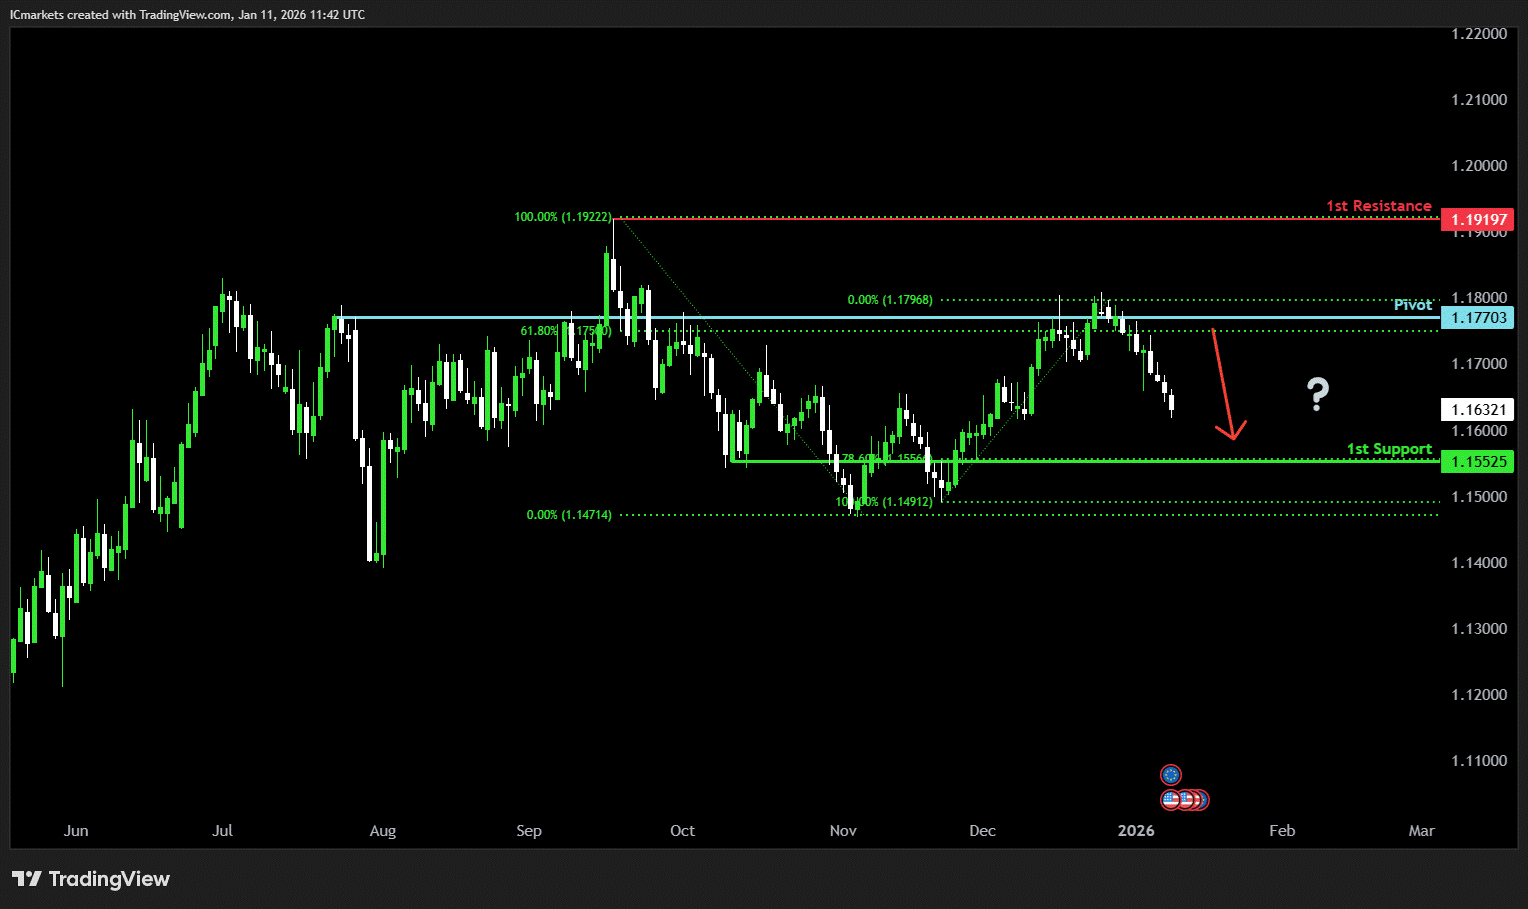
EUR/JPY:
Potential Direction: Bullish
Overall momentum of the chart: Bullish
The price could make a short-term pullback toward the pivot before rising again toward the 1st resistance.
Pivot: 181.62
Supporting reasons: Identified as an overlap support, where renewed buying pressure could emerge to push the price higher.
1st support: 177.97
Supporting reasons: Identified as a pullback support, indicating a potential area where the price could again stabilize.
1st resistance: 188.13
Supporting reasons: Identified as a resistance that is supported by the 161.8% Fibonacci extension, indicating a potential level that could cap further upward movement.
EUR/GBP:
Potential Direction: Bearish
Overall momentum of the chart: Bullish
The price could see a short-term pullback toward the pivot before continuing its bearish move down toward the 1st support.
Pivot: 0.8721
Supporting reasons: Identified as a pullback resistance, where selling pressures could intensify and potentially cap any upward retracement.
1st support: 0.8607
Supporting reasons: Identified as an overlap support, indicating a potential area where the price could stabilize once more.
1st resistance: 0.8838
Supporting reasons: Identified as a swing high resistance, indicating a potential level that could cap further upward movement.
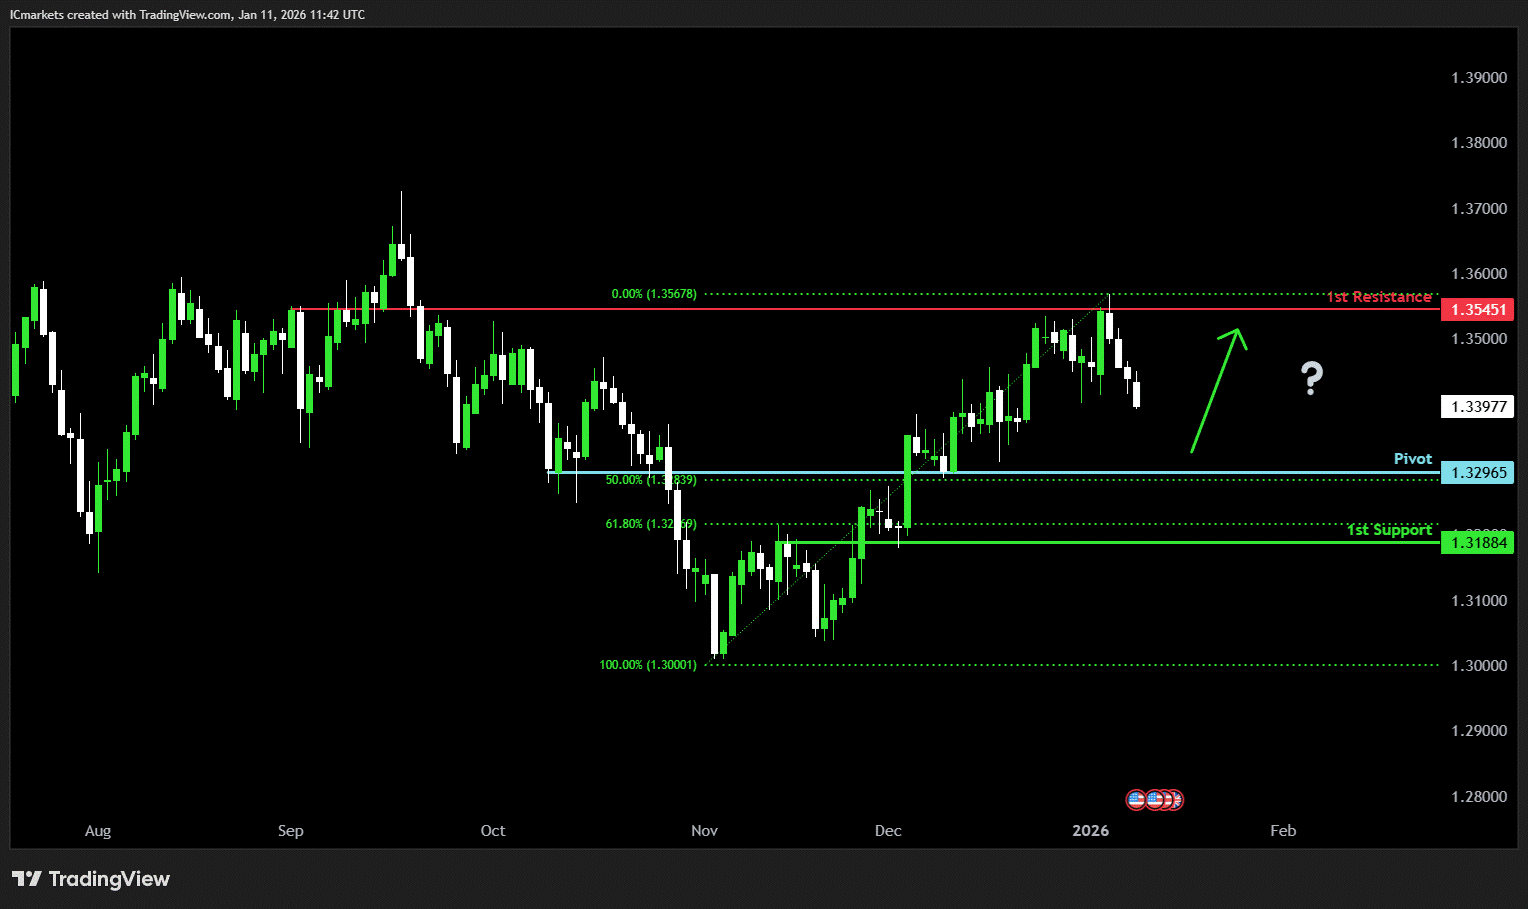
GBP/USD:
Potential Direction: Bullish
Overall momentum of the chart: Bullish
The price could make a short-term pullback toward the pivot before rising again toward the 1st resistance.
Pivot: 1.3296
Supporting reasons: Identified as a pullback support that aligns with the 50% Fibonacci retracement, where renewed buying pressure could emerge to push the price higher.
1st support: 1.3188
Supporting reasons: Identified as an overlap support that aligns with the 61.8% Fibonacci retracement, indicating a potential area where the price could stabilize once more.
1st resistance: 1.3545
Supporting reasons: Identified as an overlap resistance, indicating a potential level that could halt further upward movement.
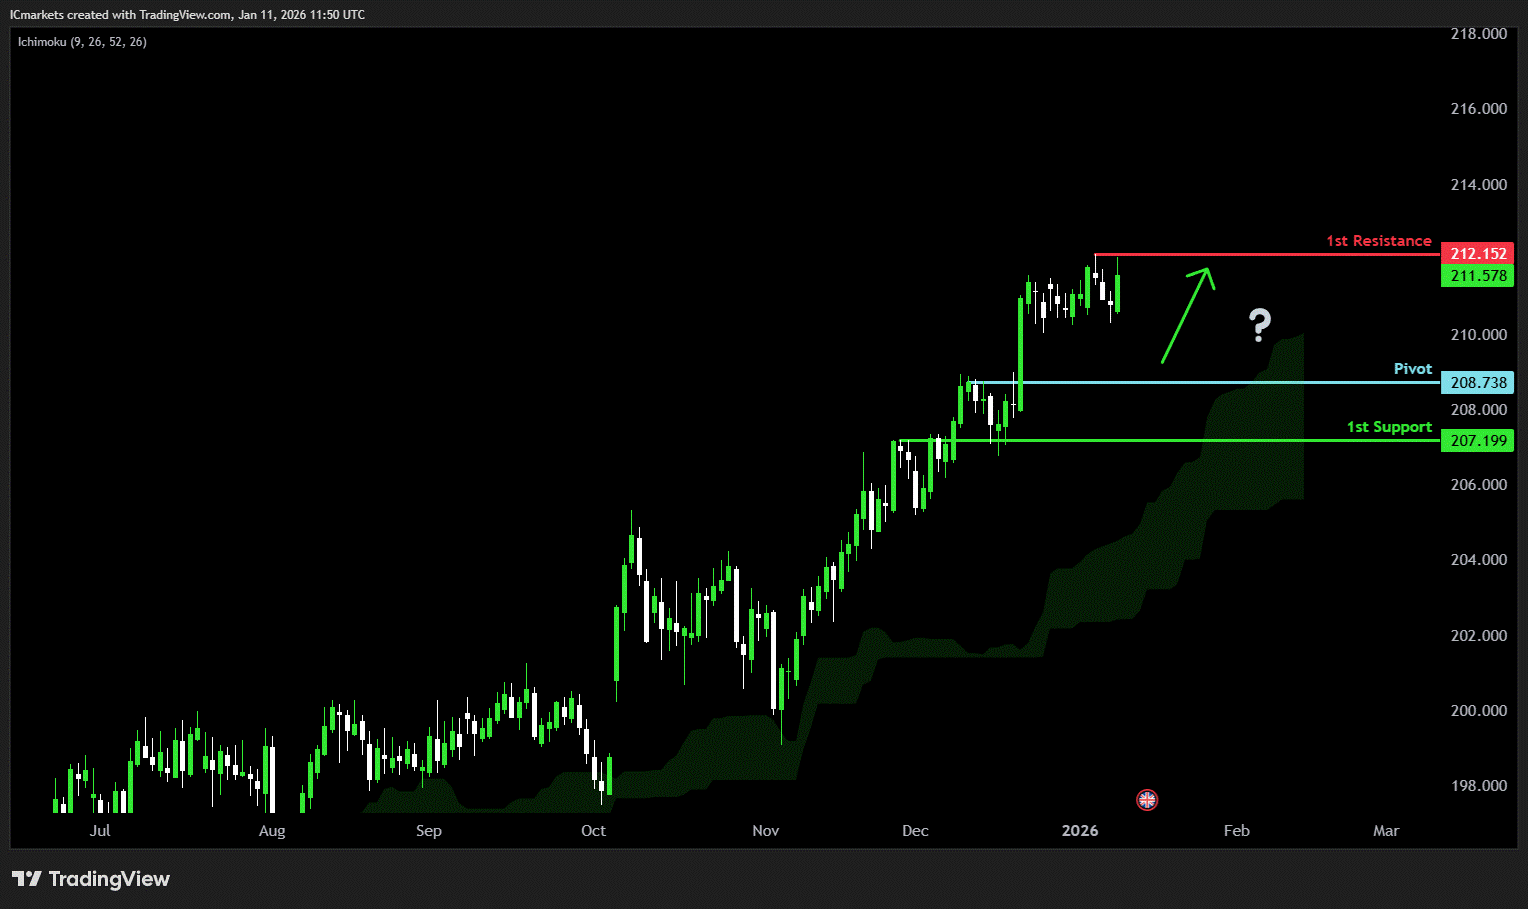
GBP/JPY:
Potential Direction: Bullish
Overall momentum of the chart: Bullish
The price could make a short-term pullback toward the pivot before rising again toward the 1st resistance
Pivot: 208.73
Supporting reasons: Identified as a pullback support, where renewed buying pressure could emerge to push the price higher.
1st support: 207.19
Supporting reasons: Identified as an overlap support, indicating a potential level where the price could stabilize once more.
1st resistance: 212.15
Supporting reasons: Identified as a swing high resistance, indicating a potential level that could halt further upward movement.
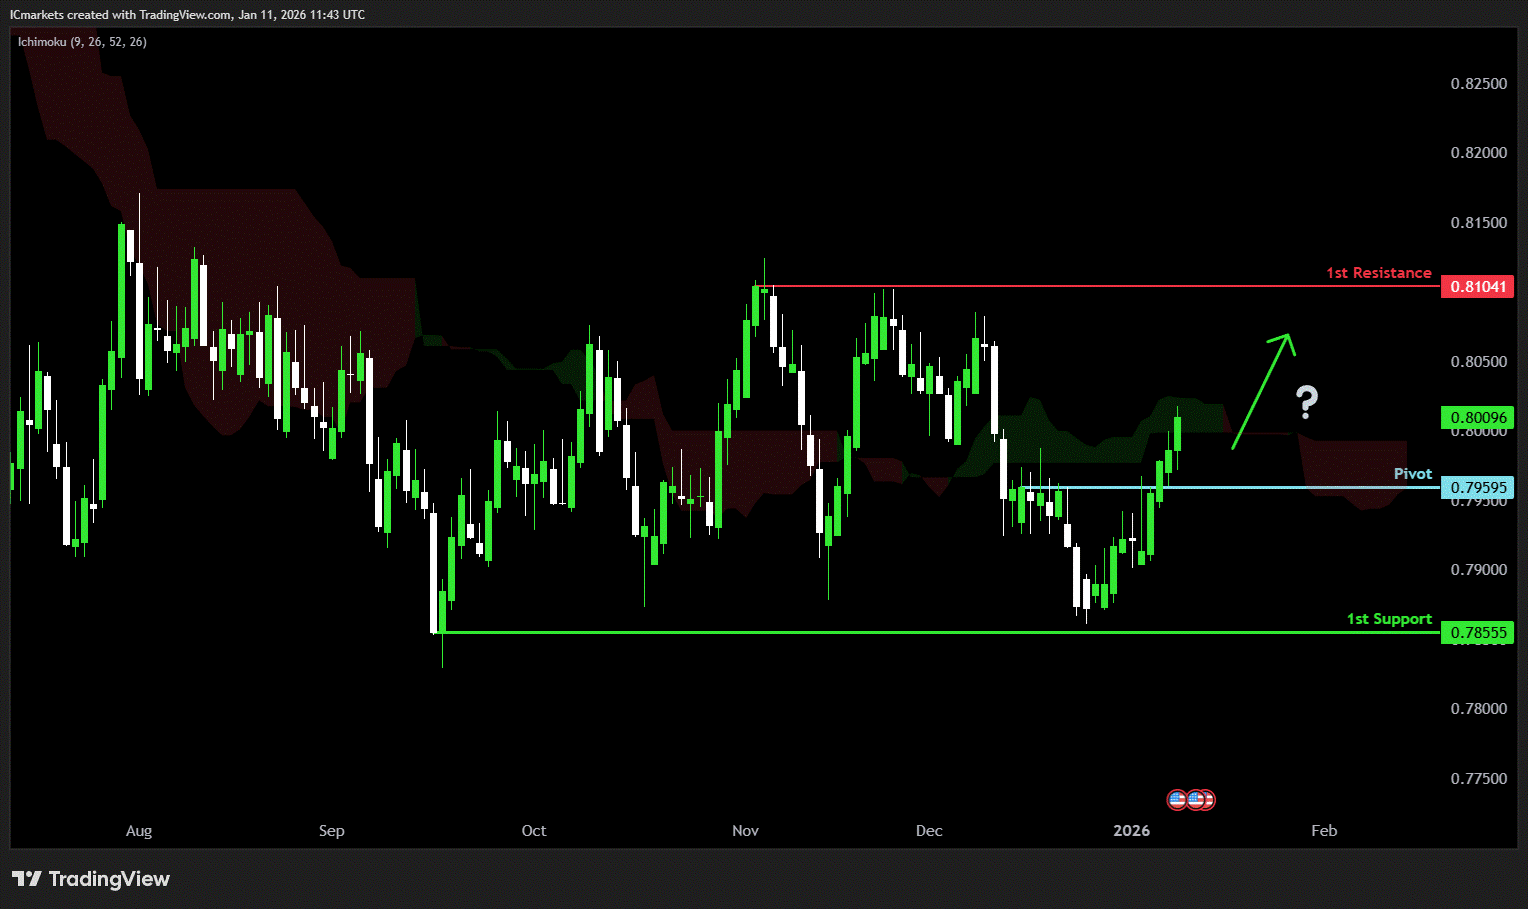
USD/CHF:
Potential Direction: Bullish
Overall momentum of the chart: Bearish
The price could make a short-term pullback toward the pivot before rising again toward the 1st resistance
Pivot: 0.7959
Supporting reasons: Identified as a pullback support, where renewed buying pressure could emerge to push the price higher.
1st support: 0.7855
Supporting reasons: Identified as a multi-swing low support, indicating a potential level where the price could stabilize once again.
1st resistance: 0.8104
Supporting reasons: Identified as a swing high resistance, indicating a potential level that could cap further upward movement.
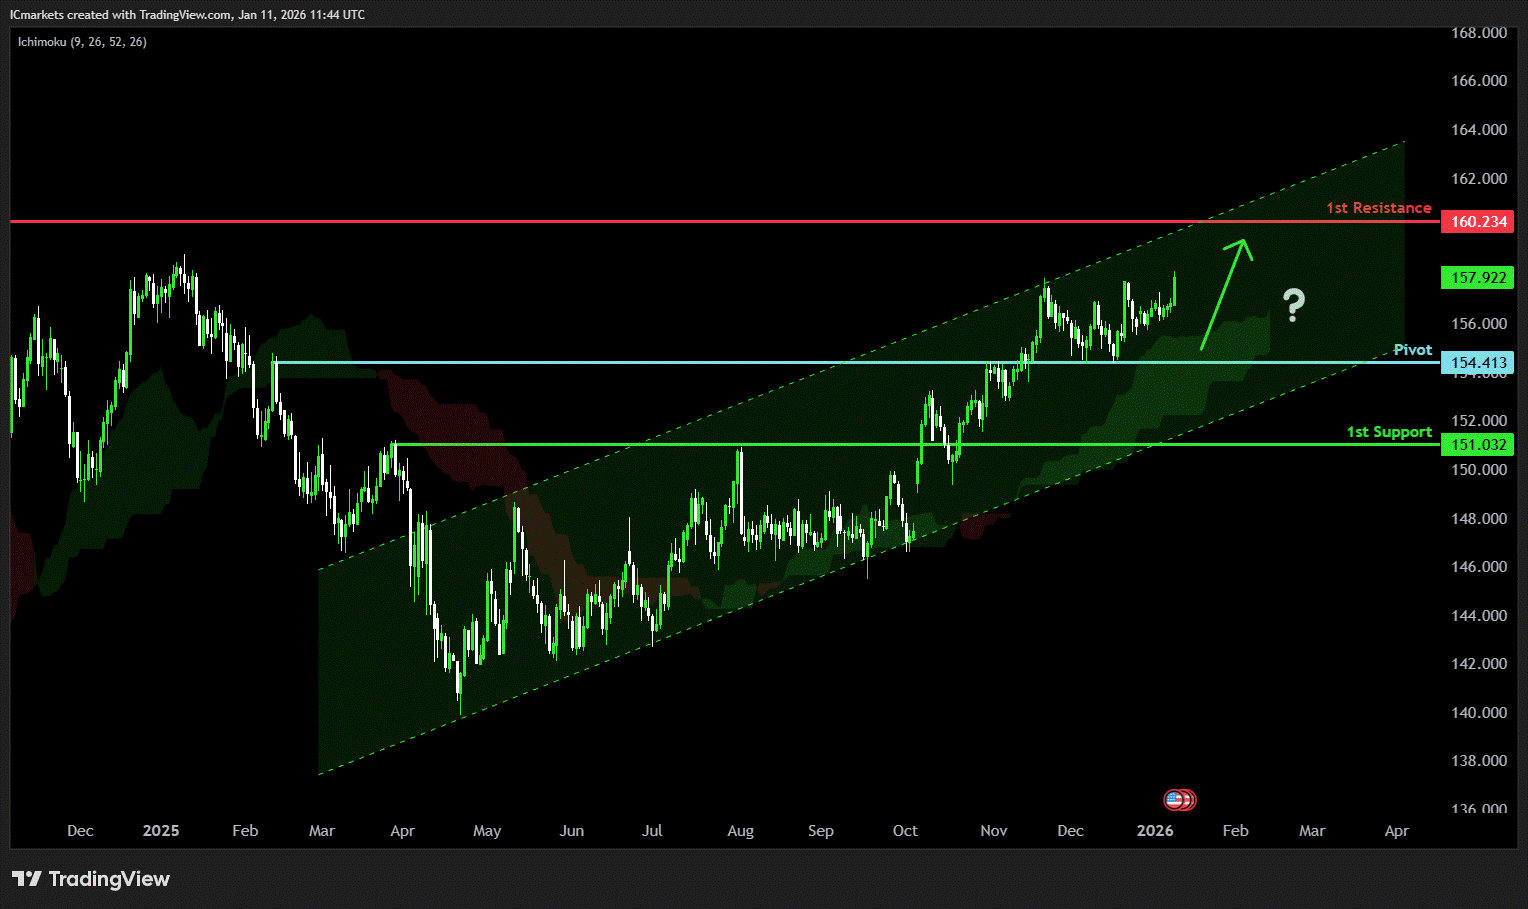
USD/JPY:
Potential Direction: Bullish
Overall momentum of the chart: Bullish
The price has already bounced off the pivot and may continue its bullish move toward the 1st resistance
Pivot: 154.41
Supporting reasons: Identified as a pullback support, where renewed buying pressure could emerge to push the price higher.
1st support: 151.03
Supporting reasons: Identified as a pullback support, indicating a strong area where buyers might return, and the price could stabilize once again.
1st resistance: 160.23
Supporting reasons: Identified as a pullback resistance. This level represents the next key area where upward movement could be capped amid increased selling pressure
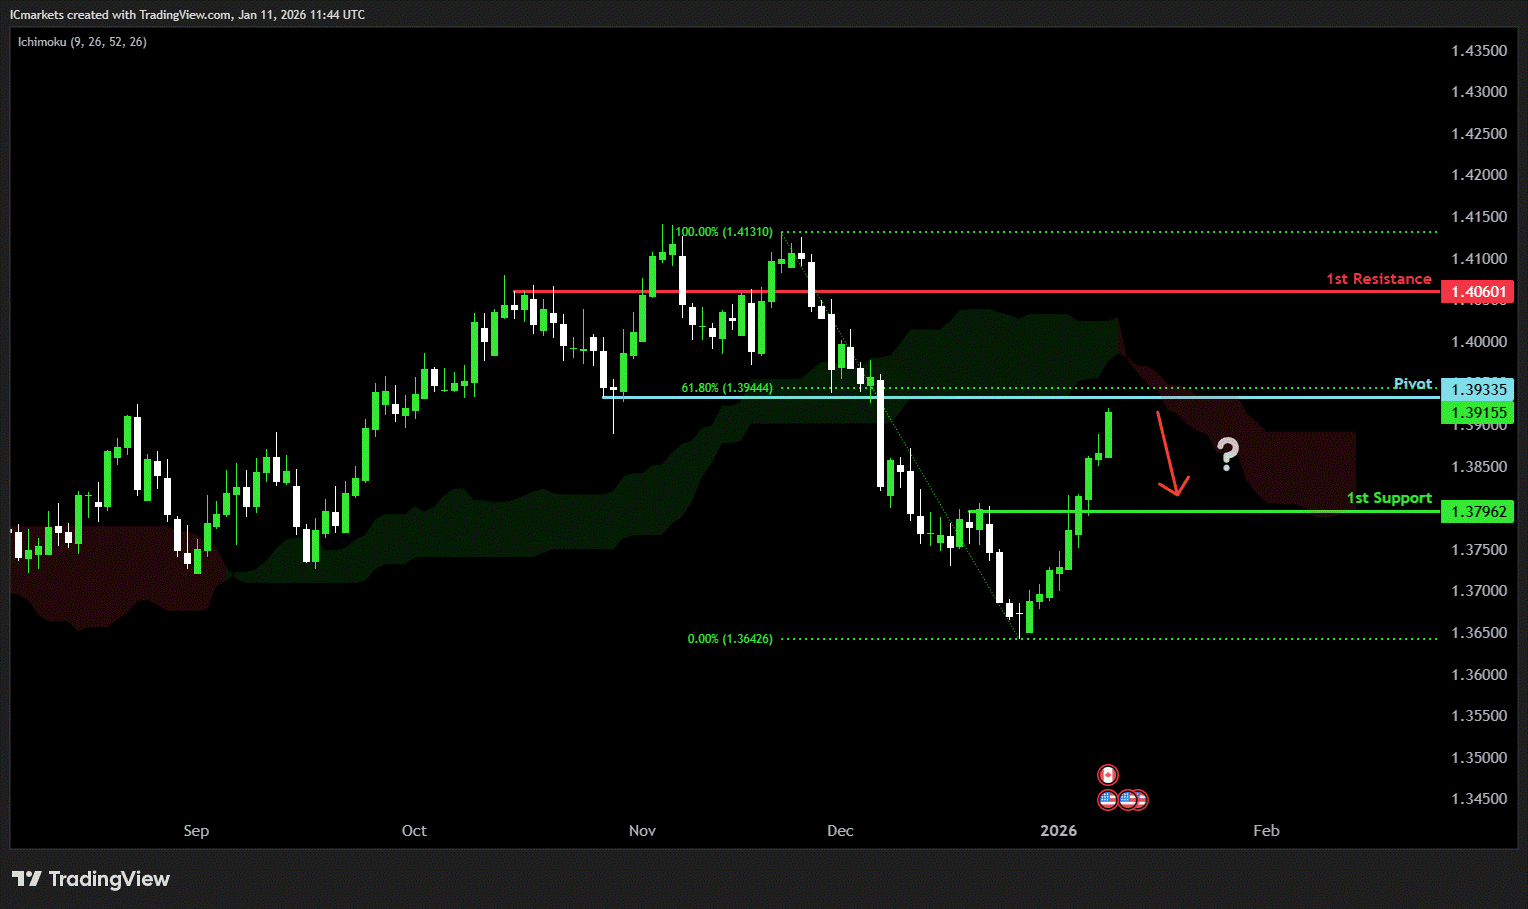
USD/CAD:
Potential Direction: Bearish
Overall momentum of the chart: Bearish
The price could see a short-term pullback toward the pivot before continuing its bearish move down toward the 1st support.
Pivot: 1.3933
Supporting reasons: Identified as a pullback resistance that aligns with the 61.8% Fibonacci retracement, where selling pressures could intensify and potentially cap any upward retracement.
1st support: 1.3796
Supporting reasons: Identified as a pullback support, indicating a key level where the price could stabilize once more.
1st resistance: 1.4060
Supporting reasons: Identified as a pullback resistance, making it a possible target for bullish advances and a level where some sellers could return to cap gains
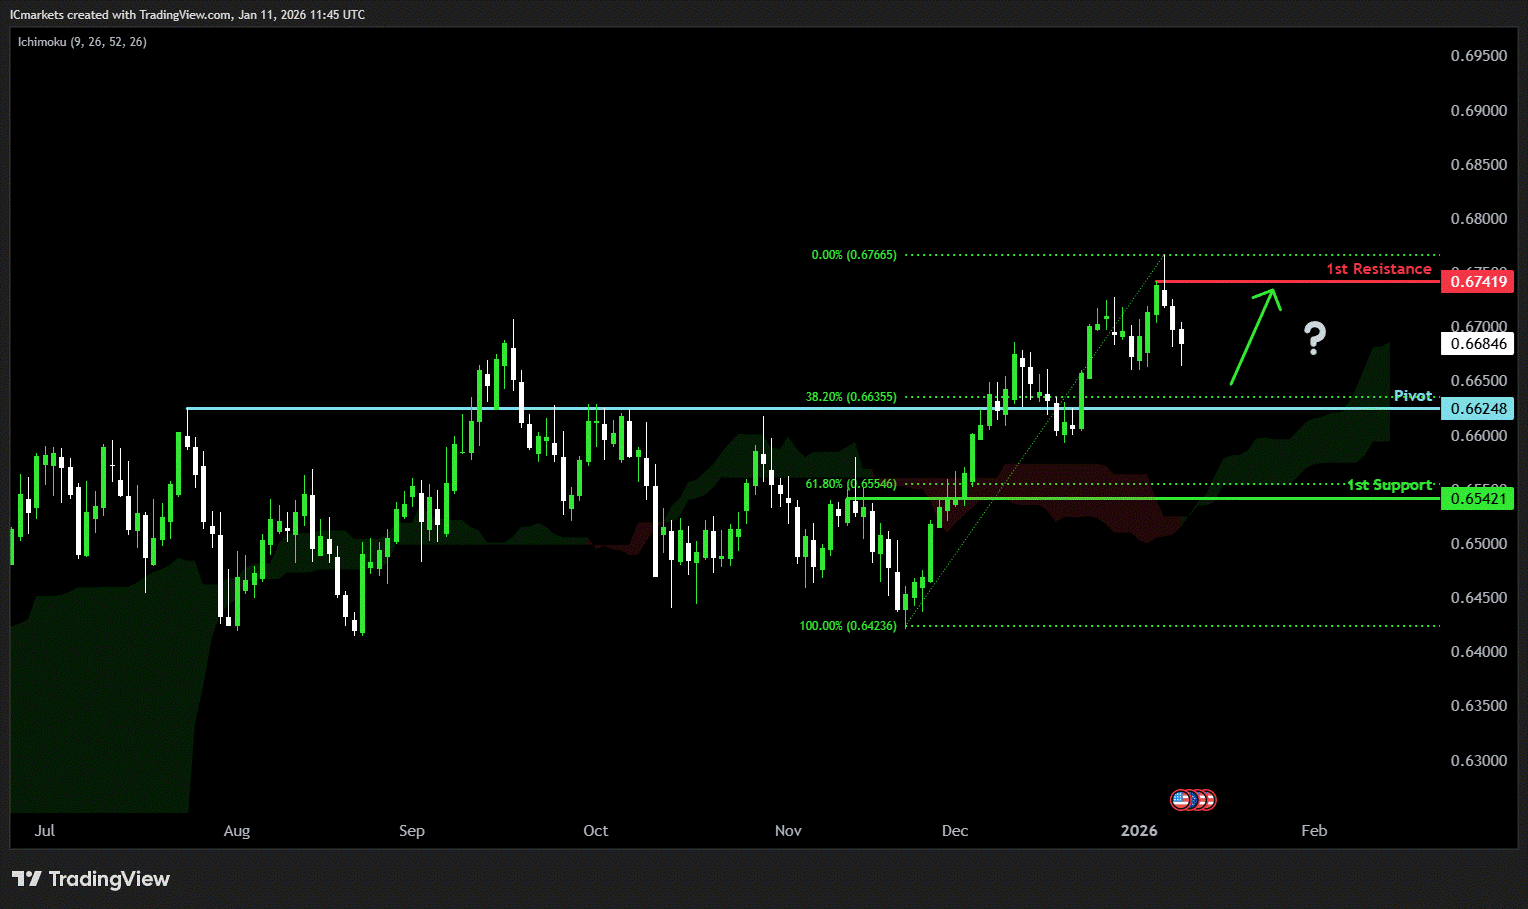
AUD/USD:
Potential Direction: Bullish
Overall momentum of the chart: Bullish
The price could make a short-term pullback toward the pivot before rising again toward the 1st resistance
Pivot: 0.6624
Supporting reasons: Identified as a pullback support that aligns with the 38.2% Fibonacci retracement, where renewed buying pressure could emerge to push the price higher.
1st support: 0.6542
Supporting reasons: Identified as a pullback support that aligns with the 61.8% Fibonacci retracement, this area has provided strong support historically and may attract buying interest for a potential short-term bounce
1st resistance: 0.6741
Supporting reasons: Identified as a swing high resistance, indicating a potential area that could halt any further upward movement.
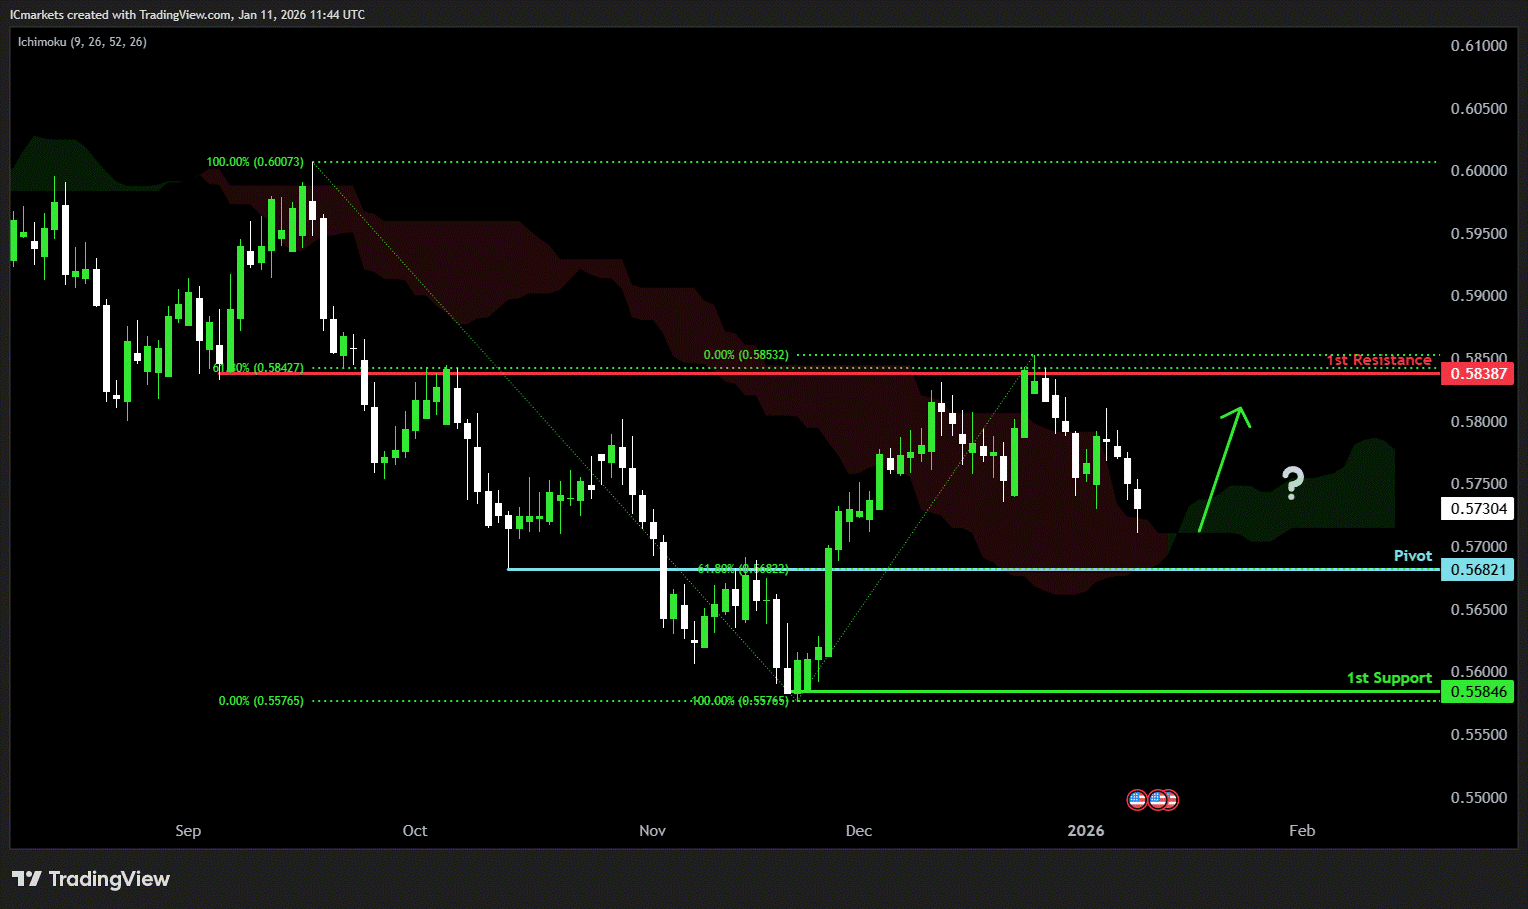
NZD/USD
Potential Direction: Bullish
Overall momentum of the chart: Bearish
The price could make a short-term pullback toward the pivot before rising again toward the 1st resistance
Pivot: 0.5682
Supporting reasons: Identified as a pullback support that aligns with the 61.8% Fibonacci retracement, where renewed buying pressure could emerge to push the price higher.
1st support: 0.5584
Supporting reasons: Identified as a swing low support, this area has provided strong support historically and may attract buying interest for a potential short-term bounce
1st resistance: 0.5838
Supporting reasons: Identified as an overlap resistance that aligns with the 61.8% Fibonacci retracement, indicating a potential area that could halt any further upward movement.
US30 (DJIA):
Potential Direction: Bullish
Overall momentum of the chart: Bullish
The price could make a short-term pullback toward the pivot before rising again toward the 1st resistance
Pivot: 48,827.16
Supporting reasons: Identified as an overlap support, where renewed buying pressure could emerge to push the price higher.
1st support: 47,713.62
Supporting reasons: Identified as an overlap support, suggesting a potential area where the price could stabilize once again.
1st resistance: 50,049.13
Supporting reasons: Identified as a resistance that is supported by the 161.8% Fibonacci extension, indicating a potential area that could halt any further upward movement.

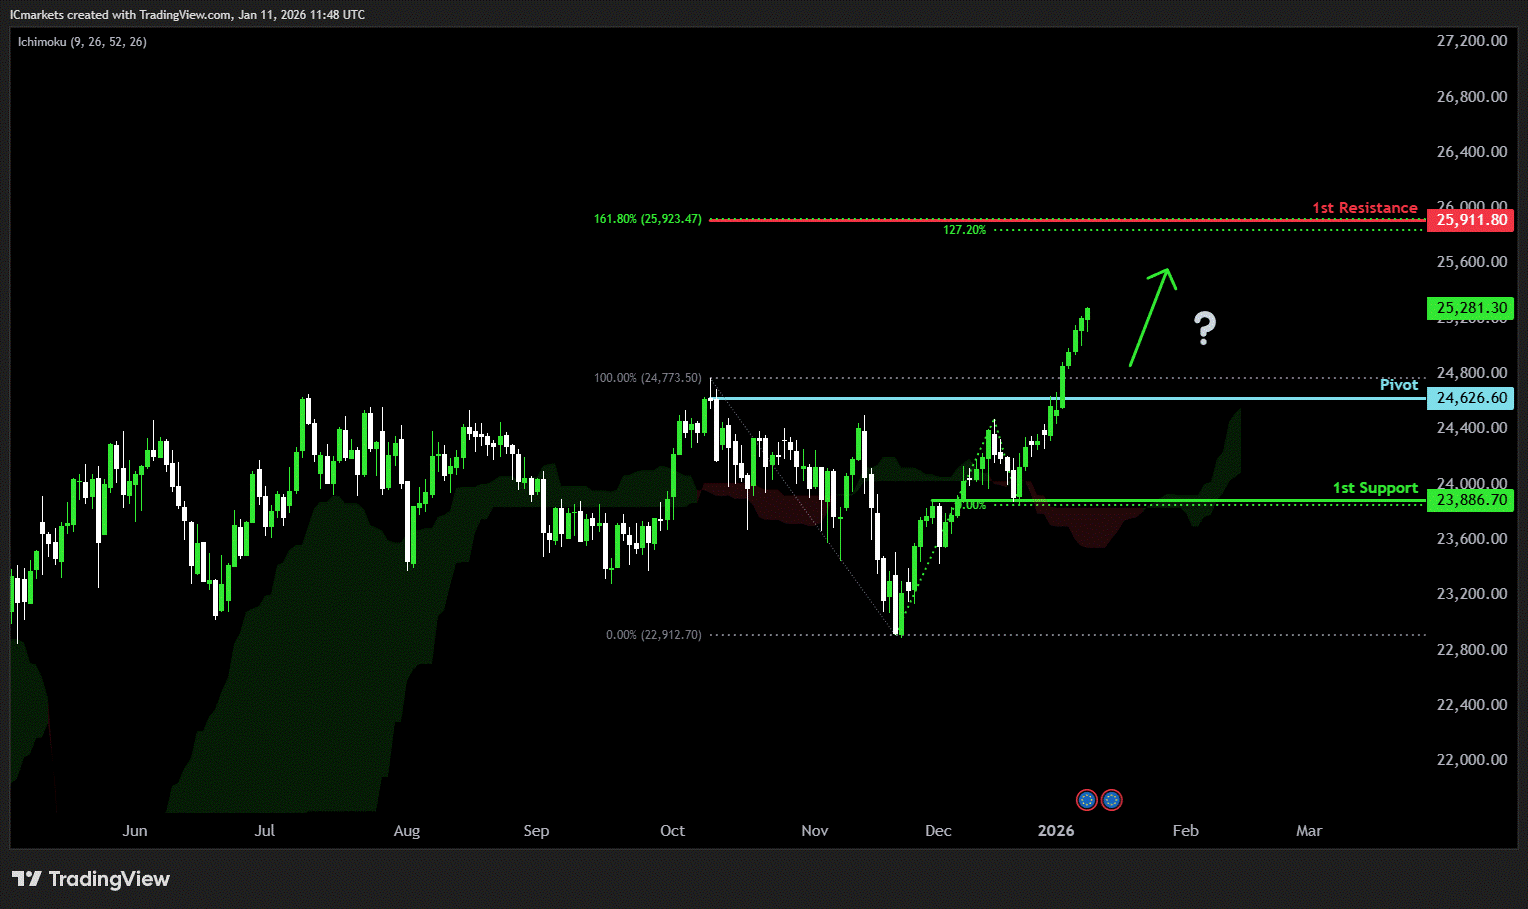
DE40 (DAX):
Potential Direction: Bullish
Overall momentum of the chart: Bullish
The price could make a short-term pullback toward the pivot before rising again toward the 1st resistance
Pivot: 24,626.60
Supporting reasons: Identified as a pullback support, where renewed buying pressure could emerge to push the price higher.
1st support: 23,886.70
Supporting reasons: Identified as an overlap support, indicating a key level where the price could stabilize once more.
1st resistance: 25,911.80
Supporting reasons: Identified as a resistance that is supported by the 161.8%% Fibonacci extension and the 127.2% Fibonacci projection, indicating a potential area that could halt any further upward movement.
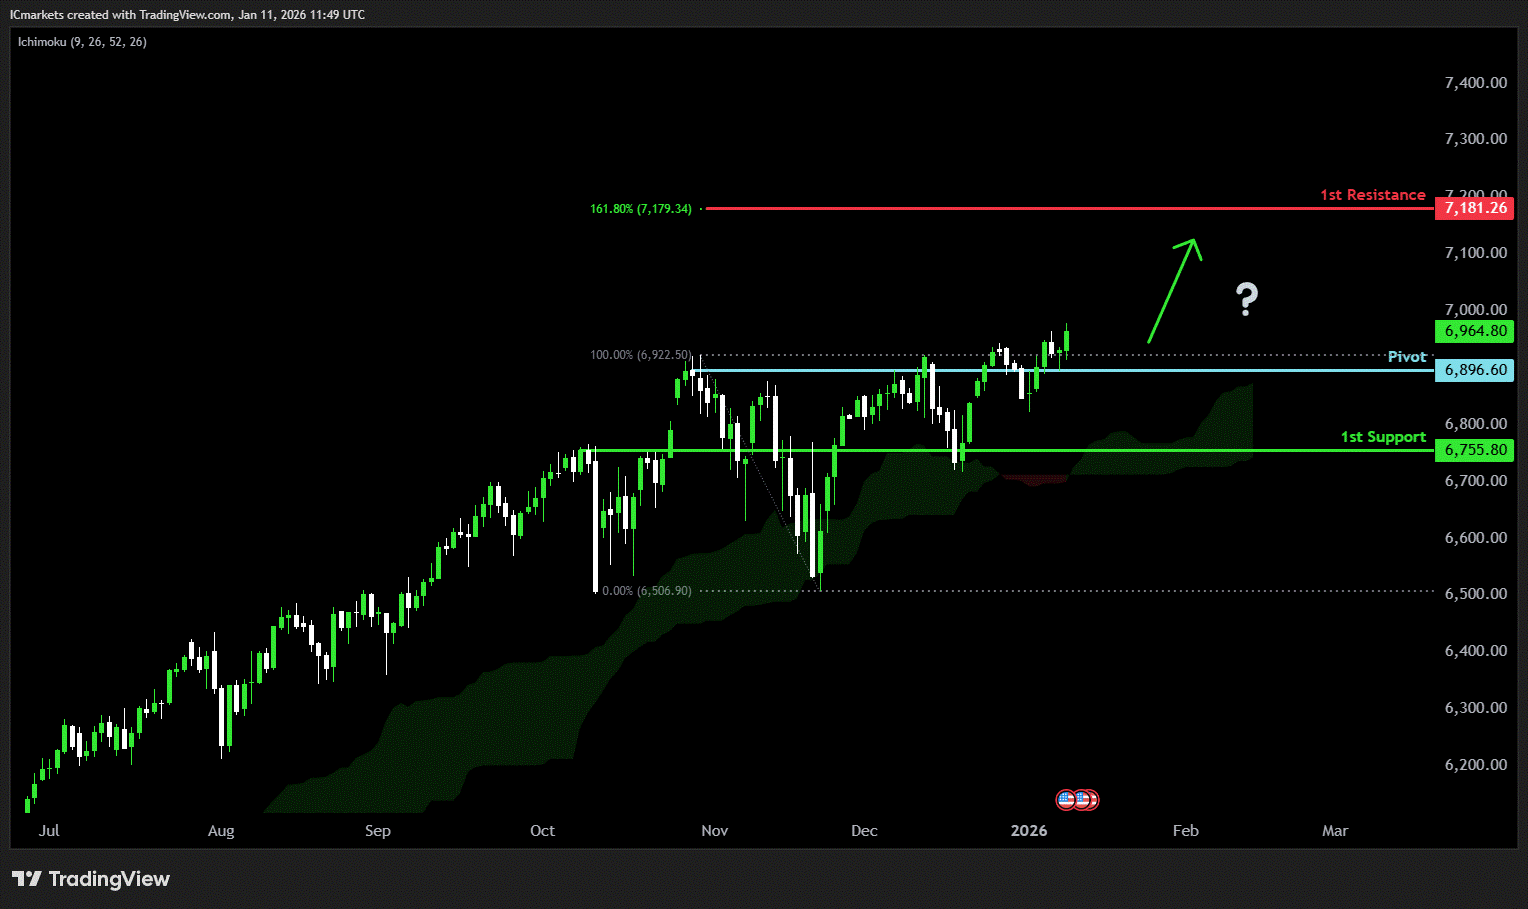
US500 (S&P 500):
Potential Direction: Bullish
Overall momentum of the chart: Bullish
The price could make a short-term pullback toward the pivot before rising again toward the 1st resistance
Pivot: 6,896.60
Supporting reasons: Identified as a pullback support, where renewed buying pressure could emerge to push the price higher.
1st support: 6,755.80
Supporting reasons: Identified as an overlap support, indicating a potential level where the price could stabilize once again.
1st resistance:7,181.26
Supporting reasons: Identified as a resistance that is supported by the 161.8%% Fibonacci extension, indicating a potential area that could halt any further upward movement.
BTC/USD (Bitcoin):
Potential Direction: Bearish
Overall momentum of the chart: Bullish
The price has already reacted off the pivot and may continue its bearish move toward the 1st support.
Pivot: 94,255.27
Supporting reasons: Identified as a pullback resistance that aligns with the 50% Fibonacci retracement, where selling pressures could intensify and potentially cap any upward retracement.
1st support: 80,712.26
Supporting reasons: Identified as an overlap support, indicating a potential level where the price could stabilize once more.
1st resistance: 106,846.29
Supporting reasons: Identified as an overlap resistance, indicating a potential area that could halt any further upward movement.

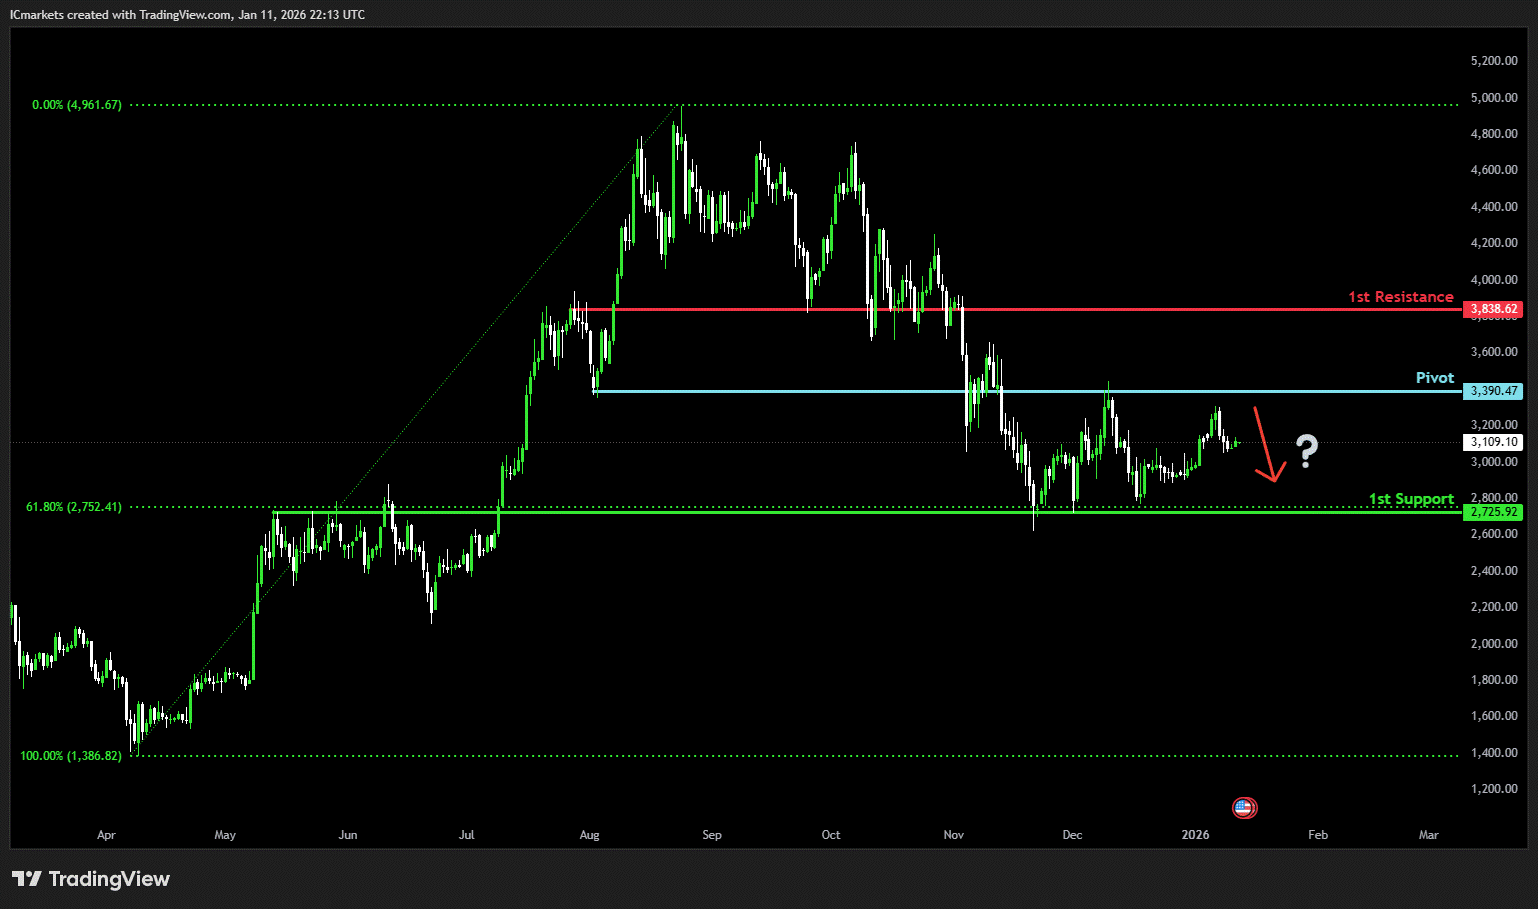
ETH/USD (Ethereum):
Potential Direction: Bearish
Overall momentum of the chart: Bullish
The price could see a short-term pullback toward the pivot before continuing its bearish move down toward the 1st support.
Pivot: 3,390.47
Supporting reasons: Identified as a pullback resistance, where selling pressures could intensify and potentially cap any upward retracement.
1st support: 2,725.92
Supporting reasons: Identified as an overlap support that aligns with the 61.8% Fibonacci retracement, indicating a potential level where the price could stabilize once more.
1st resistance: 3,838.62
Supporting reasons: Identified as a pullback resistance, indicating a potential area that could halt any further upward movement.
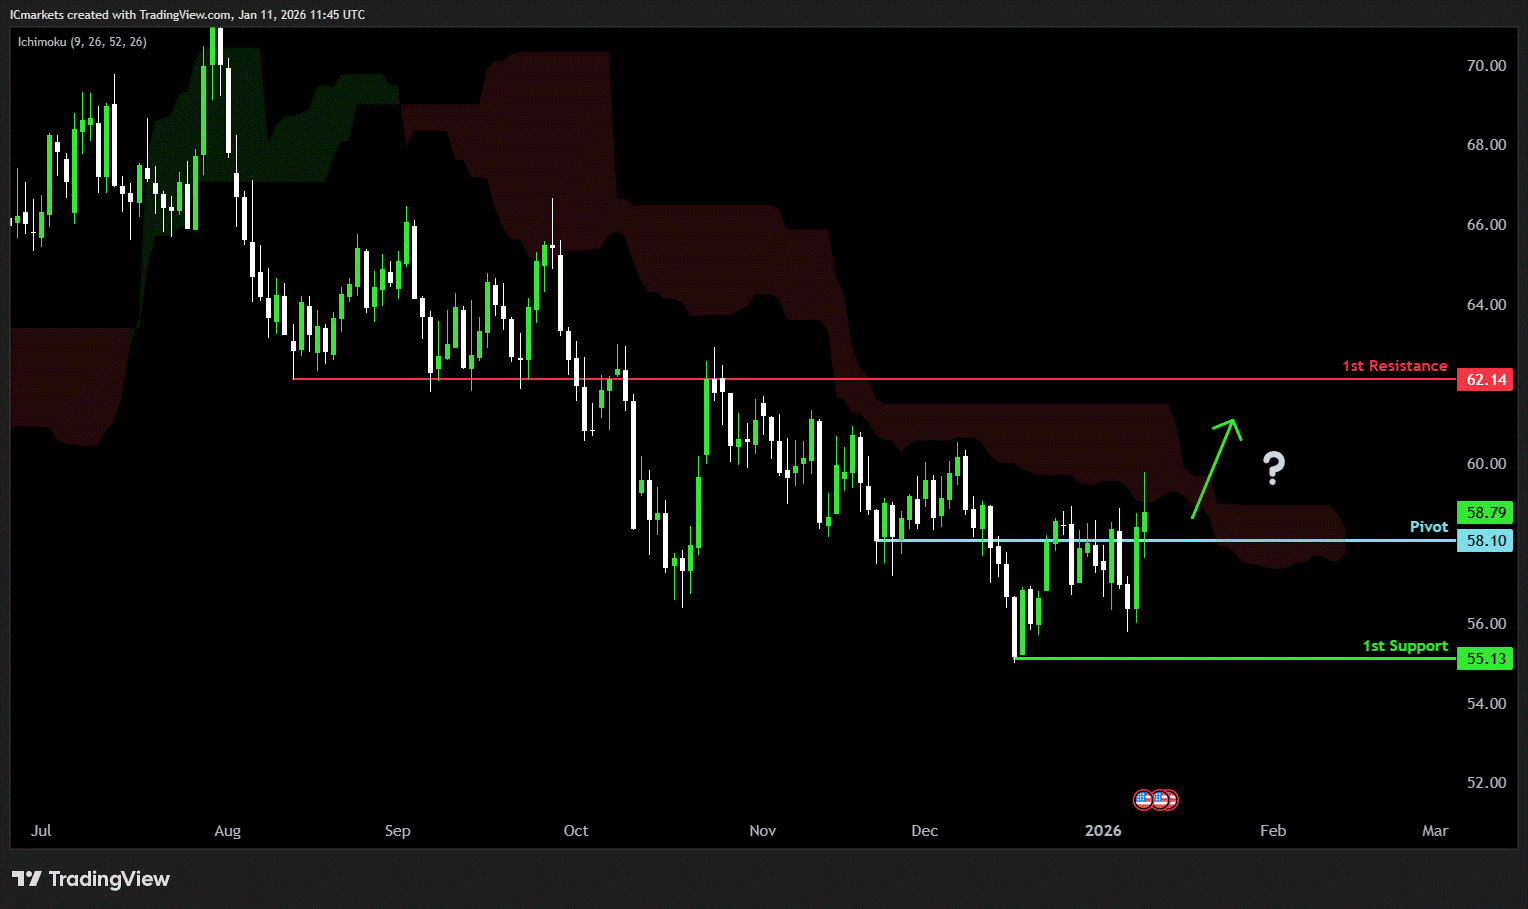
WTI/USD (Oil):
Potential Direction: Bullish
Overall momentum of the chart: Bullish
The price could make a short-term pullback toward the pivot before rising again toward the 1st resistance
Pivot: 58.10
Supporting reasons: Identified as a pullback support, where renewed buying pressure could emerge to push the price higher.
1st support: 55.13
Supporting reasons: Identified as a swing low support, indicating a key level where the price could stabilize once more.
1st resistance: 62.14
Supporting reasons: Identified as an overlap resistance, indicating a potential area that could halt any further upward movement.
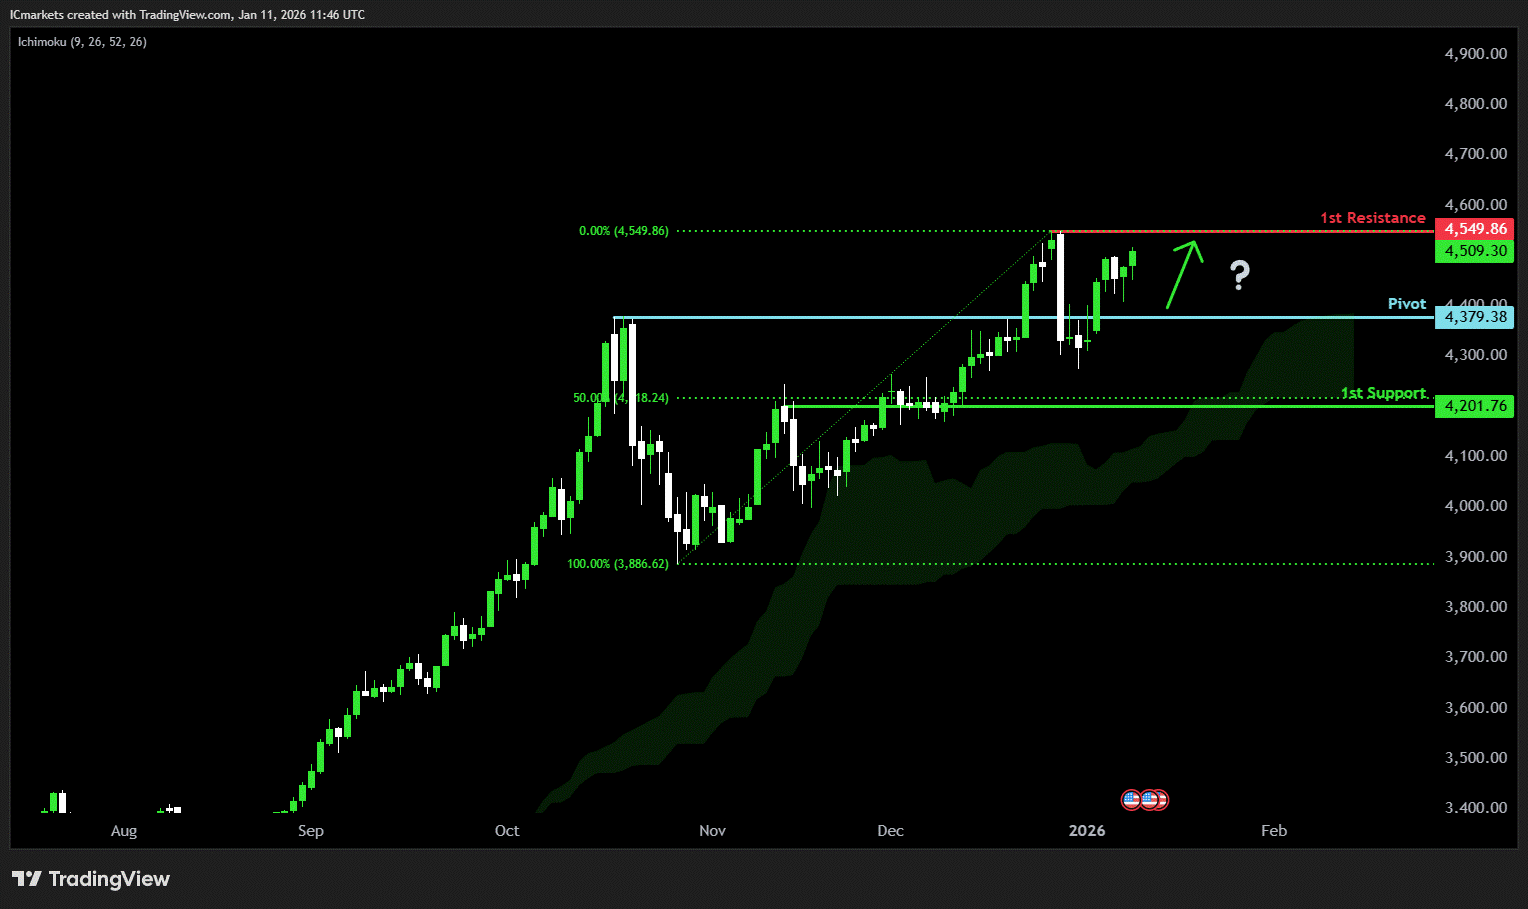
XAU/USD (GOLD):
Potential Direction: Bullish
Overall momentum of the chart: Bullish
The price could make a short-term pullback toward the pivot before rising again toward the 1st resistance
Pivot: 4,379.38
Supporting reasons: Identified as a pullback support, where renewed buying pressure could emerge to push the price higher.
1st support: 4,201.75
Supporting reasons: Identified as a pullback support that aligns with the 50% Fibonacci retracement, indicating a key level where the price could stabilize once more.
1st resistance: 4,549.86
Supporting reasons: Identified as a swing high resistance, indicating a potential area that could halt any further upward movement.
The accuracy, completeness and timeliness of the information contained on this site cannot be guaranteed. IC Markets Global does not warranty, guarantee or make any representations, or assume any liability regarding financial results based on the use of the information in the site.
News, views, opinions, recommendations and other information obtained from sources outside of www.icmarkets.com, used in this site are believed to be reliable, but we cannot guarantee their accuracy or completeness. All such information is subject to change at any time without notice. IC Markets Global assumes no responsibility for the content of any linked site.
The fact that such links may exist does not indicate approval or endorsement of any material contained on any linked site. IC Markets Global is not liable for any harm caused by the transmission, through accessing the services or information on this site, of a computer virus, or other computer code or programming device that might be used to access, delete, damage, disable, disrupt or otherwise impede in any manner, the operation of the site or of any user’s software, hardware, data or property.
The post Monday 12th January 2026: Technical Outlook and Review first appeared on IC Markets | Official Blog.
The Week Ahead – Week Commencing 12 January 2026
January 12, 2026 16:00 ICMarkets Market News
The first trading week of the new year has come and gone, and it is very much a case of so far, so good for investors. Risk sentiment has remained resilient, with global equity markets continuing to trade near record levels despite elevated geopolitical tensions and the first major US data release of the year.
US employment data on Friday came in relatively close to market expectations, locking in a hold from the Fed this month but also encouraging market pricing of more rate cuts later in the year.
It looks like being another busy week ahead, with geopolitical tensions likely to remain high across the globe, more key US data due out, and the first earnings reports of 2026 scheduled.
Here is our usual day-by-day breakdown of the major risk events this week:

It is a quiet start on the economic calendar on Monday, with very little scheduled across all three trading sessions. Japanese markets are closed for a bank holiday, which may affect liquidity early in the day; however, most traders are expecting updates on geopolitical events to drive any fresh moves.

There is little scheduled again in the first two trading sessions on Tuesday; however, things should get interesting once New York enters the fray, with the main event of the week, the US CPI data release, scheduled shortly after the open. US New Home Sales numbers are also set to be released; however, expect the inflation numbers to dominate.

It’s a very similar setup on Wednesday for investors, with little scheduled in the Asian and London sessions but more key data in the US. This time, it is US PPI numbers scheduled alongside the latest Retail Sales numbers. We also hear from Fed members Miran, Kashkari, and Williams during the day.

There is little again of note on the calendar in the Asian session; however, there will be a strong focus on UK markets once Europe opens, with the key UK GDP data due for release. There is more US data scheduled shortly after the US open, with Weekly Unemployment Claims, the Empire State Manufacturing Index, and the Philly Fed Manufacturing Index numbers all due out at the same time. Fed members Barkin and Bostic are also scheduled to speak.

It is a quiet Friday to close out the trading week, with little scheduled across all three trading sessions again; however, traders will continue to monitor newswires for fresh geopolitical updates for any changes in sentiment.
The post The Week Ahead – Week Commencing 12 January 2026 first appeared on IC Markets | Official Blog.
General Market Analysis – 12/01/26
January 12, 2026 15:39 ICMarkets Market News
US Stocks Hit Record Levels After Weaker Non-Farms – S&P up 0.65%
US equity markets extended their rally on Friday, with stocks closing at or near record levels after US employment data came in slightly below expectations. The Dow gained 0.48% to close at 49,504, while the S&P 500 rose 0.65% to 6,966, and the Nasdaq outperformed with a 0.81% advance to finish at 23,671. Despite the softer headline jobs data, the unemployment rate fell, and shorter-dated US yields pushed higher. The US 2-year Treasury yield climbed 4.4 basis points to 3.532%, while the 10-year yield was little changed, slipping 0.2 basis points to 4.165%. The shift in rate expectations supported the US dollar, with the dollar index rising 0.30% to 99.17. In commodities, oil prices surged again as geopolitical tensions intensified following reports of further unrest in Iran. Brent jumped 2.18% to $63.34 per barrel, while WTI gained 2.35% to $59.12. Gold also attracted strong haven demand, pushing back through the $4,500 level, with the metal rising 0.77% to trade at $4,510.15 by the NY close.
Fed Rate Cuts Still in Play for 2026 After Non-Farms
Rate cuts from the Federal Reserve Bank are still in play this year for the market after the first major data release of 2026 came in close to expectations. Non-Farm Payroll data came in slightly under expectations; however, the Unemployment Rate dropped more than expected, by 0.2% rather than the expected 0.1%, and Average Hourly Earnings did increase by the anticipated 0.2% m/m. The market is now pricing in just a 5% chance of a further rate cut from the Fed at this month’s meeting, but we have seen a bigger change in the March meeting pricing, with the chances of a 25-basis point cut slipping from over 40% a week ago to under 30% now. Traders will now be focussing on key inflation data out of the US this week, and if it remains ‘sticky’, as it has done over the last year, then we can expect those rate cut expectations to pull back further and add more support to the dollar, which has crept up nearly 1% since the start of 2026.
Quiet Calendar Start to Another Busy Trading Week
It is a quiet start to the trading week on the economic calendar, with very little in the form of tier 1 events scheduled; however, geopolitical updates are likely to see more moves in markets as the day progresses. Japan is closed for a bank holiday during the Asian session, which may see a reduction in liquidity. The European session is also set to be relatively quiet in terms of scheduled events. In the US session, there is also little in the way of data scheduled; however, markets will be watching comments from FOMC member Thomas Barkin, who is scheduled to speak later in the day – with his and other Fed members’ comments likely to be under the microscope in the coming days after the big data update on Friday.
Explore all upcoming market events in the Economic Calendar.
The post General Market Analysis – 12/01/26 first appeared on IC Markets | Official Blog.
Monday 12th January 2026: Asian Markets Advance on Rate-Cut Optimism, Tracking Wall Street Gains
January 12, 2026 15:39 ICMarkets Market News
Global Markets:
- Asian Stock Markets : Nikkei up 1.61%, Shanghai Composite up 0.74%, Hang Seng up 0.93% ASX up 0.48%
- Commodities : Gold at $4,583.21 (+1.83%), Silver at $83.552 (+5.32%), Brent Oil at $63.46 (+0.19%), WTI Oil at $59.24 (+0.51%)
- Rates : US 10-year yield at 4.183, UK 10-year yield at 4.3770, Germany 10-year yield at 2.8256
News & Data:
- (USD) Unemployment Rate 4.4% to 4.5% expected
- (USD) Non-Farm Employment Change 50K to 66K expected
- (USD) Unemployment Rate 6.8% to 6.7% expected
- (CAD) Employment Change 8.2K to -1.8K expected
Markets Update:
Asian stock markets are trading mostly higher on Monday, tracking broadly positive cues from Wall Street as optimism grows over the outlook for U.S. interest rates. Sentiment was boosted after a report showed U.S. employment rose less than expected in December, reinforcing confidence that the Federal Reserve could begin cutting rates later this year. While the Fed is still widely expected to keep rates unchanged at its January 27–28 meeting, investors view recent data as supportive of a more accommodative stance ahead. Asian markets had also closed mostly higher on Friday.
Positive sentiment was further supported by a report indicating U.S. consumer sentiment improved slightly more than expected in January. According to CME Group’s FedWatch Tool, markets are pricing in a 95 percent probability that the Fed will leave rates unchanged at its upcoming meeting.
The Australian share market is notably higher, rebounding from the previous session’s losses. The benchmark S&P/ASX 200 index has moved above the 8,750 level, with gains across most sectors led by energy and technology stocks, while iron ore miners lagged. Major banks, gold miners and oil stocks are all trading higher, contributing to the market’s strength.
In Asia, South Korea and Taiwan are posting solid gains, while China, Hong Kong, Singapore, Malaysia and Indonesia are modestly higher. New Zealand is relatively flat, and Japan’s market is closed for the Coming of Age Day holiday.
On Wall Street, U.S. stocks ended Friday firmly higher, with the Dow and S&P 500 closing at fresh record highs. European markets also advanced, while crude oil prices jumped on supply concerns and ongoing geopolitical tensions.
Upcoming Events:
- 09:30 AM GMT – USD Sentix Investor Confidence
The post Monday 12th January 2026: Asian Markets Advance on Rate-Cut Optimism, Tracking Wall Street Gains first appeared on IC Markets | Official Blog.