
Articles
White House on X indirectly denies the Iran’s state TV reported MoU draft
May 27, 2026 21:40 Forexlive Latest News Market News
The Official White House Rapid Response account on X has indirectly denied the Iran’s state TV MoU draft reported earlier in the session. The initial market gains have been erased anyway as Iran’s state TV also added that no agreement has been reached yet, so all in all we are still waiting for something concrete.
There’s been lots of noise recently about this Memorandum of Understanding and extra caution is needed. The signal is that nobody wants to restart the conflict, so that’s positive but it’s also largely priced in. The most important thing is the reopening of the Strait of Hormuz.
If this situation drags on for longer, we risk going into the June FOMC meeting with oil prices still elevated and uncertainty still high. The Fed might sound more hawkish than expected in that case and the market’s reaction could be very negative.
Update:
The White House has now officially denied the report. They say “this report from Iranian controlled media is not true and the MOU they “released” is a complete fabrication. Nobody should believe what Iranian state media is putting out. FACTS MATTER”.
This article was written by Giuseppe Dellamotta at investinglive.com.
US Richmond Fed May composite index +13 vs +3 prior
May 27, 2026 21:40 Forexlive Latest News Market News
- Prior was +3
- Services index +14 vs +9 prior
- Manufacturing shipments +16 vs -2 prior
Fifth District manufacturing activity improved in May, according to the most recent survey from the Federal Reserve Bank of Richmond. The future indexes for shipments and new orders increased further into positive territory. The expectations index for employment rose notably to 23 from 7. The local business conditions index decreased to 5 in May from 10 in April. Meanwhile, the future local business conditions index rose to 17 from 3. The average growth rates of prices paid and prices received decreased somewhat in May. Firms expected growth in prices paid to moderate slightly over the next 12 months.
For background, the Federal Reserve Bank of Richmond’s monthly Survey of Manufacturing Activity is one of five regional Fed surveys closely watched as early reads on U.S. factory conditions, alongside the Empire State, Philadelphia, Dallas, and Kansas City surveys. Released on the fourth Tuesday of each month at 10:00 a.m. ET, it covers manufacturers in the Fed’s Fifth District, Maryland, the District of Columbia, Virginia, most of West Virginia, North Carolina, and South Carolina, drawing responses from roughly 100 to 190 plants.
The headline composite index is a weighted average of three subindexes: new orders (40%), shipments (33%), and employment (27%). It is a diffusion index that ranges between +100 and -100, with positive readings signaling expansion and negative readings contraction. Markets watch the survey as a directional input for the national ISM Manufacturing PMI later in the cycle, and pay particular attention to its prices paid and prices received subindexes for early signals on goods inflation.
This article was written by Giuseppe Dellamotta at investinglive.com.
Weekly US ADP pulse 35.75K vs 42.25K prior
May 27, 2026 19:40 Forexlive Latest News Market News
- Prior war 42.25K
The weekly and monthly ADP reports have been pointing to a resilient and stable labour market. Their focus is on the inflation mandate now.
For background, the NER Pulse is a weekly private-sector employment tracker launched in late 2025 by ADP Research in collaboration with the Stanford Digital Economy Lab. It serves as a high-frequency companion to the long-running monthly ADP National Employment Report (NER), which has delivered snapshots of U.S. private-sector hiring for nearly two decades and is built on anonymized payroll data covering more than 26 million U.S. employees, roughly one in six private-sector workers.
ADP positioned the new release as a response to an economy being reshaped in real time by AI adoption, demographic shifts, and short-term business cycle volatility, conditions in which a once-a-month reading can miss meaningful turning points. A lot can happen in a month, and high-frequency data helps distinguish a momentary dip from a genuine trend change.
Methodologically, the NER Pulse estimates the week-over-week change in employment using a four-week moving average, with figures seasonally adjusted and carrying a two-week lag to allow for more complete data. It publishes every Tuesday at 8:15 a.m. ET, except during weeks when the monthly NER is released, and includes 12 weeks of historical data.
This article was written by Giuseppe Dellamotta at investinglive.com.
Iran’s state TV says it has a draft of the initial unofficial framework for the MoU
May 27, 2026 19:40 Forexlive Latest News Market News
Iran’s state TV is saying that it has a draft of the initial unofficial framework for the Memorandum of Understanding (MoU) with the US. According to the draft, US military forces will withdraw from vicinity of Iran and lift the naval blockade. In return, Iran has committed to restoring the number of commercial transit ships through Hormuz Strait to pre-war levels within one month.
The management and route of ship traffic through Strait of Hormuz will be handled by Iran in cooperation with Oman. If a final deal is reached within 60 days, this agreement will be approved in the form of a binding UN Security Council resolution. The Islamabad memorandum framework is not yet finalized and no step will be taken by Iran without “tangible verification”.
Markets are cheering but there’s no agreement yet. These are just the details of the draft everyone has been talking about in the past days.
This article was written by Giuseppe Dellamotta at investinglive.com.
investingLive European markets wrap: Equities extend rally awaiting US-Iran deal
May 27, 2026 18:40 Forexlive Latest News Market News
Headlines:
- US and Iran know what the puzzle pieces are, but can they fit them all together?
- US futures continue to push up as investors stay more optimistic
- USD/JPY continues to nudge higher in testing Japan’s intervention limits
- Gold drops to two-month lows as precious metals struggle despite US-Iran optimism
- Fed’s Kashkari says far too soon to predict what the next policy move should be
- French consumer sentiment slumps further in May, falling to lowest since March 2023
Markets:
- WTI crude lower by 3.5% to $90.50
- DAX up 0.6% and CAC 40 up 0.9%
- S&P 500 futures up 0.3% on the day
- US dollar steady, little changed; AUD down after softer CPI data, NZD up on more hawkish RBNZ
- US 10-year yields down 1.6 bps to 4.475%
- Gold down 1.3% to $4,447
It was another session in waiting for the US and Iran to announce their supposedly imminent “deal to end the conflict”.
And once again, it serves as a good reminder that all of this is mainly angled to seeing both sides sign off on a memorandum of understanding to facilitate nuclear discussions next. Markets remain optimistic for the most part but we’ll have to watch for the details when said deal is announced at some point this week.
Oil prices continue to drop lower as equities extend the rally since the start of the week. WTI crude is down another 3.5% to $90.50 while European stocks look to end the month with a flourish. The DAX is up 0.6% and is closing in on record levels again with the CAC 40 up 0.9% to erase the drop from yesterday.
Looking to US futures, S&P 500 futures are up 0.3% with Nasdaq futures up 0.7% as tech shares continue the sizzling run this week in following up from the record closes yesterday. Up, up, and away.
Elsewhere, the dollar itself is lightly changed with not all too much to work with during the session. USD/JPY is up 0.1% to 159.40 with EUR/USD up 0.1% also to 1.1638 currently. The aussie is the laggard after a softer inflation data earlier in the day, with AUD/USD down 0.5% to 0.7130. Meanwhile, the kiwi is the lead gainer on a more hawkish RBNZ with NZD/USD up 0.8% to 0.5880 currently.
Besides that, precious metals were in focus too with gold dropping to fresh two-month lows on the day. More hawkish central bank bets are arguably a key factor in dragging down precious metals, with gold seen lower by over 1% to $4,447.
Will we finally see the US-Iran deal/memorandum of understanding officially announced later today?
This article was written by Justin Low at investinglive.com.
Ex-Dividend 28/05/2026
May 27, 2026 17:40 ICMarkets Market News
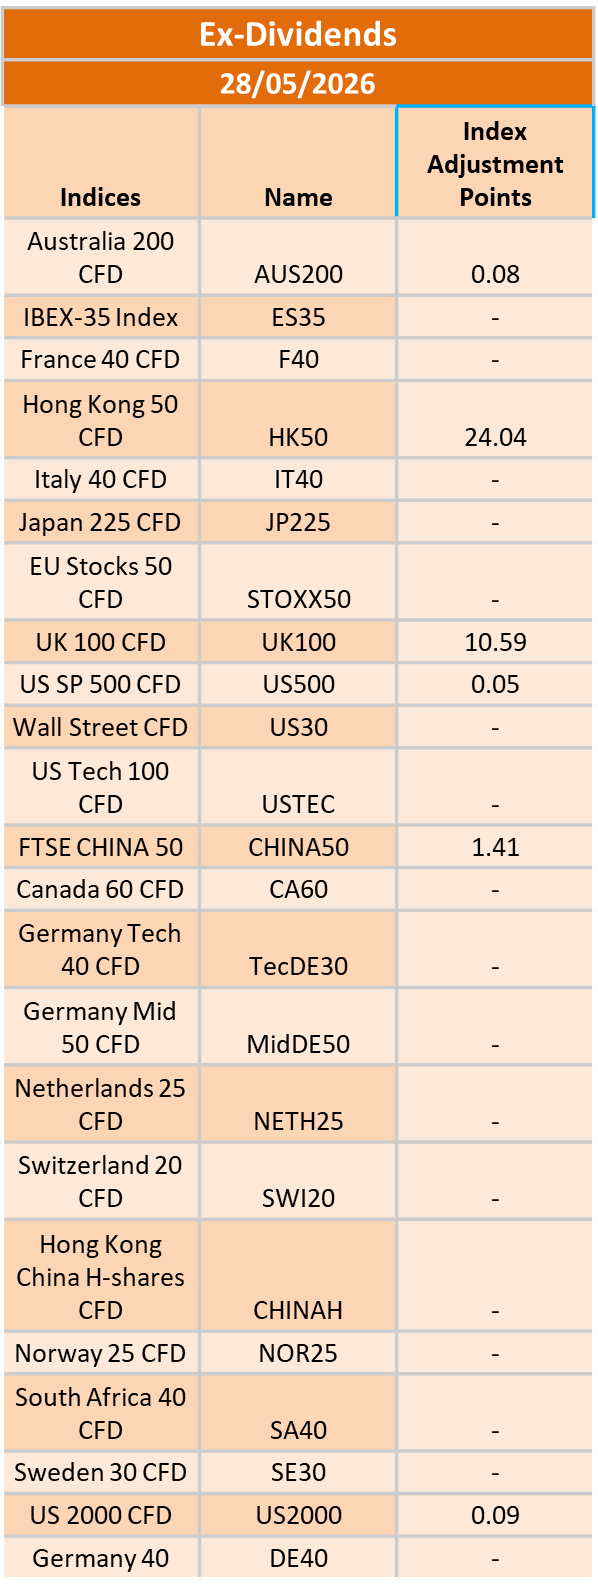
The post Ex-Dividend 28/05/2026 first appeared on IC Your Trading Edge | Official Blog.
IC Markets Global – Europe Fundamental Forecast | 27 May 2026
May 27, 2026 15:40 ICMarkets Market News
IC Markets Global – Europe Fundamental Forecast | 27 May 2026
What happened in the Asia session?
Hawkish RBNZ hold at 2.25% that sparked a NZD recovery from multi-year lows, Australia’s softer-than-expected 4.2% CPI that tempered AUD upside, and falling oil prices ($99.06 Brent, $93.05 WTI) on U.S.-Iran ceasefire hopes, while AI-driven tech buying propelled the Nikkei to ~66,000 and the Kospi nearly 5% to record highs, making NZD, AUD, crude oil, AI chip equities (Tokyo Electron, Advantest, Samsung), and gold the most headline-impacted instruments.
What does it mean for the Europe & US sessions?
Markets are reacting to stronger-than-expected U.S. durable goods and unexpectedly low jobless claims, which could reinforce Fed hawkishness, while the Core PCE inflation met consensus at 0.3%. The UN’s downgrade of global growth to 2.5% for 2026, citing Middle East conflict-driven inflation pressures and halted disinflation, adds macro uncertainty, particularly for emerging markets facing tighter financing conditions.
The Dollar Index (DXY)
Key news events today
No major news event
What can we expect from DXY today?
The dollar is trading marginally lower today at 99.09 on the DXY index after recently holding near a six-week peak around 99.51, driven by uncertainty over a potential U.S.-Iran peace deal and resilient U.S. labor market data showing decreased weekly jobless claims. While the greenback benefited from safe-haven demand amid escalating Middle East tensions and manufacturing activity reaching a four-year high in May.
Central Bank Notes:
- The Federal Open Market Committee (FOMC) is widely expected to hold the federal funds rate target range steady at 3.50%–3.75% at its April 28–29, 2026, meeting, as oil prices remain elevated around $108 per barrel for Brent crude amid ongoing US-Israel tensions with Iran, alongside surging inflation from energy shocks, further delaying any 2026 rate cuts potentially beyond September.
- The Committee continues to pursue maximum employment and 2% inflation goals, with the labor market showing mixed signals as nonfarm payrolls rose by 178,000 in March 2026—beating lowered expectations but driven partly by strike reversals—and the unemployment rate edged down to 4.3% from 4.4% in February.
- Officials face heightened risks from geopolitical tensions, soaring oil prices, and accelerating inflation, with CPI jumping to 3.3% year-over-year in March 2026 from 2.4% in February due to a 10.9% monthly energy surge, headline PCE pressured higher, and core PCE estimates around 3.1% or more.
- Economic activity continues to cool after robust Q4 2025 growth near 5%, with the Atlanta Fed GDPNow estimating Q1 2026 growth at 1.3% amid softer consumer spending, strike impacts, and labor data despite some resilience.
- March 2026’s Summary of Economic Projections forecasts 2026 unemployment at a median around 4.4%, GDP growth revised higher, and core PCE up to 2.7%, with the dot plot still signaling one cut in 2026 to a median 3.25%–3.50% funds rate amid softer labor but inflation upticks.
- The Committee maintains its data-dependent stance amid a mixed labor market, inflation well above target from oil shocks, and geopolitical risks, likely holding rates at 3.50%-3.75% with persistent divisions and hawkish tones on cuts.
- The FOMC continues its adjusted quantitative tightening, with Treasury rolloff caps at $5 billion per month and agency MBS at $35 billion per month to manage reserves amid post-2025 balance sheet adjustments.
- The FOMC continues its adjusted quantitative tightening, with Treasury rolloff caps at $5 billion per month and agency MBS at $35 billion per month to ensure ample reserves post-2025 program adjustments.
- The next meeting is scheduled for 16 to 17 June 2026.
Next 24 Hours Bias
Weak Bullish
Gold (XAU)
Key news events today
No major news event
What can we expect from Gold today?
Gold prices moved slightly higher today as investors monitored ongoing US-Iran peace talks and evaluated the Federal Reserve’s policy outlook, though sentiment remains fragile due to reports of fresh US military strikes in southern Iran despite ceasefire negotiations in Qatar. The precious metal continues to be highly sensitive to geopolitical movements, global crude oil prices, and inflation concerns, with renewed tensions in the Middle East pushing oil higher and reviving fears that elevated energy costs could force central banks to maintain tighter monetary policy for longer.
Next 24 Hours Bias
Medium Bearish
The Euro (EUR)
Key news events today
ECB Financial Stability Review (8:00 am GMT)
What can we expect from EUR today?
The euro showed a slight gain today against the US dollar, rising 0.06% to reach 1.1637 EUR/USD as of May 27, 2026. This modest upward movement suggests relative stability in the euro-dollar pair. However, the search results don’t reveal major breaking news or specific developments driving today’s euro movement. No significant ECB policy announcements, economic data releases, or geopolitical events affecting the currency were identified in today’s coverage.
Central Bank Notes:
- The Governing Council of the ECB is expected to keep the three key interest rates unchanged at its 28–29 May 2026 meeting, with the main refinancing rate near 2.15%, the marginal lending facility at 2.40%, and the deposit facility at 2.00%.
- Headline HICP inflation is likely to remain in the 2.0–2.3% range in the early months of 2026, with the March 2026 ECB staff baseline projecting an average of 2.6% for 2026, 2.0% for 2027, and 2.1% for 2028.
- The updated Eurosystem staff projections for 2026 paint a picture of persistent inflation overshoot, with headline inflation averages of around 2.6% in 2026, 2.0% in 2027, and 2.1% in 2028, compared with about 1.9–2.1% earlier outlooks.
- Real GDP growth is projected at about 0.9% in 2026, 1.3% in 2027, and 1.4% in 2028, implying around 0.2–0.3% quarter‑on‑quarter expansion in Q2 2026, consistent with the resilience observed at the end of 2025.
- The euro area unemployment rate is expected to stay near 6.4%, with strong labour‑force participation and modest wage pressures underpinning consumption resilience.
- The Governing Council continues to stress a meeting‑by‑meeting, data‑dependent approach, focusing on the path of inflation, the functioning of monetary‑policy transmission, and the impact of external shocks (geopolitical, energy, and trade‑policy related).
- Balance‑sheet normalization proceeds smoothly, with the APP and PEPP wind‑downs completed and the remaining stock of longer‑dated assets being allowed to run off without significant liquidity shortages.
The next meeting is on 10 to 11 June 2026
Next 24 Hours Bias
Weak Bearish
The Swiss Franc (CHF)
Key news events today
No major news event
What can we expect from CHF today?
The Swiss franc is trading at multi-year highs on May 27, 2026, with USD/CHF at 0.7855, continuing its strong performance driven by safe-haven demand amid global geopolitical tensions and unpredictable U.S. trade policy. Switzerland’s economy showed resilient recovery with Q1 2026 GDP growing 0.5%, the strongest quarterly performance in a year.
Central Bank Notes:
- At its monetary policy assessment on 19 March 2026, the Swiss National Bank (SNB) is widely expected to leave the policy rate unchanged at 0%, continuing the extended pause since September 2025, as the Governing Board considers current settings adequate to keep inflation near the target without resorting to negative rates.
- Inflation data since December indicate persistent weakness, with headline CPI hovering around 0% year-on-year through early 2026 and core measures subdued at roughly 0.4%, underscoring limited price pressures and lingering, though contained, deflation risks.
- The SNB’s updated conditional inflation forecast shows minimal change from December, with averages of about 0.2% in 2025 (now complete), 0.3% in 2026, and 0.6% in 2027 under a steady 0% policy rate. However, recent flat CPI readings may slightly lower near-term expectations, preserving scope for further easing if needed.
- Global conditions remain challenging, marked by U.S. tariff escalations under President Trump, subdued external demand, and uncertainties in major export markets such as Europe and the U.S., prompting the SNB to exercise caution despite resilient Swiss domestic activity.
- Sentiment in manufacturing and export sectors stays soft amid franc appreciation and weaker foreign orders, squeezing margins. Yet, overall GDP growth is expected to be around 1.5% in 2026, with unemployment edging up modestly from historic lows.
- The SNB reaffirms its readiness to intervene via rate cuts or FX operations should deflationary pressures intensify, while emphasizing clear communication through detailed meeting minutes and coordination with global partners on currency matters.
The next meeting is on 18 June 2026.
Next 24 Hours Bias
Strong Bullish
The Pound (GBP)
Key news events today
No major news event
What can we expect from GBP today?
The British pound recently experienced volatility, slipping slightly on May 22 to $1.3420 amid weakening UK consumer spending (retail sales fell sharply) and deteriorating public finances, compounded by geopolitical uncertainty from stalled US-Iran peace talks driving safe-haven demand for the dollar.
Central Bank Notes:
- The Bank of England’s Monetary Policy Committee (MPC) met on 29 April 2026, maintaining the Bank Rate at 3.75 per cent, with the decision details published on 30 April 2026 alongside the quarterly Monetary Policy Report. This hold follows the unanimous 9-0 vote at the prior 18 March 2026 meeting, amid persistent energy shocks from the Middle East conflict overriding earlier cut expectations. No specific vote split for April has been detailed yet, but consensus previews indicate a hold.
- Quantitative tightening (QT) continues unchanged at the 2025 pace for gilt holdings reductions, supporting balance-sheet normalization while monitoring liquidity and maintaining restrictiveness against ongoing shocks.
- Headline CPI inflation rose to 3.3% in March 2026 from energy and motor fuel surges due to Middle East tensions, expected to stay between 3% and 3.5% through the summer, well above the 2% target. The April Monetary Policy Report outlines scenarios in which inflation peaks above 3.5% by the end of 2026 in the baseline, then eases below 2% in three years, or reaches 6%+ in adverse cases requiring tighter policy.
- UK growth outlook weakens further into Q2-Q3 2026 amid energy-driven cost pressures, rising unemployment risks, and softening confidence, with prior pay growth cooling now vulnerable to business pass-throughs.
- Global risks from the Middle East conflict persist, fueling energy/commodity volatility and sterling/gilt fluctuations; MPC views direct impacts as containable if demand slackens to curb secondary inflation effects.
- Inflation risks remain upward-biased due to energy persistence, potential wage embedding, and shock duration uncertainty, balanced against downside from economic slack and labor market softening.
- The MPC maintains a data-dependent stance, with policy still restrictive; the April Report provides fuller shock analysis, but no easing is signaled, yet members monitor for 2% sustainability, with Governor Bailey emphasizing vigilance.
- The next meeting is on 18 June 2026.
Next 24 Hours Bias
Weak Bullish
The Canadian Dollar (CAD)
Key news events today
No major news event
What can we expect from CAD today?
The Canadian dollar has been under pressure in late May 2026, trading around 1.38 USD/CAD as softer core inflation data (core gauges slowed to five-year lows despite headline inflation rising to 2.8% in April due to higher gasoline prices) reinforced expectations that the Bank of Canada will remain dovish and “look through” temporary energy-driven price increases.
Central Bank Notes:
- The Governing Council held the overnight rate target steady at 2.25% at its 28-29 April 2026 meeting, matching consensus expectations and prolonging the policy pause as inflation trends firmer toward target. The Bank highlighted lingering global headwinds from Middle East tensions and U.S. tariff escalations under Trump, but confirmed the stance continues fostering disinflation amid moderating energy volatility.
- U.S. trade frictions and geopolitical strains persist in dampening sentiment, yet Canadian manufacturing PMI strengthened further in expansion, driven by robust export orders tied to sustained energy demand. Goods exports, anchored by crude oil, maintained strength through March, countering subdued capex as businesses emphasize operational buffers over expansion.
- Economic growth extended into Q2 2026 at roughly 2.1% annualized, sustaining Q1’s momentum via resource shipments, public spending, and industrial recovery. March preliminary figures suggest resilient expansion, tempered slightly by seasonal factors and lingering supply disruptions.
- Services PMI rose deeper into expansion territory, with gains across tech, leisure, and professional services; consumer segments showed firmer footing from wage gains, despite elevated prices curbing non-essentials. The Bank views this breadth as signaling a balanced, sustainable upturn.
- National housing resales climbed modestly in March alongside stable prices, supported by steady rates and regional affordability pockets, as inventory accumulation in key markets avoids sharp imbalances. Policymakers expect gradual softening, underpinned by sound lending standards and consistent household dynamics.
- Headline CPI held near 2.0% year-over-year in March 2026 prints, within the target band, with core metrics like CPI-trim and median easing to around 2.5% on easing food, goods, and partial shelter relief. This bolsters confidence in inflation’s durable path to 2%.
- Officials affirmed 2.25% appropriately positions the economy for 2% inflation stability and orderly rebalancing, with cuts off the table absent growth or price setbacks. Focus shifts to Q2 momentum, core trends, and trade/geopolitical developments ahead of June.
- The next meeting is on 10 June 2026.
Next 24 Hours Bias
Weak Bearish
Oil
Key news events today
EIA Crude Oil Inventories (2:30 pm GMT)
What can we expect from Oil today?
Optimism about US-Iran diplomatic progress toward reopening the Strait of Hormuz weighed against fresh hostilities and Iran’s accusations of US truce violations. Brent crude eased 0.52% to $99.06 while WTI dropped 0.89% to $93.05, with markets remaining volatile due to ongoing US strikes in southern Iran and uncertainty over whether the ceasefire will hold.
Next 24 Hours Bias
Weak Bearish
The post IC Markets Global – Europe Fundamental Forecast | 27 May 2026 first appeared on IC Your Trading Edge | Official Blog.
Wednesday 27th May 2026: Technical Outlook and Review
May 27, 2026 15:01 ICMarkets Market News
DXY (U.S. Dollar Index):
Potential Direction: Bullish
Overall momentum of the chart: Bearish
The price has already bounced off the pivot and may continue its bullish move toward the 1st resistance
Pivot: 98.98
Supporting reasons: Identified as an overlap support, where renewed buying pressure could emerge to push the price higher.
1st support: 98.53
Supporting reasons: Identified as a pullback support that aligns with the 61.8% Fibonacci retracement, indicating a potential area where the price could again stabilize.
1st resistance: 99.51
Supporting reasons: Identified as a swing high resistance, indicating a potential area that could halt any further upward movement
EUR/USD:
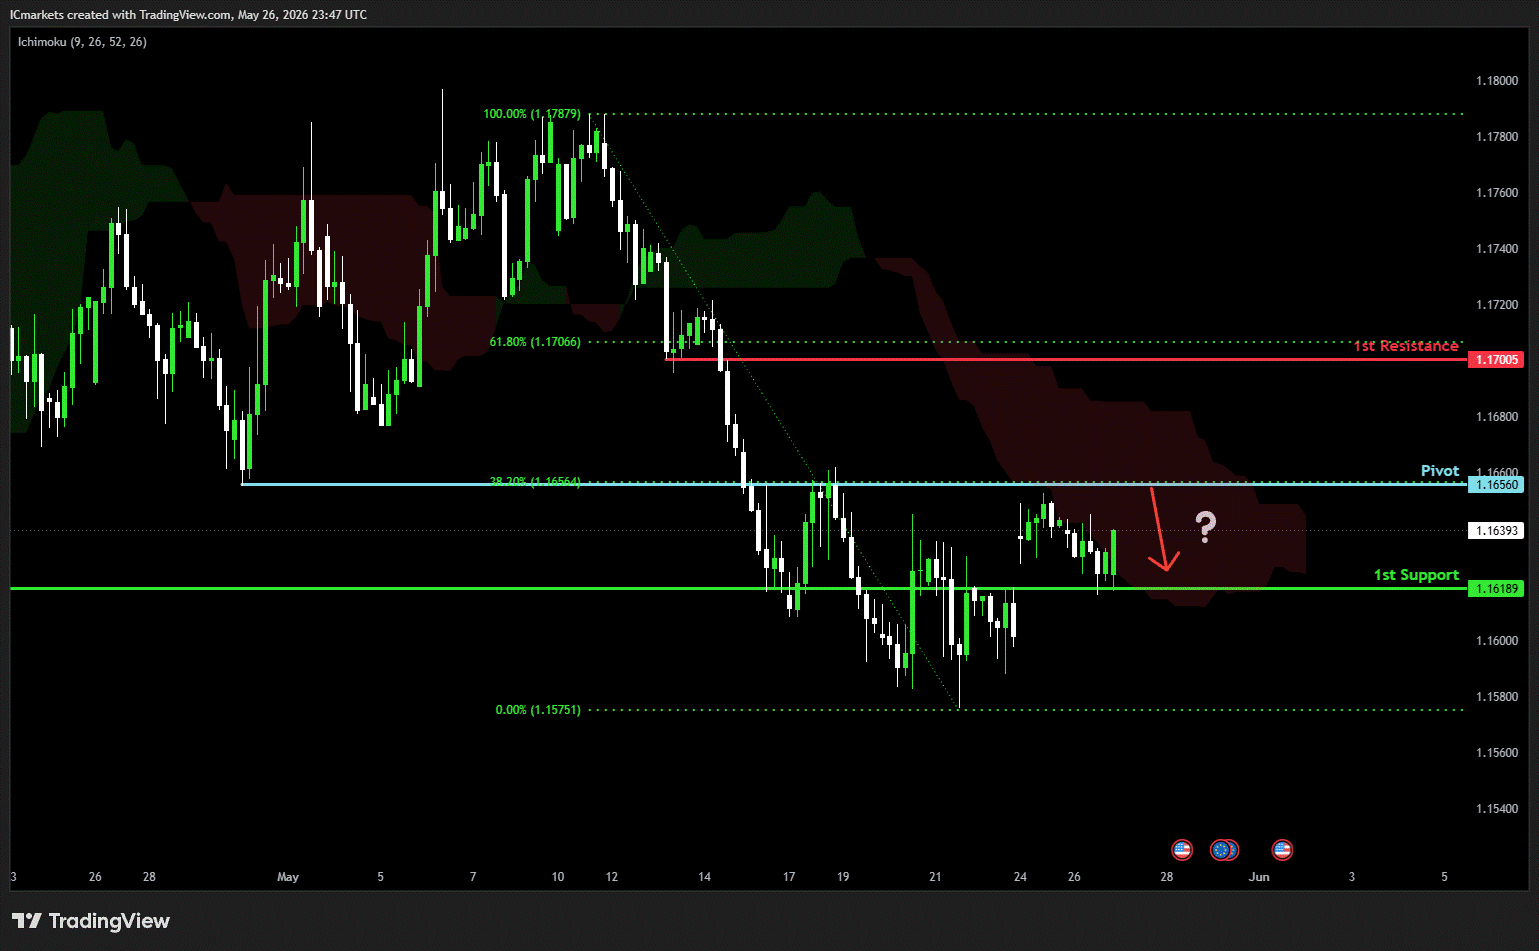
Potential Direction: Bearish
Overall momentum of the chart: Bullish
The price could see a short-term pullback toward the pivot before continuing its bearish move down toward the 1st support.
Pivot: 1.1656
Supporting reasons: Identified as an overlap resistance that aligns with the 38.2% Fibonacci retracement, where selling pressures could intensify and potentially cap any upward retracement.
1st support: 1.1618
Supporting reasons: Identified as an overlap support, indicating a potential level where the price could stabilize once again.
1st resistance: 1.1700
Supporting reasons: Identified as an overlap resistance that aligns with the 61.8% Fibonacci retracement, indicating a potential level that could cap further upward movement.
EUR/JPY:
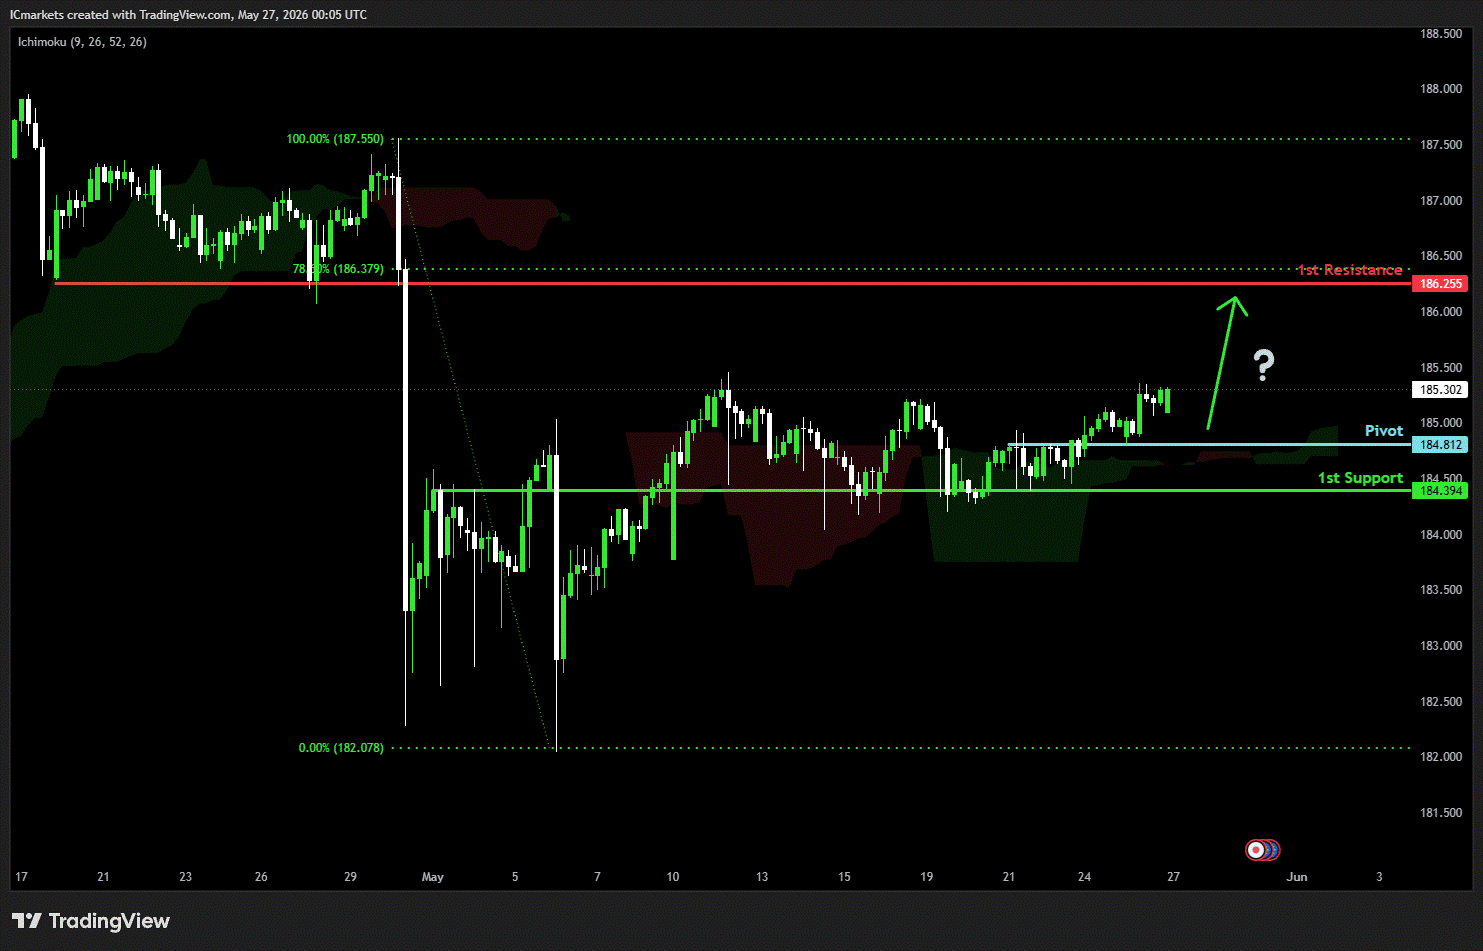
Potential Direction: Bullish
Overall momentum of the chart: Bullish
The price has already bounced off the pivot and may continue its bullish move toward the 1st resistance
Pivot: 184.81
Supporting reasons: Identified as an overlap support, where renewed buying pressure could emerge to push the price higher.
1st support: 184.39
Supporting reasons: Identified as an overlap support, indicating a potential area where the price could again stabilize.
1st resistance: 186.25
Supporting reasons: Identified as a swing high resistance that aligns with the 78.6% FIbonacci retracement, indicating a potential level that could cap further upward movement.
EUR/GBP:
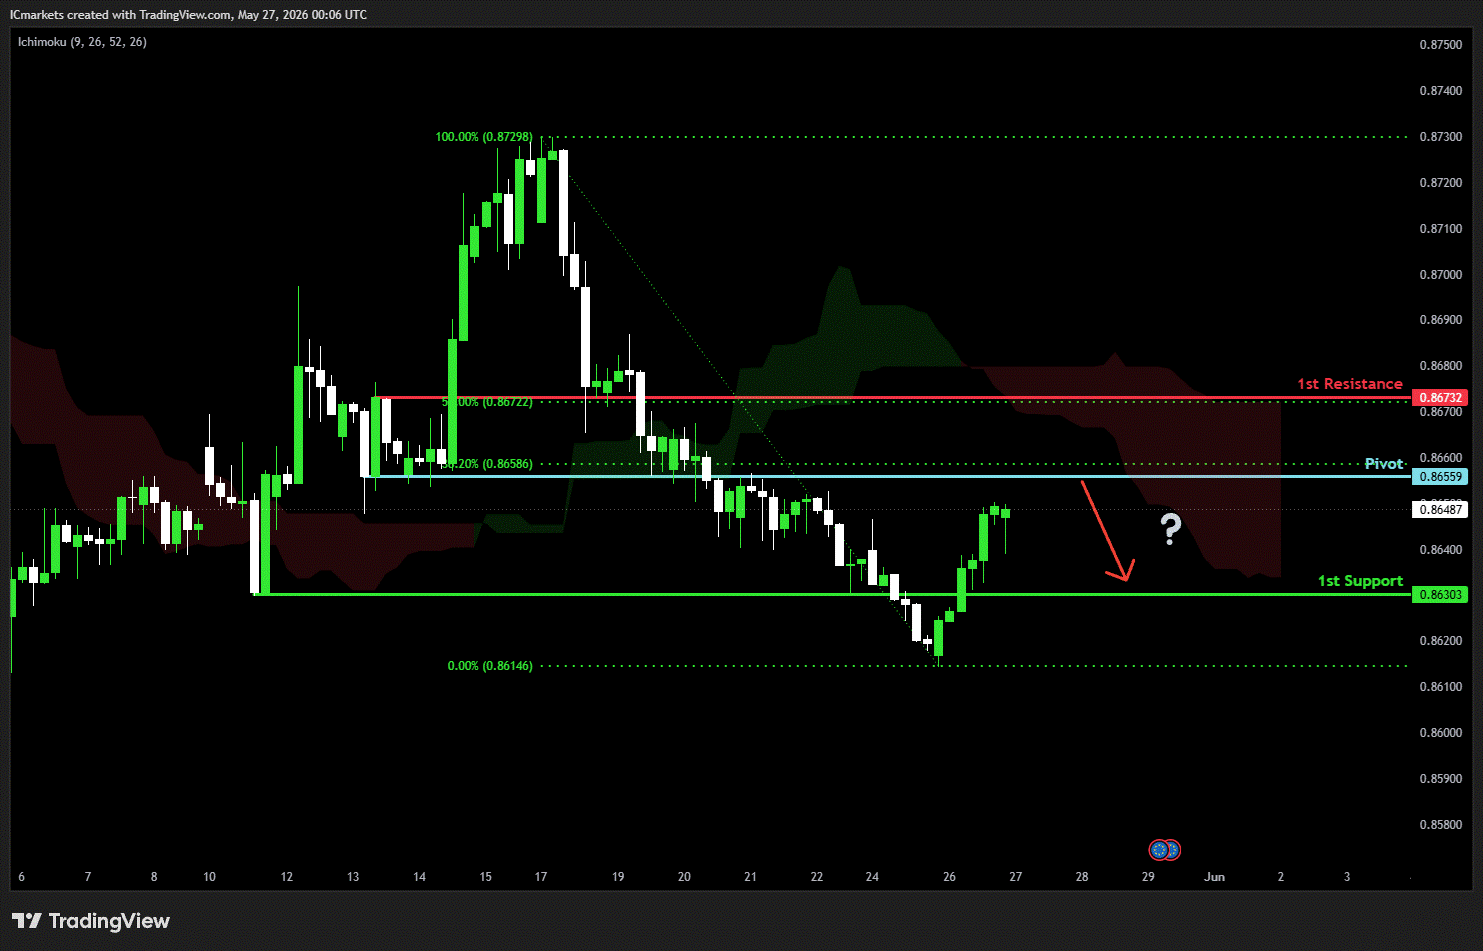
Potential Direction: Bearish
Overall momentum of the chart: Bullish
The price could see a short-term pullback toward the pivot before continuing its bearish move down toward the 1st support.
Pivot: 0.8655
Supporting reasons: Identified as an overlap resistance that aligns with the 38.2% FIbonacci retracement, where selling pressures could intensify and potentially cap any upward retracement.
1st support: 0.8630
Supporting reasons: Identified as a pullback support, indicating a potential area where the price could stabilize once more.
1st resistance: 0.8673
Supporting reasons: Identified as a pullback resistance that aligns with the 50% FIbonacci retracement, indicating a potential level that could cap further upward movement.
GBP/USD:
Potential Direction: Bullish
Overall momentum of the chart: Bullish
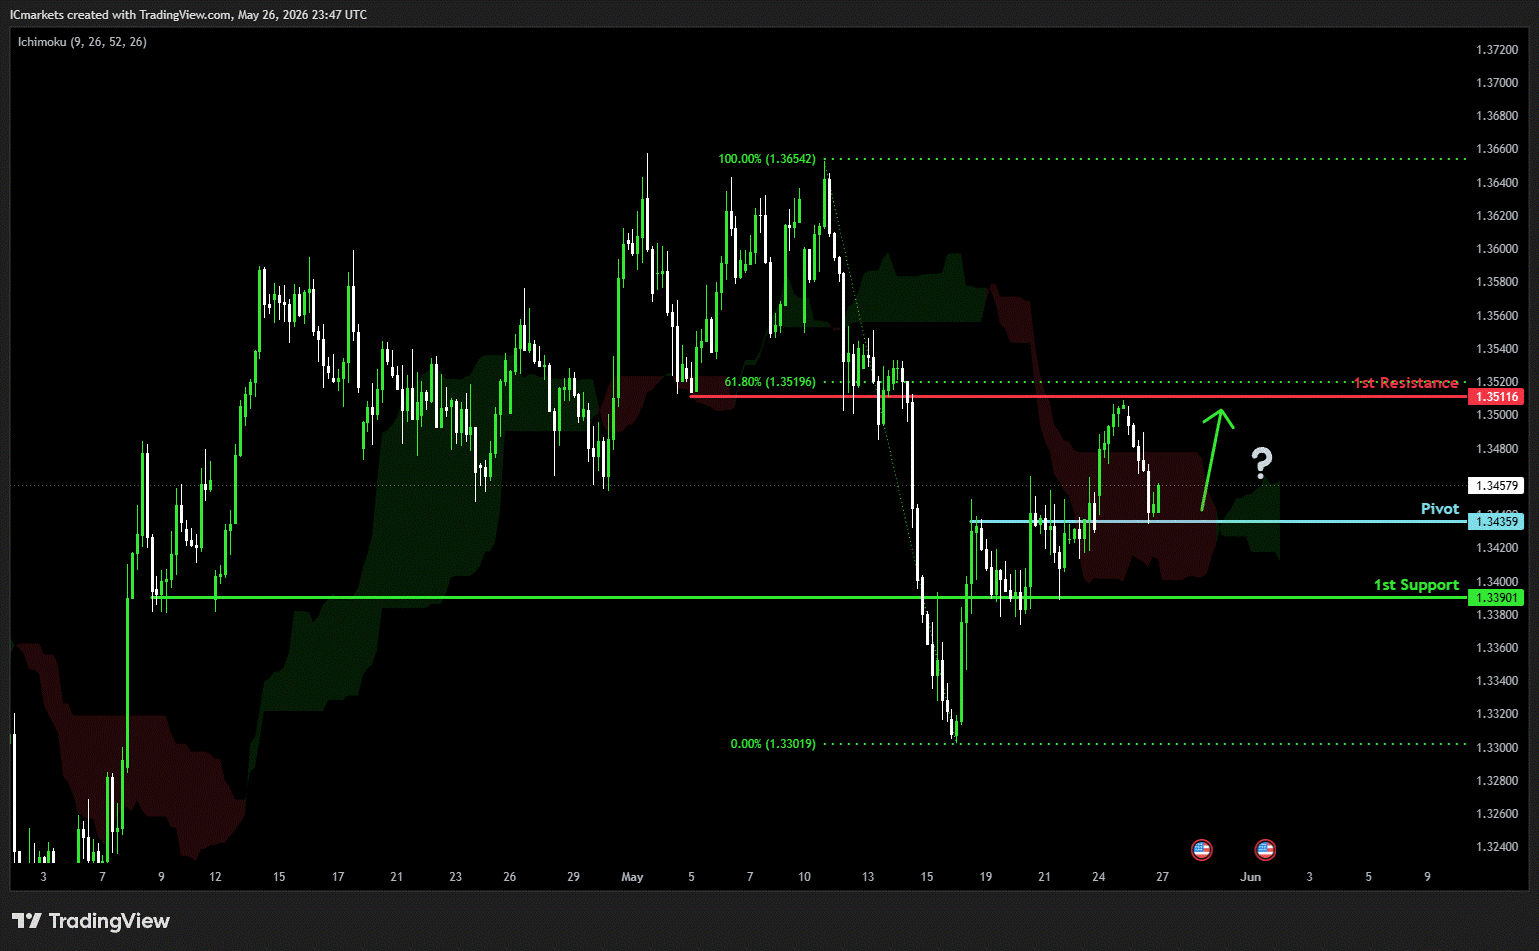
The price has already bounced off the pivot and may continue its bullish move toward the 1st resistance
Pivot: 1.3435
Supporting reasons: Identified as an overlap support, where renewed buying pressure could emerge to push the price higher.
1st support: 1.3390
Supporting reasons: Identified as a pullback support, indicating a potential area where the price could stabilize once more.
1st resistance: 1.3511
Supporting reasons: Identified as a pullback resistance that aligns with the 61.8% FIbonacci retracement, indicating a potential level that could halt further upward movement.
GBP/JPY:
Potential Direction: Bearish
Overall momentum of the chart: Bullish
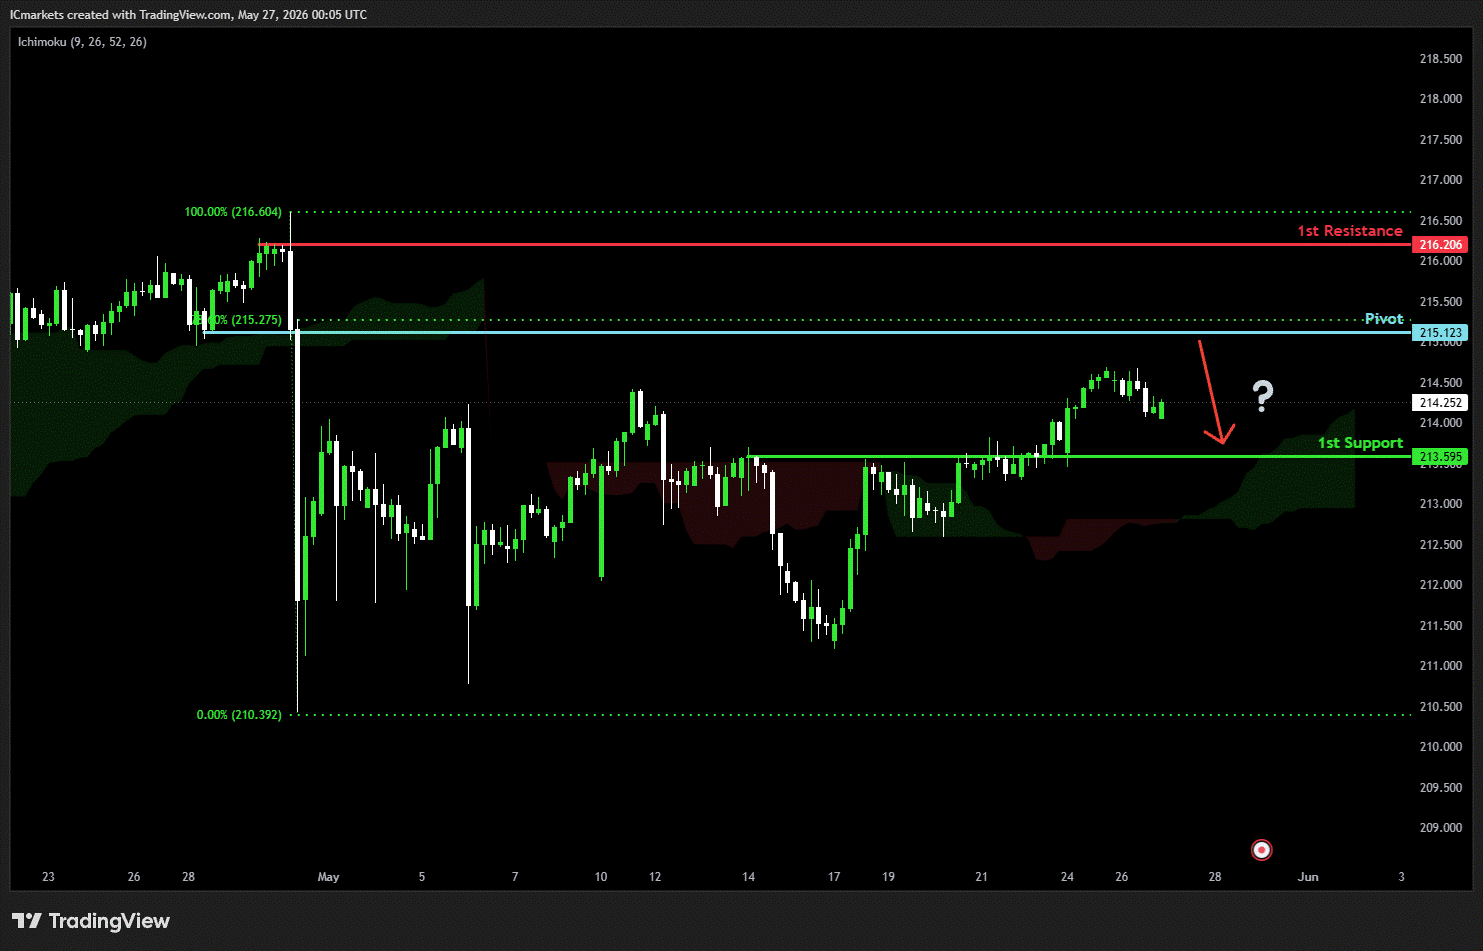
The price could see a short-term pullback toward the pivot before continuing its bearish move down toward the 1st support.
Pivot: 215.12
Supporting reasons: Identified as a pullback resistance that aligns with the 78.6% Fibonacci retracement, where selling pressures could intensify and potentially cap any upward retracement.
1st support: 213.59
Supporting reasons: Identified as an overlap support, indicating a potential level where the price could stabilize once more.
1st resistance: 216.20
Supporting reasons: Identified as a swing high resistance, indicating a potential level that could halt further upward movement.
USD/CHF:
Potential Direction: Bearish
Overall momentum of the chart: Bearish
The price has already reacted off the pivot and may continue its bearish move toward the 1st support.
Pivot: 0.7861
Supporting reasons: Identified as a pullback resistance that aligns with the 61.8% Fibonacci retracement, where selling pressures could intensify and potentially cap any upward retracement.
1st support: 0.7826
Supporting reasons: Identified as a pullback support, indicating a potential level where the price could stabilize once again.
1st resistance: 0.78789
Supporting reasons: Identified as a swing high resistance, indicating a potential level that could cap further upward movement.
USD/JPY:
Potential Direction: Bullish
Overall momentum of the chart: Bullish
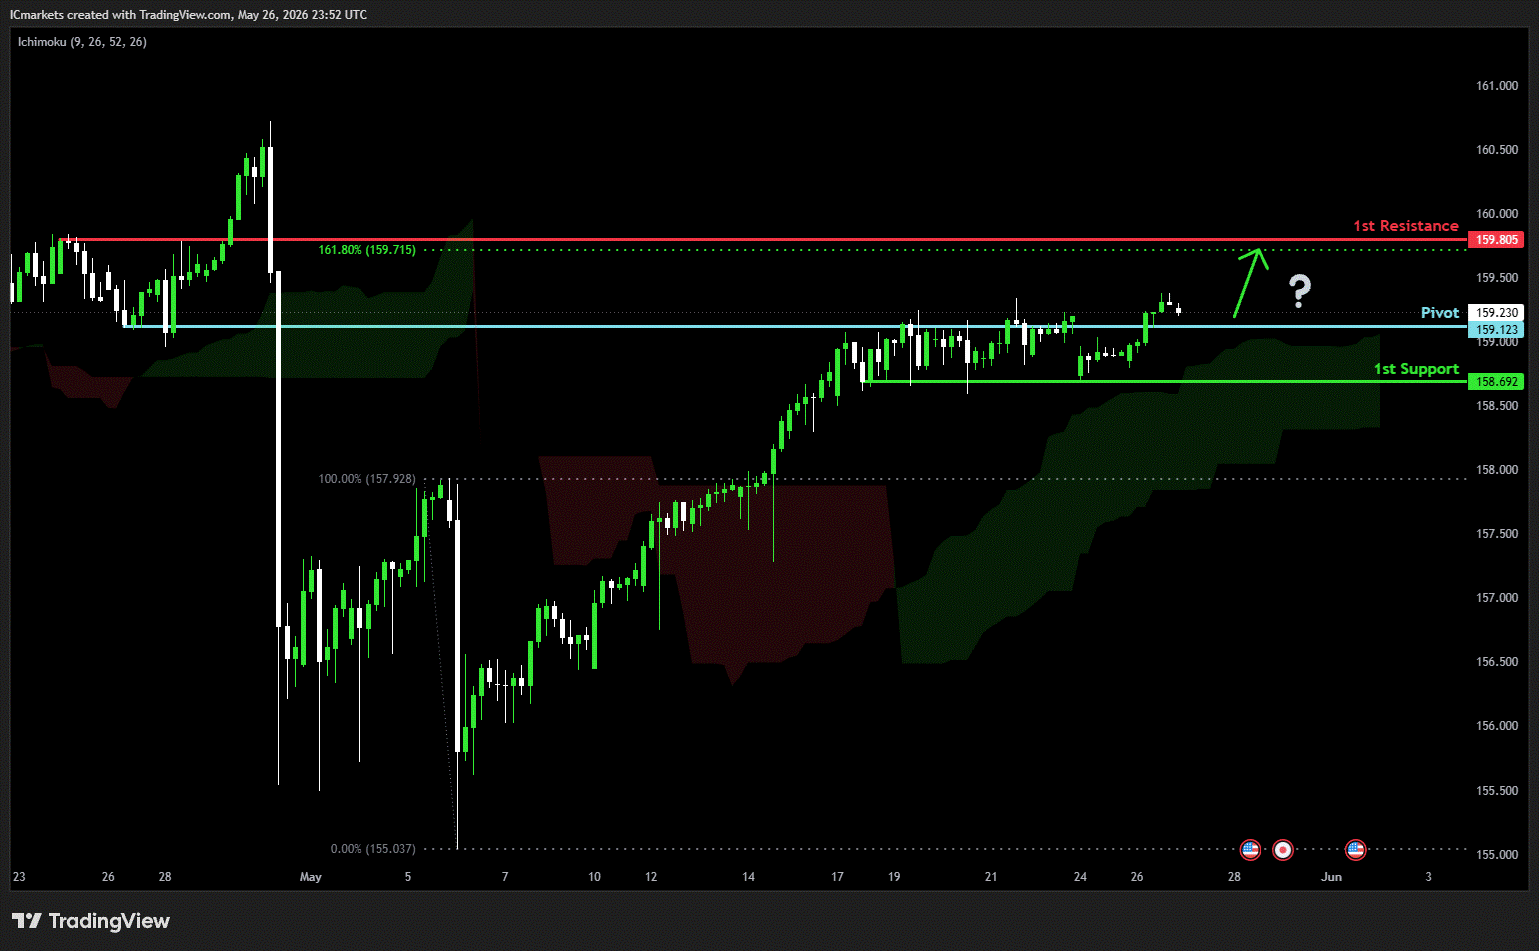
The price could see a short-term pullback toward the pivot before continuing its bearish move down toward the 1st support.
Pivot: 159.12
Supporting reasons: Identified as an overlap resistance, where selling pressures could intensify and potentially cap any upward retracement.
1st support: 158.69
Supporting reasons: Identified as a swing low support, indicating a strong area where buyers might return, and the price could stabilize once again.
1st resistance: 159.80
Supporting reasons: Identified as a pullback resistance that aligns with the 161.8% Fibonacci extension. This level represents the next key area where upward movement could be capped amid increased selling pressure
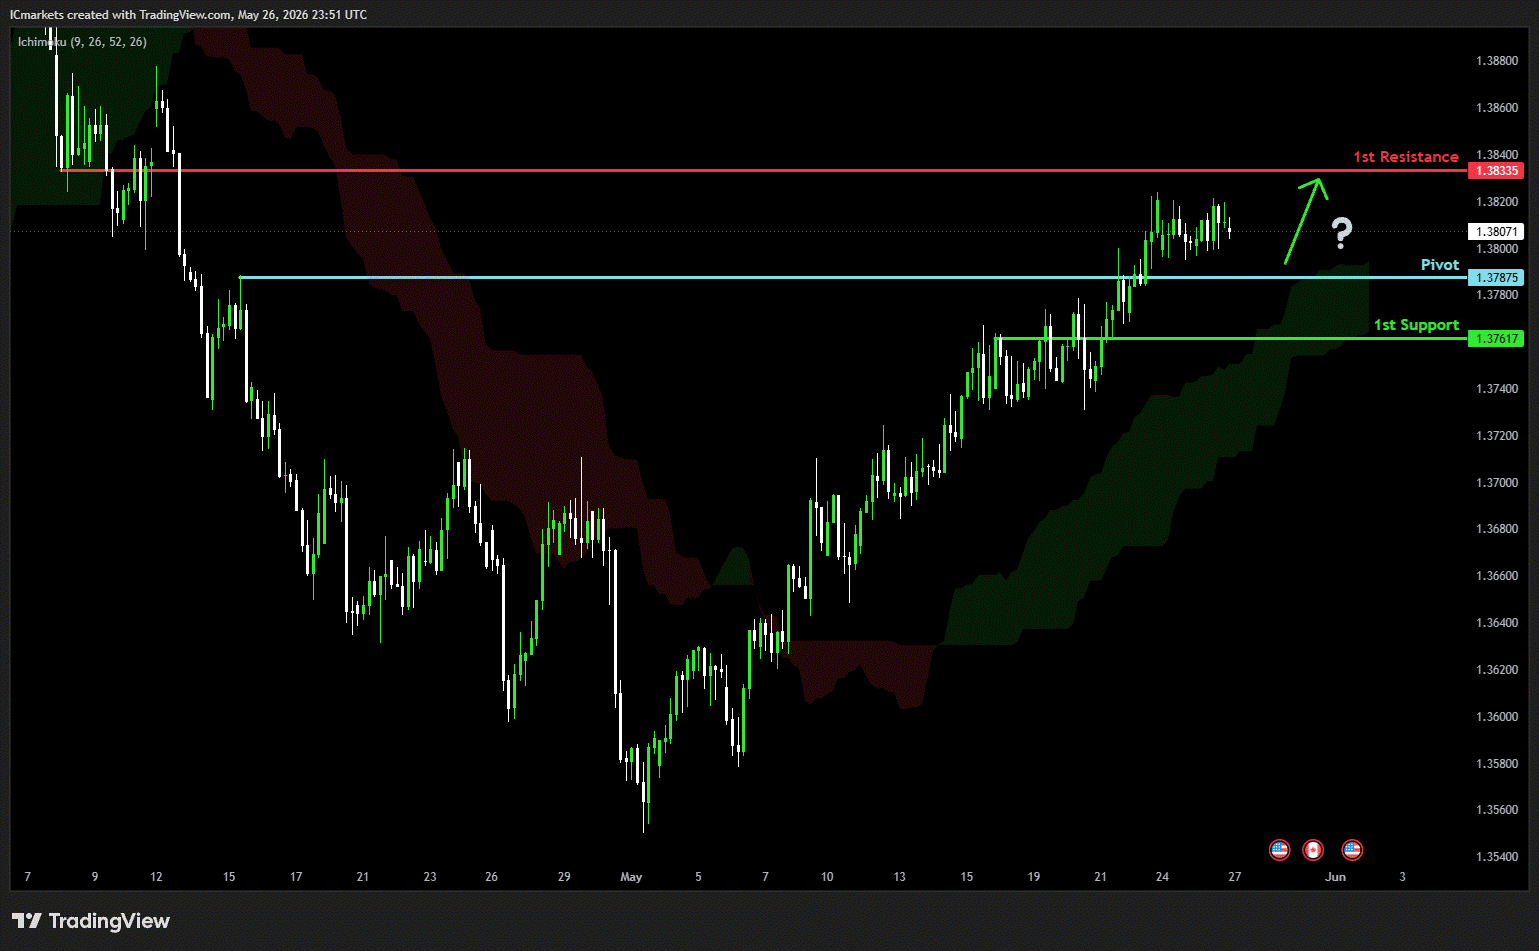
USD/CAD:
Potential Direction: Bullish
Overall momentum of the chart: Bullish
The price could see a short-term pullback toward the pivot before continuing its bearish move down toward the 1st support.
Pivot: 1.3787
Supporting reasons: Identified as a pullback support, where renewed buying pressure could emerge to push the price higher.
1st support: 1.3761
Supporting reasons: Identified as a pullback support, indicating a key level where the price could stabilize once more.
1st resistance: 1.3833
Supporting reasons: Identified as a pullback resistance, making it a possible target for bullish advances and a level where some sellers could return to cap gains
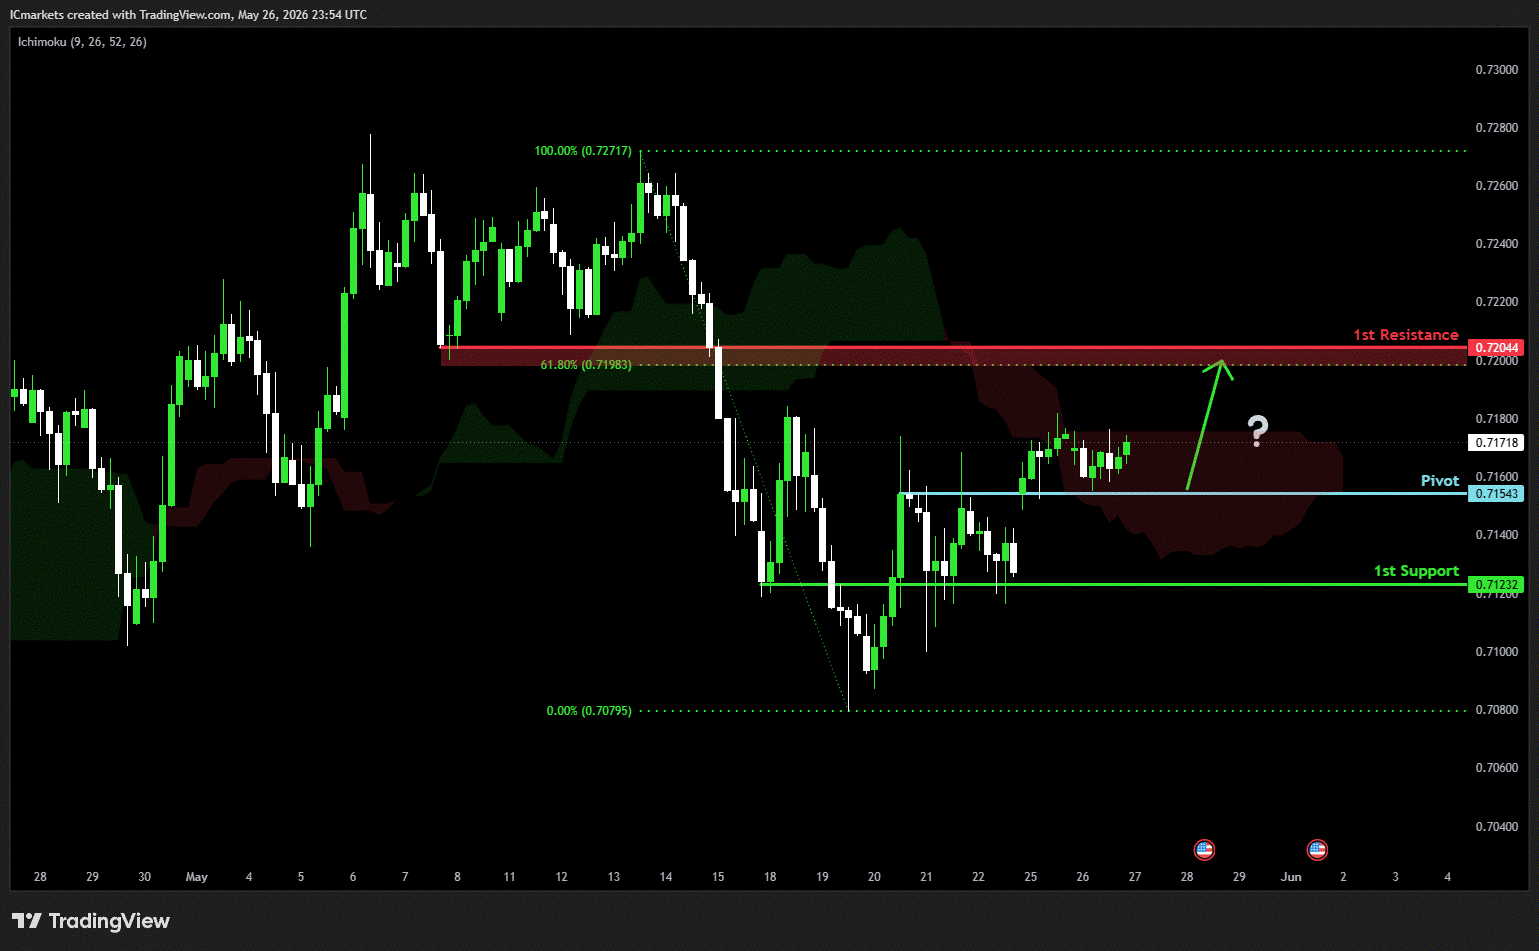
AUD/USD:
Potential Direction: Bullish
Overall momentum of the chart: Bullish
The price has already bounced off the pivot and may continue its bullish move toward the 1st resistance
Pivot: 0.7154
Supporting reasons: Identified as an overlap support, where renewed buying pressure could emerge to push the price higher.
1st support: 0.7123
Supporting reasons: Identified as an overlap support, this area has provided strong support historically and may attract buying interest for a potential short-term bounce
1st resistance: 0.7204
Supporting reasons: Identified as a pullback resistance that aligns with the 61.8% Fibonacci retracement, indicating a potential area that could halt any further upward movement.
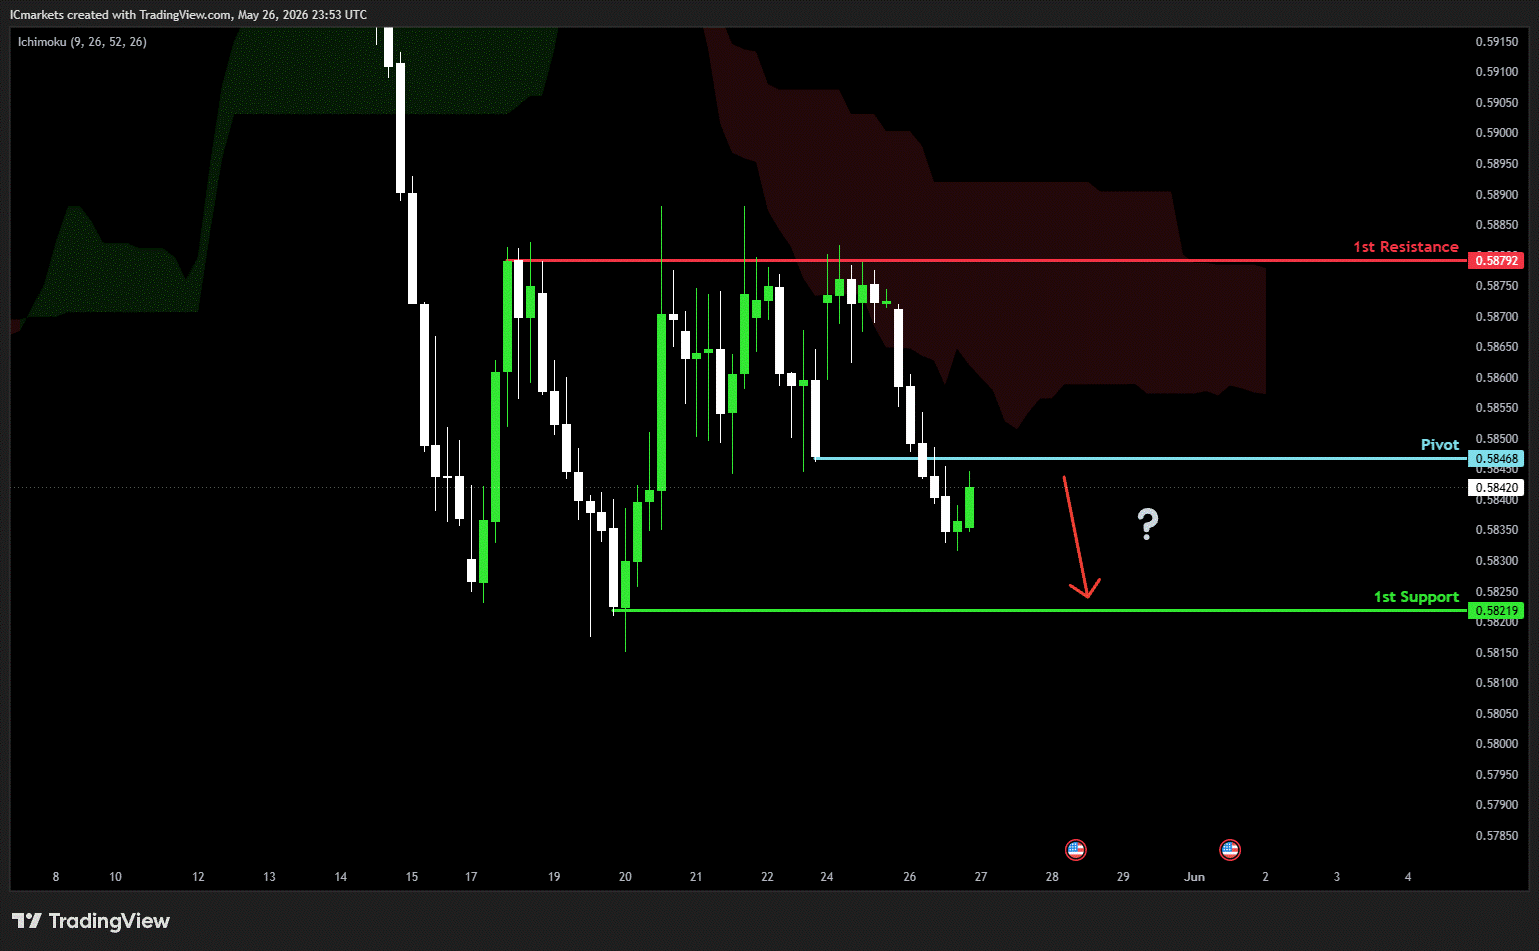
NZD/USD
Potential Direction: Bearish
Overall momentum of the chart: Bullish
The price could see a short-term pullback toward the pivot before continuing its bearish move down toward the 1st support.
Pivot: 0.5846
Supporting reasons: Identified as a pullback resistance, where selling pressures could intensify and potentially cap any upward retracement.
1st support: 0.5821
Supporting reasons: Identified as a swing low support, this area has provided strong support historically and may attract buying interest for a potential short-term bounce
1st resistance: 0.5879
Supporting reasons: Identified as a multi swing high resistance, indicating a potential area that could halt any further upward movement.
US30 (DJIA):
Potential Direction: Bullish
Overall momentum of the chart: Bullish
The price could see a short-term pullback toward the pivot before continuing its bearish move down toward the 1st support.
Pivot: 50,119.72
Supporting reasons: Identified as a pullback support that aligns with the 50% FIbonacci retracement, where renewed buying pressure could emerge to push the price higher.
1st support: 49,703.05
Supporting reasons: Identified as an overlap support, suggesting a potential area where the price could stabilize once again.
1st resistance: 51,050.28
Supporting reasons: Identified as a swing high resistance, indicating a potential area that could halt any further upward movement.
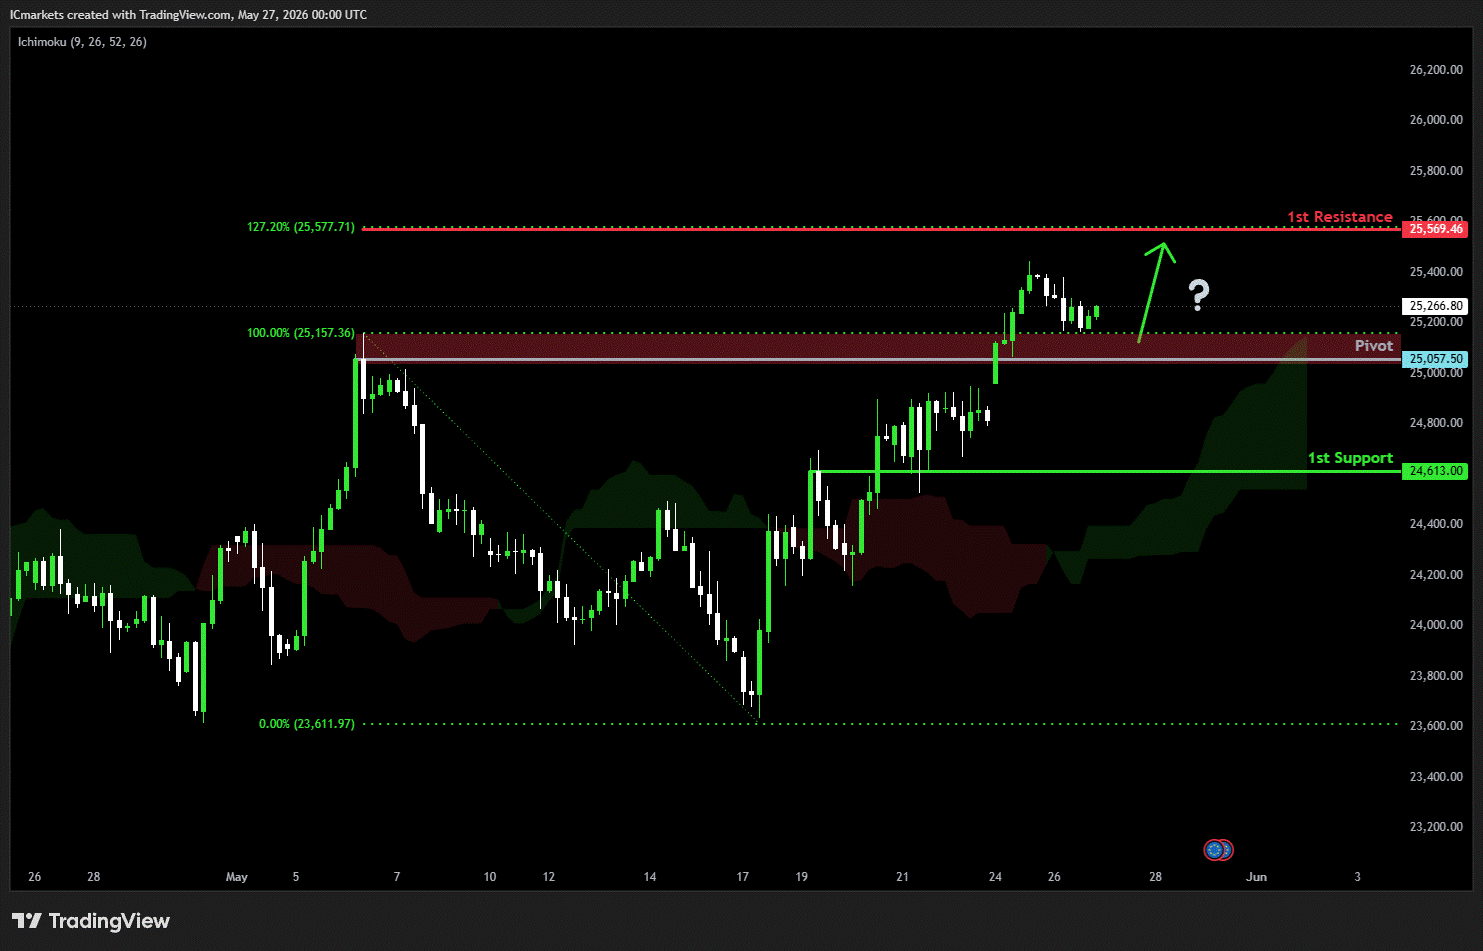
DE40 (DAX):
Potential Direction: Bullish
Overall momentum of the chart: Bullish
The price has already bounced off the pivot and may continue its bullish move toward the 1st resistance
Pivot: 25,057.50
Supporting reasons: Identified as a pullback support, where renewed buying pressure could emerge to push the price higher.
1st support: 24,613
Supporting reasons: Identified as an overlap support, indicating a key level where the price could stabilize once more.
1st resistance: 25,569.46
Supporting reasons: Identified as a resistance that aligns with the 127.2% Fibonacci extension, indicating a potential area that could halt any further upward movement.
US500 (S&P 500):
Potential Direction: Bullish
Overall momentum of the chart: Bullish
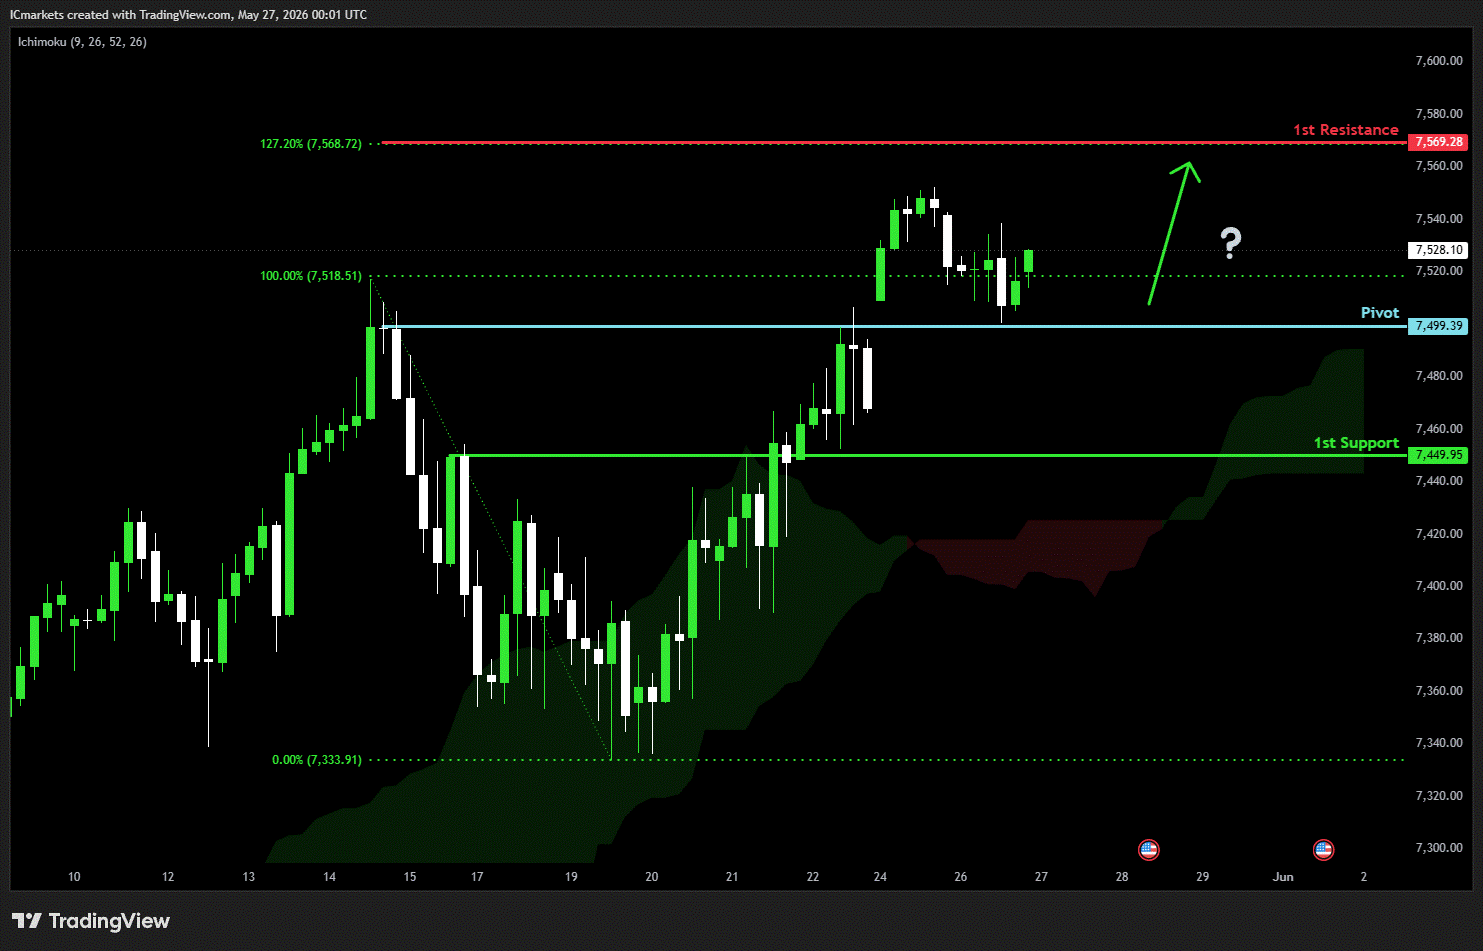
The price has already bounced off the pivot and may continue its bullish move toward the 1st resistance
Pivot: 7,499.39
Supporting reasons: Identified as an overlap support, where renewed buying pressure could emerge to push the price higher.
1st support: 7,449.95
Supporting reasons: Identified as a pullback support, indicating a potential level where the price could stabilize once again.
1st resistance: 7,569.28
Supporting reasons: Identified as a resistance that aligns with the 127.2% Fibonacci extension, indicating a potential area that could halt any further upward movement.
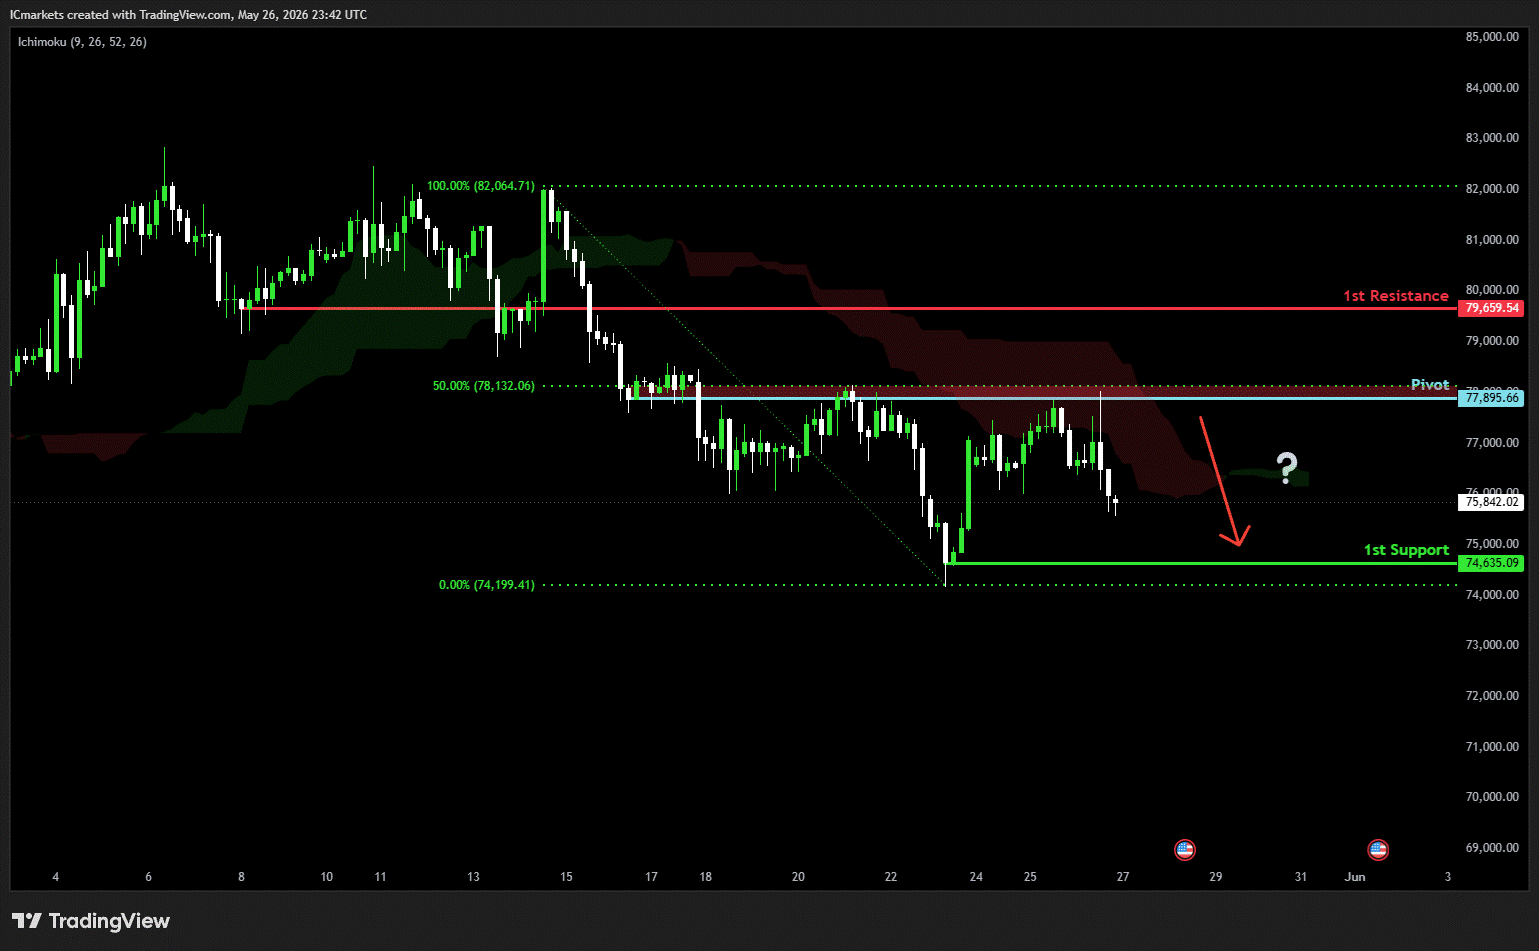
BTC/USD (Bitcoin):
Potential Direction: Bearish
Overall momentum of the chart: Bearish
The price has already reacted off the pivot and may continue its bearish move toward the 1st support.
Pivot: 77,895.66
Supporting reasons: Identified as a pullback resistance that aligns with the 50% Fibonacci retracement, where selling pressures could intensify and potentially cap any upward retracement.
1st support: 74635.09
Supporting reasons: Identified as a swing low support, indicating a potential level where the price could stabilize once more.
1st resistance: 79,659.54
Supporting reasons: Identified as a pullback resistance, indicating a potential area that could halt any further upward movement.
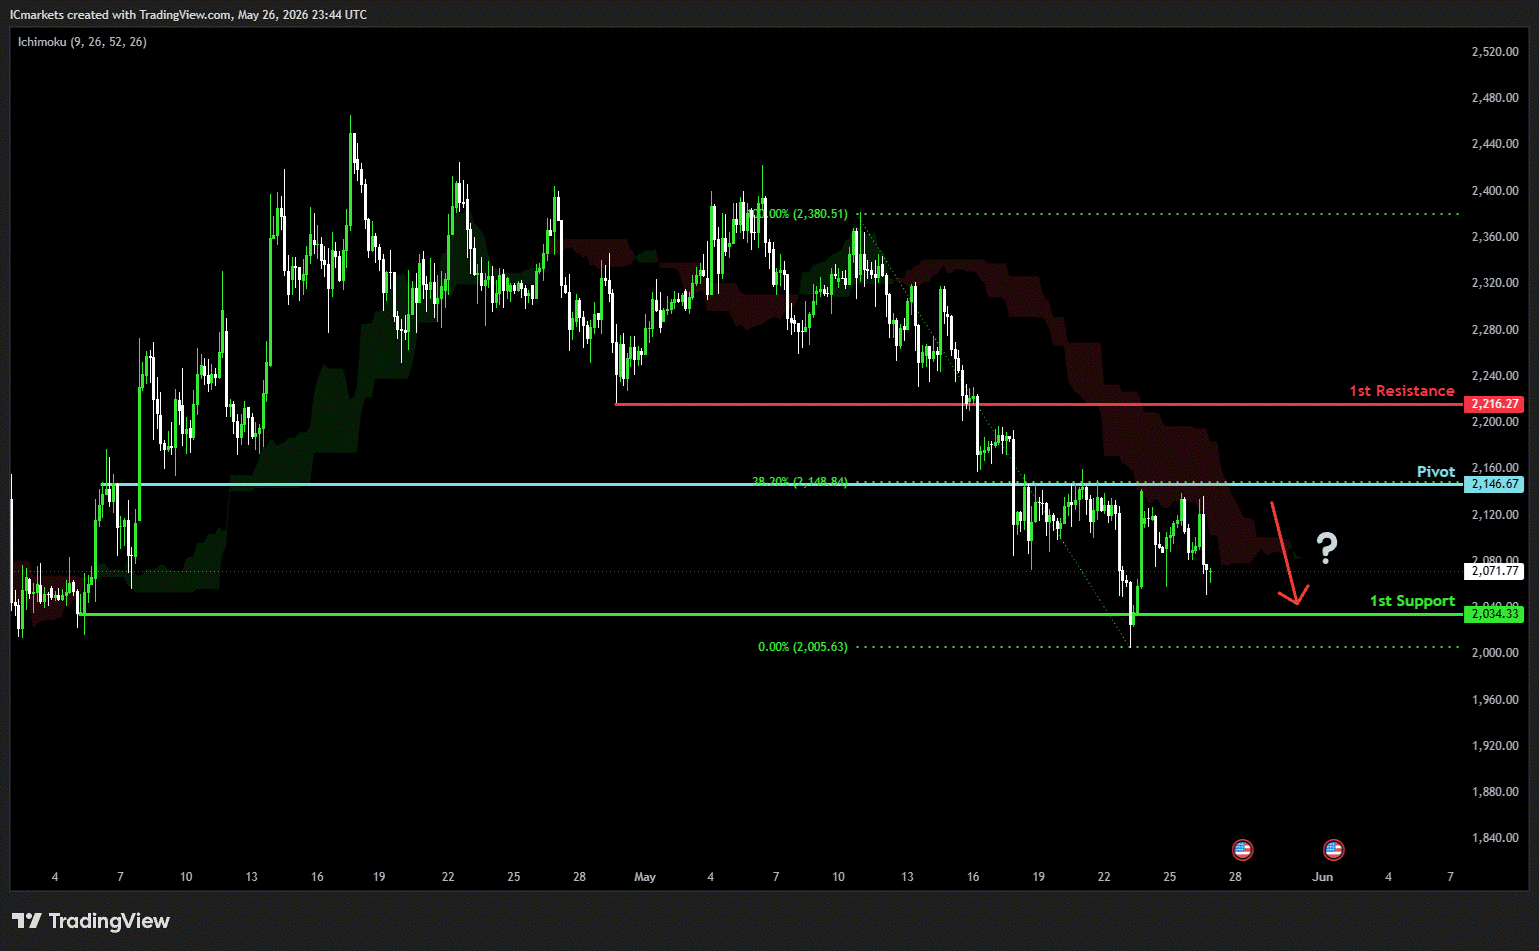
ETH/USD (Ethereum):
Potential Direction: Bearish
Overall momentum of the chart: Bullish
The price could see a short-term pullback toward the pivot before continuing its bearish move down toward the 1st support.
Pivot: 2,146.67
Supporting reasons: Identified as a pullback resistance that aligns with the 38.20% Fibonacci retracement, where selling pressures could intensify and potentially cap any upward retracement.
1st support: 2,034.33
Supporting reasons: Identified as a swing low support, indicating a potential level where the price could stabilize once more.
1st resistance: 2,216.27
Supporting reasons: Identified as a pullback resistance, indicating a potential area that could halt any further upward movement.
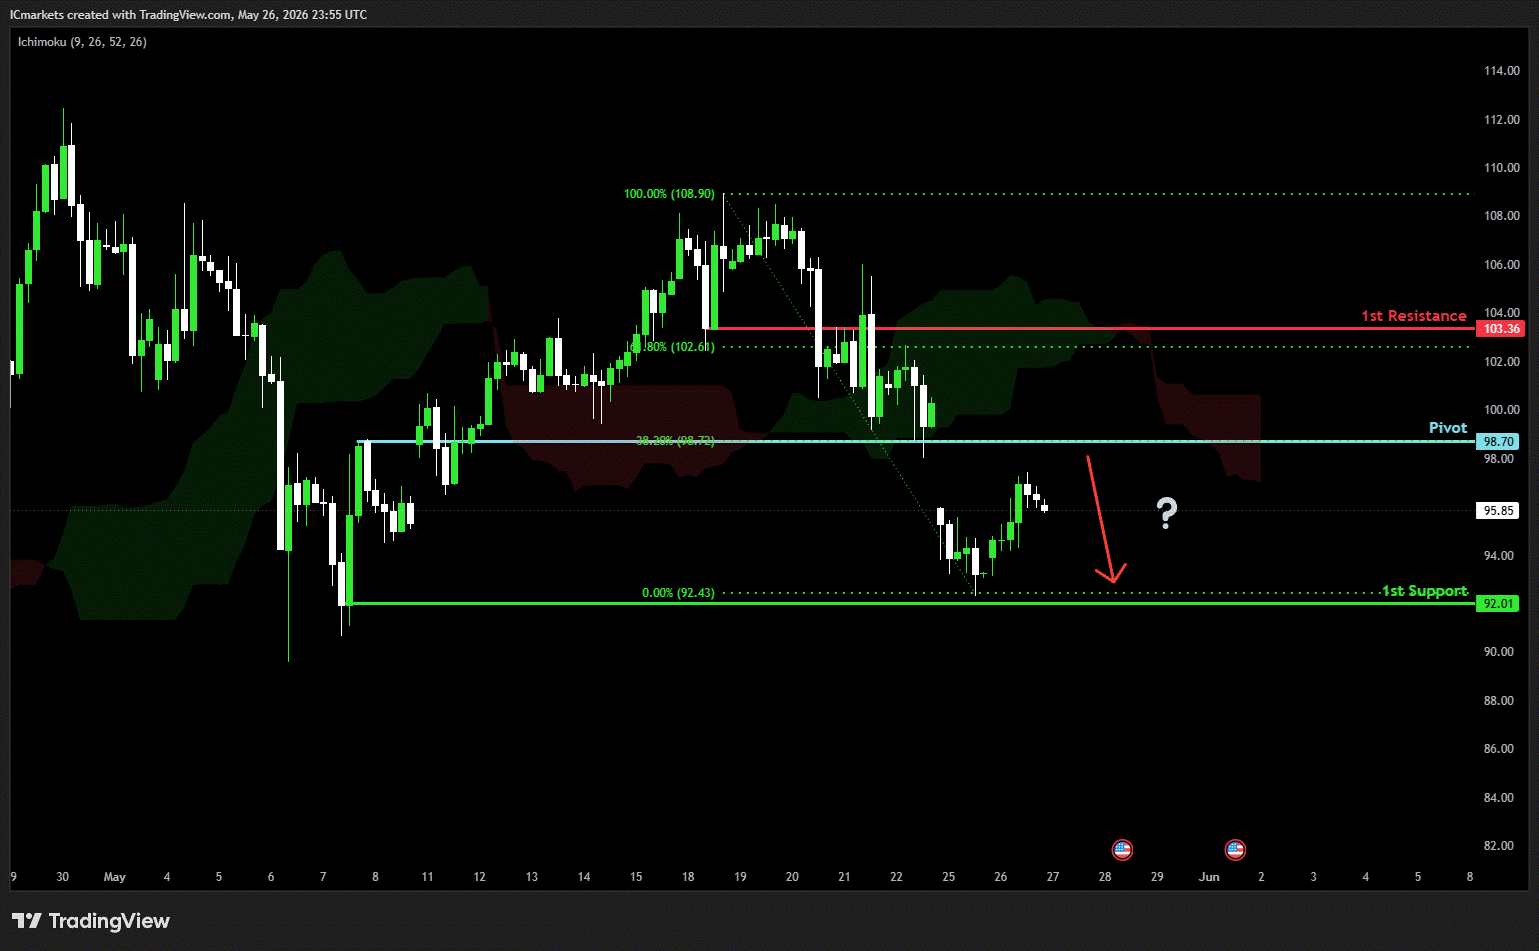
WTI/USD (Oil):
Potential Direction: Bearish
Overall momentum of the chart: Bullish
The price could see a short-term pullback toward the pivot before continuing its bearish move down toward the 1st support.
Pivot: 98.70
Supporting reasons: Identified as a pullback resistance that aligns with the 38.2% Fibonacci retracement, where selling pressures could intensify and potentially cap any upward retracement.
1st support: 92.01
Supporting reasons: Identified as a swing high support, indicating a key level where the price could stabilize once more.
1st resistance: 103.36
Supporting reasons: Identified as a pullback resistance that aligns with the 61.8% Fibonacci retracement, indicating a potential area that could halt any further upward movement.
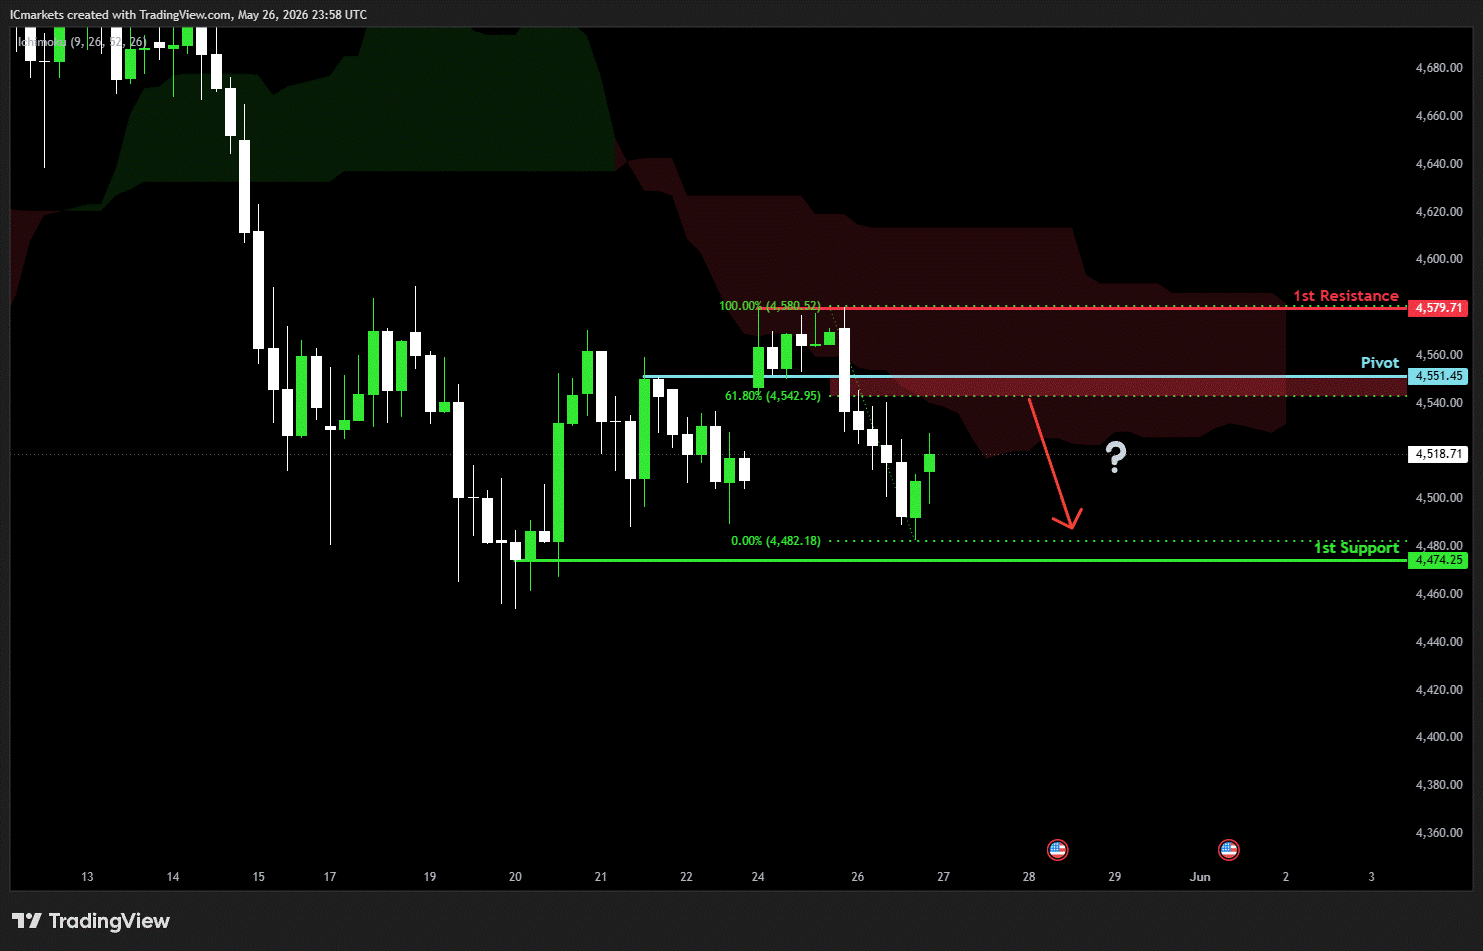
XAU/USD (GOLD):
Potential Direction: Bearish
Overall momentum of the chart: Bullish
The price could see a short-term pullback toward the pivot before continuing its bearish move down toward the 1st support.
Pivot: 4,551.45
Supporting reasons: Identified as a pullback resistance that aligns with the 61.8% Fibonacci retracement, where selling pressures could intensify and potentially cap any upward retracement.
1st support: 4,474.25
Supporting reasons: Identified as a swing low support, indicating a key level where the price could stabilize once more.
1st resistance: 4,579.71
Supporting reasons: Identified as a swing high resistance, indicating a potential area that could halt any further upward movement.
The accuracy, completeness and timeliness of the information contained on this site cannot be guaranteed. IC Markets Global does not warranty, guarantee or make any representations, or assume any liability regarding financial results based on the use of the information in the site.
News, views, opinions, recommendations and other information obtained from sources outside of www.icmarkets.com, used in this site are believed to be reliable, but we cannot guarantee their accuracy or completeness. All such information is subject to change at any time without notice. IC Markets Global assumes no responsibility for the content of any linked site.
The fact that such links may exist does not indicate approval or endorsement of any material contained on any linked site. IC Markets Global is not liable for any harm caused by the transmission, through accessing the services or information on this site, of a computer virus, or other computer code or programming device that might be used to access, delete, damage, disable, disrupt or otherwise impede in any manner, the operation of the site or of any user’s software, hardware, data or property.
The post Wednesday 27th May 2026: Technical Outlook and Review first appeared on IC Your Trading Edge | Official Blog.
Wednesday 27th May 2026: Asia Markets Rally as Japan, South Korea Hit Record Highs Amid Iran Ceasefire Hopes
May 27, 2026 15:01 ICMarkets Market News
Global Markets:
- Asian Stock Markets : Nikkei up 1.13%, Shanghai Composite down 1.11% Hang Seng down 0.80% ASX up 0.19%
- Commodities : Gold at $4,536.76 (0.04%) Silver at $77.000 (0.51%), Brent Oil at $95.14 (-1.58%), WTI Oil at $92.18 (-1.79%)8
- Rates : US 10-year yield at 4.470, UK 10-year yield at 4.8780, Germany 10-year yield at 2.9836
News & Data:
- (USD) CB Consumer Confidence 93.1 to 91.9 expected
Markets Update:
Asia-Pacific markets climbed Wednesday, with Japan and South Korea’s benchmark indexes reaching fresh highs as investors monitored recent U.S. military action in Iran, the fragile Washington-Tehran ceasefire and hopes that diplomatic negotiations could still produce a deal.
Japan’s Nikkei 225 advanced 1.49% to a record high, while the TOPIX gained 0.57%. In South Korea, the KOSPI surged 4.84%, though the smaller KOSDAQ slipped 0.68%. Shares of Samsung Electronics jumped 6% after unionized workers approved a provisional wage agreement, easing concerns over a potential strike that could have disrupted global semiconductor supply chains.
Australia’s S&P/ASX 200 edged up 0.13%. In Greater China, Hong Kong’s Hang Seng Index was little changed, while mainland China’s CSI 300 rose 0.27%.
Meanwhile, U.S. forces conducted what the Pentagon called “self-defense” strikes in southern Iran, targeting missile launch sites and vessels allegedly laying mines, despite Washington maintaining its commitment to the ceasefire. President Donald Trump said negotiations with Iran were “proceeding nicely,” but warned military action could resume if talks collapse.
On Wall Street, the S&P 500 and Nasdaq Composite closed at record highs, while the Dow Jones Industrial Average declined 0.23%.
Upcoming Events:
- 12:15 PM GMT – USD ADP Weekly Employment Change
The post Wednesday 27th May 2026: Asia Markets Rally as Japan, South Korea Hit Record Highs Amid Iran Ceasefire Hopes first appeared on IC Your Trading Edge | Official Blog.
French consumer sentiment slumps further in May, falling to lowest since March 2023
May 27, 2026 14:42 Forexlive Latest News Market News
French consumer confidence tumbled lower in the latest month to 82, that being the weakest such reading since March 2023. Since the start of the US-Iran conflict, consumer confidence has fallen by 9 points in the past three months. That marks the steepest decline over the same period since 2022.
The details reveal a further decline across major sub-indices. Of note, the reading on the expected financial situation falls to -20 – also the lowest since March 2023. Then, there was also a steep decline in the reading for opportunity to make major purchases. That fell five points to -40, straying further away from the long-term average of -16.
The only bit of good news is that employment conditions held steadier while the outlook on future inflation also dropped back a little after surging in April. The latter fell back to 2 from 10 last month, but still sits considerably higher from -29 back in February.
This article was written by Justin Low at investinglive.com.
General Market Analysis – 27/05/26
May 27, 2026 14:40 ICMarkets Market News
US Stocks Push to Fresh Highs as Markets Look Through Middle East Risks – S&P up 0.6%
US equity markets moved higher overnight, with technology stocks leading the gains as investors continued to cautiously price in the possibility that tensions in the Middle East may remain contained despite another volatile round of geopolitical headlines. The S&P 500 rose 0.61% to close at a fresh record high of 7,519, while the Nasdaq outperformed again, climbing 1.19% to 26,656. The Dow Jones lagged slightly, slipping 0.23% to finish at 50,461.
That improvement in risk appetite was reflected in bond markets, where Treasury yields fell sharply as traders took a more optimistic view of developments in the Gulf. US 2-year yields dropped 8.9 basis points to 4.032%, while the benchmark 10-year yield fell 7.3 basis points to 4.485%.
Currency markets also reflected improving confidence, with the US dollar strengthening broadly against the majors. The USD Index gained 0.18% to 99.16 as traders continued to favour the greenback amid elevated geopolitical uncertainty and diverging global growth expectations.
Commodity markets remained volatile throughout the session. Oil prices initially traded lower before reversing sharply higher into the close as supply concerns remained front of mind for energy traders. Brent crude rose 3.51% to $99.51 per barrel, while WTI crude climbed 3.76% to $93.89. In contrast, gold came under pressure from the stronger US dollar and easing safe-haven demand, falling 1.37% to $4,507.88 per ounce.
Correlations Break on Geopolitics – Volatility to Come
Markets spent much of the trading day yesterday digesting reports of fresh US strikes against Iran, even as peace negotiations continued in the background. Despite the conflicting developments, broader market sentiment remained relatively constructive, with investors appearing increasingly comfortable that the conflict may not escalate into a wider regional disruption. However, several correlations in terms of risk broke down, for example, the dollar pushing higher whilst US yields fell and growth stocks rose. Usually, in these circumstances, there will be a sharp correction for one or several products in the coming days, and many traders are expecting that in the coming sessions, with the situation in the Middle East seemingly coming to a head. If a deal is concluded, then expect stocks to continue to rise on investor optimism, with oil to drop hard and the dollar and yields to fall. However, if we do see a restart of serious hostilities – which feels likely if we see more strikes today – then we could see some hard moves as the market is forced to price in a longer conflict and higher oil prices for longer.
Geopolitics to Dominate Trading Sessions Again Today
Geopolitics looks set to dominate market moves today, with the situation between the US and Iran seemingly coming to a key juncture this week. However, there are some fundamental updates on the calendar which will also influence local markets. It is a busy Asian session today, with Australia and New Zealand firmly in focus. Australian CPI data headlines (exp +0.6% m/m, +4.4% y/y) kick off the local calendar, while the Reserve Bank of New Zealand delivers its latest interest rate decision. They are expected to keep rates on hold at 2.25%; however, the meeting will be live, with some in the market calling for a 25-basis-point hike to temper inflationary concerns. There is little else on the calendar to move the dial in the latter two sessions; however, traders are still expecting volatile markets, with any fresh headlines likely to lead to substantial moves.
Explore all upcoming market events in the Economic Calendar.
The post General Market Analysis – 27/05/26 first appeared on IC Your Trading Edge | Official Blog.
IC Markets Global – Asia Fundamental Forecast | 27 May 2026
May 27, 2026 14:40 ICMarkets Market News
IC Markets Global – Asia Fundamental Forecast | 27 May 2026
What happened in the U.S. session?
Markets oscillated between Middle East peace-talk optimism and renewed geopolitical tension after fresh U.S. strikes on Iran, creating a volatile split between oil benchmarks (Brent up, WTI down). The standout macro data was April’s shockingly hot 1.4% PPI print, the largest monthly gain in four years, reinforcing inflation concerns despite new Fed Chair Kevin Warsh’s signal that rate cuts aren’t imminent.
What does it mean for the Asia Session?
Australia’s hotter-than-expected CPI reading (4.6% YoY), which strengthens the case for further RBA rate hikes and supports the Australian dollar, combined with China’s robust 15.5% year-to-date surge in industrial profits, points to corporate earnings resilience despite property sector headwinds.
The Dollar Index (DXY)
Key news events today
No major news event
What can we expect from DXY today?
The dollar’s tone today is firm to bullish, with support coming from sticky inflation worries, a relatively strong U.S. economy, and ongoing safe-haven flows amid global uncertainty. Against that backdrop, traders are watching Fed signals and incoming U.S. data closely, because any sign that inflation stays hot or growth remains resilient could keep the dollar elevated into the next session.
Central Bank Notes:
- The Federal Open Market Committee (FOMC) is widely expected to hold the federal funds rate target range steady at 3.50%–3.75% at its April 28–29, 2026, meeting, as oil prices remain elevated around $108 per barrel for Brent crude amid ongoing US-Israel tensions with Iran, alongside surging inflation from energy shocks, further delaying any 2026 rate cuts potentially beyond September.
- The Committee continues to pursue maximum employment and 2% inflation goals, with the labor market showing mixed signals as nonfarm payrolls rose by 178,000 in March 2026—beating lowered expectations but driven partly by strike reversals—and the unemployment rate edged down to 4.3% from 4.4% in February.
- Officials face heightened risks from geopolitical tensions, soaring oil prices, and accelerating inflation, with CPI jumping to 3.3% year-over-year in March 2026 from 2.4% in February due to a 10.9% monthly energy surge, headline PCE pressured higher, and core PCE estimates around 3.1% or more.
- Economic activity continues to cool after robust Q4 2025 growth near 5%, with the Atlanta Fed GDPNow estimating Q1 2026 growth at 1.3% amid softer consumer spending, strike impacts, and labor data despite some resilience.
- March 2026’s Summary of Economic Projections forecasts 2026 unemployment at a median around 4.4%, GDP growth revised higher, and core PCE up to 2.7%, with the dot plot still signaling one cut in 2026 to a median 3.25%–3.50% funds rate amid softer labor but inflation upticks.
- The Committee maintains its data-dependent stance amid a mixed labor market, inflation well above target from oil shocks, and geopolitical risks, likely holding rates at 3.50%-3.75% with persistent divisions and hawkish tones on cuts.
- The FOMC continues its adjusted quantitative tightening, with Treasury rolloff caps at $5 billion per month and agency MBS at $35 billion per month to manage reserves amid post-2025 balance sheet adjustments.
- The next meeting is scheduled for 16 to 17 June 2026.
Next 24 Hours Bias
Weak Bullish
Gold (XAU)
Key news events today
No major news event
What can we expect from Gold today?
Gold remains a key safe-haven asset amid ongoing geopolitical risks, including Middle East conflicts and U.S. tariff policies under President Trump, which have kept prices elevated compared to last year (approximately 65% higher year-over-year). While recent weeks saw volatility with gold dropping from its January peak above $5,500, the broader rally has remained robust, with central banks continuing to purchase gold and speculators increasing net-long positions.
Next 24 Hours Bias
Medium Bearish
The Australian Dollar (AUD)
Key news events today
CPI m/m (1:30 am GMT)
CPI y/y (1:30 am GMT)
Trimmed Mean CPI m/m (1:30 am GMT)
What can we expect from AUD today?
The Australian dollar has been weakening in late May 2026, falling from a four-year high and briefly dropping below 71 US cents as expectations for an RBA interest rate hike diminished. The key driver was December job data revealing unemployment climbed to its highest level in 4½ years, leading traders to cut the probability of a May rate increase from 80% to 64%.
Central Bank Notes:
- The Reserve Bank of Australia (RBA) raised its cash rate by 25 basis points to 4.35% at the 5 May 2026 meeting, moving into a more restrictive stance as inflation pressures re‑accelerated and the board judged the previous 4.10% level insufficient to re‑anchor the medium‑term outlook.
- The RBA lifted the cash rate from 4.10% to 4.35% at the 5 May meeting in an 8–1 vote, flagging that the stance is now “more restrictive” and that the Council sees a low but non‑trivial chance of further hikes if inflation risks crystallise.
- Headline CPI has jumped to 4.6% year‑on‑year for the 12 months to March 2026, up from around 3.7% in February, with trimmed‑mean inflation still above 3.0% (about 3.3–3.8% depending on the series), keeping inflation clearly outside the 2–3% target band.
- Recent monthly indicators remain sticky in services, housing‑related costs, and discretionary spending, with January and March data showing only modest easing and some upside surprises in housing‑price‑related components, underpinning the case for a stronger‑than‑expected May hike.
- Global growth has been modestly revised up but remains tempered by ongoing geopolitical tensions, commodity‑price volatility, and elevated oil prices linked to the Middle East conflict, which directly feed into Australian import‑price and transport‑cost inflation.
- Markets now price the cash rate at 4.35% in June, with futures pathways suggesting a high‑probability hold at the June meeting and only a modest chance of another 25bp hike later in 2026, contingent on further upside in CPI or services‑price data.
- The RBA continues to emphasise its “data‑dependent” approach under the dual mandate, seeking to bring inflation back toward target without materially undershooting growth or employment, while acknowledging that the Middle East‑driven shock has shifted the path of inflation and policy.
- The May communication leaned hawkishly neutral to hawkish, with the decision to hike by 25bp and a run‑of‑material referencing rising inflation expectations and the risk of second‑round effects, while still leaving room for a pause in June if upcoming monthly CPI and labour‑force data show a moderating trend.
- The next meeting is on 15 to 16 June 2026.
Next 24 Hours Bias
Weak Bearish
The Kiwi Dollar (NZD)
Key news events today
Official Cash Rate (2:00 am GMT)
RBNZ Monetary Policy Statement (2:00 am GMT)
RBNZ Rate Statement (2:00 am GMT)
RBNZ Press Conference (3:00 am GMT)
RBNZ Gov Breman Speaks (8:10 pm GMT)
What can we expect from NZD today?
The New Zealand dollar has faced recent weakness against the US dollar, trading around 0.5835 in mid-May 2026 as the greenback strengthened on Iran deal hopes and expectations of a more restrictive Federal Reserve stance. However, New Zealand’s Q1 Producer Price Index input of 1.4% QoQ (beating the 0.8% forecast) could support speculation of tighter Reserve Bank of New Zealand monetary policy.
Central Bank Notes:
- The Reserve Bank of New Zealand’s (RBNZ) Monetary Policy Committee (MPC) is widely expected to hold the Official Cash Rate (OCR) steady at 2.25% at its 8 April 2026 Monetary Policy Review, aligning with unanimous market consensus from Reuters polls and previews.
- The MPC continues its data-dependent “wait-and-see” approach after February’s pause, balancing stimulus from prior 325-basis-point cuts against inflation’s path back to the 2% target, with readiness for gradual normalization only if the recovery strengthens or inflation exceeds forecasts.
- Headline CPI, last at 3.1%, is on track to re-enter the 1-3% band in Q2 2026 and hit 2% by mid-2027, aided by spare capacity, moderating wages, and softer food/fuel prices; two-year business inflation expectations have ticked up slightly to 2.37%.
- Household spending and housing remain subdued amid cautious consumption, low net migration, and labor market softness, though easing retail rates support budgets; high-frequency GDP indicators show steadying momentum in an early recovery phase.
- Accommodative borrowing costs from the low OCR are boosting mortgage approvals and sentiment, but business credit growth lags due to uneven confidence; overall stimulus persists below the 3% neutral rate.
- Risks are balanced, with a favorable global environment—including stronger dairy/meat exports and a softer NZ dollar—offsetting oil shocks and prior China/US trade worries; vigilance remains on second-round inflation effects.
- Forecasts point to potential OCR hikes starting late 2026 (e.g., December) or early 2027 to 2.50% by year-end if activity/inflation firms, but policy stays supportive if recovery unfolds gradually as expected.
- The next meeting is on 27 May 2026.
Next 24 Hours Bias
Medium Bearish
The Japanese Yen (JPY)
Key news events today
BOJ Gov Ueda Speaks (12:00 am GMT)
What can we expect from JPY today?
The yen has been volatile because Japan’s authorities are trying to slow its decline while bond-market moves and rate differentials continue to favor the dollar. Reuters reported that Japan has been weighing changes to super-long bond issuance after sharp yield moves, and that official intervention earlier this month briefly lifted the yen, but the currency later remained weak around the mid-150s per dollar.
Central Bank Notes:
- The Policy Board of the Bank of Japan left the short‑term policy rate unchanged at 0.75% at the 27–28 April 2026 meeting, with markets broadly expecting the same level into May 2026 as the bank continues a data‑dependent, gradual‑normalisation stance.
- The BOJ targets the uncollateralized overnight call rate around 0.75%, signaling that any further hikes toward 1.0% will hinge on wage‑inflation persistence, yen stability, and real‑activity data rather than a pre‑announced timetable.
- JGB tapering continues on plan, with outright purchases trimmed by ¥400 billion quarterly through Q1 2026, then reduced to ¥200 billion from April onward, aiming for roughly ¥2–3 trillion in monthly net purchases by mid‑2026, adjustable if market or yen volatility spikes.
- Japan’s economy posts moderate growth into Q1 2026, supported by resilient exports and prior stimulus, but the BOJ has downgraded its 2026 growth outlook as external headwinds and Middle‑East‑related shocks weigh on the pace.
- Core CPI (ex‑fresh food) is running in the mid‑1% range y/y, with headline inflation at about 1.5% y/y in March 2026, while core‑core measures remain above 2%, reflecting sticky services‑side and wage‑driven inflation.
- Input‑cost pressures ease from prior peaks, yet services inflation, the 2026 shunto wage deals near 5%, and expectations anchored above 2% support continued price pressures, with upside risks from further yen weakness and geopolitical spikes.
- Near‑term real GDP may run below trend due to policy tightening and external shocks (e.g., Iran‑related energy risks), but negative real rates, wage gains, and targeted fiscal/capex support should underpin a gradual rebound in consumption and investment.
- Medium‑term, overseas recovery, labor‑shortage‑driven wage growth, and productivity improvements are expected to keep core inflation near or above 2%, enabling the BOJ to gradually lift rates toward 1.0% in 2026–2027 if activity and wage‑inflation conditions remain aligned.
- The next meeting is on 15 to 16 June 2026.
Next 24 Hours Bias
Strong Bearish
Oil
Key news events today
EIA Crude Oil Inventories (2:30 pm GMT)
What can we expect from Oil today?
Oil is trading with a softer tone today, with recent reporting showing Brent around $99.22 on May 26, and the market is still focused on possible higher OPEC+ output, U.S.-Iran negotiations, and supply-side risks that can quickly shift prices. The biggest drivers are the chance of another production increase from OPEC+, expectations for U.S. crude inventory builds, and ongoing geopolitical tension that has kept risk premiums elevated, even as some forecasts now point to oversupply pressure later in 2026.
Next 24 Hours Bias
Weak Bearish
The post IC Markets Global – Asia Fundamental Forecast | 27 May 2026 first appeared on IC Your Trading Edge | Official Blog.