Articles

Gold Price Analysis: XAU/USD flat-lined below $1900 level amid thin liquidity
100385 December 31, 2020 20:17 FXStreet Market News
- Gold attracted some dip-buying near $1885 region amid the prevalent USD selling bias.
- The underlying bullish sentiment in the equity markets kept a lid on any further gains.
Gold managed to rebound around $10 from daily swing lows and was last seen trading in the neutral territory, around the $1895 region.
Having faced rejection near the $1900 mark, the precious metal edged lower during the early part of the trading action on Thursday. The pullback was exclusively sponsored by the underlying bullish tone in the equity markets, which tends to undermine demand for the safe-haven XAU/USD.
However, the prevalent bearish sentiment surrounding the US dollar assisted the dollar-denominated commodity to attract some dip-buying near the $1885 region. In fact, the USD Index refreshed multi-year lows on Thursday amid the likelihood of additional US financial aid package.
Apart from this, expectations that the Fed will keep interest rates lower for a longer time extended some additional support to the non-yielding yellow metal. This, along with worries about the discovery of a new faster-spreading variant of the coronavirus might also help limit the downside.
As Eren Sengezer, Editor at FXStreet explains: “Despite the liquidity flooding the financial markets, inflation outlook in major economies remains subdued and major central banks voiced their commitment to keeping their policies extremely loose until they see a convincing increase in price pressures. This suggests that investors will not give up on gold in the near future.”
“On the other hand, a return to normality with mass COVID-19 vaccinations could make risk-sensitive assets more attractive, especially in the second half of 2021, and dampen the demand for the yellow metal. Overall, gold outlook remains bullish with the rate of increase in prices softening when compared to 2020,” Eren added further.
Technical levels to watch
Full Article
Chile Unemployment rate down to 10.8% in November from previous 11.6%
100384 December 31, 2020 20:17 FXStreet Market News
US dollar index (DXY) fades recent bounces off 32-month low while receding to 89.60 during the early Thursday. In doing so, the greenback gauge reverses the recovery gains from the multi-month low, marked during the Asian session, amid failures to cross the immediate resistance line.
Full Article
GBP/USD needs to break above 1.3710 to extend the rally
100383 December 31, 2020 19:56 FXStreet Market News
The British pound is the strongest currency, with GBP/USD poised to close 2020 at its highest in over two years. The cable traded as high as 1.3685 as bulls dominate despite coronavirus concerns, FXStreet’s Chief Analyst Valeria Bednarik informs.
Key quotes
“On Wednesday, the United Kingdom announced tougher restrictive measures amid record contagions in the country. The Midlands, North East, parts of the North West and parts of the South West are among those escalated to tier four. News that the government approved the emergency use of the AstraZeneca vaccine partially overshadowed the discouraging covid-related headlines.”
“The broad dollar’s weakness adds to the bullish case of the pair. In the near-term, and according to the 4-hour chart, the risk remains skewed to the upside, despite overbought readings. Another leg north is to be expected on a break above 1.3710, the immediate resistance level.”
See – GBP/USD Price Forecast 2021: Cable braces for calendar comeback amid three exits
Full Article
GBP/USD retreats below 1.3650 after touching fresh 31-month high at 1.3686
100382 December 31, 2020 19:56 FXStreet Market News
- GBP/USD edges lower from multi-year high it set earlier.
- Trading action is expected to remain subdued in the remainder of the day.
- US Dollar Index registers small losses ahead of Jobless Claims data.
The GBP/USD pair extended the weekly rally and touched its highest level since May 2018 at 1.3686. Ahead of the American session, however, the pair reversed its direction and was last seen trading at 1.3640, gaining 0.13% on a daily basis.
On Wednesday, the UK parliament approved the trade deal with the UK as expected. Meanwhile, British Health Secretary Matt Hancock announced that they will be tightening coronavirus-related restrictions after confirming more than 50,000 cases on Tuesday.
Nevertheless, these developments failed to trigger a significant market reaction and the broad-based USD weakness allowed GBP/USD to remain bullish.
Later in the day, the weekly Initial Jobless Claims from the US will be the last data release of the year. Ahead of this report, the US Dollar Index is posting small daily losses at 89.63.
GBP/USD 2021 outlook
GBP/USD Price Forecast 2021: Cable braces for calendar comeback amid three exits.
“After a year full of surprises, it is hard to predict, but going on a limb, there is room for the pound to blossom in the spring, as it outperforms rivals in exiting the covid crisis and as Brexit is forgotten,” says FXStreet Analyst Yohay Elam. “Sterling could later turn south once peers catch up and the exit from the EU takes its toll.”
Technical levels to consider
Full Article
Gold Price Analysis: XAU/USD to remain bullish in 2021 as central banks keep supporting recovery
100381 December 31, 2020 19:45 FXStreet Market News
Gold (XAU/USD) surged to all-time highs above $2,000 in August. The yellow metal went into a consolidation phase below $2,000 toward the end of summer and staged a deep correction in November. However, the improving market sentiment in the last quarter of the year also weighed heavily on the USD and allowed XAU/USD to rebound toward $1,900. Gold looks to build on 2020 gains with central banks staying dovish, FXStreet’s Eren Sengezer reports.
Key quotes
“Despite the liquidity flooding the financial markets, inflation outlook in major economies remains subdued and major central banks voiced their commitment to keeping their policies extremely loose until they see a convincing increase in price pressures. This suggests that investors will not give up on gold in the near future.”
“A return to normality with mass COVID-19 vaccinations could make risk-sensitive assets more attractive, especially in the second half of 2021, and dampen the demand for the yellow metal.”
“The Core Personal Consumption Expenditures (PCE) Price Index, the Fed’s preferred gauge of inflation, dropped to 1.4% on a yearly basis in October. The Fed might take a dovish action unless there is a dramatic jump in inflation data and XAU/USD could gather bullish momentum.”
“On the monthly chart, the price seems to have recovered above the ascending trend line coming from May 2019, confirming the bullish outlook. If XAU/USD continues to follow that line, a rise above $2,000 could be expected around mid-2021.”
Full Article
EU Commission regrets US decision to extend tariffs to further EU products
100380 December 31, 2020 19:12 FXStreet Market News
The European Commission said on Thursday that it regrets the United States’ decision to extend tariffs to further European products, as reported by Reuters.
“The US action disrupts negotiations to find a settlement to aircraft subsidy dispute,” the EU Commission further noted and said that it will engage with the new US administration at the earliest possible moment to find a solution.
Earlier in the day, the US announced that it will impose additional tariffs on French and German aircraft parts and liquor.
Market reaction
There was no immediate market reaction to this headline and the EUR/USD pair was last seen posting small daily losses at 1.2280.
Full Article
GBP/USD Forecast: Bulls dominate, despite coronavirus concerns
100378 December 31, 2020 19:12 FXStreet Market News
GBP/USD Current price: 1.3671
- The UK Parliament backed the post-Brexit trade deal with the EU.
- UK´s record coronavirus contagions forced the government to announce tougher measures.
- GBP/USD is technically bullish in the near-term, needs to break above 1.3710 to extend rally.
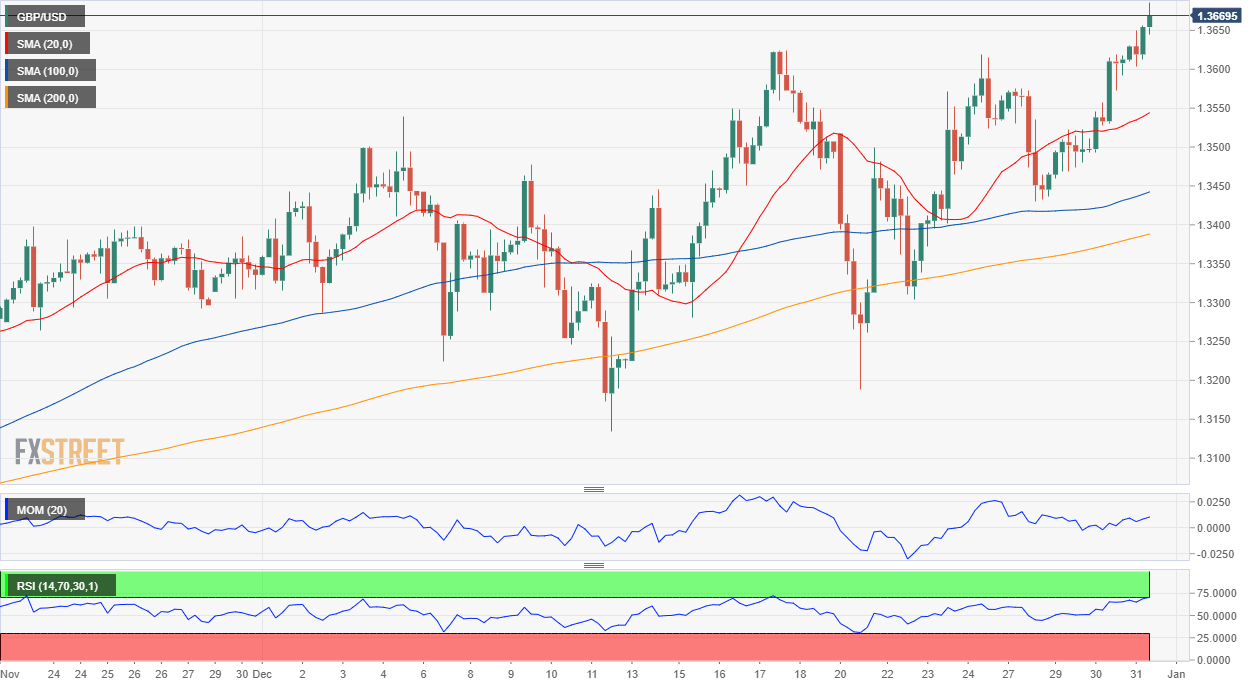
The British Pound is the strongest currency, with GBP/USD poised to close 2020 at its highest in over two years. The pair traded as high as 1.3685, now hovering in the 1.3670 price zone, as the UK parliament ratified the post-Brexit trade deal with the EU.
On Wednesday, the United Kingdom announced tougher restrictive measures amid record contagions in the country. The Midlands, North East, parts of the North West and parts of the South West are among those escalated to tier four. News that the government approved the emergency use of the AstraZeneca vaccine partially overshadowed the discouraging covid-related headlines.
GBP/USD short-term technical outlook
The GBP/USD pair is pressuring daily highs and nearing the 1.3700 figure, without signs of bullish exhaustion. The broad dollar’s weakness adds to the bullish case of the pair. In the near-term, and according to the 4-hour chart, the risk remains skewed to the upside, despite overbought readings. The pair has continued to advance above bullish moving averages while technical indicators continue to grind higher. Another leg north is to be expected on a break above 1.3710, the immediate resistance level.
Support levels: 13625 1.3570 1.3515
Resistance levels: 1.3710 1.3755 1.3800
Full Article
USD/CAD consolidates daily losses below 1.2750 ahead of last US data of 2020
100377 December 31, 2020 19:12 FXStreet Market News
- USD/CAD is trading in a tight range on Thursday.
- WTI posts small daily losses, holds above $48.
- US Dollar Index remains depressed ahead of US data.
The USD/CAD pair closed in the negative territory for the fourth straight day on Wednesday and edged slightly lower on Thursday to touch its weakest level since December 13 at 1.2729. As of writing, the pair was down 0.14% on a daily basis at 1.2740.
The USD’s market valuation remains the primary driver of USD/CAD’s movements ahead of the New Year holiday. With risk flows continuing to dominate the financial markets in the last week of 2020, the US Dollar Index slumped to its lowest level since April 2018 at 89.51 and struggles to stage a meaningful rebound. At the moment, the index is down 0.1% on the day at 89.60.
The only data featured in the US economic docket will be the US Department of Labor’s weekly Initial Jobless Claims, which is unlikely to trigger a significant market reaction. Meanwhile, the barrel of West Texas Intermediate is trading with small losses above $48, failing to provide a catalyst for the commodity-related loonie.
USD/CAD 2021 outlook
USD/CAD Price Forecast 2021: The complications of COVID-19 on the loonie and the hope for a recovery.
“The recent superiority of Canadian economic data, primarily re-employment and retail sales, may or may not continue but the clear return of a US statistical advantage needed to affect the USD/CAD cannot occur until the American economy is operating at a much higher level than it is now,” says FXStreet Senior Analyst Joseph Trevisani. “That is unlikely until at least the second quarter and more probably the third.”
Technical levels to watch for
Full Article
USD/JPY eyes the December low at 102.86
100376 December 31, 2020 18:45 FXStreet Market News
The USD/JPY pair trades around 103.05, down for the day as pressure on the greenback continues. The December low of 102.86 is in its sights, Valeria Bednarik, Chief Analyst at FXStreet, reports.
Key quotes
“The focus remains on coronavirus, amid news indicating resurgent contagions and deaths, but also the beginning of immunization. Japan reported 3,476 new cases and 43 deaths in the last 24 hours, whit over 1,000 reported in Tokyo. The numbers are records for the country, and the government is studying restrictive measures.”
“Trading will likely come to a halt after the release of US Initial Jobless Claims for the week ended December 25, foreseen at 833K.”
“The 4-hour chart shows that the price remains well below bearish moving averages, with the 20 SMA currently around 103.50. Technical indicators remain near daily lows, with limited directional strength.”
“It seems unlikely, but the USD/JPY pair could extend its slump once below December’s low at 102.86.”
Full Article
Top 3 Price Prediction Bitcoin, Ethereum, Ripple: BTC blasts above $29,000, XRP claws back some ground
100371 December 31, 2020 18:29 FXStreet Market News
- Bitcoin jumped above $29,000 for the first time in history.
- Ethereum tested water above the critical resistance of $750.
- Ripple’s XRP attempted a recovery despite gloomy fundamentals.
The cryptocurrency market celebrates the New Year with new highs. Bitcoins jumped above $29,000 and set a new all-time high at $29,321 during early Asian hours. Since that time, the pioneer digital asset has retreated to $28,800, though it is still 3.5% higher on a day-to-day basis. On a weekly basis, BTC gained over 23%. ETH attempted a move above $750 but failed to hold the ground while XRP is hovering around $0.224, having recovered from a massive sell-off to $0.17 on Tuesday, December 29. Other altcoins out of the top-50 are mostly bullish.
The total capitalization of all digital assets in circulation settled at $758 billion. An average daily trading volume is close to $177 billion. Bitcoin’s market dominance edged to71%.
Santa brings new gifts to BTC holders
Bitcoin jumped to a new all-time high above $29,000, only to retreat to $28,800 by press time. Despite the correction, the coin retains positive bias both on the short-term and long-term timeframes. The rally was triggered on Wednesday, December 30, when the US President Donald Trump endorsed the second stimulus bill worth $900 billion. As the FXStreet previously reported, many crypto twitter analysts believe the Americans will consider investing their stimulus checks in Bitcoin, the most profitable asset of 2020. A similar trend was noticed during the first helicopter money in April when the US-based cryptocurrency exchanges saw an inflow of first-time deposits worth $1,200.
From the technical point of view, BTC may be vulnerable to the short-term correction as the TD Sequential indicator has developed a sell signal in the form of a nine green candlestick on the 4-hour chart. If the pattern is confirmed, the correction may gain traction with the first stop at $27,800. This former resistance was verified as support on December 30. If it holds the ground, BTC bulls will make another attempt to send the price above $29,000 and, potentially, to the ultimate goal of $30,000.
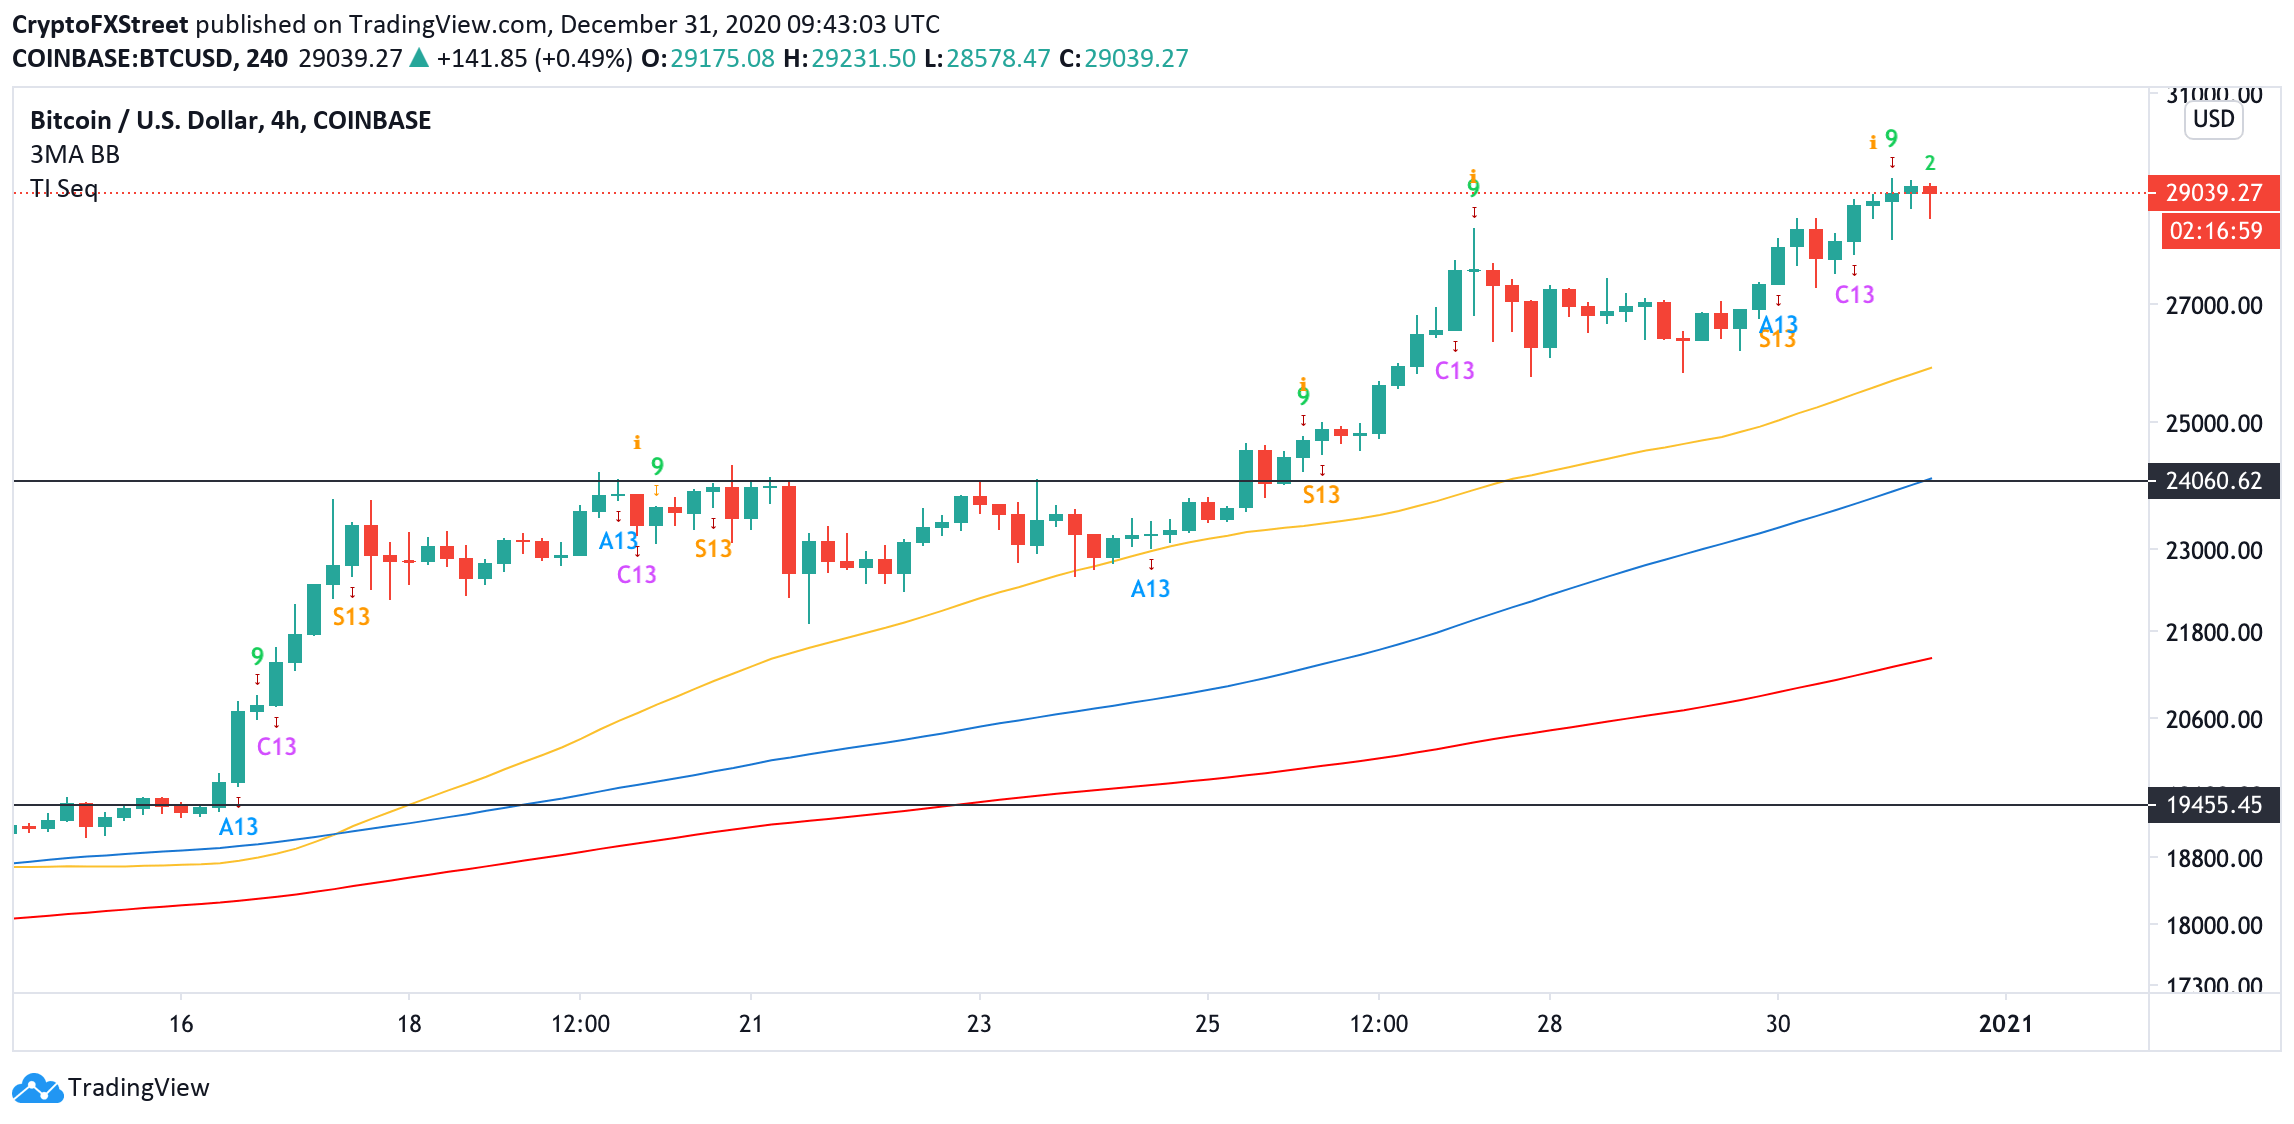
BTC, 4-hour chart
In/Out of the Money Around Price (IOMAP) data confirms that the price sits on top of a strong support area. Over 400,000 addresses purchased 325,000 BTC from $27,900 to $28,700. If it gives way, BTC may extend the decline towards bigger support at $26,800. This area has the potential to absorb the bearish pressure.

BTC, In/Out of the Money Around Price (IOMAP)
On the upside, once $29,000 is out of the way, BTC will re-test the all-time high of $29,321 and aim at the next psychological barrier of $30,000.
ETH takes another step closer to new records
ETH bulls attempted s break above a critical resistance area of $750 with 0.5 Fibo retracement level for the downside move from January 201 high to December 2018 low located on approach. ETH touched a new 2020 high at $759 and retreated to $759 as the upside momentum faded away.
On the intraday charts, ETH is supported by 1-hour EMA50, currently $735. This upside-looking line has been limiting ETH decline since December 24. Once it gives way, psychological $700 will come into focus. The short-term trend remains bullish as long as the price stays above this area. A sustainable move lower will trigger the sell-off towards $666 (1-hour EMA200).
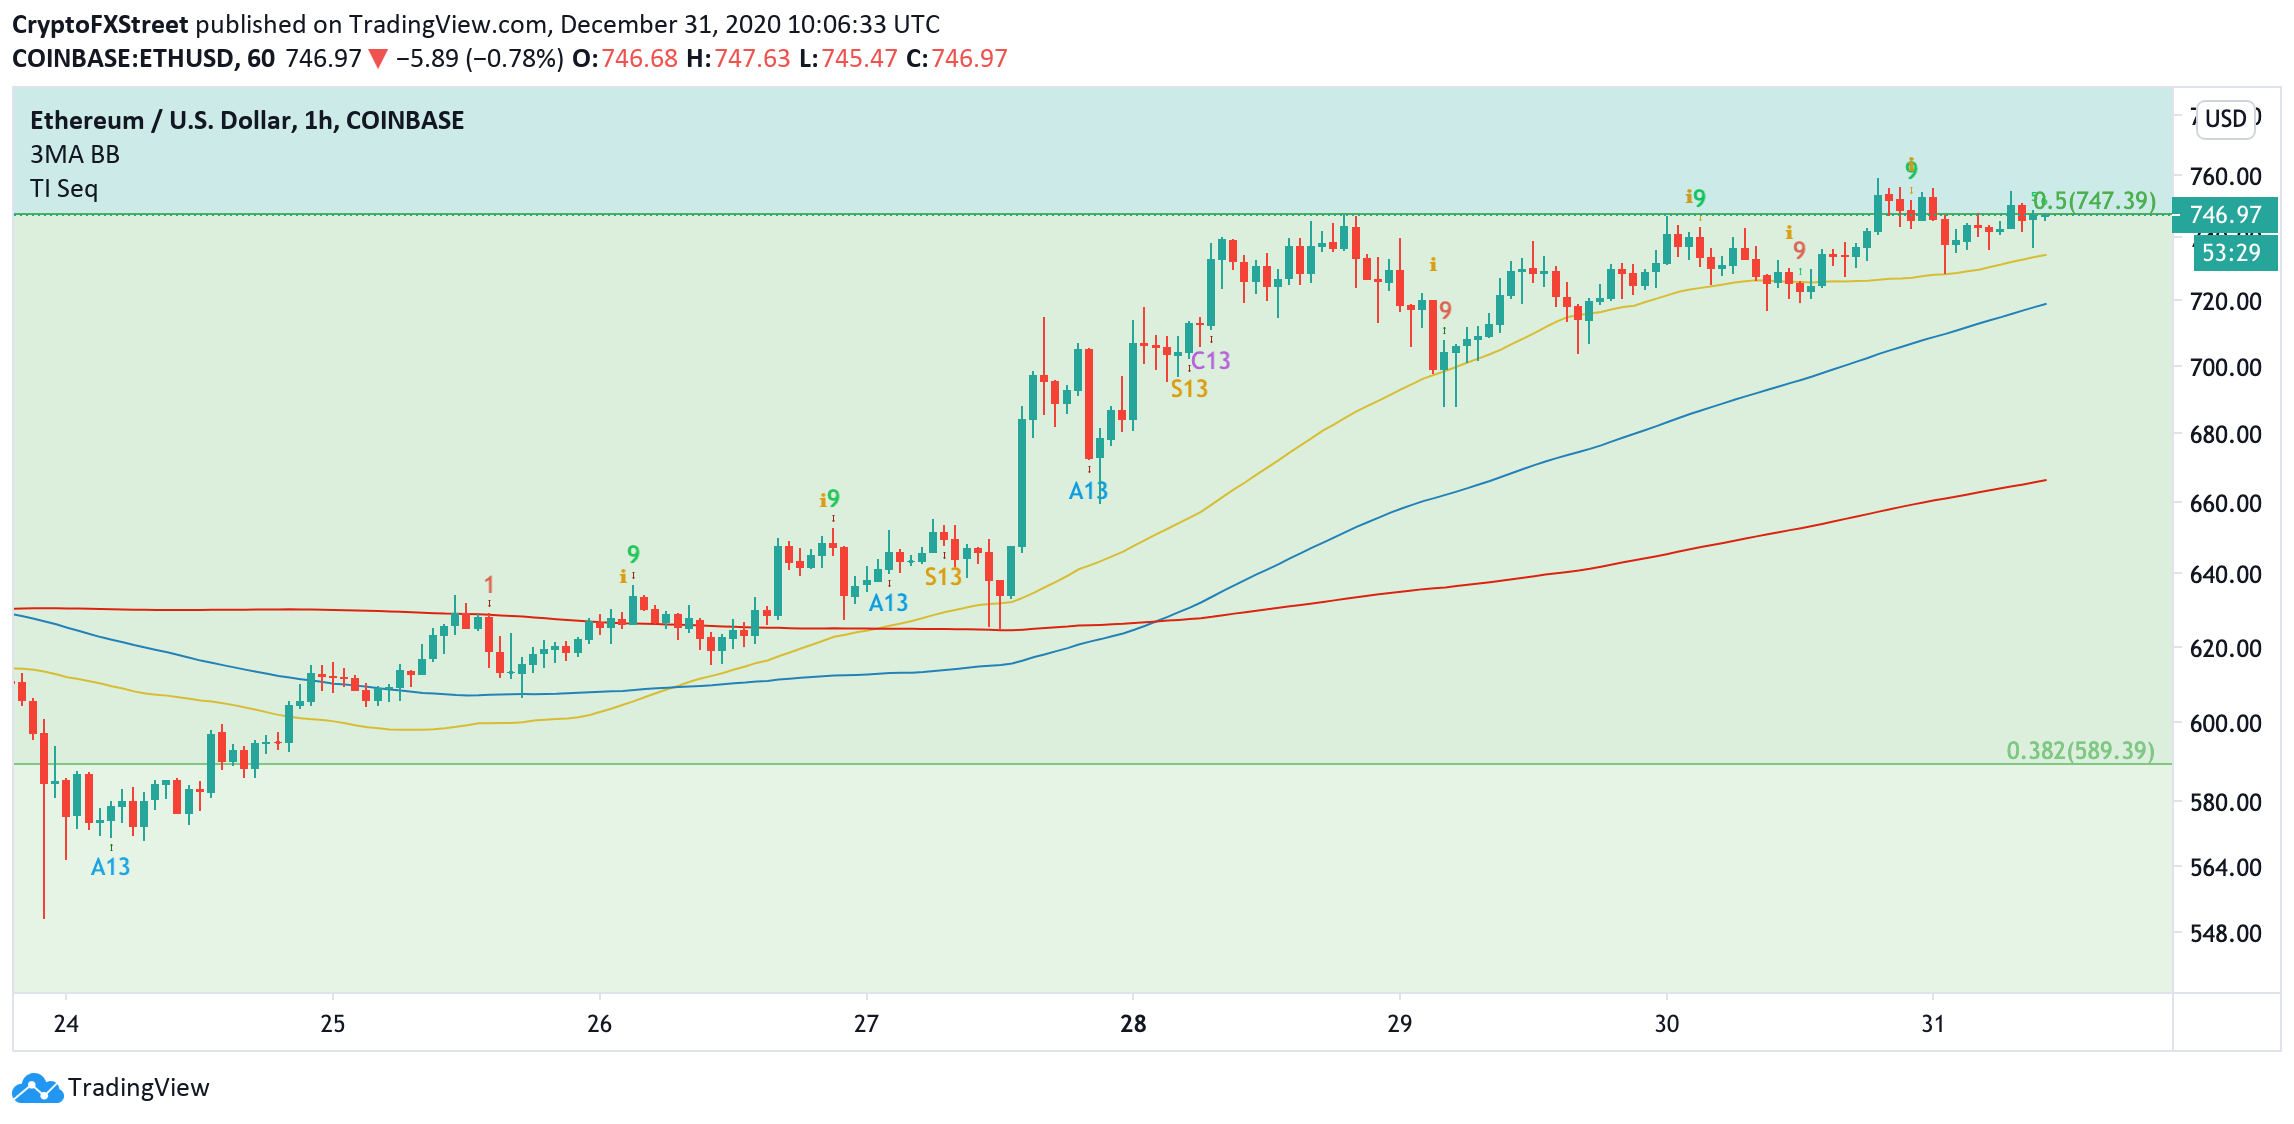
ETH, 1-hour chart
On the upside, ETH bulls still need to clear $750 before they can aim at $800.
Ripple re-gains some ground above $0.22
XRP recovered from the low of $0.17 hit on Tuesday, December 29. At the time of writing, the token is changing hands at $0.224, having gained over 6% on a day-to-day basis. Despite the recovery, it is still down 22% on a weekly basis.
Meanwhile, Binance.US announced the decision to delist XRP due to the litigation issues between Ripple and the US Securities and Exchange Commission (SEC). The token will become unavailable for trade and deposits starting from January. Currently, over 15 cryptocurrency companies, including Coinbase, suspended XRP trading. Also, FXStreet previously reported that the US-based Coinbase faced a class action lawsuit for offering XRP for trading and earning commissions on XRP transactions.
From the technical point of view, the price needs to recover above $0.22 to mitigate the immediate bearish pressure. This barrier served as the former channel support that limited XRP’s decline since the end of July. If it is verified as a resistance, XRP may resume the descent towards the psychological $0.2 and $0.175.
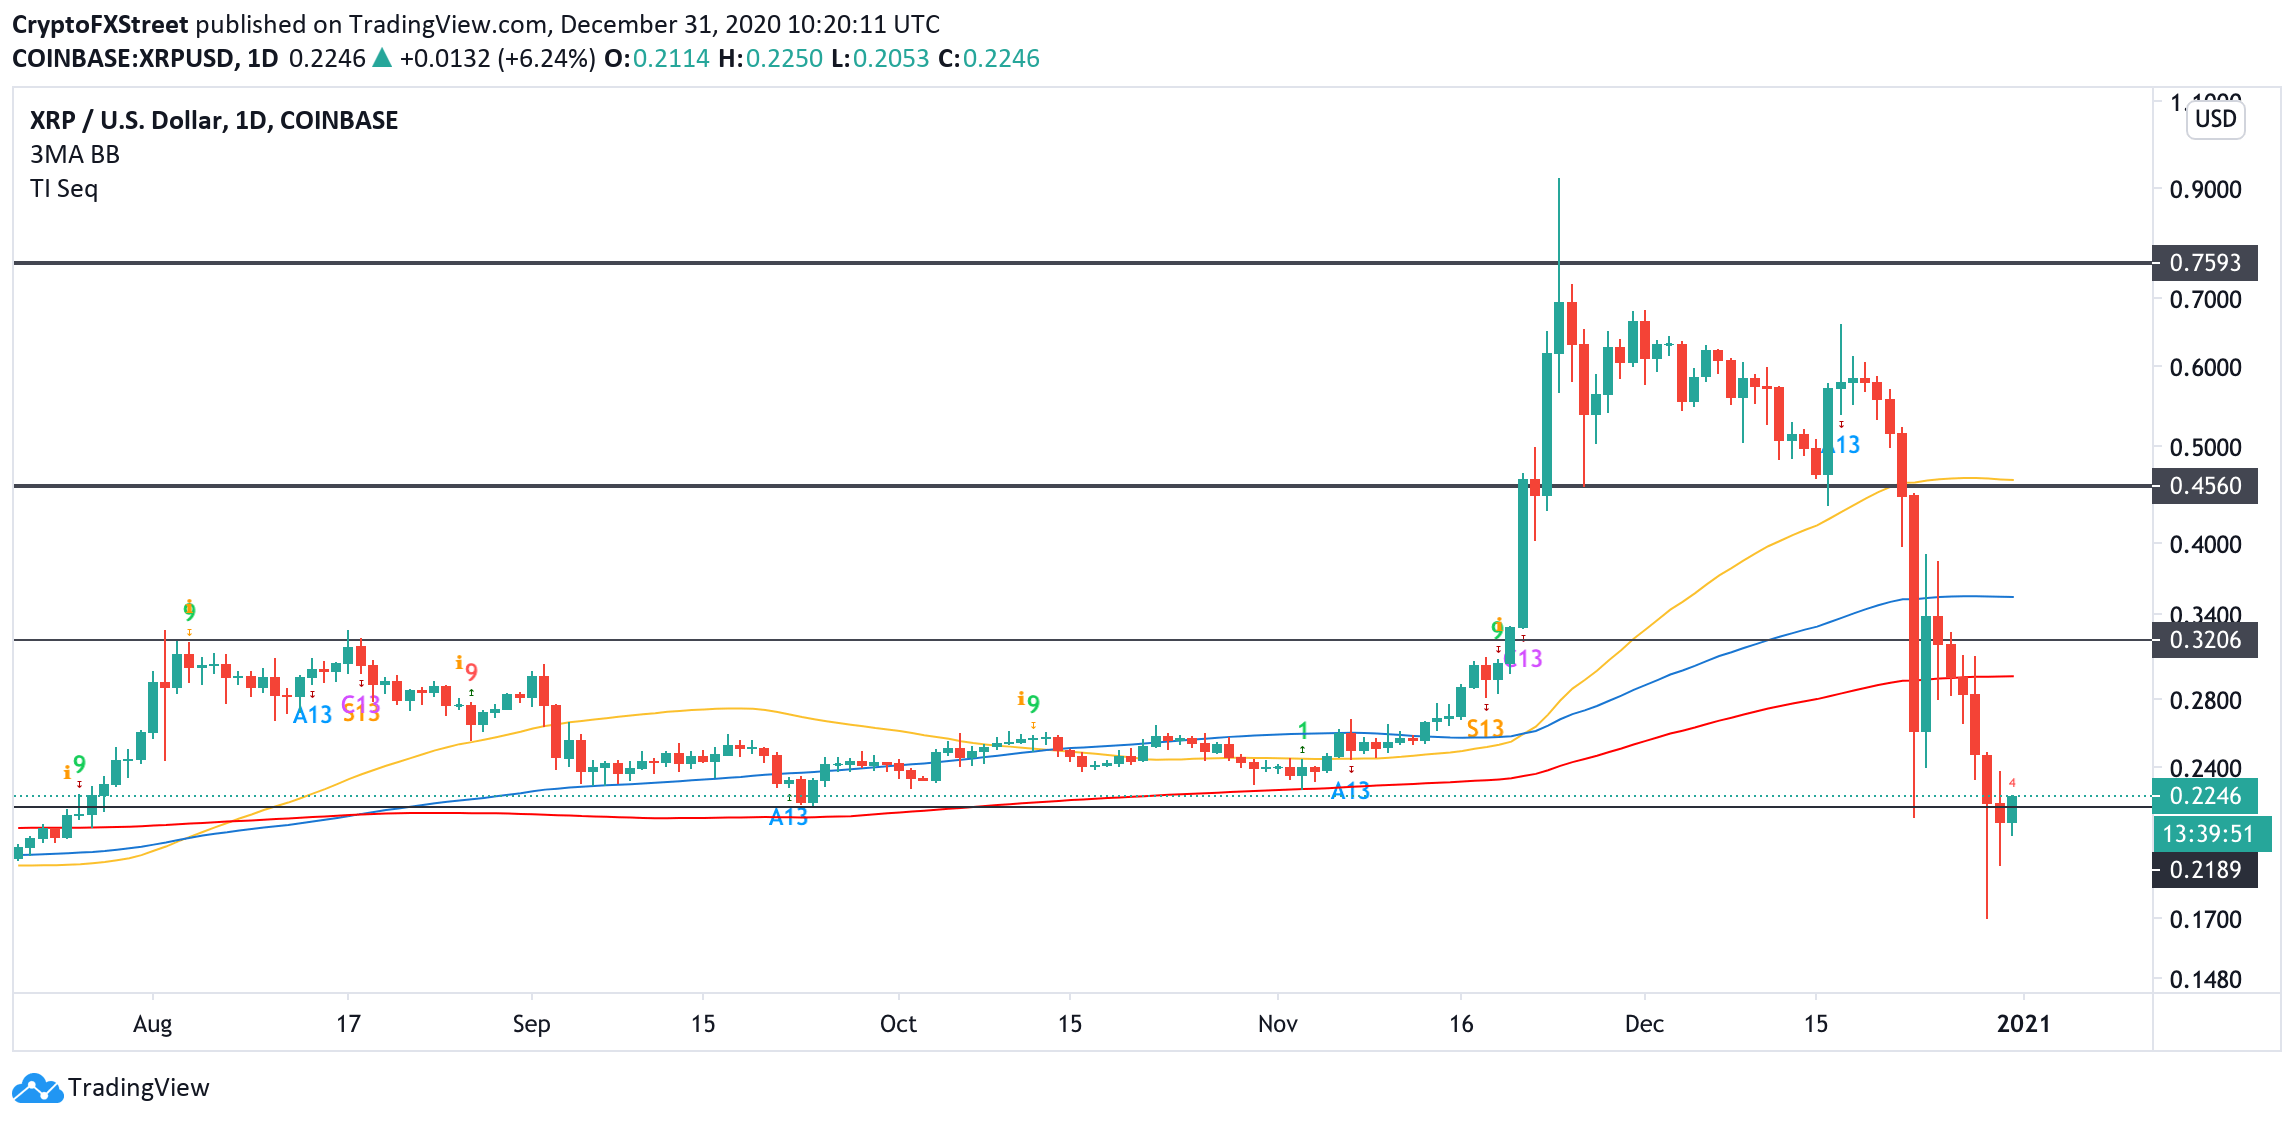
XRP, daily chart
On the upside, a sustainable move above weekly EMA50 at $0.25 will improve the technical picture and allow for a further recovery towards daily EMA200 at $0.295 and the channel resistance of $0.32.
Full Article
AUD/USD steadies around 0.7700, up nearly 10% in 2020
100370 December 31, 2020 18:29 FXStreet Market News
- AUD/USD rose to its highest level since April 2018.
- AUD/USD is up nearly 10% after starting 2020 near 0.7000.
- US Dollar Index stays flat near 89.60 ahead of US data.
The AUD/USD pair extended its rally and touched its best level since April 2018 at 0.7717 on Thursday. Ahead of the last American session of the year, however, the pair seems to have gone into a consolidation phase and was last seen gaining 0.3% on the day at 0.7705. In 2020, the pair is up nearly 10% after starting the year at 0.7016.
In the absence of significant fundamental drivers, the selling pressure surrounding the greenback provided a boost this week. The US Dollar Index, which tracks the USD’s performance against a basket of six major currencies, is currently sitting at fresh multi-year lows at 89.59, losing 0.7% on a weekly basis.
Later in the session, the US Department of Labor will release its weekly Initial Jobless Claims data. However, AUD/USD is likely to stay quiet in the second half of the day with trading conditions thinning out into the New Year Holiday.
AUD/USD 2021 outlook
AUD/USD Price Forecast 2021: Winning the covid crisis insufficient for the aussie to withstand Chinese boomerang.
“Emerging from the worst of the crisis is the aussie’s speciality but maintaining the bullish trend is entirely different,” says FXStreet analyst Yohay Elam. “The post-covid year could start with a surge but end with a downtrend for AUD/USD as the world catches up, geopolitical dynamics shift and central bank actions fail to provide the same oomph as beforehand.”
Technical levels to watch for
Full Article
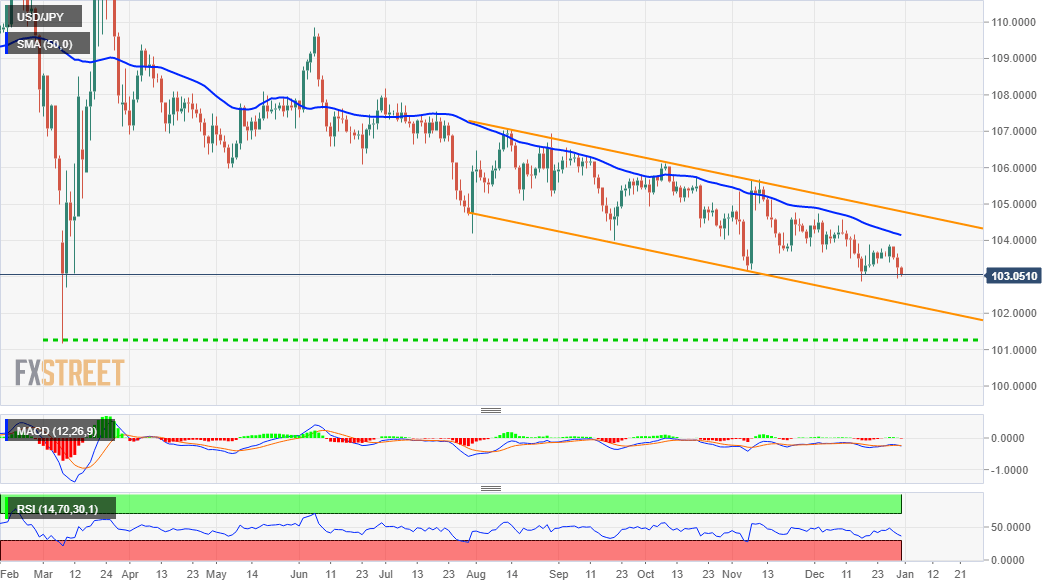
USD/JPY Price Analysis: Remains vulnerable near two-week lows, around 103.00 mark
100368 December 31, 2020 18:12 FXStreet Market News
- USD/JPY was seen consolidating its losses near two-week lows, around 103.00 mark.
- The formation of a descending channel points to a well-established bearish trajectory.
- The pair seems vulnerable to challenge the channel support, near the 102.60-55 area.
The USD/JPY pair now seems to have entered a bearish consolidation phase and was seen oscillating in a range around 103.00 mark, just above two-week lows set on Wednesday.
Looking at the technical picture, the pair has been trending lower over the past four months or so along a downward sloping channel. This, in turn, points to a well-established downtrend and supports prospects for further weakness.
The negative outlook is reinforced by the fact that technical indicators on the daily chart have been struggling to recover from the bearish trajectory. However, year-end thin trading volumes held bearish traders from placing fresh bets.
Nevertheless, the USD/JPY pair remains vulnerable to slide further below December monthly swing lows and aim to challenge the lower boundary of the trend channel. The mentioned support is currently pegged near the 102.60-55 region.
Some follow-through selling will mark a fresh bearish breakdown and set the stage for an extension of the depreciating move. The USD/JPY pair might then accelerate the slide to the 102.00 mark before eventually dropping to test 2020 lows, around the 101.20-15 region.
On the flip side, the 103.40-50 area now becomes immediate strong resistance ahead of weekly highs, just ahead of the 104.00 level. A sustained move beyond might trigger a short-covering bounce and push the USD/JPY pair to the 104.70-75 supply zone.
This is followed by the key 105.00 psychological mark, which coincides with the trend-channel resistance and act as a strong barrier for the USD/JPY pair.
USD/JPY daily chart