Articles

Ethereum price is breaking out toward $4,000
165194 August 31, 2021 21:45 FXStreet Market News
Information on these pages contains forward-looking statements that involve risks and uncertainties. Markets and instruments profiled on this page are for informational purposes only and should not in any way come across as a recommendation to buy or sell in these assets. You should do your own thorough research before making any investment decisions. FXStreet does not in any way guarantee that this information is free from mistakes, errors, or material misstatements. It also does not guarantee that this information is of a timely nature. Investing in Open Markets involves a great deal of risk, including the loss of all or a portion of your investment, as well as emotional distress. All risks, losses and costs associated with investing, including total loss of principal, are your responsibility. The views and opinions expressed in this article are those of the authors and do not necessarily reflect the official policy or position of FXStreet nor its advertisers. The author will not be held responsible for information that is found at the end of links posted on this page.
If not otherwise explicitly mentioned in the body of the article, at the time of writing, the author has no position in any stock mentioned in this article and no business relationship with any company mentioned. The author has not received compensation for writing this article, other than from FXStreet.
FXStreet and the author do not provide personalized recommendations. The author makes no representations as to the accuracy, completeness, or suitability of this information. FXStreet and the author will not be liable for any errors, omissions or any losses, injuries or damages arising from this information and its display or use. Errors and omissions excepted.
The author and FXStreet are not registered investment advisors and nothing in this article is intended to be investment advice.
Full Article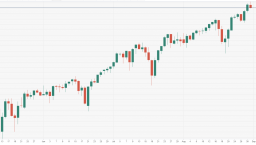
S&P 500 Index opens modestly lower, holds above 4,500
165192 August 31, 2021 21:45 FXStreet Market News
- Wall Street’s main indexes are posting modest losses on Tuesday.
- Technology shares are pushing lower after the opening bell.
- Energy stocks trade in the positive territory as oil consolidates latest gains.
Major equity indexes in the US opened modestly lower on Tuesday as investors seem to be looking to book their profits on the last trading day of August. As of writing, the S&P 500 was down 0.15% on the day at 4,521, the Dow Jones Industrial Average was losing 0.15% at 35,354 and the Nasdaq Composite was falling 0.2% at 15,234.
Among the 11 major S&P 500 sectors, the Technology Index is losing 0.45% as the biggest decline. On the other hand, the Energy Index is up 0.3% despite the fact that the barrel of West Texas Intermediate (WTI) is trading in the negative territory.
Later in the session, the Conference Board’s Consumer Confidence Index for August and the ISM Chicago’s Purchasing Managers’ Index will be looked upon for fresh impetus.
S&P 500 chart (daily)

United States Redbook Index (YoY) up to 18.6% in August 27 from previous 16.6%
165191 August 31, 2021 21:35 FXStreet Market News
Information on these pages contains forward-looking statements that involve risks and uncertainties. Markets and instruments profiled on this page are for informational purposes only and should not in any way come across as a recommendation to buy or sell in these assets. You should do your own thorough research before making any investment decisions. FXStreet does not in any way guarantee that this information is free from mistakes, errors, or material misstatements. It also does not guarantee that this information is of a timely nature. Investing in Open Markets involves a great deal of risk, including the loss of all or a portion of your investment, as well as emotional distress. All risks, losses and costs associated with investing, including total loss of principal, are your responsibility. The views and opinions expressed in this article are those of the authors and do not necessarily reflect the official policy or position of FXStreet nor its advertisers. The author will not be held responsible for information that is found at the end of links posted on this page.
If not otherwise explicitly mentioned in the body of the article, at the time of writing, the author has no position in any stock mentioned in this article and no business relationship with any company mentioned. The author has not received compensation for writing this article, other than from FXStreet.
FXStreet and the author do not provide personalized recommendations. The author makes no representations as to the accuracy, completeness, or suitability of this information. FXStreet and the author will not be liable for any errors, omissions or any losses, injuries or damages arising from this information and its display or use. Errors and omissions excepted.
The author and FXStreet are not registered investment advisors and nothing in this article is intended to be investment advice.
United States S&P/Case-Shiller Home Price Indices (YoY) came in at 19.1%, above expectations (18%) in June
165190 August 31, 2021 21:33 FXStreet Market News
Information on these pages contains forward-looking statements that involve risks and uncertainties. Markets and instruments profiled on this page are for informational purposes only and should not in any way come across as a recommendation to buy or sell in these assets. You should do your own thorough research before making any investment decisions. FXStreet does not in any way guarantee that this information is free from mistakes, errors, or material misstatements. It also does not guarantee that this information is of a timely nature. Investing in Open Markets involves a great deal of risk, including the loss of all or a portion of your investment, as well as emotional distress. All risks, losses and costs associated with investing, including total loss of principal, are your responsibility. The views and opinions expressed in this article are those of the authors and do not necessarily reflect the official policy or position of FXStreet nor its advertisers. The author will not be held responsible for information that is found at the end of links posted on this page.
If not otherwise explicitly mentioned in the body of the article, at the time of writing, the author has no position in any stock mentioned in this article and no business relationship with any company mentioned. The author has not received compensation for writing this article, other than from FXStreet.
FXStreet and the author do not provide personalized recommendations. The author makes no representations as to the accuracy, completeness, or suitability of this information. FXStreet and the author will not be liable for any errors, omissions or any losses, injuries or damages arising from this information and its display or use. Errors and omissions excepted.
The author and FXStreet are not registered investment advisors and nothing in this article is intended to be investment advice.
EUR/JPY recedes from fresh tops above 130.00
165189 August 31, 2021 21:33 FXStreet Market News
- EUR/JPY moves past the 130.00 hurdle on Tuesday.
- The broad-based risk-on mood lends support to the cross.
- EMU headline CPI reached 10-year highs at 3.0%.
The better tone in the risk complex sustains the upside momentum in EUR/JPY to levels past the psychological 130.00 mark on Tuesday.
EUR/JPY shifts the attention to US data
EUR/JPY extends the rebound from monthly lows just below 128.00 the figure (August 19) and manages to finally surpass the key barrier at the 130.00 yardstick in the first half of the week.
In fact, sellers keep the dollar under increasing pressure as investors continue to adjust to Powell’s speech last Friday, while month-end flows and profit taking also collaborate with the offered stance in the buck.
The cross moves higher and risk appetite stays buoyant despite disappointing results from the Chinese economy during early trade. Indeed, the Manufacturing PMI eased to 50.1 in August and the Services gauge slipped back into the contraction territory (<50) at 47.5.
Earlier in the euro docket, preliminary inflation figures in the broader euro area rose to a decade high at 3.0% for the current month, while the German jobless rate ticked lower to 5.5% in the same period.
Across the Atlantic, the FHFA’s House Price Index rose 1.7% MoM in June and house prices tracked by. The S&P/Case-Shiler index rose 18.5% on a year to June. Later, the Chicago PMI is also due followed by the always-relevant Consumer Confidence print measured by the Conference Board.
EUR/JPY relevant levels
So far, the cross is gaining 0.16% at 129.85 and a surpass of 13017 (weekly high Aug.31) would expose 130.56 (weekly high Jul.29) and then 131.08 (100-day SMA). On the downside, the next support comes in at 129.35 (200-day SMA) seconded by 127.93 (monthly low Aug.19) and finally 127.00 (round level).
Full Article
United States Housing Price Index (MoM) came in at 1.6%, below expectations (2.1%) in June
165188 August 31, 2021 21:29 FXStreet Market News
Information on these pages contains forward-looking statements that involve risks and uncertainties. Markets and instruments profiled on this page are for informational purposes only and should not in any way come across as a recommendation to buy or sell in these assets. You should do your own thorough research before making any investment decisions. FXStreet does not in any way guarantee that this information is free from mistakes, errors, or material misstatements. It also does not guarantee that this information is of a timely nature. Investing in Open Markets involves a great deal of risk, including the loss of all or a portion of your investment, as well as emotional distress. All risks, losses and costs associated with investing, including total loss of principal, are your responsibility. The views and opinions expressed in this article are those of the authors and do not necessarily reflect the official policy or position of FXStreet nor its advertisers. The author will not be held responsible for information that is found at the end of links posted on this page.
If not otherwise explicitly mentioned in the body of the article, at the time of writing, the author has no position in any stock mentioned in this article and no business relationship with any company mentioned. The author has not received compensation for writing this article, other than from FXStreet.
FXStreet and the author do not provide personalized recommendations. The author makes no representations as to the accuracy, completeness, or suitability of this information. FXStreet and the author will not be liable for any errors, omissions or any losses, injuries or damages arising from this information and its display or use. Errors and omissions excepted.
The author and FXStreet are not registered investment advisors and nothing in this article is intended to be investment advice.
EUR/USD Forecast: More gain the docket amid broad dollar’s weakness
165186 August 31, 2021 21:29 FXStreet Market News
EUR/USD Current Price: 1.1834
- EU inflation jumped to 1.6% YoY in August, according to preliminary estimates.
- Investors await US CB Consumer Confidence, expected to have contracted to 122.9.
- EUR/USD trades at its highest in almost a month and is set to keep advancing.

The EUR/USD pair extended its advance to 1.1844, its highest in four weeks, trading nearby ahead of the US opening, as speculative interest keeps selling the greenback, despite a souring market’s mood. The shared currency found support in upbeat local data, as the German Unemployment rate contracted to 5.5% in August, while the EU Consumer Price Index was confirmed at 1.6% YoY in August, and according to preliminary estimates.
The pair holds on to gains around 1.1830, despite European indexes trade in the red, dragging lower US futures. The US will publish August CB Consumer Confidence, foreseen at 122.9 from 129.1 previously, and the Chicago Purchasing Managers’ Index for the same month, expected at 68 from 73.4 in the previous month.
EUR/USD short-term technical outlook
The EUR/USD pair trades above the 61.8% retracement of its latest decline, the immediate support level at 1.1820. The near term picture favors additional gains, as, in the 4-hour chart, the pair develops above all of its moving averages, with the 20 SMA heading firmly higher and crossing above the longer ones. Technical indicators reached overbought levels, partially losing their bullish strength but without indicating a change in the current bias.
Support levels: 1.1820 1.1880 1.1745
Resistance levels: 1.1850 1.1890 1.1825
View Live Chart for the EUR/USD
Full Article
Oil declines $1 as worth month since October winds down
165184 August 31, 2021 21:26 Forexlive Latest News Market News
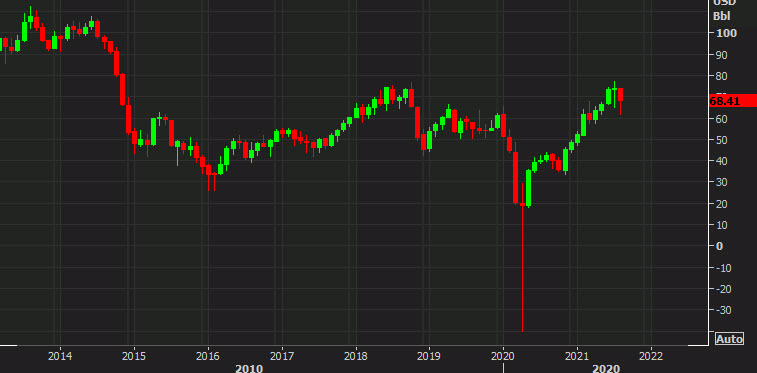
WTI down $1 to $68.16
The combination of some dollar strength, a bit more caution on risk and tomorrow’s OPEC+ meeting is weighing on oil today.
WTI is down $1 to $68.16 but I want to highlight the monthly chart. This looked like it would be the worst month since the start of the pandemic but is now only the worst month since October (and only the second negative month since then).
Importantly, oil looks to be holding above the old 2019 highs and hasn’t confirmed a possible reversal signal over three months. The main hurdle remains the October 2018 high of $76.90, which was broken by a few cents last month but will need to be truly busted before the bulls can seriously start talking about $100.
Overall though, this is a constructive looking chart and a reminder of the insane price action in April 2020.
Meanwhile, OPEC’s joint monitoring committee’s documents are leaking at the moment and see an oil supply deficit of 1.0 mbpd in September, which will fall to 400k bpd by year end. For next year though, they see the oil market in a 2.5 mbpd surplus. Demand growth for this year is unchanged at 6 mbpd.
On OECD stockpiles, they see them rising above the 5-year average from Feb to Dec 2022. This document raises questions about the need to continue hiking production beyond December or January. A 2.5 mbpd could quickly cut down oil prices.
Full Article

MATIC Price Prediction: Polygon hangs by a thread
165182 August 31, 2021 21:26 FXStreet Market News
- Polygon has been on a downward slope for two weeks.
- Buyers are trying to support price action, but sellers are in control.
- A break of two technical barriers opens up more downside.
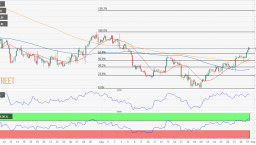
Polygon (MATIC) is on the verge of breaking lower as buyers try to support price action at $1.32. Buyers have two good reasons to get in here. The volume, however, shows buyers are not convinced that this is the right time.
The break of the orange ascending trend line raises red flags for MATIC and probably makes buyers hesitant to step in. Proof of this is to be found in the descending volume since August 11. Buyers seized control of the price action and ran up prices toward $1.70. Since then, volume is running thin, and sellers could squeeze buyers out of their profit back to their point of entry.
It is questionable if MATIC still has room to the upside with such low volume
A bounce off the monthly R1 resistance level at $1.30 is what supports Polygon price for the moment. A new break below would open up space to dip 10% with no fundamental supporting factors on the way down. From a buy-side perspective, the risk-reward is not attractive at all. The logical place to place a stop as a buyer is at $1.20, making a stop of 10% risky.

MATIC/USD daily chart
On the upside, the reward in that same trade is not tempting either. With the red descending trend line, the profit is limited to the upside. This explains why volume is so thin, as not many buyers will risk taking this trade-in.
Sellers will want to push MATIC below $1.30 and have their profit targets lined up for $1.20-$1.17. This level makes more sense for buyers as well to step in. Sellers will want to buy here to lock in their profits, and not only is there the historical level around $1.20. That level acted on August 7 as resistance and turned into support on August 12. Just below there is the 55-day Simple Moving Average (SMA) that will serve as second support and a good place for buyers to place their stops just below. The risk-reward ratio is also more attractive, with a possible retest of $1.30 or 8% gains against 3% risk.
Full Article
Chile Industrial Production (YoY) dipped from previous 6% to 4.8% in July
165181 August 31, 2021 21:26 FXStreet Market News
Information on these pages contains forward-looking statements that involve risks and uncertainties. Markets and instruments profiled on this page are for informational purposes only and should not in any way come across as a recommendation to buy or sell in these assets. You should do your own thorough research before making any investment decisions. FXStreet does not in any way guarantee that this information is free from mistakes, errors, or material misstatements. It also does not guarantee that this information is of a timely nature. Investing in Open Markets involves a great deal of risk, including the loss of all or a portion of your investment, as well as emotional distress. All risks, losses and costs associated with investing, including total loss of principal, are your responsibility. The views and opinions expressed in this article are those of the authors and do not necessarily reflect the official policy or position of FXStreet nor its advertisers. The author will not be held responsible for information that is found at the end of links posted on this page.
If not otherwise explicitly mentioned in the body of the article, at the time of writing, the author has no position in any stock mentioned in this article and no business relationship with any company mentioned. The author has not received compensation for writing this article, other than from FXStreet.
FXStreet and the author do not provide personalized recommendations. The author makes no representations as to the accuracy, completeness, or suitability of this information. FXStreet and the author will not be liable for any errors, omissions or any losses, injuries or damages arising from this information and its display or use. Errors and omissions excepted.
The author and FXStreet are not registered investment advisors and nothing in this article is intended to be investment advice.
US: Housing Price Index rises by 1.6% in June vs. 2.1% expected
165180 August 31, 2021 21:21 FXStreet Market News
- US FHFA Housing Price Index rose 1.6% in June.
- US Dollar Index stays in the negative territory around 92.50.
The Housing Price Index released by the US Federal Housing Finance Agency (FHFA) arrived at +1.6% in June following May’s increase of 1.8%. This reading fell short of the market expectation of 2.1%.
Meanwhile, theS&P/Case-Shiller Home Price Indices rose to +19.2% on a yearly basis in June from 18% in May, surpassing analysts’ estimate of 18%.
Market reaction
This report doesn’t seem to be having a significant impact on the greenback’s performance against its rivals. As of writing, the US Dollar Index was down 0.23% on a daily basis at 92.48.
Full Article
Chile Unemployment rate down to 8.9% in July from previous 9.5%
165179 August 31, 2021 21:21 FXStreet Market News
Information on these pages contains forward-looking statements that involve risks and uncertainties. Markets and instruments profiled on this page are for informational purposes only and should not in any way come across as a recommendation to buy or sell in these assets. You should do your own thorough research before making any investment decisions. FXStreet does not in any way guarantee that this information is free from mistakes, errors, or material misstatements. It also does not guarantee that this information is of a timely nature. Investing in Open Markets involves a great deal of risk, including the loss of all or a portion of your investment, as well as emotional distress. All risks, losses and costs associated with investing, including total loss of principal, are your responsibility. The views and opinions expressed in this article are those of the authors and do not necessarily reflect the official policy or position of FXStreet nor its advertisers. The author will not be held responsible for information that is found at the end of links posted on this page.
If not otherwise explicitly mentioned in the body of the article, at the time of writing, the author has no position in any stock mentioned in this article and no business relationship with any company mentioned. The author has not received compensation for writing this article, other than from FXStreet.
FXStreet and the author do not provide personalized recommendations. The author makes no representations as to the accuracy, completeness, or suitability of this information. FXStreet and the author will not be liable for any errors, omissions or any losses, injuries or damages arising from this information and its display or use. Errors and omissions excepted.
The author and FXStreet are not registered investment advisors and nothing in this article is intended to be investment advice.