Articles

EUR/JPY Price Analysis: The 129.50 area emerges as initial support
172686 September 30, 2021 21:05 FXStreet Market News
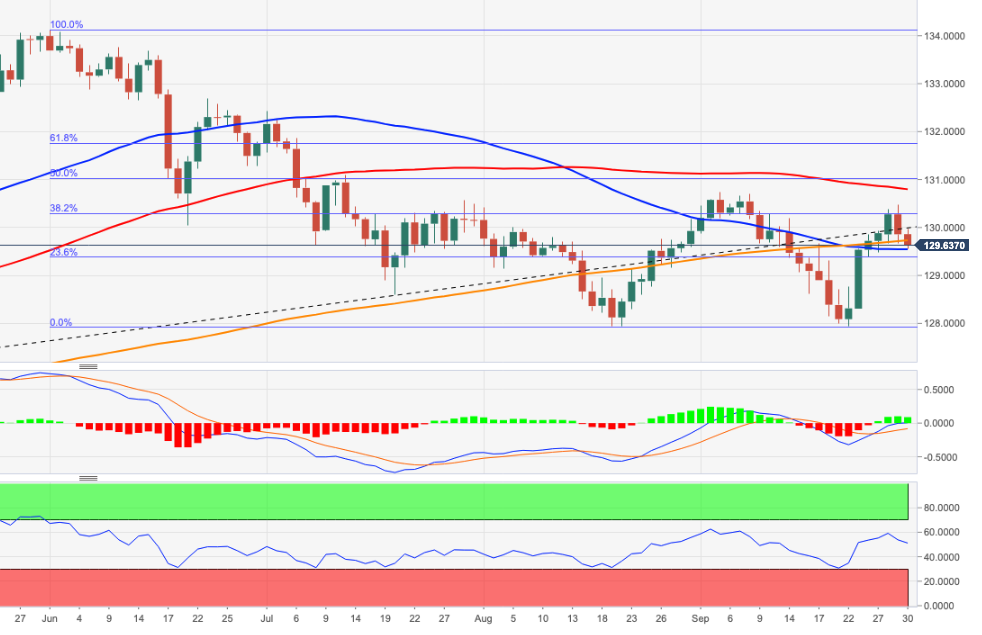
- EUR/JPY adds to Wednesday’s losses and revisits the 129.50 area.
- The mid-130.00s still cap the upside for the time being.
EUR/JPY recedes to the mid-129.00s, or multi-day lows, following Wednesday’s rejection from the 130.50 area.
The break below 129.50, where the 20- and 55-day SMAs coincide, should allow for a move further south to the Fibo level at 129.39 ahead of the minor support at the 10-day SMA at 129.22.
While the cross flirts with the key 200-day SMA (129.69) , a sustainable move below this level should shift the outlook to negative in the short-term horizon.
EUR/JPY daily chart
Germany Harmonized Index of Consumer Prices (MoM) came in at 0.3%, above expectations (0.2%) in September
172685 September 30, 2021 21:02 FXStreet Market News
Information on these pages contains forward-looking statements that involve risks and uncertainties. Markets and instruments profiled on this page are for informational purposes only and should not in any way come across as a recommendation to buy or sell in these assets. You should do your own thorough research before making any investment decisions. FXStreet does not in any way guarantee that this information is free from mistakes, errors, or material misstatements. It also does not guarantee that this information is of a timely nature. Investing in Open Markets involves a great deal of risk, including the loss of all or a portion of your investment, as well as emotional distress. All risks, losses and costs associated with investing, including total loss of principal, are your responsibility. The views and opinions expressed in this article are those of the authors and do not necessarily reflect the official policy or position of FXStreet nor its advertisers. The author will not be held responsible for information that is found at the end of links posted on this page.
If not otherwise explicitly mentioned in the body of the article, at the time of writing, the author has no position in any stock mentioned in this article and no business relationship with any company mentioned. The author has not received compensation for writing this article, other than from FXStreet.
FXStreet and the author do not provide personalized recommendations. The author makes no representations as to the accuracy, completeness, or suitability of this information. FXStreet and the author will not be liable for any errors, omissions or any losses, injuries or damages arising from this information and its display or use. Errors and omissions excepted.
The author and FXStreet are not registered investment advisors and nothing in this article is intended to be investment advice.
Germany Consumer Price Index (MoM) below expectations (0.1%) in September: Actual (0%)
172684 September 30, 2021 21:02 FXStreet Market News
Information on these pages contains forward-looking statements that involve risks and uncertainties. Markets and instruments profiled on this page are for informational purposes only and should not in any way come across as a recommendation to buy or sell in these assets. You should do your own thorough research before making any investment decisions. FXStreet does not in any way guarantee that this information is free from mistakes, errors, or material misstatements. It also does not guarantee that this information is of a timely nature. Investing in Open Markets involves a great deal of risk, including the loss of all or a portion of your investment, as well as emotional distress. All risks, losses and costs associated with investing, including total loss of principal, are your responsibility. The views and opinions expressed in this article are those of the authors and do not necessarily reflect the official policy or position of FXStreet nor its advertisers. The author will not be held responsible for information that is found at the end of links posted on this page.
If not otherwise explicitly mentioned in the body of the article, at the time of writing, the author has no position in any stock mentioned in this article and no business relationship with any company mentioned. The author has not received compensation for writing this article, other than from FXStreet.
FXStreet and the author do not provide personalized recommendations. The author makes no representations as to the accuracy, completeness, or suitability of this information. FXStreet and the author will not be liable for any errors, omissions or any losses, injuries or damages arising from this information and its display or use. Errors and omissions excepted.
The author and FXStreet are not registered investment advisors and nothing in this article is intended to be investment advice.
EUR/USD Price Analysis: Near-term rebound in the offing?
172683 September 30, 2021 20:56 FXStreet Market News
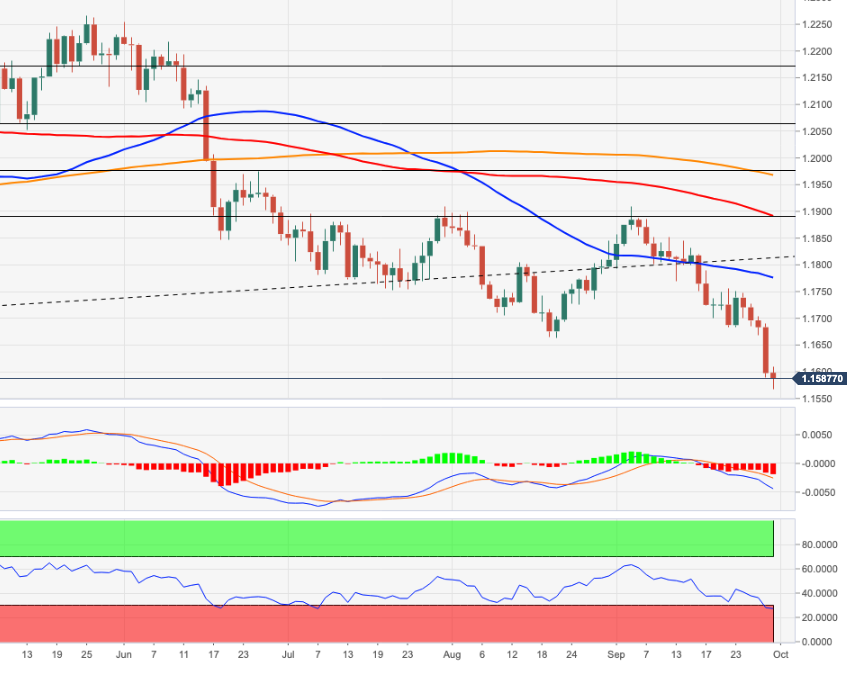
- EUR/USD drops further and records new YTD low at 1.1568.
- The 1.1500 neighbourhood should hold the downside.
EUR/USD’s downside picks up further pace and breaks below the 1.1600 support to clinch fresh 2021 lows around 1.1570.
A technical rebound could be in the pipeline in the very near term considering the current oversold condition of the spot on a daily basis. The broader outlook, however, points south and a close below the 200-week SMA at 1.1572 should allow for further downside to the 1.1500 neighbourhood, where the March 2020 high sits.
In the meantime, the near-term outlook for EUR/USD is seen on the negative side while below the key 200-day SMA, today at 1.1966.
EUR/USD daily chart
Chile Unemployment rate below expectations (8.6%) in August: Actual (8.5%)
172682 September 30, 2021 20:56 FXStreet Market News
Information on these pages contains forward-looking statements that involve risks and uncertainties. Markets and instruments profiled on this page are for informational purposes only and should not in any way come across as a recommendation to buy or sell in these assets. You should do your own thorough research before making any investment decisions. FXStreet does not in any way guarantee that this information is free from mistakes, errors, or material misstatements. It also does not guarantee that this information is of a timely nature. Investing in Open Markets involves a great deal of risk, including the loss of all or a portion of your investment, as well as emotional distress. All risks, losses and costs associated with investing, including total loss of principal, are your responsibility. The views and opinions expressed in this article are those of the authors and do not necessarily reflect the official policy or position of FXStreet nor its advertisers. The author will not be held responsible for information that is found at the end of links posted on this page.
If not otherwise explicitly mentioned in the body of the article, at the time of writing, the author has no position in any stock mentioned in this article and no business relationship with any company mentioned. The author has not received compensation for writing this article, other than from FXStreet.
FXStreet and the author do not provide personalized recommendations. The author makes no representations as to the accuracy, completeness, or suitability of this information. FXStreet and the author will not be liable for any errors, omissions or any losses, injuries or damages arising from this information and its display or use. Errors and omissions excepted.
The author and FXStreet are not registered investment advisors and nothing in this article is intended to be investment advice.
Bitcoin price remains in downtrend toward $38,000 by end of next week
172680 September 30, 2021 20:51 FXStreet Market News
- Bitcoin price is stuck in a bearish triangle and downtrend.
- Bulls tempting to break out were met with heavy selling action the following day.
- A retest to $40,750 with a break below opens the door toward another 6% devaluation.
Bitcoin (BTC) price action is currently controlled by bears who are trapping bulls in their attempt to overcome the downtrend Bitcoin has been in since the beginning of September. A retest of the base of the bearish triangle looks to be happening anytime soon, around $40,750. A break lower would make bears push for the next supportive level at $38,073.
Bitcoin price action is trapping bulls time and time again
Bitcoin price is very much in the hands of the bears for most of September. In the recent development of price action, bulls have had no chance to break out of the trend. Instead, their attempts are met with ample firepower from bears trapping the bulls and then saddling them up with huge losses on their long positions.
That was the case on September 18 and 23 in BTC price action. Bulls attempted on both dates to make a run for a breakout. Hitting a curb each time made sellers come in and further push price action in BTC downwards. On September 18, a false breakout occurred at $48,742, and on September 23 the monthly pivot at $44,694 got rejected and was met with paring back gains toward the base of the bearish triangle at $50,750.
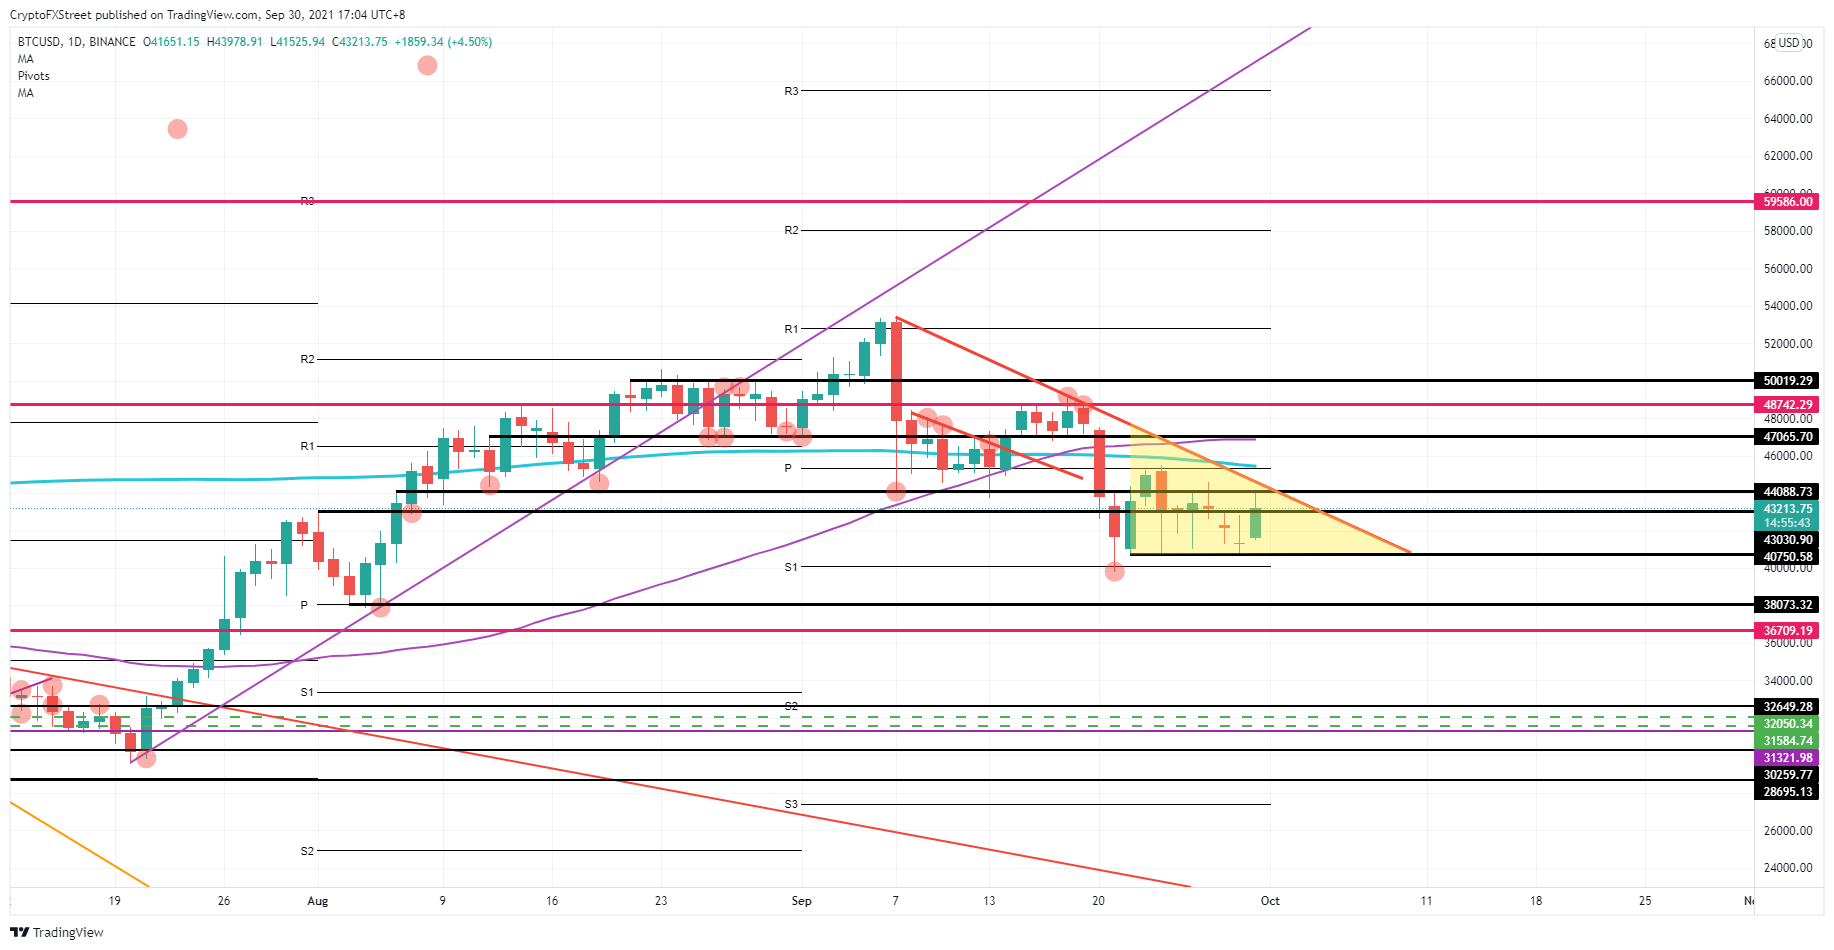
BTC/USD daily chart
With overall sentiment in the markets not clear toward risk-on or risk-off, expect more sideways action to come in BTC price action, with the bearish triangle as a guide. A retest of the base at $40,750 looks imminent, and a break lower would get quickly done if markets have another down day like this past Tuesday. From there, it is not far to make the drop to $38,073.
Bulls in Bitcoin will want to wait and stand on the sidelines before picking up some BTC at the proper discount. If market sentiment shifts back to full risk, expect most buyers to pull the trigger quite rapidly and try to break out of the bearish triangle. A first pause is foreseen near $45,440, where the monthly Pivot sits together with the 200-day Simple Moving Average (SMA).
Like this article? Help us with some feedback by answering this survey:
United States Gross Domestic Product Annualized meets forecasts (6.6%) in 2Q
172679 September 30, 2021 20:51 FXStreet Market News
Information on these pages contains forward-looking statements that involve risks and uncertainties. Markets and instruments profiled on this page are for informational purposes only and should not in any way come across as a recommendation to buy or sell in these assets. You should do your own thorough research before making any investment decisions. FXStreet does not in any way guarantee that this information is free from mistakes, errors, or material misstatements. It also does not guarantee that this information is of a timely nature. Investing in Open Markets involves a great deal of risk, including the loss of all or a portion of your investment, as well as emotional distress. All risks, losses and costs associated with investing, including total loss of principal, are your responsibility. The views and opinions expressed in this article are those of the authors and do not necessarily reflect the official policy or position of FXStreet nor its advertisers. The author will not be held responsible for information that is found at the end of links posted on this page.
If not otherwise explicitly mentioned in the body of the article, at the time of writing, the author has no position in any stock mentioned in this article and no business relationship with any company mentioned. The author has not received compensation for writing this article, other than from FXStreet.
FXStreet and the author do not provide personalized recommendations. The author makes no representations as to the accuracy, completeness, or suitability of this information. FXStreet and the author will not be liable for any errors, omissions or any losses, injuries or damages arising from this information and its display or use. Errors and omissions excepted.
The author and FXStreet are not registered investment advisors and nothing in this article is intended to be investment advice.
US: Real GDP growth stood at 6.7% in Q2 vs 6.6% estimated
172678 September 30, 2021 20:49 FXStreet Market News
- US economy expanded by 6.6% in the second quarter of 2021.
- US Dollar Index holds steady near mid-94.00s, one-year tops.
The US Bureau of Economic Analysis released the final US GDP report this Thursday and confirmed that the world’s largest economy expanded at an annualized pace of 6.6% during the April-June period. The reading matched the Preliminary estimate and market expectations.
Market reaction
The backwards-looking data did little to provide any meaningful impetus, though remained supportive of the prevalent bullish sentiment surrounding the US dollar. In fact, the key USD Index held steady near one-year tops, around mid-94.00s and remained well supported by prospects for an early policy tightening by the Fed.
Full Article
United States Initial Jobless Claims 4-week average climbed from previous 335.75K to 340K in September 24
172677 September 30, 2021 20:49 FXStreet Market News
Information on these pages contains forward-looking statements that involve risks and uncertainties. Markets and instruments profiled on this page are for informational purposes only and should not in any way come across as a recommendation to buy or sell in these assets. You should do your own thorough research before making any investment decisions. FXStreet does not in any way guarantee that this information is free from mistakes, errors, or material misstatements. It also does not guarantee that this information is of a timely nature. Investing in Open Markets involves a great deal of risk, including the loss of all or a portion of your investment, as well as emotional distress. All risks, losses and costs associated with investing, including total loss of principal, are your responsibility. The views and opinions expressed in this article are those of the authors and do not necessarily reflect the official policy or position of FXStreet nor its advertisers. The author will not be held responsible for information that is found at the end of links posted on this page.
If not otherwise explicitly mentioned in the body of the article, at the time of writing, the author has no position in any stock mentioned in this article and no business relationship with any company mentioned. The author has not received compensation for writing this article, other than from FXStreet.
FXStreet and the author do not provide personalized recommendations. The author makes no representations as to the accuracy, completeness, or suitability of this information. FXStreet and the author will not be liable for any errors, omissions or any losses, injuries or damages arising from this information and its display or use. Errors and omissions excepted.
The author and FXStreet are not registered investment advisors and nothing in this article is intended to be investment advice.
United States Core Personal Consumption Expenditures (QoQ) meets expectations (6.1%) in 2Q
172676 September 30, 2021 20:45 FXStreet Market News
Information on these pages contains forward-looking statements that involve risks and uncertainties. Markets and instruments profiled on this page are for informational purposes only and should not in any way come across as a recommendation to buy or sell in these assets. You should do your own thorough research before making any investment decisions. FXStreet does not in any way guarantee that this information is free from mistakes, errors, or material misstatements. It also does not guarantee that this information is of a timely nature. Investing in Open Markets involves a great deal of risk, including the loss of all or a portion of your investment, as well as emotional distress. All risks, losses and costs associated with investing, including total loss of principal, are your responsibility. The views and opinions expressed in this article are those of the authors and do not necessarily reflect the official policy or position of FXStreet nor its advertisers. The author will not be held responsible for information that is found at the end of links posted on this page.
If not otherwise explicitly mentioned in the body of the article, at the time of writing, the author has no position in any stock mentioned in this article and no business relationship with any company mentioned. The author has not received compensation for writing this article, other than from FXStreet.
FXStreet and the author do not provide personalized recommendations. The author makes no representations as to the accuracy, completeness, or suitability of this information. FXStreet and the author will not be liable for any errors, omissions or any losses, injuries or damages arising from this information and its display or use. Errors and omissions excepted.
The author and FXStreet are not registered investment advisors and nothing in this article is intended to be investment advice.
United States Personal Consumption Expenditures Prices (QoQ) in line with forecasts (6.5%) in 2Q
172675 September 30, 2021 20:45 FXStreet Market News
Information on these pages contains forward-looking statements that involve risks and uncertainties. Markets and instruments profiled on this page are for informational purposes only and should not in any way come across as a recommendation to buy or sell in these assets. You should do your own thorough research before making any investment decisions. FXStreet does not in any way guarantee that this information is free from mistakes, errors, or material misstatements. It also does not guarantee that this information is of a timely nature. Investing in Open Markets involves a great deal of risk, including the loss of all or a portion of your investment, as well as emotional distress. All risks, losses and costs associated with investing, including total loss of principal, are your responsibility. The views and opinions expressed in this article are those of the authors and do not necessarily reflect the official policy or position of FXStreet nor its advertisers. The author will not be held responsible for information that is found at the end of links posted on this page.
If not otherwise explicitly mentioned in the body of the article, at the time of writing, the author has no position in any stock mentioned in this article and no business relationship with any company mentioned. The author has not received compensation for writing this article, other than from FXStreet.
FXStreet and the author do not provide personalized recommendations. The author makes no representations as to the accuracy, completeness, or suitability of this information. FXStreet and the author will not be liable for any errors, omissions or any losses, injuries or damages arising from this information and its display or use. Errors and omissions excepted.
The author and FXStreet are not registered investment advisors and nothing in this article is intended to be investment advice.
Chile Industrial Production (YoY): 4.2% (August) vs previous 4.8%
172674 September 30, 2021 20:40 FXStreet Market News
Information on these pages contains forward-looking statements that involve risks and uncertainties. Markets and instruments profiled on this page are for informational purposes only and should not in any way come across as a recommendation to buy or sell in these assets. You should do your own thorough research before making any investment decisions. FXStreet does not in any way guarantee that this information is free from mistakes, errors, or material misstatements. It also does not guarantee that this information is of a timely nature. Investing in Open Markets involves a great deal of risk, including the loss of all or a portion of your investment, as well as emotional distress. All risks, losses and costs associated with investing, including total loss of principal, are your responsibility. The views and opinions expressed in this article are those of the authors and do not necessarily reflect the official policy or position of FXStreet nor its advertisers. The author will not be held responsible for information that is found at the end of links posted on this page.
If not otherwise explicitly mentioned in the body of the article, at the time of writing, the author has no position in any stock mentioned in this article and no business relationship with any company mentioned. The author has not received compensation for writing this article, other than from FXStreet.
FXStreet and the author do not provide personalized recommendations. The author makes no representations as to the accuracy, completeness, or suitability of this information. FXStreet and the author will not be liable for any errors, omissions or any losses, injuries or damages arising from this information and its display or use. Errors and omissions excepted.
The author and FXStreet are not registered investment advisors and nothing in this article is intended to be investment advice.