- Year to date was -75.29B a year ago
- Feb deficit $5.47B vs -5.18B in January
Articles
Dogecoin price could rally to $0.20, here’s why
223336 April 30, 2022 04:09 FXStreet Market News
- DOGE price is seeing a shallow correction on the volume indicator
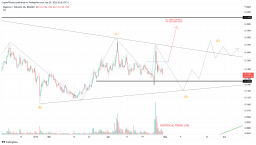
- Dogecoin price is still believed to be coiling inside a triangle formation
- Invalidation of the uptrend scenario is a breach below $0.1050.
Dogecoin price is never a digital asset to fully count-out. Infamously known for its erratic countertrend spikes, DOGE price has potential for one more rally if the technicals are correct.
Dogecoin price to the moon
Dogecoin price could see a rotational shift to the upside, likely to throw many traders off guard. The overall macro thesis remains as Dogecoin price coiling within a triangle formation. The invalidation for the triangle resides at $0.2109. The current Dogecoin price trades at $0.1360, which leaves 50% of uncharted territory for the bulls.
Analyzing the recent sell-off, the DOGE price appears to be consolidating under a shallow volume, which is a good sign for Doge investors. Traders reading this thesis are asked to understand this is a high trade setup as trading within triangles is exceptionally challenging. Still, the ideal situation is an additional upswing to $0.1792 to justify the recent upswing on April 09th.
DOGE/USDT 8-Hour Chart
Invalidation of the bullish countertrend move is a break below $0.1064. If the bears breach this level, the Doge triangle idea would be void. The bears could push the price back into the historical trend line at $0.09, resulting in a 30% dip from the current Dogecoin price.

AUD/JPY fails to hold above 21DMA, drops over 1.0% into mid-91.00s amid risk-off Wall Street session
223335 April 30, 2022 04:09 FXStreet Market News
- Risk-off flows on Wall Street weighed heavily on AUD/JPY on Friday.
- Having failed to rally above its 21DMA near 93.00, the pair dropped over 1.0% to the mid-91.00s.
- Focus remains on broader risk appetite China lockdown risks next week, as well as on the RBA policy announcement.
A sharp deterioration in risk appetite on Wall Street on the final trading day of the month that saw the S&P 500 index drop around 3.0% to fresh multi-week lows weighed heavily on risk-sensitive currencies on Friday. As a result, the Australian dollar was one of the underperforming G10 currencies on the day, while the safe-haven yen was able to attract some safe-haven-related inflows.
AUD/JPY was subsequently last trading lower by more than 1.0% in the 91.75 region, having failed for a second successive session to rally above its 21-Day Moving Average near 93.00. Friday’s pullback puts the pair on course to have fallen about 1.5% this week, which is not too shabby considering the pair was at one point trading nearly 3.0% lows in the mid-90.00s. The dovish tone of the BoJ on Thursday, which triggered a broad drop in the yen at the time, combined with spicey Australian Consumer Price Inflation data on Wednesday, which triggered a build up of RBA tightening bets, was the main catalyst for the mid-week rebound.
Markets now expect that the RBA will hike interest rates by 15 bps next week to 0.25%, with the bank expected to fully depart from its prior stance emphasising “patience” to being more proactive in getting rates back to neutral. Against that backdrop, one might think that risks are tilted to the upside for AUD/JPY next week. But if the pair is to have any chance of rallying back towards recent multi-year highs in the upper 95.00s, risk appetite in equity markets is going to need to improve.
But with the Fed expected to hike interest rates by 50 bps, announce QT plans and signal its intent to get rates back to around 2.5% by the year’s end, betting on a risk appetite rebound against this hawkish backdrop is risky. Moreover, the Aussie also has to contend with risks related to lockdowns in China, which could yet further throttle demand in Australia’s most important export partner.
Full Article
Top 3 Price Prediction Bitcoin, Ethereum, Ripple: Whales, Greed, Smart Money & Fear
223331 April 30, 2022 03:21 FXStreet Market News
- Bitcoin price may have printed the final bottom for spring.
- Ethereum could see a countertrend rally to $3,150.
- XRP price action is still disappointing, but holdlng could pay off
The cryptocurrency market could be establishing a bottom that will only be noticed in retrospect. Traders may have been experiencing sell-offs and fakeouts all month. The games played could be smart money’s involvement before the market rallies. Bitcoin, Ethereum and XRP could experience more sideways price action before a new rally is confirmed.
Bitcoin signals whales in the market
Bitcoin price magnet-like price action around $41,300 and $39,700 hints that whales may be trying to accumulate the digital asset. The criteria could fit perfectlky as a Bitcoin Wycoff accumulation phase. Investors should consider a dollar-cost approach at these levels to avoid missing out on a good entry in retrospect. The next target for Bitcoin price lies somewhere in the $36,000 zone if the bulls cannot hold the swing low at 37,701.
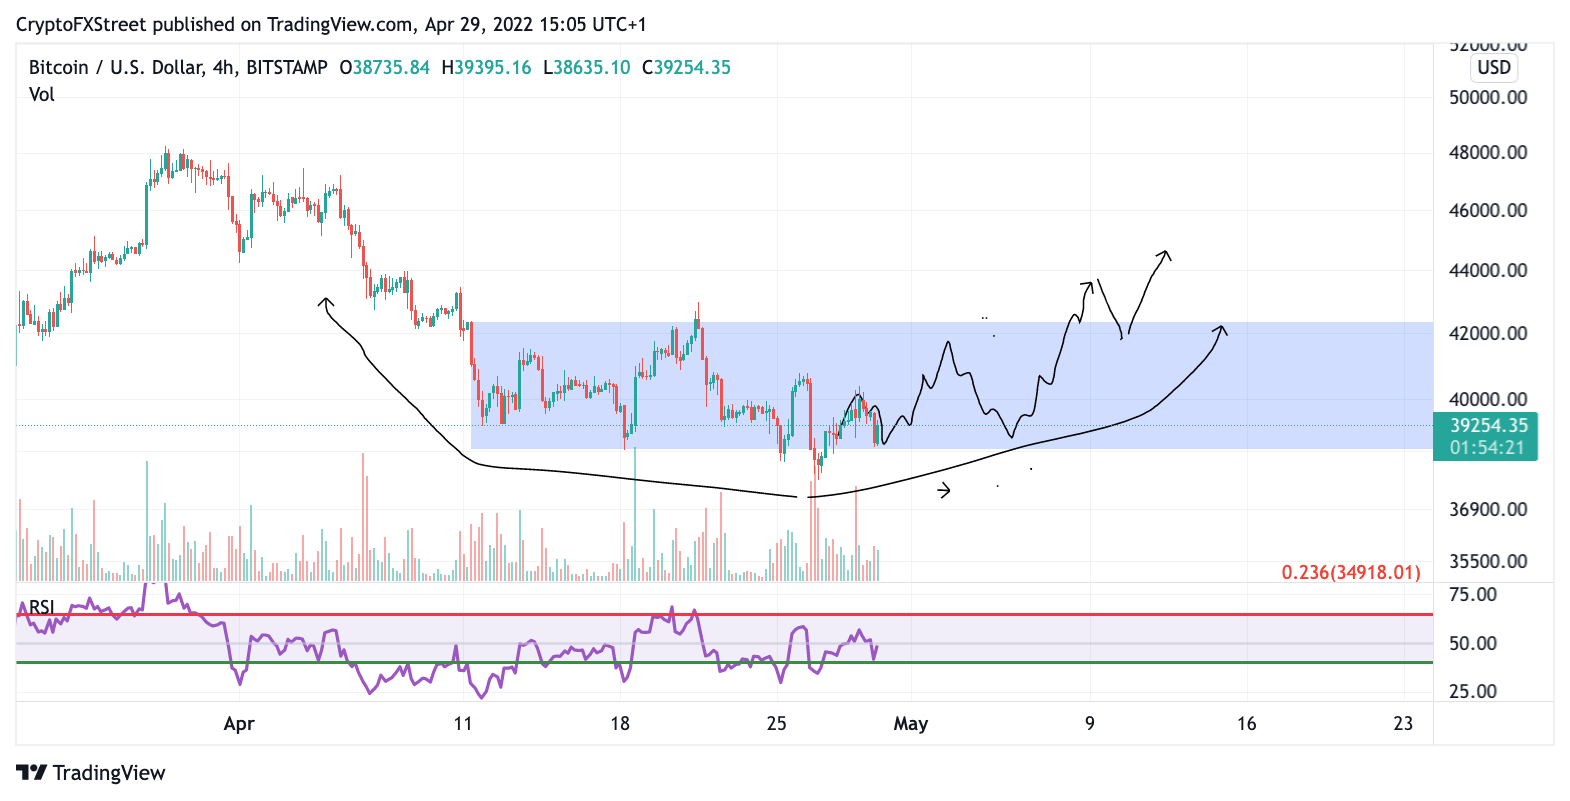
BTC./USDT 4-Hour Chart
Invalidation of the Macro Bitcoin triangle lies at $28,000. If $28,000 is breached, traders should have enough steam to push the BTC price as low as $17k resulting in a 40% correction from the current Bitcoin price.
Ethereum price could shake out greedy bears
Ethereum price still trades below the $3,000 zone. The ETH price currently trades at $2,850 as the bears have validated last week’s bearish thesis by tapping $2,750 earlier this week.
ETH price has breached the weekly trend line again but now trades above it at $2,850. This is the first sign of the bull rally everyone is hoping for. In addition, the ETH price could be coiling into an ending diagonal pattern on the 8-hour chart. The Relative Strength Index displays bullish divergence in oversold territory, which further confirms that the downtrend could briefly come to a halt. The bullish target is $3,150
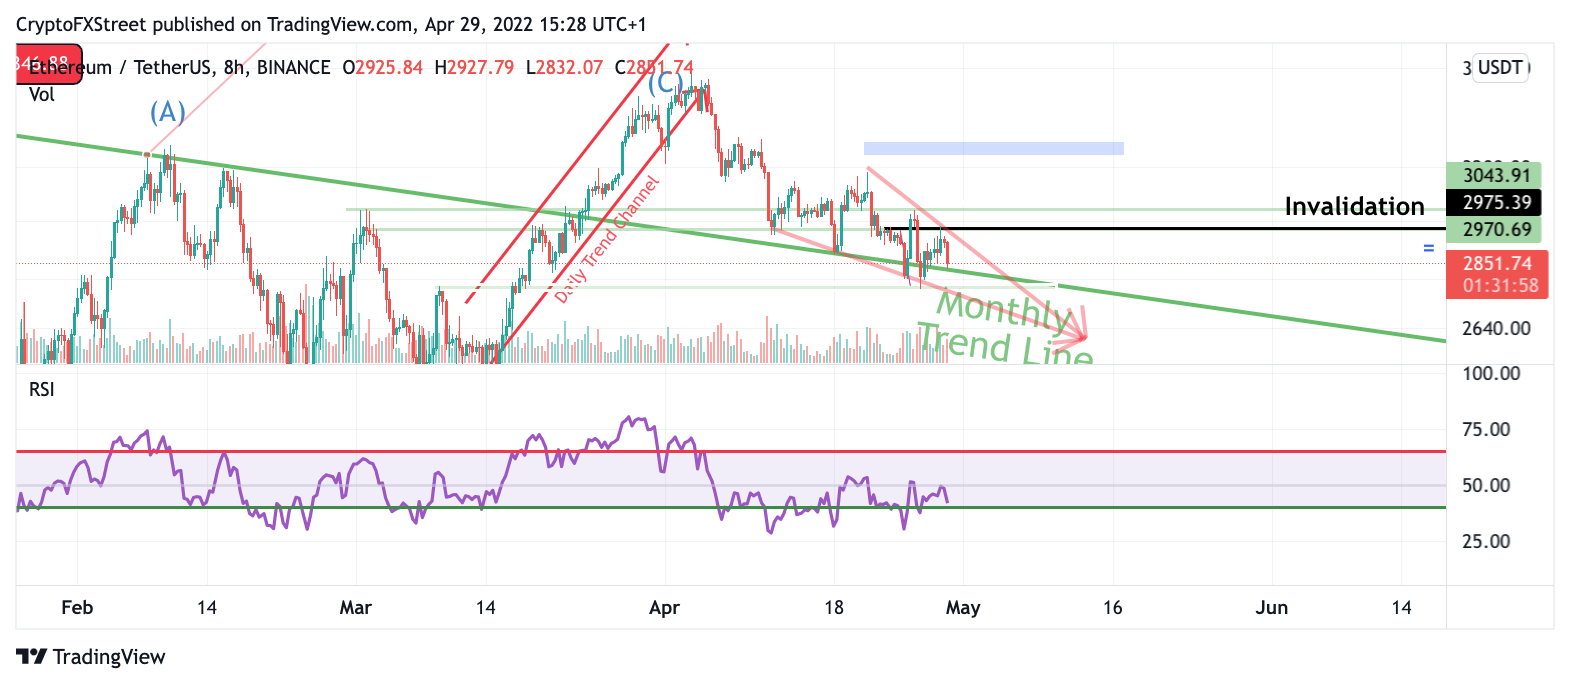
ETH/USDT 8-Hour Chart
Ethereum price invalidation is $2,480. If the bears can breach this area, the ETH price uptrend could be void. The bears could confidently aim for $2,200, resulting in a 20% decrease from the current Ethereum price.
XRP price forces traders to lighten their load
XRP price still looks like the most disappointing digital asset in the cryptocurrency market. Today, the ripple price broke through a parallel trend channel as the price has wiped out liquidity under $0.62. A dollar-cost average approach could still benefit XRP maximists aiming for long-term macro targets.
XRP price volume is still falling on the 4-hour chart in a steep decline. Day traders are likely being liquidated, so a spike in price would be unsurprising. Still, the safest invalidation level is now $0.54.
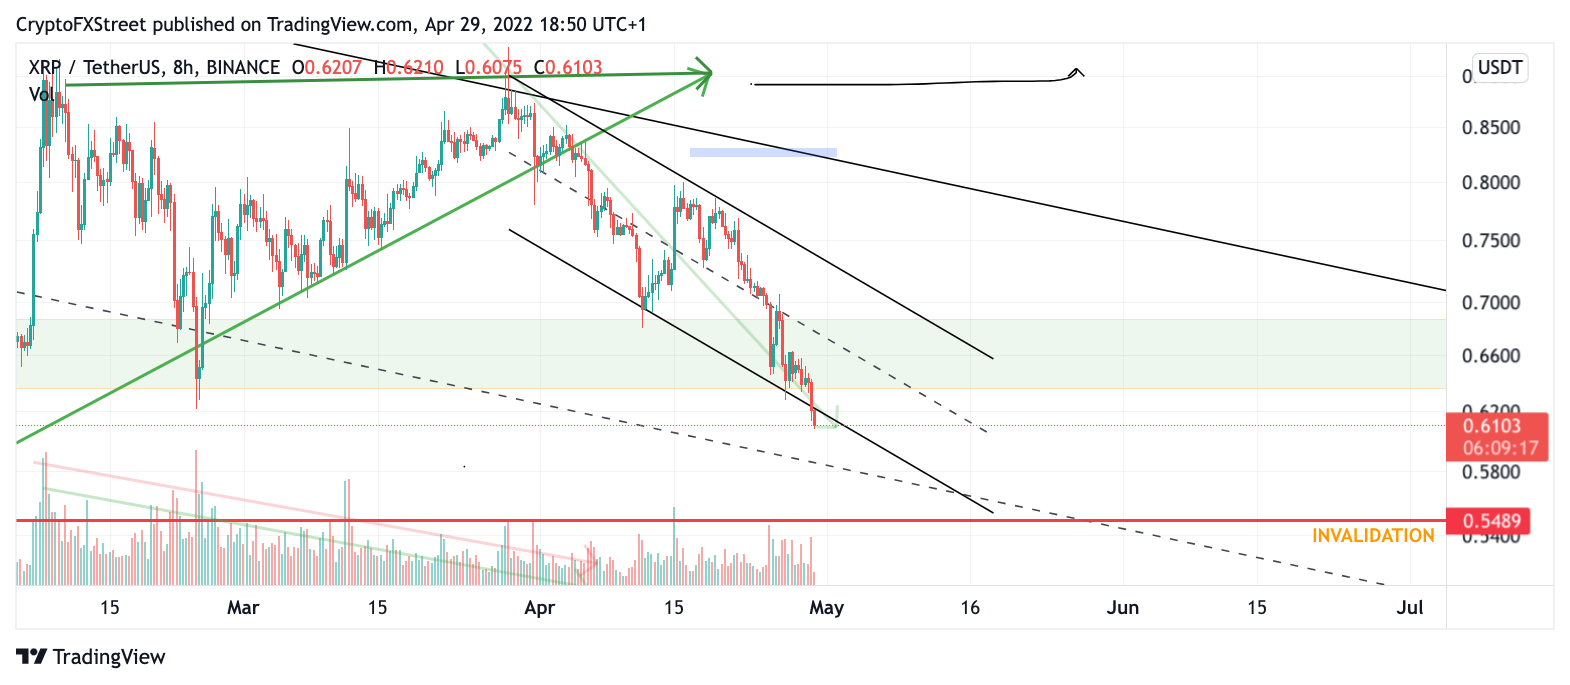
XRP/USDT 8-Hour Chart
XRP macro targets are well above the $3.00 zone, so any discounts in Ripple price are likely to be accompanied by smart money fakeouts. However, If the XRP price breaks $0.54, expect more genuine sell-offs. XRP price could likely fall back to $0.44, resulting in a 35% dip from the current price.
Cable comes up for air
223329 April 30, 2022 03:17 Forexlive Latest News Market News
Nothing falls in a straight line forever.
It’s month end today and that was the cue for cable shorts to square up. The pair jumped 135 pips today to 1.2591. The pair fell as low as 1.2411 yesterday.
Is there scope for a larger bounce from here? I believe there is but the trend is lower. I would look to sell around 1.28 as the growth outlook for Europe continues to deteriorate and risk trades struggle. Lately, cable has had a very high correlation with equities and the picture in stocks at the moment isn’t good.

EUR/JPY Price Analysis: Struggles around 137.00, as a head-and-shoulders formation looms
223327 April 30, 2022 03:09 FXStreet Market News
- The EUR/JPY prepares to finish April with decent gains of 1.64%.
- A dismal market sentiment, increased appetite for safe-haven peers.
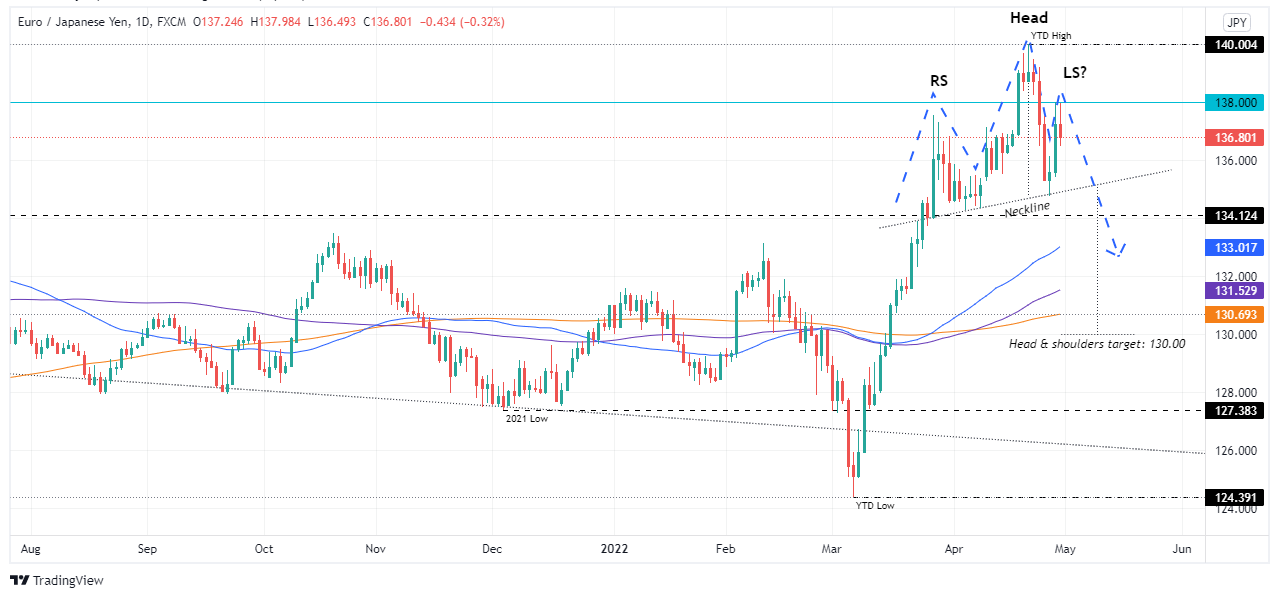
- EUR/JPY Price Forecast: A head-and-shoulders pattern in the daily chart is forming and, once validated, could drag the EUR/JPY towards 130.00.
The EUR/JPY grinds lower during the North American session on Friday, though it looks forward to printing two consecutive monthly gains, up 1.64% as the month-weekly end looms. At the time of writing, the EUR/JPY is falling some 0.31%, trading at 136.80.
A risk-off market mood suddenly shifted appetite in the FX space. Except for the greenback, safe-haven peers are the leaders in the North American session. Risk appetite is weighed by concerns about China’s coronavirus outbreak which threatens to disrupt supply chains, Russia-Ukraine tussles continued, and a Federal Reserve aggressive tightening added a pinch of salt to a dismal sentiment.
During the overnight session, the EUR/JPY opened around 137.50 and meandered around the 200-hour simple moving average (SMA), almost horizontal, around 137.70. However, once European traders got off their desks, the US session’s sour sentiment weighed on the EUR/JPY, dragging the pair towards new daily lows around 136.50.
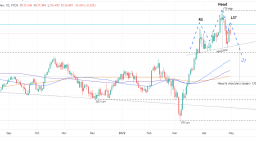
EUR/JPY Price Forecast: Technical outlook
The EUR/JPY daily chart depicts the pair as upward biased, though it in the last couple of days was unable to break resistance at 138.00, courtesy of EUR weakness. Also, a head-and-shoulders pattern is forming, which would add downward pressure on the pair, though a break below the neckline is needed to validate the pattern.
If that scenario plays out, the EUR/JPY first support would be 136.00. Break below would drag the pair towards the head-and-shoulders necklines, around 134.70-135.00. Once broken, the next stop would be last year’s high, around 134.12, followed by some DMAs before reaching the 130.00 head-and-shoulders targets.
S&P 500 tumbles nearly 3.0% back under 4200, probes monthly lows as Amazon stock tanks
223326 April 30, 2022 03:09 FXStreet Market News
- US equities slumped on Friday, led by a more than 15% decline in Amazon’s share price post-earnings.
- The S&P 500 dropped nearly 3.0% to test monthly lows in the 4,160s, where it trades over 8% lower on-the-month.
A more than 15% drop in US tech giant Amazon’s share price to its lowest level in nearly two years under $2500 per share weighed heavily on the major US indices on Friday. Amazon posted its Q1 earnings results after Thursday’s market close, which revealed that higher costs were squeezing margins more than expected. Fellow tech giant Apple also reported earnings after Thursday’s close and failed to lighten the mood. The iPhone maker’s share price was last trading lower by about 1% despite posting record sales and profits in Q1, with traders citing a weak outlook.
Downbeat earnings meant the US equity markets were a sea of red on Friday, with no major sector able to escape the sell-off. The S&P 500 was last trading lower by nearly 3.0%, which saw it crash back below the 4,200 level and probe multi-week lows printed earlier in the week around 4,160. The tech-dense Nasdaq 100 index was down a little over 3.5% and eyeing a test of weekly lows at 13,000, while the Dow was last down a little over 2.0% and also eyeing a test of weekly lows just under 33,100.
Traders said Friday’s sell-off was partially worsened after US yields rallied in wake of data revealing a larger than expected jump in the Employment Cost Index in Q1 this year, which seemed to encourage markets to up their bets on Fed tightening. Indeed, fears about Fed tightening, with the bank expected to lift interest rates by 50 bps next week followed by a series of further rate hikes of similar magnitude, have been a key factor weighing on US equities this month.
The S&P 500 is currently on course to post a near 8.0% loss on the month, its worst performance since Q1 2020, with the index now back in correction territory versus record highs above 4,800 printed at the start of the year. The losses are more severe for the Nasdaq 100, which looks set to end the month around 12.5% lower, taking the index more than 20% below its peak last November, meaning the index is in an official “bear market”. The Dow, meanwhile, looks set to end the month a more modest 4.0% lower and is still less than 10% below its record highs from back in January.
Full Article
Russia’s Lavrov: Most key customers agreed to gas-payment terms
223324 April 30, 2022 02:45 Forexlive Latest News Market News

- Moscow and Kyiv could already have achieved major results at peace talks but Kyiv is changing its position under orders from the US and UK
- Russia does not consider itself to be at war with NATO
- Any shipment of a foreign weapon into Ukraine is a legitimate target for Russia
In separate comments, Zelensky said there was a high probability that peace talks would end.
TTF prices have finished up the week flat, suggesting that those who needed to know this already did.
Full Article
Russia’s Lavrov: Russia does not consider itself at war with NATO, this could raise risk of nuclear war
223323 April 30, 2022 02:40 FXStreet Market News
Russian Foreign Minister Sergey Lavrov said on Friday that Russia does not consider itself to be at war with NATO, adding that such a development could raise the risk of a nuclear war, something which cannot be allowed, reported Reuters citing Russia’s RIA news agency.
Moscow and Kyiv could already have achieved major results at peace talks, but Kyiv is changing its position under orders from the US and UK, Lavrov continued. Russia is not threatening anyone with nuclear war, he said seemingly in response to accusations from the West that Russia has been employing nuclear threats/blackmail recently.
Lavrov reiterated that any shipment of foreign weapons into Ukraine is a legitimate target for Russia.
Full Article
Ukraine’s Zelenskyy: High risk that peace talks with Russia will end, cites actions of Russian troops
223322 April 30, 2022 02:40 FXStreet Market News
Ukrainian President Volodymyr Zelenskyy said on Friday that peace talks with Russia at a high risk of ending given the action of Russian troops during the war, reported Russian state-run news agency Interfax reported according to Reuters.
Seperately, a Pentagon spokesperson said that it is hard to look at what Russian President Vladimir Putin is doing in Ukraine and think that any ethical, moral person could justify such actions. The Pentagon spokesperson added that Russian operations in Ukraine are brutality of the coldest and most depraved sort.
Full Article
S&P 500 completely erases yesterday’s gains
223320 April 30, 2022 02:12 Forexlive Latest News Market News
April is generally the best month of the year for equities but that hasn’t been the case at all this year.
The S&P 500 is tracing out a new low for the day, down 104 points or 2.4%. The drop completely erases yesterday’s big rally. It’s now just 20 points from Wednesday’s intraday low.


Canada February federal budget balance year-to-date -$69.8B vs -$75.29B prior
223318 April 30, 2022 02:09 Forexlive Latest News Market News
- February US budget balance data
Full Article

USD/CHF Price Analysis: Clings to 0.9700 amid broad US dollar weakness, safe-haven appetite
223316 April 30, 2022 02:09 FXStreet Market News
- The USD/CHF to record the biggest monthly gain since May 2012, up 5.17%.
- A dampened market mood increased the appetite for the safe-haven Swissy as US dollar traders booked profits.
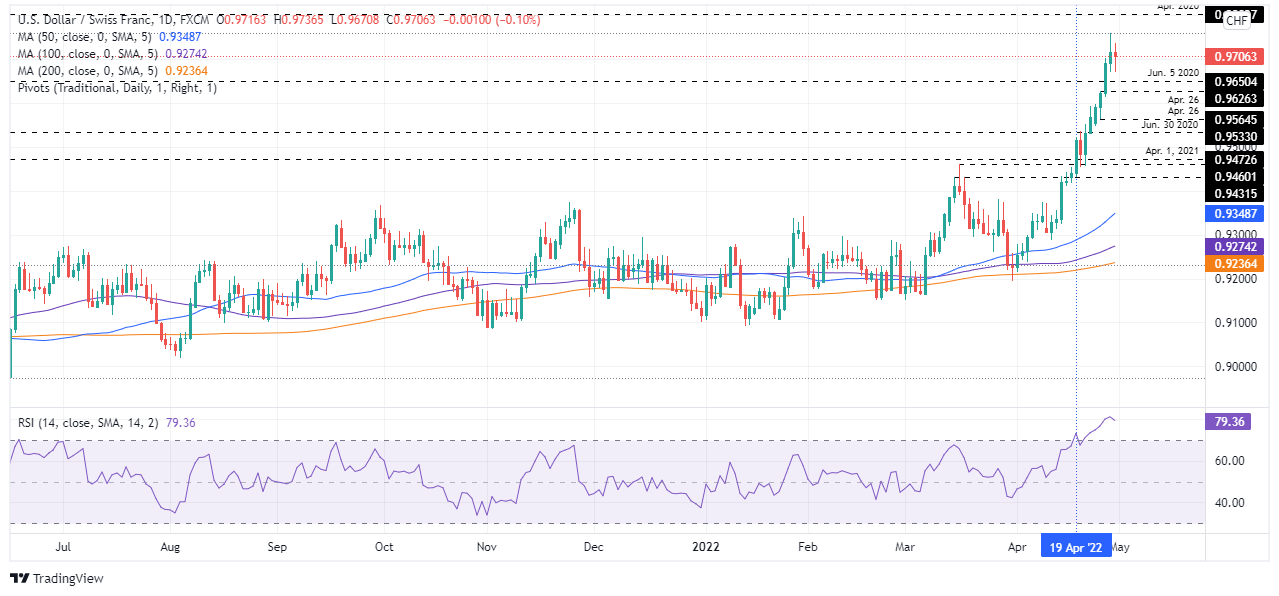
- USD/CHF Price Forecast: A daily close below 0.9700 might open the door for a mean reversion move.
The USD/CHF retreats from YTD highs though clings to the 0.9700 mark despite broad US dollar weakness across the board, driven by traders booking profit as the month-weekly end looms. At 0.9706, the USD/CHF reflects the previously mentioned and is headed to record monthly gains of 5.17%, its largest since May 2012.
Sentiment turned sour once European markets closed. US equities remain on the backfoot, weighed by weak earnings from mega-cap companies like Apple and Amazon. Furthermore, China’s coronavirus outbreak, Federal Reserve aggressively tightening, and the Russia-Ukraine war concerns dented investors’ mood.
In the meantime, the US Dollar Index, a gauge of the buck’s value vs. a basket of its peers, drops below 103.000, down some 0.73%, sitting at 102.912.
During the overnight session, the USD/CHF seesawed around the daily pivot point at 0.9720. However, once European traders took over the market, the Swissy strengthened. The pair reached a daily low around the S1 daily pivot at 0.9670 on news that the US Core Personal Consumption Expenditure (PCE), the Fed’s favorite gauge of inflation, rose lower than estimated. Of late, the greenback recovered some ground, and USD/CHF bulls achieved to hold prices above 0.9700.
USD/CHF Price Forecast: Technical outlook
The USD/CHF is upward biased, as depicted by the daily chart, despite Friday’s fall. However, the steepness of the uptrend threatens to put into play a mean reversion move, further expected as the Relative Strength Index (RSI) within the overbought territory begins to aim lower.
If that scenario plays out, the USD/CHF first support would be June 5, 2020, swing high turned support at 0.9650. A breach of the latter will send the pair towards 0.9600, followed by June 30, 2020, a daily high at 0.9533.
Key Technical Levels
Full Article