Articles
GBP/USD advances steadily towards 1.2080s on a weak USD
281039 December 31, 2022 01:56 FXStreet Market News
- GBP/USD holds to decent gains around 1.2070s but below the 200-day EMA.
- US Chicago Manufacturing PMI exceeded estimates but remains at contractionary territory.
- GBP/USD Price Analysis: Upward biased, but needs to clear the 200-DMA to extend its gains.
The Pound Sterling (GBP) pares its losses against the US Dollar (USD) due to risk aversion dominating the last trading day of 2022. Wall Street extended its losses, while the lack of news kept the GBP/USD within familiar exchange rates. At the time of writing, the GBP/USD is trading at 1.2079 after testing daily lows of 1.2009.
US equities continued to fall amidst the lack of news. The Chicago Purchasing Manufacturing Index (PMI) for December exceeded estimates of 40.5, at 44.9 but remained in contractionary territory. According to sources cited by MarketWatch, the manufacturing sector is suffering from slow demand spurred by a weaker global economy and a backlog of unfilled orders from the pandemic.
In the meantime, the lack of economic data in the UK economic calendar keeps investors adrift to the latest developments linked to the energy crisis in the UK. According to the Times, UK’s finance minister Jeremy Hunt has been weighing how much assistance to provide companies when an existing six-month energy support program worth £18 billion expires in March of 2023.
Meanwhile, the US Dollar Index, a gauge of the buck’s value against a basket of six rivals, extended its losses to 0.40%, at 103.560, contrarily to US Treasury bond yields, and a tailwind for the GBP/USD. The US 10-year benchmark note rate is gaining seven and a half bps at 3.894%.
Ahead into the next week, the UK economic calendar will feature the S&P Global/CIPS Manufacturing PMI on Tuesday. On the US front, the docket will feature the S&P Global Manufacturing PMI.
GBP/USD Price Analysis: Technical outlook
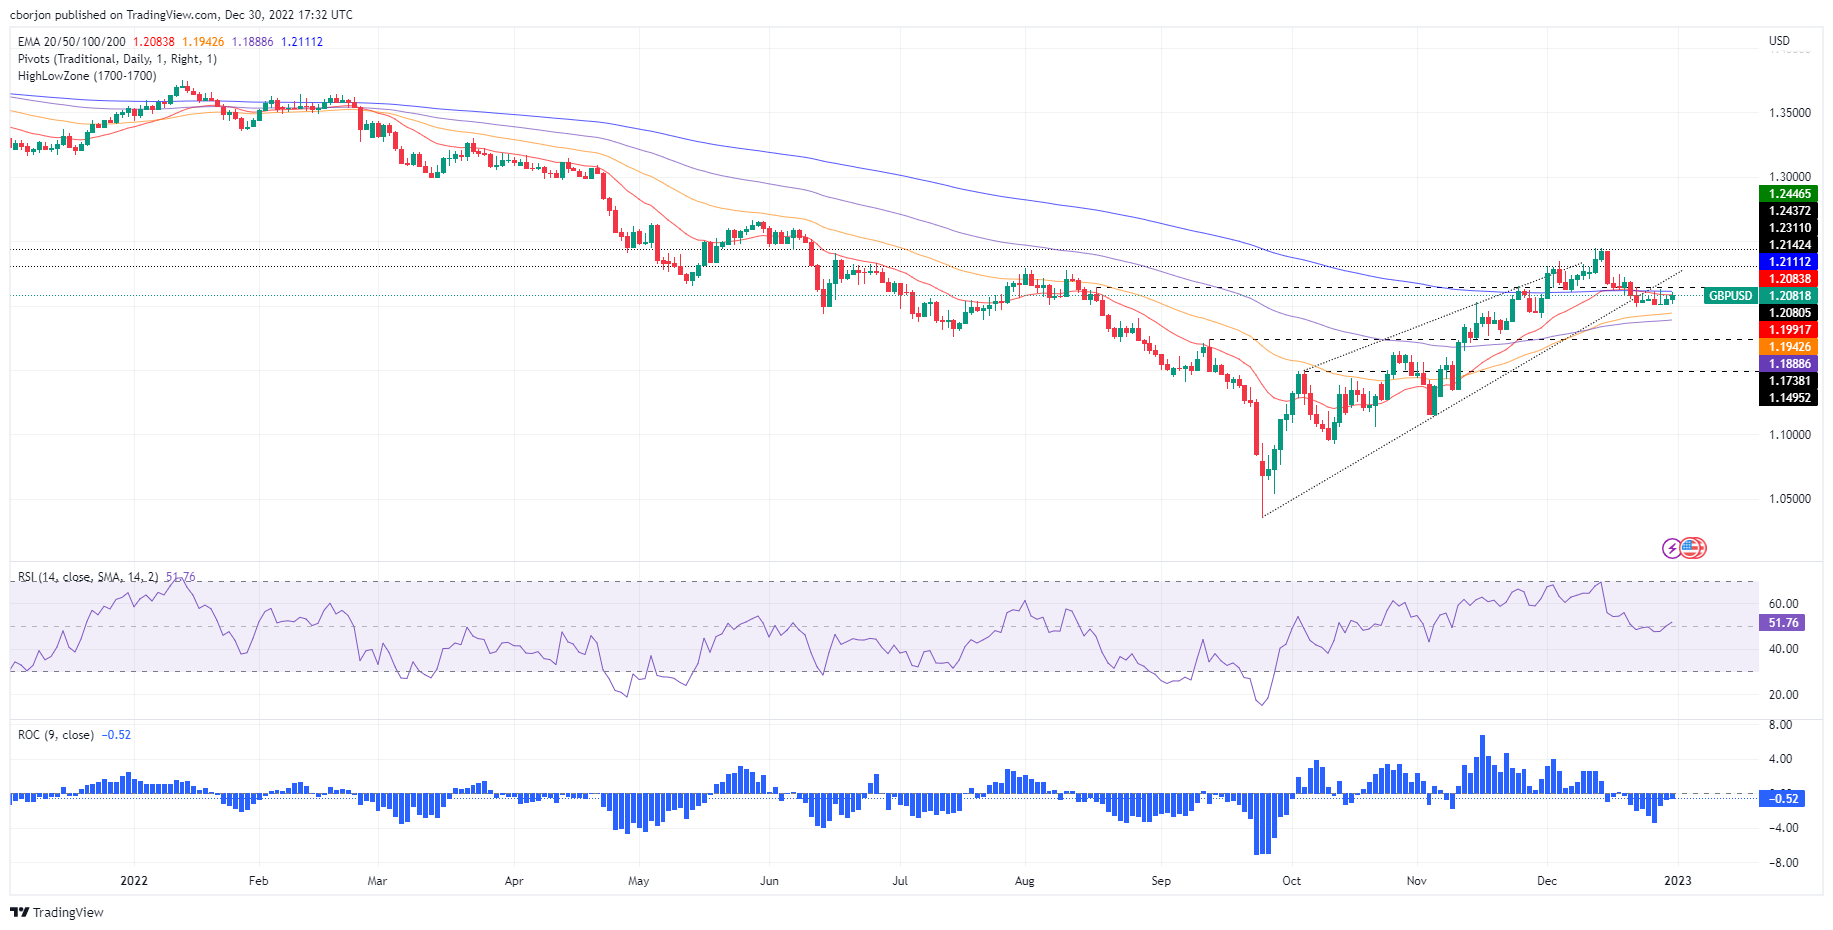
the daily chart depicts the GBP/USD consolidated ahead into the following year. The 200-day Exponential Moving Average (EMA) at 1.2111 is proving difficult resistance to hurdle, while GBP/USD buyers are defending the 1.2000 figure. The Relative Strength Index (RSI) aims higher after crossing the 50 midline, while the Rate of Change (RoC) displays selling pressure waning.
Hence, the GBP/USD is neutral-upward biased, and its first resistance is the 200-day EMA at 1.2111. Break above will expose the December 19 daily high of 1.2242, followed by the 1.2300 figure. As an alternate scenario, the 1.2000 figure is the first defense line for GBP buyers. Once cleared, the next support would be the 50-day EMA at 1.1942, followed by 1.1900.
USD/JPY Price Analysis: Stumbles to fresh weekly lows around 132.10s
281037 December 31, 2022 00:26 FXStreet Market News
- USD/JPY drops 0.70% on risk aversion and a softer US Dollar.
- USD/JPY Price Analysis: Downward biased, could extend its losses below 130.00, towards May lows around 126.00.
The USD/JPY is falling for the second consecutive day as risk aversion continues to drive the last trading day of 2022, as shown by Wall Street registering losses. The USD/JPY extended its fall below the December 29 daily low of 132.87 and stabilized at current exchange rates after hitting a daily low of 131.50. At the time of typing, the USD/JPY is trading at 132.11.
USD/JPY Price Analysis: Technical outlook
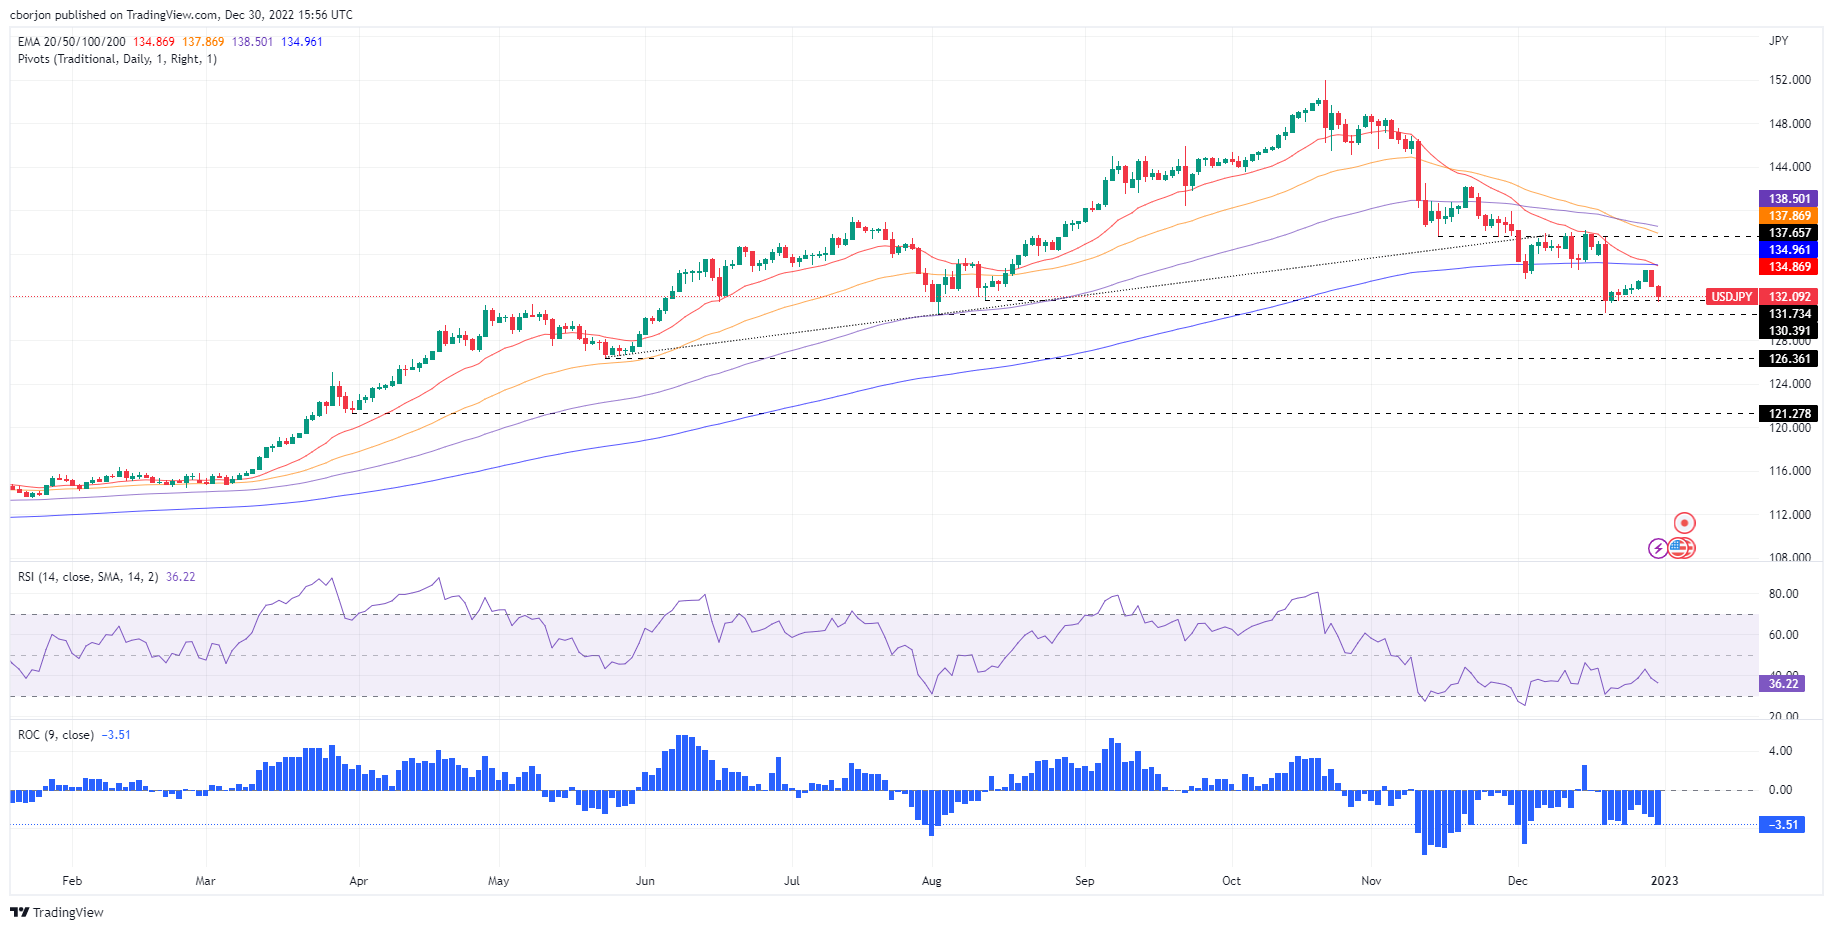
From a daily chart perspective, the USD/JPY might continue to drop further, but until it breaks the December 20 daily low of 130.56, that could pave the way to test 130.00. At the time of writing, the 20-day Exponential Moving Average (EMA) crossed below the 200-day EMA, exacerbating further downside action. Since peaking at around 151.94 in October, the USD/JPY has recorded successive series of lower highs and lows, confirming the downtrend. Additionally, the Relative Strength Index (RSI) and the Rate of Change (RoC) are in bearish territory, suggesting that sellers are in charge.
That said, the USD/JPY first support would be 130.56, followed by the figure at 130.00. The break below will expose the May 24 swing low of 126.36, followed by the March 31 low of 121.27.
USD/JPY Key Technical Levels
Full Article
CNY weakness should persist – Credit Suisse
281036 December 31, 2022 00:26 FXStreet Market News
Economists at Credit Suisse expect the Chinese Yuan to continue weakening in the coming months.
Asia FX complex is likely to remain weak in the first part of 2023
“The Asia FX complex is likely to remain weak in the first part of 2023 given the resilient USD trend.”
“Some divergence across the region can be expected, depending on the various economies’ dependence on manufacturing exports. This is one key reason why the CNY is likely to weaken. The other is that imports are likely to accelerate as expansionary fiscal and monetary policy starts to feed through into the real economy in the months to come.”
“With the CNY still 3%-4% above pre-COVID highs in trade-weighted terms, we expect Chinese authorities to be more than comfortable with a meaningful CNY depreciation.”
“Within the region, the IDR should prove more resilient in 2023, due to its trade surplus and attractive carry against the USD, which is among the highest in the region.”
Full Article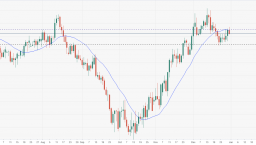
NZD/USD Price Analysis: Kiwi limited while under 0.6350
281033 December 30, 2022 23:49 FXStreet Market News
- Volatility and erratic moves during the last trading session of the year.
- NZD/USD to end year with a 7.30% loss.
- The 0.6500 has the key to more gains for the Kiwi.
The NZD/USD is trading above 0.6300 during the last trading day of 2022. On a volatile session the pair hit the highest level in a week at 0.6373 and then pulled back to the 0.6330 zone.
The Kiwi is among the worst performers on Friday, on a volatile final trading day of 2022. For the year, the NZD lagged among commodity currencies, even after the recovery of the last quarter.
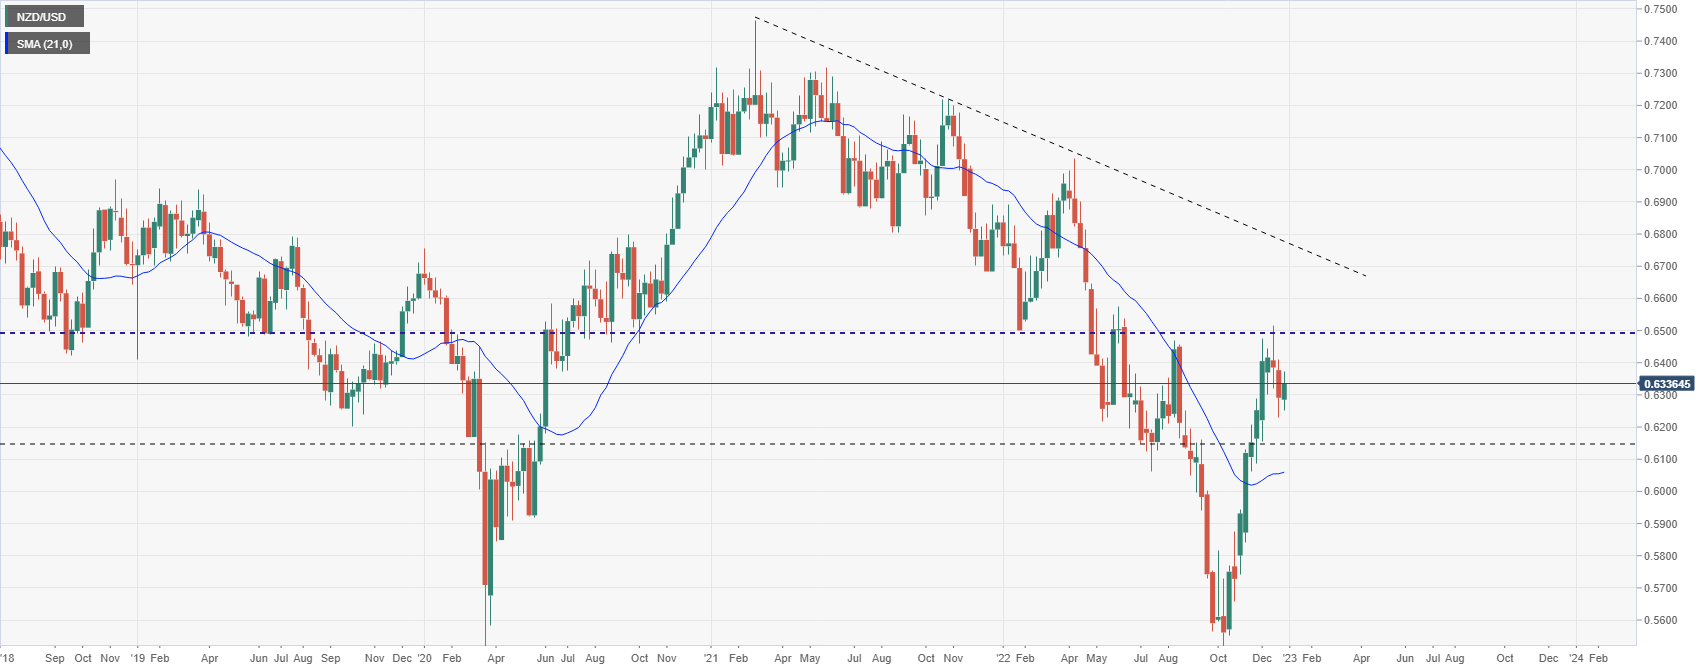
The NZD/USD bottomed during 2022 at 0.5512 in early October. It then started to recovery, trimming yearly losses. The upside move peaked slightly above 0.6500 two weeks ago. The 0.6500 area is a strong barrier that if broken should open the doors to more gains for the Kiwi.
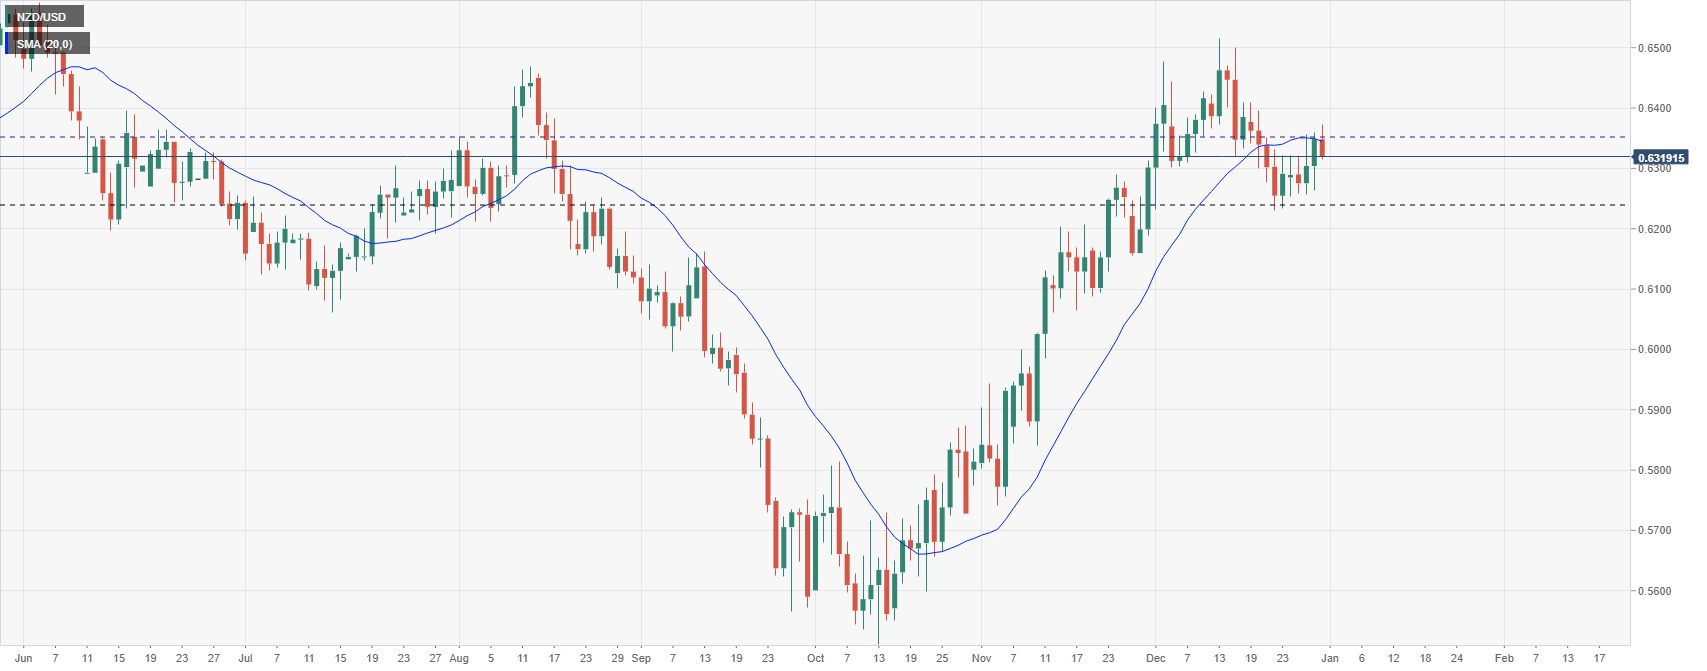
The daily chart shows NZD/USD testing the 20-day Simple Moving Average that is hovering around 0.6350, a horizontal resistance area. While below, risks are tilted toward another test of the bottom of the current range at 0.6240. A daily close well above 0.6350 would point to further gains.
NZD/USD daily chart
NZD/USD weekly chart
Technical levels
Full Article
More downside ahead for Iron Ore – ING
281032 December 30, 2022 23:49 FXStreet Market News
Iron Ore has been one of the worst-performing commodities this year. Hopes of a China recovery in the second half of 2023 should provide support in the medium term. The short-term outlook is more bearish, strategists at ING report.
Iron Ore’s rout to continue until China recovers
“We believe the short-term outlook remains bearish with sluggish demand from China suggesting that prices should trend lower. We expect prices to slide to $85/t in the first quarter of 2023 and hover around $90/t throughout the second and third quarters.”
“Prices should be supported in 2H23 due to expectations of a recovery in China and easing Covid restrictions, with prices moving above $95/t in 4Q.”
Full Article
4 trading themes for 2023: #3 Europe is a weather trade (but the sun can’t shine forever)
281031 December 30, 2022 23:33 Forexlive Latest News Market News
The number one thing the world has to be thankful at the
turn of the year is good weather in Europe, and to a lesser extent North
America.
Europe is a weather trade right now and the forecast is
good. November was remarkably warm in Europe, December had a short-lived cold
snap but the next two weeks are warm.
Europe GEFS (GFS Ensemble) temperature anomaly 06z forecast for Dec 30 to Jan 15 from Pivotal Weather. #Natgas https://t.co/wwPYcRG9BL pic.twitter.com/DvYON9AABd
— RonH (@Ronh999) December 30, 2022
Beyond that, it’s anyone’s guess but even
with what’s happened already, European energy storage will hold up. In North
America, a light hurricane season didn’t disrupt energy and after the Christmas
travel havoc, the next week or so is set to be balmy.
The investing theme for the decade is energy. The
global challenge this decade is to deliver cheap, reliable and increasingly
clean energy. It’s a staggeringly difficult task and I’m skeptical that it will
happen in the kind of timeline that anyone wants but every day of warm winter
weather is a bonus.
The problem for Europe is that this isn’t just a 2022
problem or 2023 problem. The LNG cavalry doesn’t arrive until 2025 or 2026 and
by that point, European government budgets will be in shambles.
The euro and pound certainly aren’t expensive but there’s
no reason to buy them unless there’s some kind of dramatic change in
Russia. Competitiveness is being eroded daily by high energy costs and inbound
long-term investment is nil.
EURUSD weekly chart
A much better trade on shifts in global trading patterns
is in the Mexican peso or Mexican assets in general.
4 trading themes for 2023: #4 Give China a KISS
Full Article
Gold Price Analysis: XAU/USD remains unable to consolidate above $1,820
281029 December 30, 2022 23:33 FXStreet Market News
- Gold prices print new highs, but continues to have difficulties holding above $1,820.
- Divergence in metals: gold tests daily highs while silver hits fresh lows.
- Volatile final hours of 2022 across financial markets on the London fix.
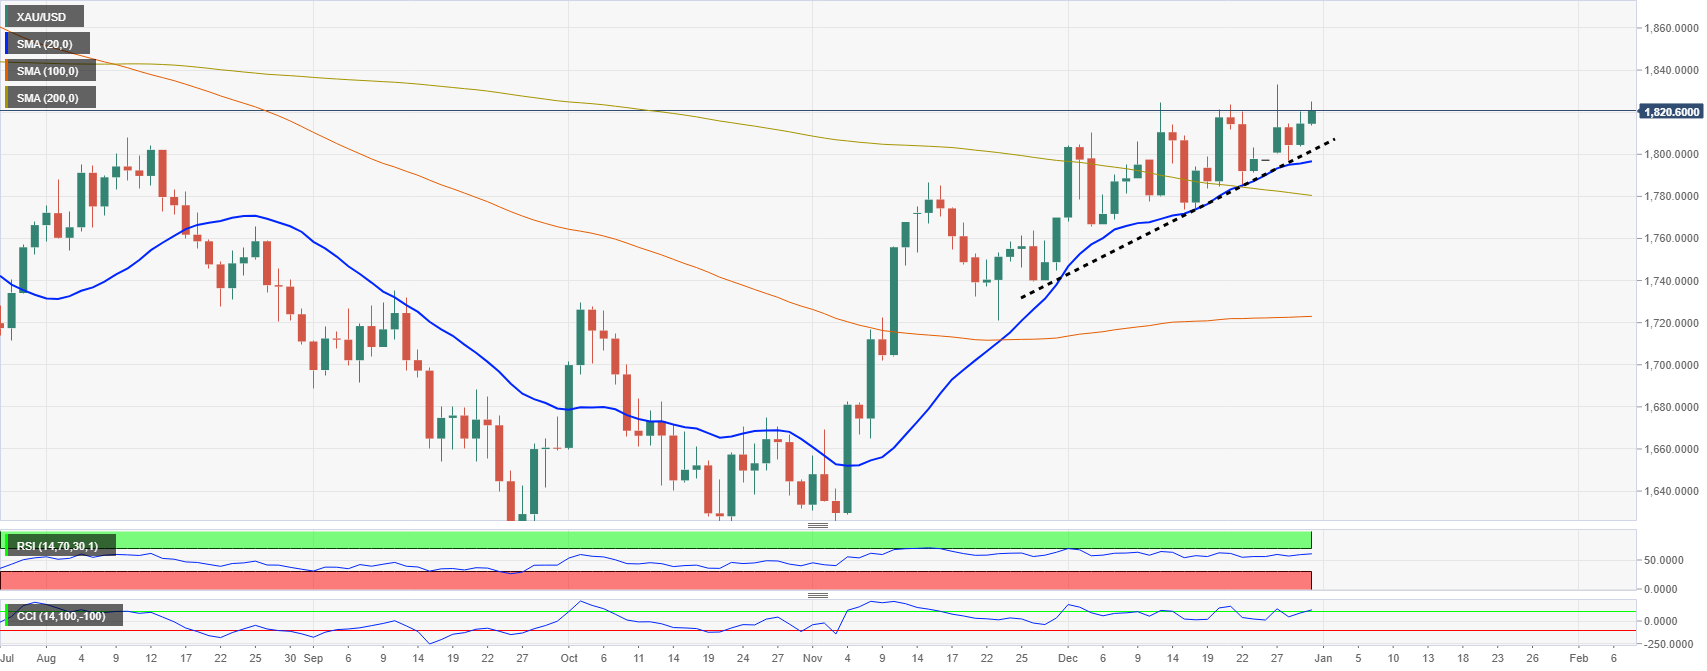
Gold prices are hovering around $1,820 about to end 2022 practically flat for a wild year. On Friday, XAU/USD rose to as high as $1,825 and then pulled back. The bias point to the upside, but the yellow metal continues to show difficulties in holding above the $1,820 zone.
Silver and gold prices showed an unusual divergence. Silver tumbled from fresh highs at $24.15 to 23.66$ while gold remained near the top. XAU/USD is up 0.21% and XAG/USD falls by 0.95%.
Volatility is on the rise during the last hour of trading of the year across financial markets. The Dow Jones is falling by 0.76% and the Nasdaq by 1.25%. US stocks are about to have the worst year in more than a decade.
It has been a wild year for gold. It reached levels above $2,000 during the first half of the year and then tumbled until it built a base around $1,615 from where it started a recovery that is still going on.
Gold daily chart
GBP to remain under pressure in 2023 relative to other G10 currencies – ANZ
281028 December 30, 2022 23:33 FXStreet Market News
2022 has been a difficult year for the UK. Economists at ANZ Bank expect the GBP to remain under pressure in 2023 relative to other G10 currencies.
Structural challenges
“In view of weak fundamentals in the UK, we expect the GBP to remain under pressure in 2023 relative to other G10 currencies.”
“The fundamental backdrop for the UK is filled with uncertainty. Over the short term, households will have to deal with elevated inflation, higher taxes and the increased costs of servicing debt. This will dent consumption and dampen the already subdued growth outlook. All of these are GBP negative.”
“The fiscal and political risk premium in the GBP has decreased considerably since Cable touched a low of 1.0350 in September. The GBP is unlikely to test those lows again. Considering the new government and the fiscal plan announcement, our view is that it has established a new floor at 1.15 against the USD.”
Full Article
EUR/USD attacks 1.0690s on risk aversion, ECB’s hawkish comments
281026 December 30, 2022 23:29 FXStreet Market News
- EUR/USD is still rangebound, failing to crack the 1.0700 ahead of the year’s end.
- The Chicago PMI for December exceeded expectations and the previous month’s reading.
- EUR/USD Price Analysis: Upward biased, but failure to conquer 1.0700 would expose the pair to selling pressure.
The EUR/USD advances modestly in the last trading day of 2022, during the North American session, though above its opening price by 0.13%. A light economic calendar keeps the EUR/USD pair within familiar ranges ahead of the week, month, quarter, and year-end. At the time of writing, the EUR/USD is trading at 1.0695.
Wall Street is set to open lower as US equity futures tumble with no fundamental catalyst. The US economic calendar is light, with the release of Chicago’s Purchasing Managers Index for December at 44.9, beating an estimate of 40. Thursday’s release of unemployment claims exerted downward pressure on the US Dollar (USD), weakening against most of the G7 currencies.
The US Dollar Index (DXY), a measure of the buck’s value against a basket of currencies, drops 0.33%, down to 103.634. Even though the greenback is falling, the US 10-year Treasury bond yield is rising five bps, at 3.869%.
Aside from this, the European economic docket revealed that inflation in Spain dropped for the fifth consecutive month, to 5.6% YoY, below November’s 6.7% reading. However, due to thin liquidity trading conditions and 2023 around the corner, it failed to trigger any upside reaction that could break the EUR/USD 1.0600-90 trading range.
Of late, ECB’s Stournaras said that rates should be restricted sufficiently, lifting the pair towards 1.0700, before erasing those gains.
Meanwhile, on geopolitics, Russia and China continue to deepen their ties, as Russian President Vladimir Putin and China’s Xi Jinping videoconference showed intentions for further cooperation between both countries on trade, energy, finance, and agriculture.
Furthermore, Russia’s invasion of Ukraine continued during new year’s eve, as the fourth wave of drones attacked civilian buildings, as reported by Ukrainian authorities. Shelling continued in Kiyv and Kharkiv, killing at least two people.
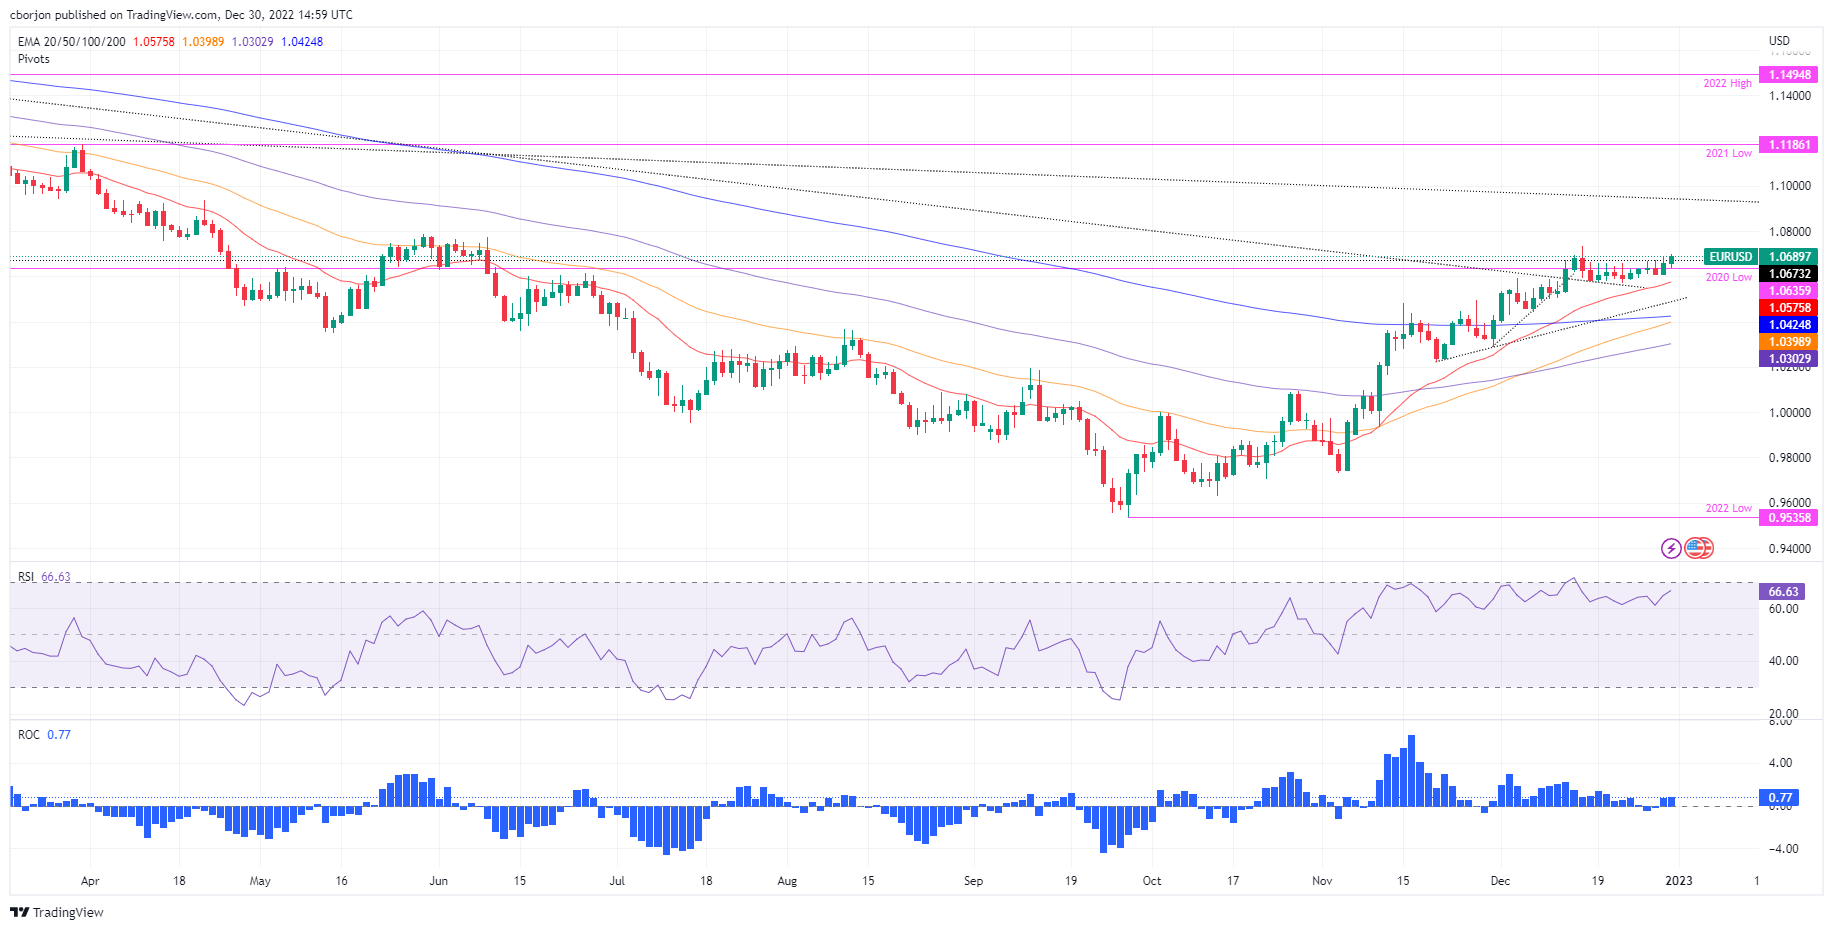
EUR/USD Price Analysis: Technical outlook
From a technical perspective, the EUR/USD is still upward biased. Nevertheless, the inability to decisively crack the 1.0700 mark would expose the pair to selling pressure. Oscillators like the Relative Strength Index (RSI) and the Rate of Change (RoC) favor EUR/USD upside, but low volumes keep traders at bay.
However, the EUR/USD key resistance levels lie at 1.0700, followed by the December 15 daily high of 1.0736 and 1.0800. On the other hand, if the EUR/USD drops below 1.0638, a test of 1.0600 is on the cards, followed by the 20-day Exponential Moving Average (EMA) at 1.0575.
Colombia National Jobless Rate: 8.8% (November) vs previous 9.7%
281025 December 30, 2022 23:29 FXStreet Market News
Information on these pages contains forward-looking statements that involve risks and uncertainties. Markets and instruments profiled on this page are for informational purposes only and should not in any way come across as a recommendation to buy or sell in these assets. You should do your own thorough research before making any investment decisions. FXStreet does not in any way guarantee that this information is free from mistakes, errors, or material misstatements. It also does not guarantee that this information is of a timely nature. Investing in Open Markets involves a great deal of risk, including the loss of all or a portion of your investment, as well as emotional distress. All risks, losses and costs associated with investing, including total loss of principal, are your responsibility. The views and opinions expressed in this article are those of the authors and do not necessarily reflect the official policy or position of FXStreet nor its advertisers. The author will not be held responsible for information that is found at the end of links posted on this page.
If not otherwise explicitly mentioned in the body of the article, at the time of writing, the author has no position in any stock mentioned in this article and no business relationship with any company mentioned. The author has not received compensation for writing this article, other than from FXStreet.
FXStreet and the author do not provide personalized recommendations. The author makes no representations as to the accuracy, completeness, or suitability of this information. FXStreet and the author will not be liable for any errors, omissions or any losses, injuries or damages arising from this information and its display or use. Errors and omissions excepted.
The author and FXStreet are not registered investment advisors and nothing in this article is intended to be investment advice.
SUSHI Price Analysis: Sushiswap tanks with a weaker dollar as bulls clean out their closet
281023 December 30, 2022 23:26 FXStreet Market News
- Sushiswap slides near 2% on the last trading day of 2022.
- SUSHI cannot enjoy the effects of the weaker Dollar which touched 1.0697 (EUR/USD) to the upside.
- Expect to see Sushiswap rip further lower towards $0.85 in a final sell-off of the year.
Sushiswap (SUSHI) is selling off in the last trading hours of this year. While most banks and exchanges will close at regular hours, volumes are thin. The best example is the EUR/USD which popped higher from 1.0640 to nearly 1.0700 in a matter of minutes and normally should be helpful for equities and cryptocurrencies. But it seems that the last straw of the last-minute miracle is a dud.
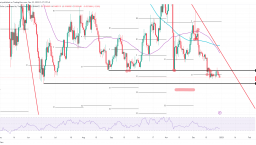
Sushiswap is set to break lower with a 7% decline at hand
Sushiswap (SUSHI) price tanks in very thin trading in these last trading hours of 2022, as most traders come out of markets. While a lot of traders were still betting on a rally in this thin liquidity moment, the opposite effect has got triggered. Bears have seized the moment to run price action into the ground and perform a bull trap on Tuesday with the pop above $0.9938 and value tanking roughly 9% since then.
SUSHI still has some way to go and could see bears eke out a new low for this year if price action drops further toward $0.8567. That means the already 9% decline adds an extra 7% of losses and results in 16% for the week. It was not the worst week for SUSHI in 2022, but it was still enough to push traders out and not see them back again for the first weeks or months of 2023.
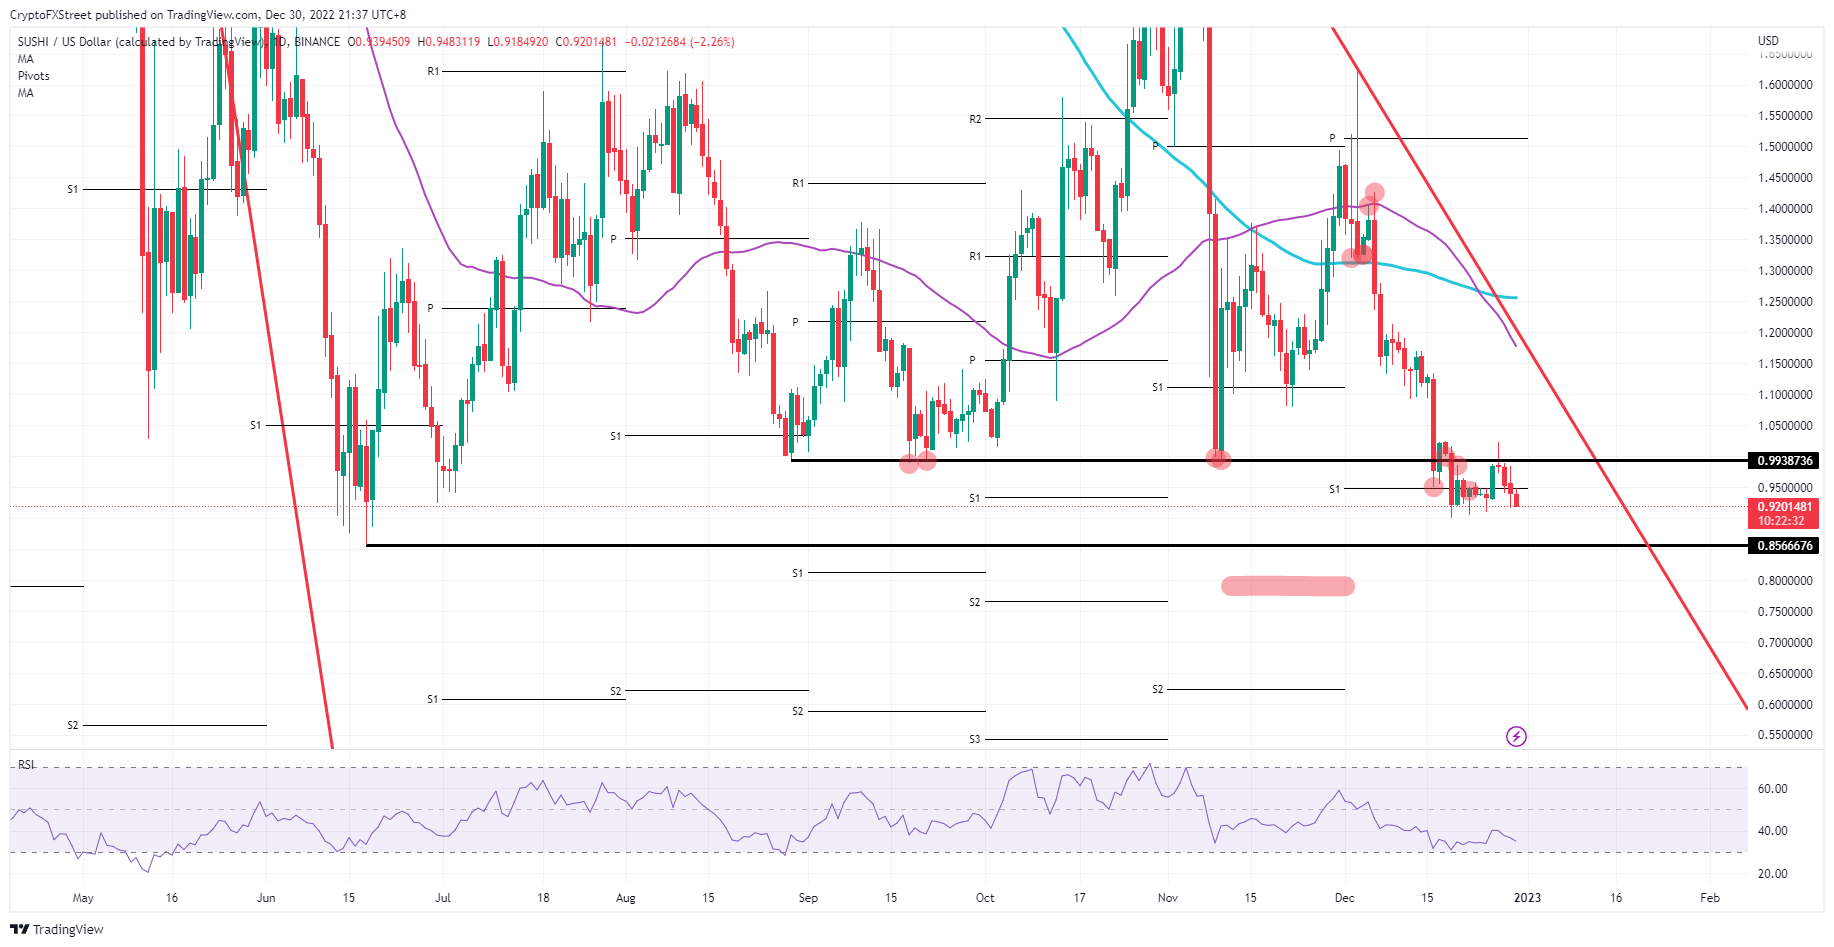
SUSHI/USD daily chart
Looking forward to any rally that could be triggered in the near future would depend on the headline or catalyst that is triggering that mode. Bear in the back of your mind for 2023 that the key pressure from inflation, the Ukrainian war, and recession fears are the three main topics that will determine the outcome for cryptocurrencies, and any positive headline on those three elements could see cryptocurrencies recover. The first level is at $0.9938 before bulls can follow through on their rally, with $1.10 as an ideal candidate for the test against the red descending trend line. Have a good New Year, and see you in 2023!
Full Article
Colombia National Jobless Rate fell from previous 9.7% to 8% in November
281022 December 30, 2022 23:26 FXStreet Market News
Information on these pages contains forward-looking statements that involve risks and uncertainties. Markets and instruments profiled on this page are for informational purposes only and should not in any way come across as a recommendation to buy or sell in these assets. You should do your own thorough research before making any investment decisions. FXStreet does not in any way guarantee that this information is free from mistakes, errors, or material misstatements. It also does not guarantee that this information is of a timely nature. Investing in Open Markets involves a great deal of risk, including the loss of all or a portion of your investment, as well as emotional distress. All risks, losses and costs associated with investing, including total loss of principal, are your responsibility. The views and opinions expressed in this article are those of the authors and do not necessarily reflect the official policy or position of FXStreet nor its advertisers. The author will not be held responsible for information that is found at the end of links posted on this page.
If not otherwise explicitly mentioned in the body of the article, at the time of writing, the author has no position in any stock mentioned in this article and no business relationship with any company mentioned. The author has not received compensation for writing this article, other than from FXStreet.
FXStreet and the author do not provide personalized recommendations. The author makes no representations as to the accuracy, completeness, or suitability of this information. FXStreet and the author will not be liable for any errors, omissions or any losses, injuries or damages arising from this information and its display or use. Errors and omissions excepted.
The author and FXStreet are not registered investment advisors and nothing in this article is intended to be investment advice.