Articles

US indices open with gains as they month/quarter comes to an end
302695 March 31, 2023 21:35 Forexlive Latest News Market News
US indices open with the gains as the month/quarter comes to an end. The S&P and NASDAQ are both on pace for the fifth positive week in six. The major indices of report three consecutive days. The NASDAQ index is looking to end the quarter with a gain of 15% (the largest increase since the 3Q of 2020).
A snapshot of the market currently shows:
- Dow industrial average of 163 points or 0.50% at 33022
- S&P up 15.08 points or 0.37% at 4065.90
- NASDAQ index of 33 points or 0.28% at 12046.90
- Russell 2000 up 12 points or 0.68% at 1780.50
Weekly Recap: Gary Gensler toughens stance on crypto, ZK coins rally, whales slow down BTC price rally
302694 March 31, 2023 21:35 FXStreet Market News
- Gary Gensler, chair of the US Securities and Exchange Commission hinted at tough times for the crypto industry.
- Zero knowledge narrative gained relevance with altcoin price rallies and Bitcoin’s recent pullback.
- Whales are taking profits in Bitcoin, slowing down the asset’s price rally.
US financial regulators toughened their stance on cryptocurrency exchanges and assets. Despite the regulatory crackdown, Layer 2 coins, Zero Knowledge (zk) coins witnessed price rallies.
Bitcoin’s price rally slowed down as large wallet investors engaged in profit taking.
Also read: Ethereum price gears up for rally ahead of ETH token unlock and “re-staking” narrative
US SEC crackdown on crypto intensifies
US SEC chair Gary Gensler intensified regulatory crackdown on virtual assets. In his testimony before the House Appropriations Subcommittee on Financial Service and General Government, Gensler called for new tools and expertise to tackle the misconduct in the crypto industry.
Gensler describes crypto as “the Wild West,” implying that it is rife with noncompliance and investors’ capital is at risk in the asset class. The US SEC received over 35,000 tips and complaints in FY 2022 and booked over 750 enforcement actions, despite limited resources.
Regulatory crackdown has intensified the pressure on cryptocurrencies and dampened sentiment among digital asset holders.
Read more: SEC Chair Gary Gensler’s latest call signals tough times ahead for crypto players
ZK coins narrative is heating up, key projects to watch out
Following the successful completion of Arbitrum’s ARB airdrop, Ethereum Layer 2 and ZK coins narrative garnered attention in the crypto community. Several projects like MATIC and IMX yielded gains for holders, while market participants were on the lookout for airdrops to farm.
Read more: Hottest ZK ecosystem coins and upcoming airdrops: ScrollZKP, LayerZero, Shardeum
Bitcoin price rally slowed down with whales engaging in profit taking
Bitcoin price climbed back above the $28,000 level before its recent pullback. According to on-chain metrics, there was a significant shift in whale activity with large wallet investors engaging in profit-taking and shedding their BTC holdings.
This is one of the key factors that likely slowed down the BTC price rally and paved the way for the alt season narrative to make a comeback in the crypto community.
Read more: Are whales slowing down the Bitcoin price rally: 73% of all BTC is profitable
Full Article
US equities set for moderate gains at the open
302693 March 31, 2023 21:26 Forexlive Latest News Market News
It’s been a great week for stocks and that’s tentatively set to continue to day with S&P 500 futures up 14 points, or 0.36%, just ahead of the open.
It’s the final day of Q1 today and it’s been a sparkling three-month run for technology and chipmakers in particular. There’s increasing talk that October was the low of the bear market.
USD/JPY retreats further from two-week high, slides below 133.00 post-US PCE Price Index
302692 March 31, 2023 21:26 FXStreet Market News
- USD/JPY retreats from a two-week high, though lacks follow-through selling.
- The USD pares intraday gains on softer inflation data and acts as a headwind.
- The risk-on environment undermines the safe-haven JPY and to lends support.
The USD/JPY pair surrenders a major part of its intraday gains to a two-week high and retreats below the 133.00 round-figure mark during the early North American session on Friday.
The modest intraday US Dollar (USD) uptick loses steam after the US Bureau of Economic Analysis reported that the Personal Consumption Expenditures (PCE) Price Index decelerated to a 5% YoY rate in February from 5.3% previous. Adding to this, the Core PCE Price Index – the Fed’s preferred inflation gauge – unexpectedly edged lower to a 4.6% YoY rate from 4.7% in January. The data adds to the uncertainty about the Fed’s rate-hike path, which acts as a headwind for the Greenback and prompts some intraday selling around the USD/JPY pair.
Bearish traders further took cues from a modest pullback in the US Treasury bond yields, which results in the narrowing of the US-Japan rate differential and benefits the Japanese Yen (JPY). That said, the underlying bullish tone around the global equity markets – amid easing fears of a full-blown banking crisis – continues to undermine the safe-haven JPY and remains supportive of a mildly positive tone around the USD/JPY pair. This, in turn, warrants caution for bearish traders and before positioning for any meaningful corrective pullback.
Friday’s US economic docket also features the release of the Chicago PMI and revised Michigan Consumer Sentiment Index, though might do little to provide any meaningful impetus. Nevertheless, the USD/JPY pair still seems poised to register weekly gains for the first time in the previous five and remains at the mercy of the USD price dynamics heading into the weekend.
Technical levels to watch
Full Article
Canada: Real GDP expands by 0.5% in January vs. 0.3% expected
302691 March 31, 2023 21:26 FXStreet Market News
- Canadian economy grew at a stronger pace than expected in January.
- USD/CAD clings to small daily gains slightly below 1.3550.
The real Gross Domestic Product (GDP) of Canada grew by 0.5% on a monthly basis in January, Statistics Canada reported on Friday. This reading followed December’s contraction of 0.1% and came in better than the market expectation for an expansion of 0.3%.
“Advance information indicates that real GDP increased 0.3% in February,” Statistics Canada further noted in its press release. “Increases in the mining, quarrying, and oil and gas extraction, manufacturing, and finance and insurance sectors were slightly offset by decreases in construction, wholesale trade, and accommodation and food services.”
Market reaction
USD/CAD retreated from daily highs after this data and was last seen rising 0.17% on the day at 1.3543.
Full Article
USD/CHF to end the year lower at 0.90 – ANZ
302690 March 31, 2023 21:21 FXStreet Market News
Economists at ANZ Bank expect the Swiss Franc to recover and forecast the USD/CHF pair at 0.90 by the end of the year.
Potential to recover after the dust settles
“While the Swiss Franc has struggled in recent weeks, sound domestic fundamentals and a hawkish, activist central bank affords the currency the potential to recover after the dust settles.”
“We see the USD/CHF pair moving to 0.90 by the end of 2023.”
See: Franc is a “safe haven,” but not a perfect one – Commerzbank
Full Article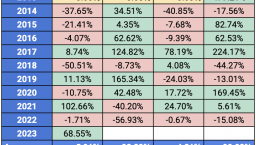
Bitcoin Weekly Forecast: Breaking down key BTC levels to accumulate for Q2, 2023
302685 March 31, 2023 21:21 FXStreet Market News
- Bitcoin price looks bullish on the weekly and monthly timeframes, suggesting that a continuation of the bull trend is likely.
- Key levels to the upside include $35,000 and $38,500.
- Invalidation of the bullish thesis will occur on the flip of the $20,200 level.
Bitcoin price shows an interesting outlook as the first quarter of 2023 comes to an end. BTC has shown strength since day one of 2023 and has netted investors approximately 70% in returns. This article will break down key support levels and hurdles for the second quarter of 2023.
Read more: Top 3 Price Prediction Bitcoin, Ethereum, Ripple: Altcoins flourish as BTC remains rangebound
Bitcoin price and historical returns
Before jumping into Bitcoin price, let us take a look at the historical quarterly returns for BTC. The quarterly return for the pioneer crypto is hovering around 68%, which makes it the 2nd biggest performance since 2021.
General observation shows that if the quarter one (Q1) returns are negligible, Bitcoin price shows enthusiasm and rallies in the next quarter. However, a greater than 20% return in Q1 is generally followed by a retracement or pullback in the next quarter.
Therefore, investors need to be cautious of a potential correction.
When looking at data that extends back to 2014, readers can observe that although the average return of BTC in Q1 2023 is 5.91%, quarter two has an average return of 32%. Clearly, there is a change in the narrative this year owing to the worsening macroeconomic conditions and multiple bank runs.
If ex-Coinbase CTO’s prediction about hyperbitcoinization comes to life, then Bitcoin price could spike higher.

BTC quarterly returns
Key BTC levels on the monthly
Bitcoin price on the monthly timeframe shows that it has produced a higher high relative to August’s swing high at $25,205. This shift in market structure suggests that the ongoing uptrend is likely to continue, albeit after a minor retracement.
The Relative Strength Index (RSI) is currently below the 50-line, attempting to move higher. If the bullish momentum continues, allowing RSI to flip the midpoint, it could signal a continuation of the run-up.
Further supporting this optimistic outlook is the Awesome Oscillator (AO), which shows a steady decline in the bearish momentum as two consecutive months close with a spec of bullish momentum.
A flip of the RSI above the 50-line, if accompanied by AO moving above the zero line, would be a buy signal. The last time this similar structure formed was in 2019, after which Bitcoin price rallied 233% from $4,124 to $13,764 to setup a local top.
So if history repeats, the key levels to the upside include
- The accumulation level is roughly $24,700.
- Targets or take profit levels include $35,000 and $38,500

BTC/USD 1-month chart
Bitcoin price’s 3-day chart reveals how bears can takeover
The three-day chart for Bitcoin price shows a potential bearish breaker formation in early March. This setup occurs when the underlying asset produces a higher high but fails to sustain the uptrend. Instead, the correction slices below the down candlestick formed between the two higher highs.
This down candlestick is known as a bearish breaker, a decisive close below it at roughly $20,200 will trap the bulls and is likely to trigger a tremendous spike in selling pressure on the next retest from below.
As seen in the chart below, a bearish breaker was formed in August. A retest of this breaker after a breakdown below it triggered an unusual spike in selling pressure.
Coming back to the current outlook, BTC is still 25% away from retesting the upper limit of the bearish breaker. As mentioned above, only a decisive flip of the $20,200 level will confirm the existence of a bearish breaker.
A failure to close below the aforementioned level will indicate that the buyers are in control and could serve as a bouncing pad for the next leg-up.
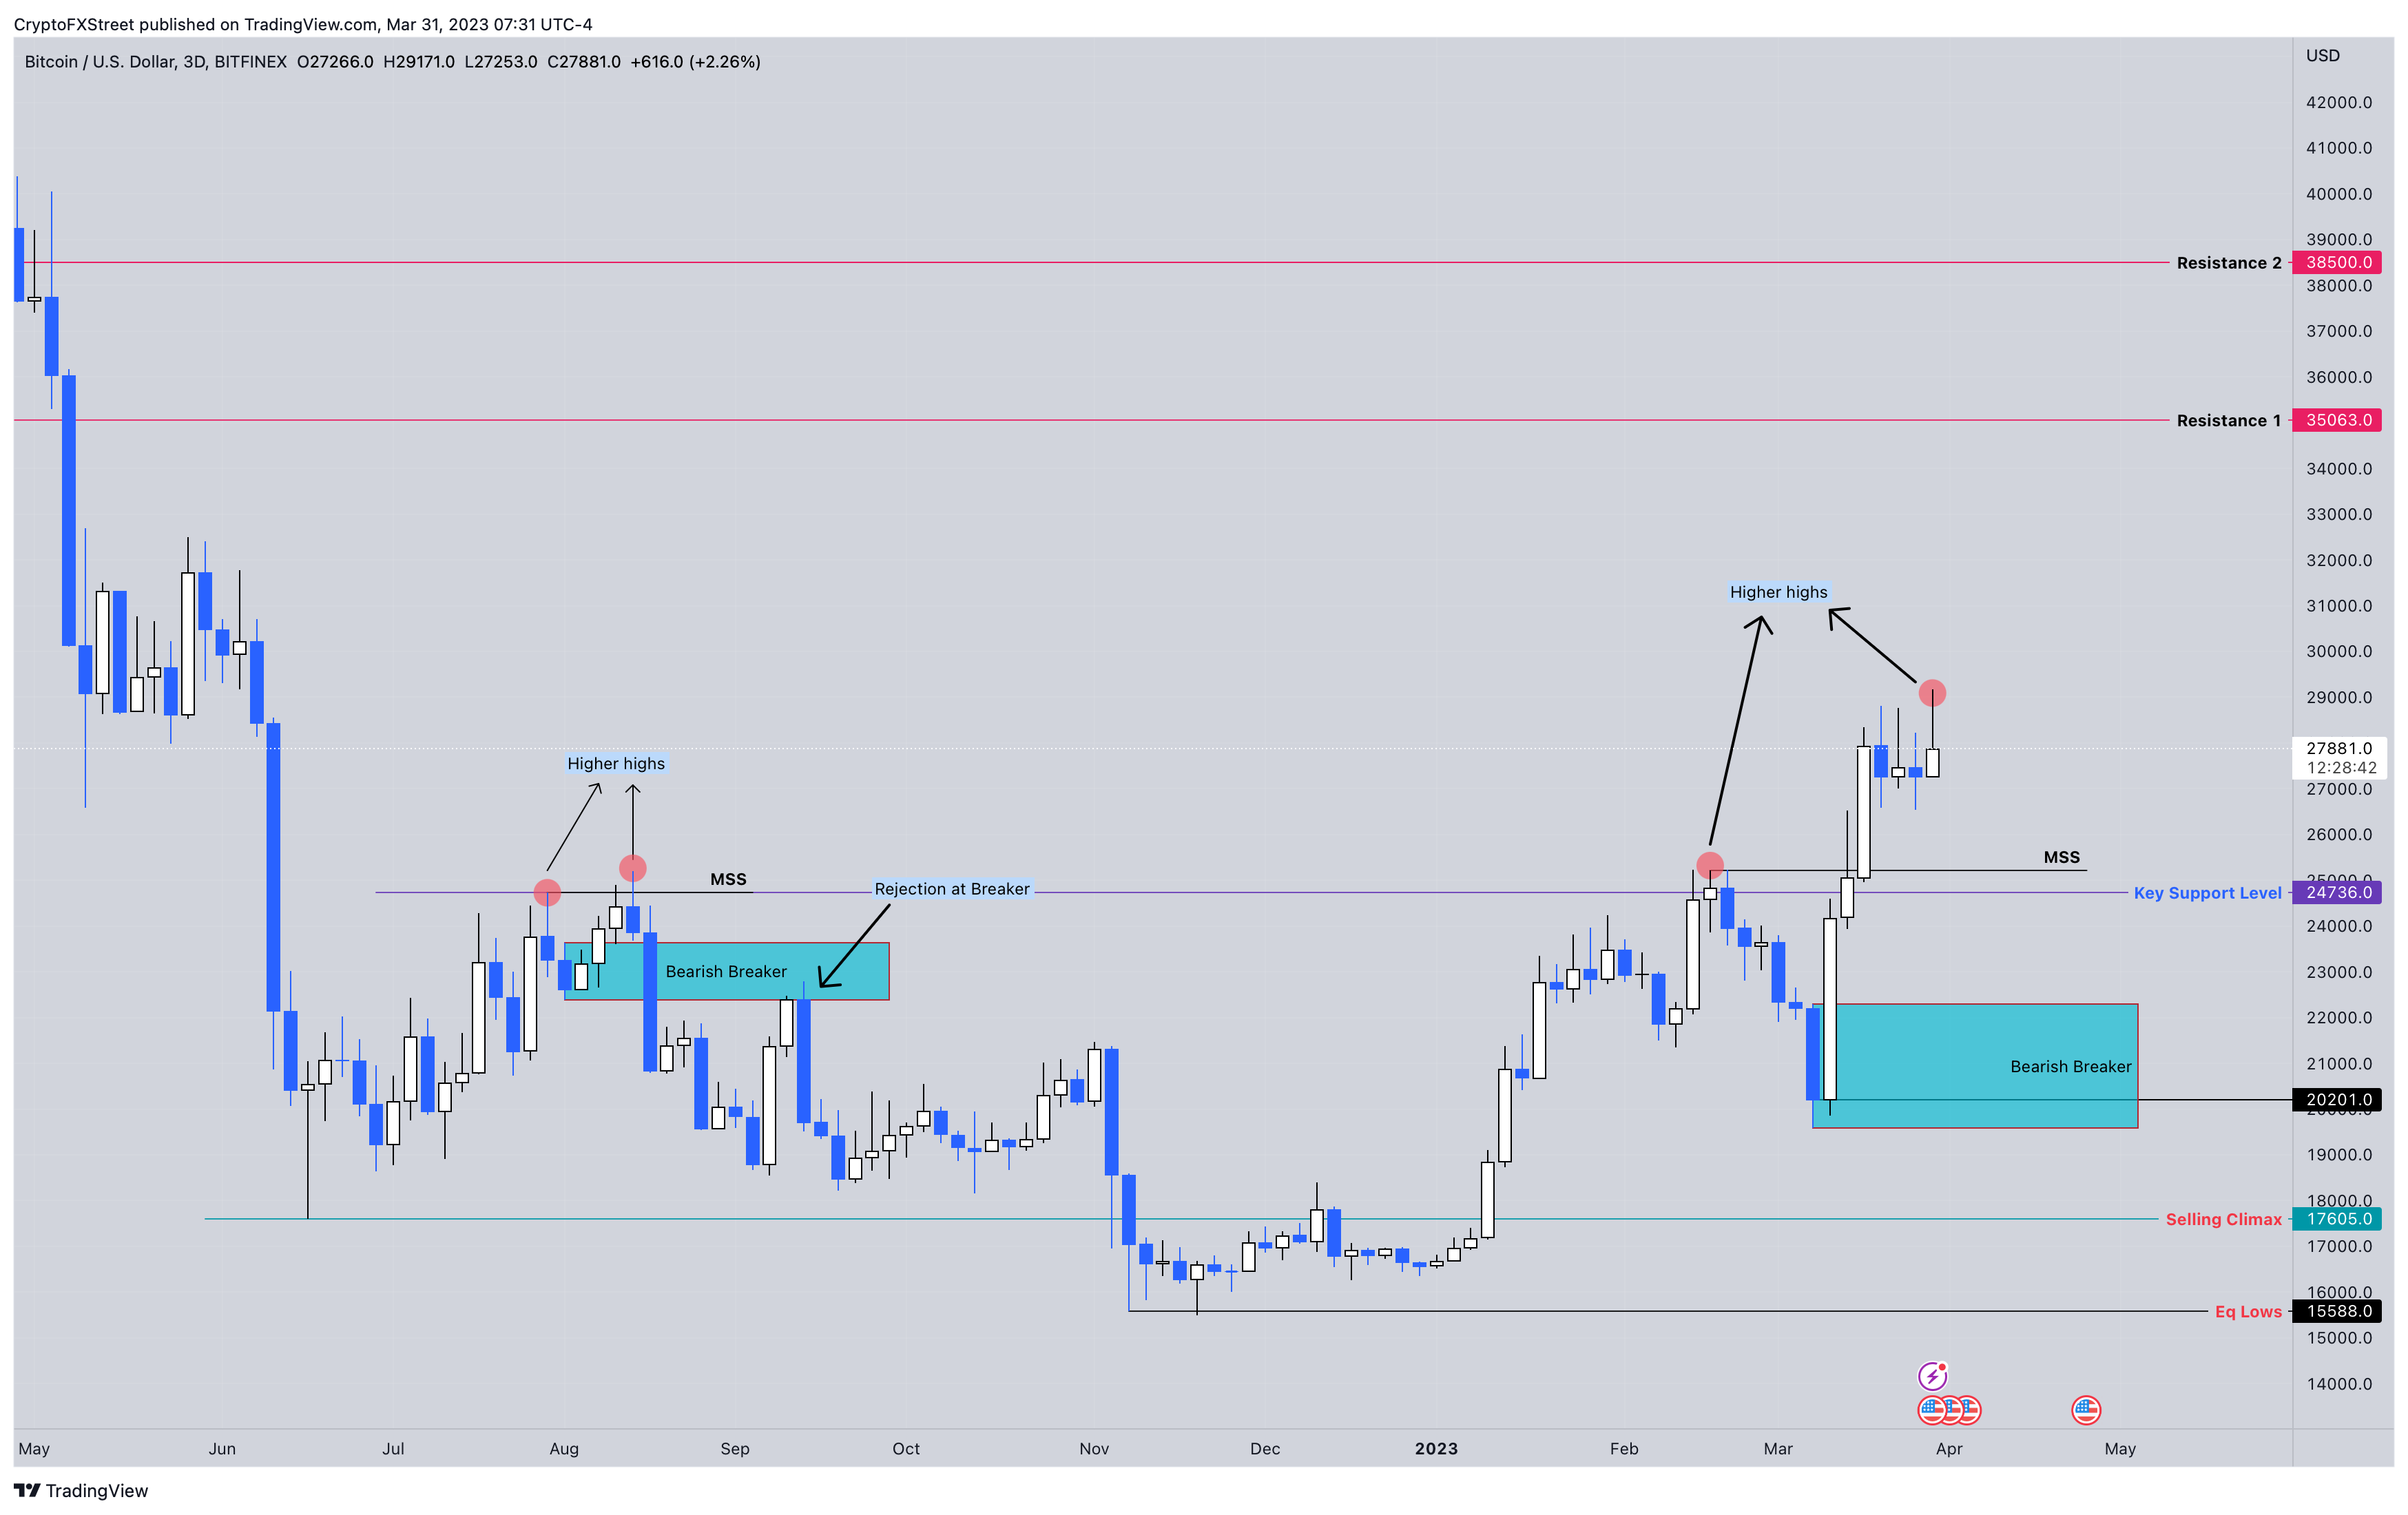
BTC/USD 3-day chart
BTC bears in luck on lower timeframe
The four-hour chart for Bitcoin price also confirms a bearish breaker formation. A retest of the breaker has triggered a rejection that could plummet BTC down to collect the sell-side liquidity at $26,547.
In some cases, the downtrend could exacerbate and tag $24,736, the key support level shown on the monthly chart.
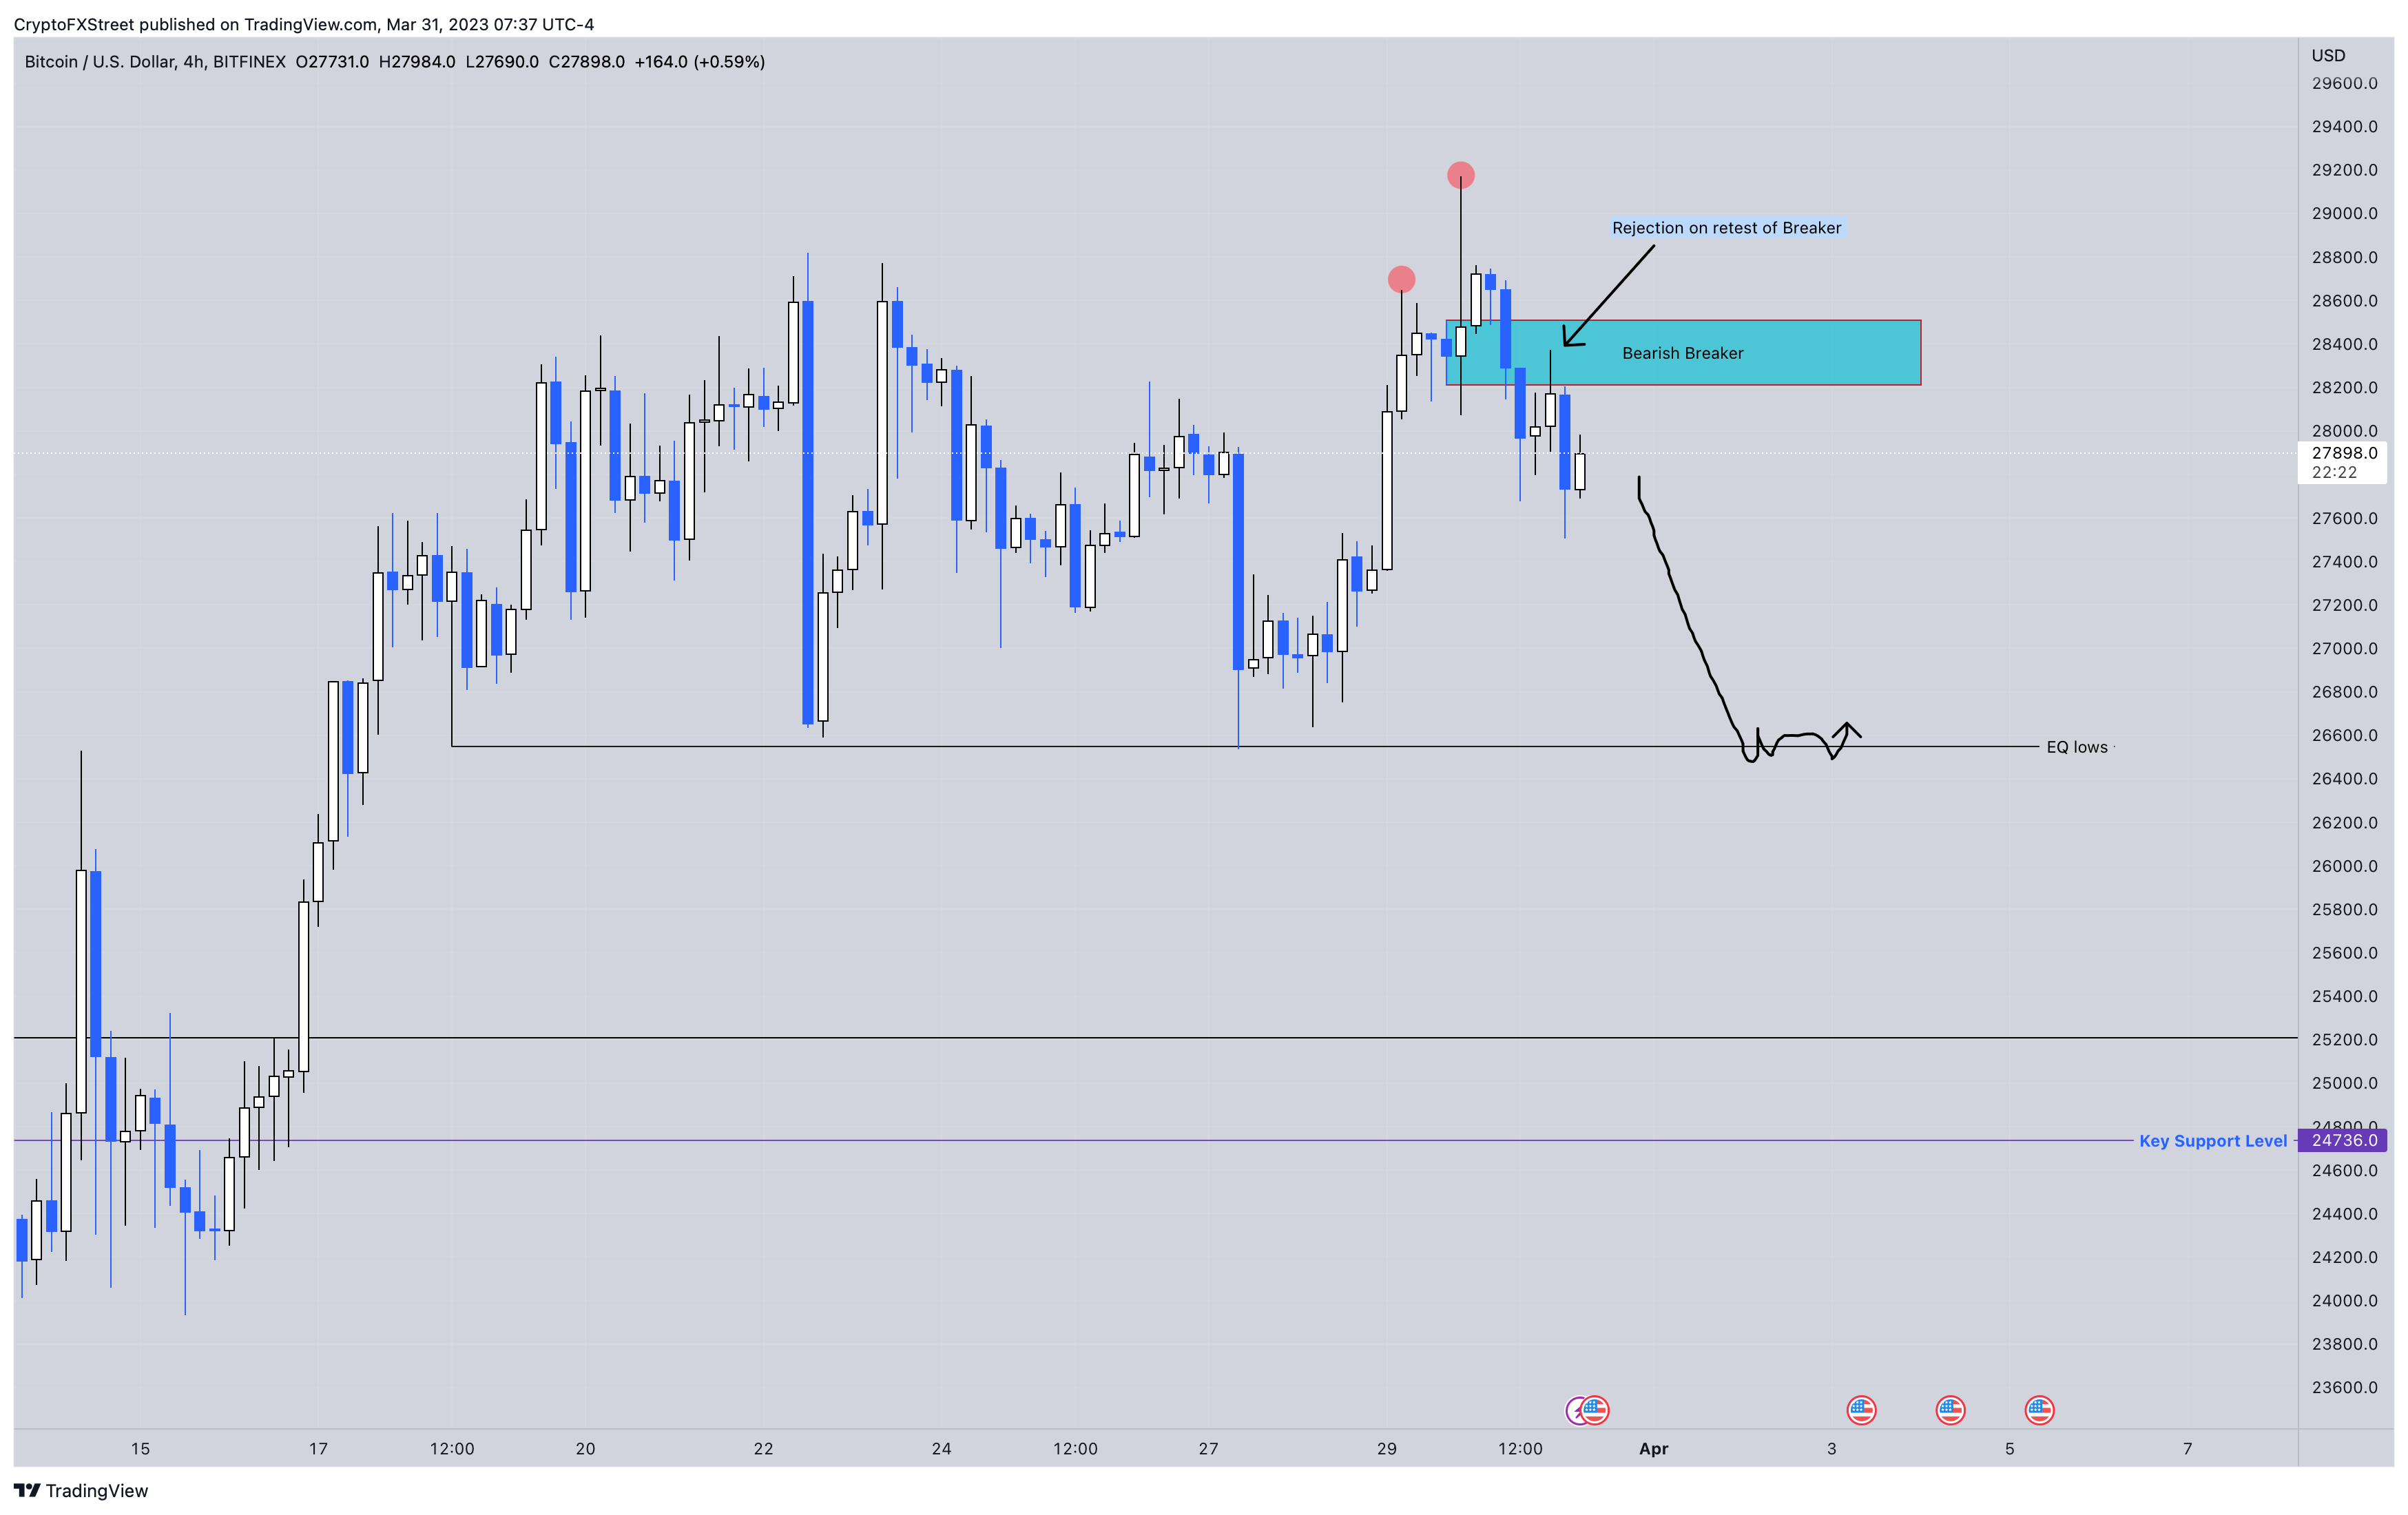
BTC/USD 4-hour chart
To reiterate, Bitcoin price shows a bullish outlook on the monthly and weekly timeframes, but there will be an opportunity for bears to profit off of a small-time pullback to key high timeframe (HTF) levels.
Invalidation of the long-term bullish outlook will occur if Bitcoin price slides below the $20,200 level and decisively flips it into a resistance level. Such a move could trigger the HTF bearish breaker to come alive. In such a case, investors should pay attention to the $17,605 support level, which is where the sellers climaxed after a 44% crash in June 2022.
A breakdown of this level could send BTC spiraling down to collect the liquidity resting below the $15,588 equal lows. In an extremely bearish case, Bitcoin price could tag the $10,809 support level. This move would denote an 84% drawdown from BTC’s all-time high of $68,958 and would potentially signal a bottom for the ongoing bear market.
Full Article
EUR/USD rises toward 1.0900 after US Core PCE
302684 March 31, 2023 21:17 FXStreet Market News
- US February Core PCE inflation comes in at 4.6%, below 4.7% expected.
- US yields hits fresh daily lows, US Dollar weakens.
- EUR/USD erases most of it day’s losses after numbers.
The EUR/USD rose from 1.0866 to 1.0895 following the release of US Core Consumer inflation that came in slightly below expectations. The figures weighed on the US Dollar that lost ground across the board.
The Core Personal Consumption Expenditures Price Index rose 0.3% in February, less than the 0.4% of market consensus to an annual rate of 4.6%, below the 4.7% of January. The PCE Price Index rose 0.3% in February and 5% YoY. The same report showed that Personal income grew by 0.3%, above the 0.2% expected while Personal Spending rose by 0.5%, surpassing consensus of 0.3%
The numbers showed consumer inflation in the US falling slowly. The February core CPE matched the lowest reading in 15 months. Those numbers could be welcome by the Fed, but still shows inflation remains elevated. The Chicago PMI and University of Michigan’s Consumer Confidence will be released later on Friday.
In the Eurozone, the Harmonised CPI came in softer at 6.9% YoY in March, down from 8.5%, below expectations of a drop to 7.1%. The Core CPI steadied at 5.7% YoY.
The US Dollar fell moderately across the board after the report as US yields sank. The 10-year Treasury yield fell from 3.54% to 3.51%, the lowest since Tuesday. The DXY is still up for the day, but it moved off highs.
The EUR/USD moved to the upside, approaching 1.0900. Still it remains below that relevant area. Earlier it peaked at 1.0925, before turning to the downside. It bottomed at 1.0863. On a weekly basis, the pair is heading toward the highest close in a year.
In the short term, the pair is moving with a bullish bias but is being unable to break the 1.0925/30 resistance and shows difficulties holding above 1.0900. Downward correction could find support at 1.0855/60 and 1.0820.
Technical levels
Full Article
Fed’s Collins: Need to balance risk that we don’t do enough on inflation vs doing too much
302683 March 31, 2023 21:17 FXStreet Market News
In an interview with Bloomberg TV on Friday, Federal Reserve Bank of Boston President Susan Collins said that they are likely to see at least some impact of banking stress on credit conditions, via Reuters.
Additional takeaways
“We need to balance risk that we don’t do enough on inflation vs doing too much.”
“Banking stress is certainly a factor.”
“There’s a pathway to bringing inflation down without a significant downturn.”
There were mistakes made on Silicon Valley Bank by the Fed.”
“It will still be some time but over coming quarters we should see other sectors responding to tighter monetary policy.”
Market reaction
These comments failed to trigger a reaction and the US Dollar Index was last seen gaining 0.15% on a daily basis at 102.32.
Full Article
USD/MXN to head gradually higher toward 18.70 in Q2 – TDS
302682 March 31, 2023 21:12 FXStreet Market News
Banxico delivered a 25 bps hike, in line with the forward guidance it offered in February. The MXN reacted with a 0.4% depreciation towards 18.12 immediately after the announcement. The decision is in line with TD Securities’ expectation of a weaker MXN in the three-month horizon.
Banxico delivered what was promised
“Banxico hiked the policy rate in 25 bps, in line with our expectation and its forward guidance offered in early February. Despite lack of explicit acknowledgment by the central bank, we think the central bank has reached terminal at 11.25%.”
“Looking forward, the combination of Banxico stopping its hiking cycle and a repricing of idiosyncratic factors is behind our USD/MXN expectation of gradual weakening towards 18.70 in Q2.”
Full Article
Gold Price Forecast: XAU/USD rises after lower-than-expected US inflation data
302679 March 31, 2023 21:12 FXStreet Market News
- Gold price catches a bid after the release of lower-than-forecast US Personal Consumption Expenditure price data.
- XAU/USD pulls back after Federal Reserve officials say more work needs to be done to bring down inflation.
- Never mind deposits, what about bank’s assets? Questions economist who sees crisis reviving and Gold exceeding $2,000.
- Gold may be forming a triangle in an uptrend. If ‘the trend is your friend’, bulls may be right.
Gold price (XAU/USD) extends early gains on Friday, exchanging hands in the $1,980s at time of writing, after the release of lower-than-expected Core Personal Consumption Expenditure – Price Index (PCE) data from the US, weighed on interest rate expectations.
Inflation eases in March, could Fed pause?
The preliminary PCE price index data shows a slight decline to 4.6% YoY in February when 4.7% had been expected, the same as January. On a monthly basis inflation rose 0.3% versus 0.4% forecast from 0.5% previously. The response has been for US Treasury yields to pull back, the US Dollar to edge down, and Gold price to rise.
The lower-than-expected result raises the chances the Fed will do nothing at its May meeting and perhaps even that rates may have peaked and the Fed may actually cut later in the year. Lower interest rates favor Gold because they reduce the opportunity cost of holding the precious metal vis-a-vis cash or cash equivalents.
A gift to Gold bulls from lower-than-expected US data
The PCE data follows the trend of macroeconomic data out on Thursday which was overall poorer than expected. Initial Jobless Claims showed an unexpected rise in the number of out-of-work people claiming unemployment support in the US from 191K to 198K – higher than the 196K forecast by economists. US Gross Domestic Product (GDP) for the fourth quarter also moderated down to 2.6% from 2.7% in Q3, when 2.7% had been forecast.
Friday’s reaction to the data is similar to the overall reaction to the data on Thursday when the US Dollar also sold-off and US Treasury yields pulled back, reflecting investors’ view that the probabilities had slightly decreased for the US Federal Reserve to raise interest rates at their May meeting.
Gold price rose as the US Dollar weakened and the outlook for interest rates declined. Gold generally rises as interest rates – which the Fed sets – decline, since they lower the opportunity cost of holding the bright metal vis-a-vis staying in cash or cash equivalents.
Fed members talk up possibility of future hikes
Despite lacklustre US data seemingly painting more subdued picture of the US economy that suggests rates won’t rise, comments from Fed members seem to signal the opposite. Over the last 24-hours no less than three members of the Federal Reserve Open Market Committee (FOMC) – two of them voting members – have come out at said they think more should be done to combat persistent inflation.
“Inflation remains too high, and recent indicators reinforce my view that there is more work to do to bring inflation down to the 2% target associated with price stability,” Federal Reserve Bank of Boston leader Susan Collins said in remarks to a gathering of the National Association for Business Economics. It should be noted that Collins is not a voting member of the FOMC.
Next, Neel Kashkari, head of the Minneapolis Fed said the institution has “more work to do,” but he did not state what form that would take. Kashakari does have a vote on the FOMC.
Finally, Federal Reserve of Richmond President Tom Barkin said in a speech to the Virginia council of CEOs on Thursday that, “If inflation persists, we can react by raising rates further. It was only a few weeks ago that some were calling for a 50-basis-point increase.”
At the time of writing, the Fed Funds Future Curve, a highly considered market gauge of future Fed policy moves was showing an increased 58% chance of a 0.25% hike in May versus a 42% probability of no-change.
This shows a substantial shift from the reading a days ago, when the same indicator was showing ther chances of a Fed hike at only 44%.
Some analysts still expect the Fed to raise rates by more than just one 0.25% hike, before it ends its tightening cycle. Analysts at ANZ Bank, for example, forecast the Gold price to remain capped at current levels as the Fed will continue raising interest rates, possibly to 5.5% (from a current 5.0% level).
“Further upside in the Gold price looks limited in the short term, as we see the federal fund rate at 5.5%,” says the bank.
“Gold is well supported by US recession fears, easing inflationary pressure and more dovish monetary policy. Nevertheless, the upside looks limited in the near term amid easing banking risks and further Fed rate hikes,” adds ANZ.
Yet the Australian lender also sees more upside as possible on further banking risks, which would increase safe-haven flows to the yellow metal.
Gold to rise as banking crisis not over, says esteemed economist
The banking crisis is far from over and when it reignites the price of Gold will rise above $2,000 an ounce as people grope for safety, according to distinguished economist, David Rosenberg, the founder of Rosenberg Research.
So far the analysis of the banking crisis has focused on deposit risk but people are ignoring equally disturbing risks from the assets banks hold, argues Rosenberg in an interview with Kitco.com
“Everybody’s focused on deposit insurance, concentrated uninsured deposits on the liability side of the balance sheet. But you know, the other part of the story is going to be what do the assets look like?” The economist said.
The availability of credit is shrinking, inflation remains high and the US is on the brink of recession. When people tighten their belts the risk of rising default rates on many of the loans held by regional banks could push a fresh tranche of lenders over the edge.
“Nobody talks about the quality of the assets – these traditional loans, especially as they pertain to commercial real estate business loans, credit cards and auto loans. A lot of these loans are held at the regional bank level,” said Rosenberg.
Gold price technicals: Triangle forming in an uptrend
Gold price continues its steady rise within a probable symmetrical triangle formation most clearly delineated on the 4-hour timeframe chart. XAU/USD is probably completing the fourth leg of the triangle as it rises up to the upper borderline at circa $1,992. It is possible it will continue higher and reach the level of the borderline in time. According to Elliot Wave theory most triangles are composed of five waves so this one is probably unfinished but not by much. It is possible it will reverse at resistance from the borderline in the $1,990s and start declining to the lower borderline at about $1,958 in a fifth wave. From there is may break out.
Given the prior trend before its formation was bullish the odds favor an upside breakout. The breakout will probably be the same length as the triangle at its widest part. This suggests a target of about $2,050 if the breakout is higher, and $1,890 if lower.
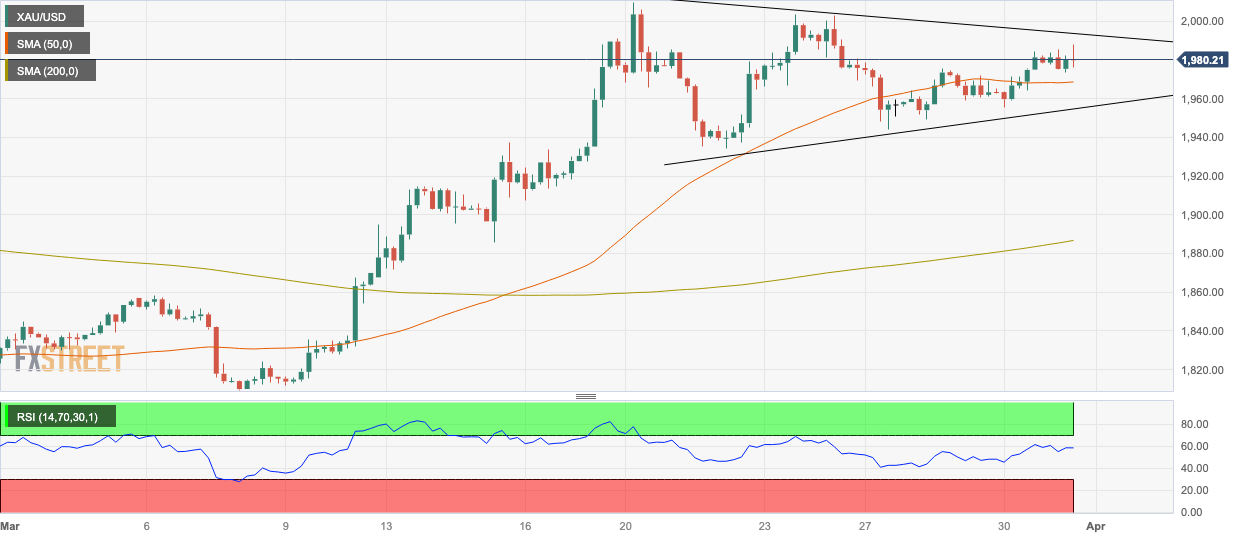
Gold price: 4-hour Chart
Looked at from a broader perspective Gold price continues to make higher highs and lows on the daily chart and the current symmetrical triangle pattern is more probably a continuation pattern than reversal. According to the market maxim, “The trend is your friend until the bend at the end,” the technical outlook thus favors bulls.
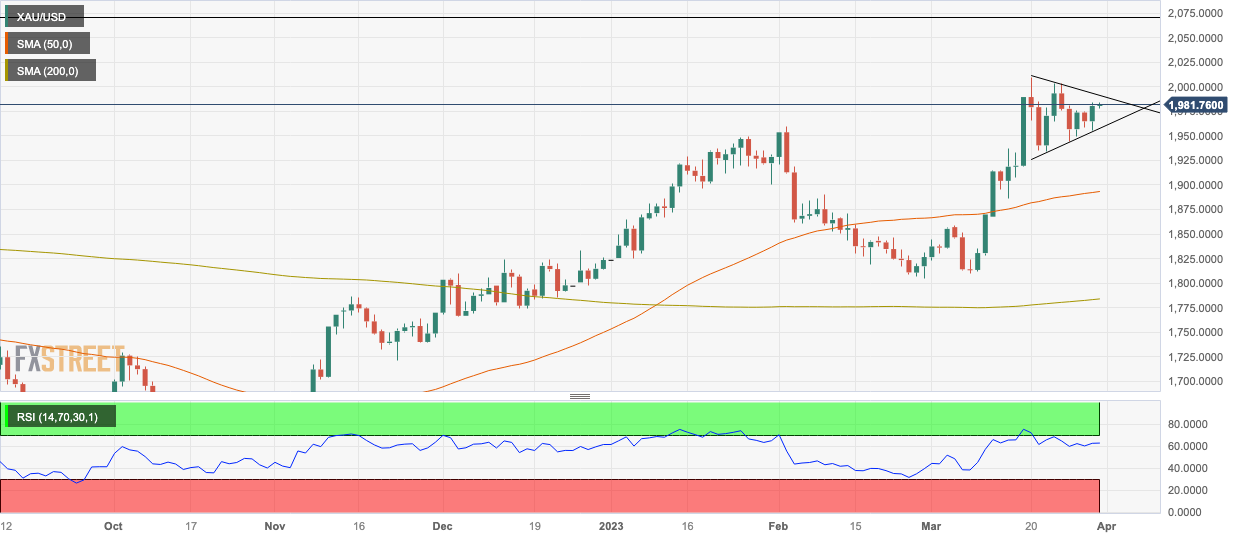
Gold price: Daily Chart
A break above the key $2,009 March top would provide confirmation of further upside. The next target for Gold price would then lie at the $2,070 March 2022 highs.
The key $1,934 March 22 swing low must hold for Gold bulls to retain the advantage. Yet, a break and close on a daily basis below that level would introduce doubt into the overall bullish assessment of the trend. Such a move would probably see a sharp decline to support at $1,990 supplied by the 50-day Simple Moving Average (SMA).
Full Article
Brazil Unemployment Rate registered at 8.6%, below expectations (8.7%) in February
302678 March 31, 2023 21:02 FXStreet Market News
Information on these pages contains forward-looking statements that involve risks and uncertainties. Markets and instruments profiled on this page are for informational purposes only and should not in any way come across as a recommendation to buy or sell in these assets. You should do your own thorough research before making any investment decisions. FXStreet does not in any way guarantee that this information is free from mistakes, errors, or material misstatements. It also does not guarantee that this information is of a timely nature. Investing in Open Markets involves a great deal of risk, including the loss of all or a portion of your investment, as well as emotional distress. All risks, losses and costs associated with investing, including total loss of principal, are your responsibility. The views and opinions expressed in this article are those of the authors and do not necessarily reflect the official policy or position of FXStreet nor its advertisers. The author will not be held responsible for information that is found at the end of links posted on this page.
If not otherwise explicitly mentioned in the body of the article, at the time of writing, the author has no position in any stock mentioned in this article and no business relationship with any company mentioned. The author has not received compensation for writing this article, other than from FXStreet.
FXStreet and the author do not provide personalized recommendations. The author makes no representations as to the accuracy, completeness, or suitability of this information. FXStreet and the author will not be liable for any errors, omissions or any losses, injuries or damages arising from this information and its display or use. Errors and omissions excepted.
The author and FXStreet are not registered investment advisors and nothing in this article is intended to be investment advice.
Full Article